Abstract
This study explores how corporate social responsibility (CSR) disclosure contributes to sustainable value creation by enhancing intellectual capital (IC) and investigates the moderating role of institutional ownership (IIOW) in this relationship. Using a panel dataset of 828 firm-year observations from non-financial Saudi companies listed on the Saudi Stock Exchange (Tadawul) between 2016 and 2021, the analysis applies feasible generalized least squares (FGLS) regression to test the proposed relationships. The findings reveal a significant positive association between CSR disclosure and IC, underscoring the strategic importance of CSR in building intangible corporate assets. Moreover, IIOW strengthens this association, suggesting that IIOW plays a critical role in promoting sustainability-oriented practices. Robustness checks using alternative proxies and estimation techniques confirm the validity of the results. This study provides novel empirical evidence from Saudi Arabia, contributing to the CSR and IC literature in emerging markets and offering practical insights for policymakers, investors, and corporate leaders aiming to foster long-term organizational resilience.
1. Introduction
Recently, stakeholders have shown increasing interest in sustainable business practices as they have become a worldwide trend [1]. In today’s competitive global market, intellectual capital (hereafter IC) stands as a pivotal element of business strategy for long-term sustainability [2]. IC, encompassing human capital, structural capital, and customer capital, is a critical determinant of an organization’s competitiveness and value [2]. Further, IC encompasses the intangible assets of an organization, including employee skills, knowledge, and proprietary information, which contribute significantly to gaining a competitive edge [3]. The disclosure of IC information offers critical insights for both internal and external stakeholders, facilitating informed decision-making and contributing to enhanced profitability, customer retention, and overall business performance [4,5].
Corporate social responsibility (CSR) denotes a firm’s proactive commitment to its stakeholders, society, and sustainable development [6]. It encompasses organizational practices that actively address environmental and social issues [7]. The field of CSR has experienced a notable increase in scholarly attention [8]. In emerging markets, these CSR initiatives become even more crucial as they are increasingly recognized as a valuable management strategy. CSR practices offer companies legitimacy [9], enhance their chances of survival and growth, and enhance their strategic positioning among key stakeholders [3]. The authors of [10] indicate that CSR can be regarded as an asset capable of transforming IC into a more valuable organizational resource, particularly when compared to companies with limited involvement in CSR initiatives. The significance of CSR has captured the interest of regulators and business stakeholders globally. However, comprehension levels remain notably low in Arab countries, notably in Saudi Arabia. Thus, there is a need for more evidence from an emerging perspective.
Empirically, limited studies have examined the impact of CSR disclosures on IC in developed countries [3,11,12] and other studies in developing countries [13,14,15,16]. Specifically, the authors of [17] indicate that CSR can be viewed as an asset that can increase the value of IC. The authors of [12] propose a comprehensive perspective in which CSR and IC are viewed as complementary strategic approaches that collectively enhance organizational competitiveness and legitimacy. The authors of [3] find that companies demonstrating superior environmental, social, and governance (ESG) practices exhibit enhanced IC performance. The authors of [11] find that companies that strongly prioritize CSR practices tend to enhance their innovative capabilities through improved IC. Despite the growing attention to CSR practices and IC over the past decade, empirical research on the impact of CSR on IC remains limited, particularly in the Saudi Arabian context.
In addition, earlier studies show that institutional investors (IIs) serve as a crucial mechanism for corporate governance (CG) by mitigating information asymmetry and monitoring the performance of agents [18]. IIs are increasingly focused on social and environmental issues, with IIs playing a significant role in fostering an environment that boosts the effectiveness of CSR initiatives [19,20,21], promoting more efficient allocation of resources, and ensuring thorough management supervision [22,23]. Support from IIs enables companies to more effectively leverage CSR activities in developing IC, aligning with theoretical frameworks that highlight their role in strengthening CG and transparency [4,24,25]. However, numerous studies have explored the direct relationship between institutional investors’ ownership (IIOW) and nonfinancial disclosure [19,23,26,27,28]. The authors of [22] assert that IIs support socially responsible activities as a means of conveying to their contributors that the invested company is reliable and responsible. Further, the authors of [29] indicate that IIs are seeking greater accountability and improved social and environmental management, rather than solely concentrating on maximizing returns for shareholders.
To the best of our knowledge, there is no empirical evidence of the role of IIOW in the CSR-IC nexus. Thus, a more comprehensive exploration of the factors (e.g., IIOW) shaping the link between CSR activities and IC reporting is urgently needed. The focus on the Saudi setting is motivated not only by its being an understudied context but also by its unique characteristics. Saudi Arabia stands out as the fastest-growing economy among the G20 nations [30], recording a real gross domestic product (GDP) growth of 7.5% in 2022, driven by increased oil production and high global oil prices. Moreover, the Saudi capital market presents an ideal setting for this study, given that research on CSR practices and reporting is still in its early stages [8,31].
Accordingly, this study seeks to address the following key research questions: (1) What is the impact of CSR disclosures on IC in the Saudi stock market? (2) Does IIOW moderate the CSR-IC nexus in the Saudi stock market? To investigate these questions, the current research utilizes a dataset of non-financial Saudi firms listed on the Saudi Stock Exchange (Tadawul) for the period from 2016 to 2021, comprising 828 company-year observations. The findings indicate two main points: first, increased CSR disclosures enhance IC by fostering trust, reputation, and stakeholder engagement; second, the study provides empirical evidence supporting IIOW plays a vital part in improving the beneficial impacts of CSR disclosures on IC, as these investors guide strategic choices that align with sustainable and knowledge-focused practices. The findings are corroborated through various robustness tests, including different measurements for IC and CSR, employing alternative regression methods, and accounting for potential endogeneity and self-selection biases.
This study contributes to existing literature in several ways. First, it offers novel empirical evidence on the role of CSR practices in improving IC, offering a deeper understanding of how responsible business practices contribute to the development and utilization of a company’s knowledge assets. Second, it extends the existing research on IC by examining the moderating role of IIOW as a CG mechanism. This analysis sheds light on how institutional investors influence the CSR-IC relationship, potentially shaping corporate strategies and decision-making processes to enhance knowledge creation and innovation. Finally, the study’s insights are particularly relevant for companies operating in emerging markets like Saudi Arabia, where IIs play a significant role in shaping CG and sustainability practices. Given the growing emphasis on ethical business conduct and stakeholder-oriented governance, the findings underscore the need for companies to strengthen IIOW mechanisms as a means to reinforce ethical behavior, improve transparency, and foster long-term value creation. Thus, this research underscores the practical importance of fostering IC and strengthening IIOW mechanisms to promote ethical behavior, sustainability, and stakeholder trust in corporate operations.
The subsequent sections of the paper are arranged as follows. We review relevant literature and hypothesis development in Section 2. Section 3 discusses our study’s data and variable measurement. We offer the main findings and relevant robustness tests in Section 4. Section 5 explains the additional analyses. Finally, Section 6 summarizes and concludes our study.
2. Literature Review
2.1. Theoretical Framework
The literature has introduced several theoretical frameworks that underscore the importance of non-financial disclosures in corporate reporting [11]. These theoretical frameworks underscore the value of openness in addressing CSR and IC, thereby allowing stakeholders to more effectively evaluate a firm’s commitment to sustainable and ethical practices [32]. Stakeholder and institutional theories are among the most commonly employed frameworks for evaluating CSR and IC.
According to stakeholder theory, businesses must address and respond to the expectations of various groups, including investors, employees, suppliers, customers, and the community [33]. These diverse stakeholder expectations need to be managed by companies to ensure their long-term success [34]. IC plays a pivotal role in this context by enabling companies to better understand, prioritize, and respond to stakeholder demands [35]. For example, human capital helps companies recognize emerging social and environmental concerns, while relational capital aids in effective stakeholder communication and engagement [36]. Consequently, firms with higher CSR disclosure are more likely to disclose more IC information to showcase their accountability and foster trust with stakeholders [3]. Thus, stakeholder theory elucidates how CSR enhances an organization’s capacity to fulfill stakeholder expectations through transparent and meaningful IC disclosure.
Institutional theory posits that institutions react to institutional pressures by adopting widely accepted practices to attain legitimacy and enhance their credibility among stakeholders [37,38]. Research grounded in institutional theory has shown that firms implement and sustain specific practices in response to isomorphic pressures exerted by external stakeholders [39]. CG must take into account intellectual and human capital while ensuring, mobilizing, and aligning human resources, culture, innovation, and both external and internal structures to achieve the company’s objectives and values, thereby utilizing financial, physical, and IC to create and enhance value [40]. These theories collectively provide a framework for comprehending how CSR disclosures drive IC, particularly in the context of institutional ownership, which may further reinforce this relationship by aligning firm practices with societal expectations [41]. Thus, this study investigates the link between CSR and IC reporting, using stakeholder and institutional theories to develop study hypotheses.
2.2. Hypotheses Development
2.2.1. CSR and Intellectual Capital
CSR practices have garnered growing interest from diverse stakeholders, encompassing creditors, investors, and researchers [3]. According to the author of [13], a firm’s performance can be considerably improved through CSR initiatives. These activities significantly enhance the efficacy of a firm’s human and relational resources, fostering employee commitment and loyalty, which consequently strengthens the organization’s competitive edge. Additionally, these practices improve the firm’s public image and standing among stakeholders. The stakeholder theory proposes that businesses manage their stakeholder relationships to ensure long-term viability. Firms that adopt proactive strategies and demonstrate robust financial performance are more likely to disclose information about their CSR activities [3].
Despite the abovementioned theoretical arguments, empirical evidence regarding the CSR–IC relationship remains inconsistent. For instance, research by the authors of [17] found that CSR practices positively correlate with IC, demonstrating that investments in CSR improve stakeholder perception and primarily create intangible assets. Additionally, human capital, which encompasses the combined abilities of employees, plays a crucial role in generating both tangible and intangible assets through innovation and knowledge [42]. This, in turn, is crucial for promoting a company’s success and strengthening its competitive edge. When companies report their CSR activities, they demonstrate their commitment to social and environmental responsibility, which can positively shape stakeholders’ views and boost corporate image [43].
The authors of [3] demonstrate that ESG performance positively correlates with IC. The authors of [11] indicate that higher ESG performance is linked to a more positive tone in IC disclosures among European-listed companies from 2011 to 2016. Similarly, in the Chinese context, ESG practices positively correlate with green innovation performance [16]. Expanding on this, the authors of [15] analyze data from 223 Chinese-listed companies between 2015 and 2018 to explore how research and development (R&D) investments and ESG performance affect green innovation outcomes. The authors find that firms with higher ESG ratings are more likely to exhibit superior green innovation performance. The authors of [44] analyze data from 20 nations for the period 2002–2013 to confirm that CSR performance fosters business innovation. However, the authors of [14] examined manufacturing companies in Turkey from 2007 to 2008 and found a non-significant negative correlation between CSR and value-added intellectual coefficient (VAIC).
Despite the potential influence that CSR activities may have on improving IC, this relationship in the Saudi market remains unexplored. Thus, this study will highlight the need to explore this relationship. Based on the stakeholder theory, this research expects that CSR disclosures affect IC in Saudi Arabia. We therefore posit the following research hypothesis:
H1.
CSR disclosures have a positive impact on intellectual capital.
2.2.2. The Moderating Role of IIOW on the CSR-IC Link
Institutional ownership denotes the percentage of a firm’s equity held by institutional investors, including entities such as banks, pension funds, and insurance companies [45]. As major stakeholders wielding significant impact over companies’ commitment to CSR [19], numerous factors account for IIs’ interest in corporate CSR and IC. First, institutional investors are viewed as key figures that businesses must address to gain legitimacy [25]. Consequently, the demands placed on companies by IIs should encourage companies to pay more attention to and report on their CSR [26]. This is because IIs prioritize increased transparency and enhanced social and environmental practices, rather than solely focusing on maximizing shareholder profits [29]. Second, key IIs serve as proactive supervisors and resource allocators, boosting companies’ ESG performance [27]. They achieve this by enhancing the quality of internal corporate controls, fostering a more transparent information environment, reducing financial constraints, and boosting the capacity for eco-friendly innovation [27].
Stakeholder theory asserts that businesses must balance the interests of their stakeholders alongside the goal of maximizing shareholder value [28,46]. It underscores the importance of maintaining positive relationships with key stakeholders to uphold and enhance corporate legitimacy [46]. Institutional theory provides a complementary perspective by highlighting how corporate behavior is influenced by the institutional environment in which firms operate [37]. This environment includes formal regulations, industry norms, cultural expectations, and societal values. Companies often adapt their practices and strategies to conform to these institutional pressures, seeking legitimacy and avoiding potential sanctions or reputational damage. Further, companies with higher levels of IIOW can shape strategic objectives and decision-making, including the use of IC as a performance-enhancing strategy.
Extensive research has examined the relationship between IIs and CSR or IC decision-making, with mixed results. According to the authors of [22], IIs endorse socially responsible programs to demonstrate to their stakeholders that the companies they invest in are trustworthy and ethical. The authors of [19] observe that greater IIs are linked with higher companies’ ESG performance. The authors of [28] find that companies with a higher level of IIs tend to be more inclined to engage in and sustain their investments in ESG initiatives. However, the authors of [4,40] indicated that companies with higher IIs tend to disclose less IC information.
Grounded in stakeholder and institutional theories, and supported by prior empirical evidence, we expect that companies with higher levels of institutional ownership positively influence the relationship between CSR and IC. Accordingly, the following hypothesis is proposed:
H2.
Institutional ownership significantly moderates the positive relationship between CSR disclosures and intellectual capital.
3. Research Method and Data
3.1. Data and Sample
To assess the association between CSR disclosures and IC, along with the moderating impact of IIOW, this study utilized company-year observations from a total of 1189 companies. These observations were drawn from annual reports and financial data available through the Tadawul and the Thomson Reuters DataStream database, covering the period 2016 to 2021. The year 2016 was selected as the starting point aligns with the launch of Saudi Vision 2030, a national initiative aimed at promoting sustainability and social development [41,47]. This policy framework likely spurred increased CSR practices among Saudi companies. As noted by the author of [48], CSR disclosures significantly improved in the aftermath of the Vision 2030 announcement. The selected timeframe (2016–2021) is particularly relevant, as it encompasses critical institutional milestones, including the introduction of the revised Saudi Corporate Governance Code (SCGC) in 2017 and the launch of Saudi Vision 2030.
As detailed in Panel A of Table 1, the sample selection procedure excluded companies in the financial sector, including insurance companies and banks. This exclusion was based on the distinct disclosure requirements and CG frameworks set by the Saudi Central Bank (SAMA), making these companies incompatible with the criteria of the study sample [23]. Additionally, IC financing holds a fundamentally different role in financial corporations compared to non-financial companies [3]. This approach aligns with previous research on ESG [49] and IC [3], which similarly excluded the financial sector from their analyses.

Table 1.
Sample selection.
Data for CSR and non-financial variables, including IIOW and CG metrics, were obtained from the annual reports of the sampled firms. Meanwhile, financial data, IC, and control variables were obtained from the Thomson Reuters DataStream database. The final sample comprises 145 companies, resulting in 828 company-year observations, spanning across 11 sectors listed on Tadawul. It is important to note that our study is based on an unbalanced panel dataset, as not all companies had complete data available for each year from 2016 to 2021. Therefore, the total of 828 firm-year observations reflects the actual number of company-year records according to data availability. As detailed in Panel B of Table 1, the sample is well-distributed across industries. The Materials sector contributes the largest share of company-year observations (29.47%), followed by the Consumer Discretionary (17.15%) and Industrials (14.25%) sectors. In contrast, the Information Technology and Utilities sectors represent the smallest shares, accounting for 1.09% and 1.69% of the sample, respectively.
3.2. Variable Measurement
3.2.1. Intellectual Capital
Intellectual capital (IC) serves as the dependent variable in this study. The authors of [50] highlight the significance of measuring IC to support strategic planning, influence organizational behavior, and gain external validation. In this regard, the VAIC model is widely employed, as it quantifies IC efficiency and its components based on accounting data from a firm’s financial statements [51]. This model is particularly effective for evaluating business efficiency and demonstrating a company’s value-creation capabilities [52]. Recognized as one of the most robust metrics for statistical analysis [53], the VAIC model offers a comprehensive approach to assessing corporate performance over time [54]. It has been extensively applied in prior research to evaluate the IC of companies [3,54,55,56,57,58].
For this study, the VAIC model is used to measure company-level IC, where higher VAIC values indicate more efficient utilization of a company’s IC [59]. The calculation of VAIC begins with determining the company’s value-added (VAD), which is the sum of operating profit (OP), employee costs (EC), depreciation (D), and amortization (A) [5]. The model consists of three main components: human capital efficiency (HCE), structural capital efficiency (SCE), and capital employed efficiency (CEE). HCE is calculated as the ratio of VAD to EC, capturing the value creation attributable to human resources. SCE is derived by dividing structural capital (SC) by VAD, where SC equals VAD minus HCE. Lastly, CEE assesses the effectiveness of capital utilization in generating VAD, expressed as the ratio of VAD to capital employed (CE).
3.2.2. Corporate Social Responsibility
This study employs the CSR disclosure score as the main explanatory variable, measured through a self-developed disclosure index tailored to capture the quality of CSR reporting. The 37-item checklist that forms the basis of this index covers six important areas: employees, community, energy, environment, customers, and products and services. The Global Reporting Initiative (GRI-G4) framework, International Organization for Standardization (ISO) 26000, and the Capital Market Authority (CMA) ESG disclosure Guidelines 2022—which prioritize environmental, social, and economic factors—were all taken into consideration while creating the checklist. A mapping matrix showing how each checklist item aligns with these frameworks is included in Appendix A. Furthermore, the items in this checklist align with those analyzed in previous studies on the Saudi market [31,60,61] and in other developing markets with comparable circumstances [62,63,64].
This index integrates generally acknowledged CSR components and those specific to the Saudi environment. Certain CSR activities—such as ongoing philanthropic efforts (WAGFF), Quran memorization programs, and Islamic charitable initiatives—reflect the cultural and religious context of Saudi Arabia. These locally embedded practices are not fully captured by international reporting frameworks such as ISO 26000, GRI-G4, or the CMA guidelines (see Appendix A). This observation is consistent with prior research emphasizing the importance of incorporating culturally and religiously specific dimensions into CSR disclosure practices [60]. This method corresponds with the suggestions of the authors of [65] and [66] for integrating country-specific CSR elements to provide a culturally aware and thorough perspective on CSR activities. Certain elements from the ISO 26000, GRI-G4, or CMA frameworks were omitted from our CSR index due to their infrequent consideration in prior Saudi research, indicating their little significance in local CSR practices.
We employ manual content analysis—a well-established and reliable method for assessing disclosure quality—based on predefined criteria to evaluate the relevance of CSR items disclosed by reporting firms [67,68]. This method, extensively used for evaluating the quantity and quality of disclosures, guarantees repeatability and validity in the extraction of references from data [31,69]. This 0–3 scoring approach has been widely adopted in CSR disclosure studies (e.g., [32,70,71]) as it facilitates a nuanced assessment of disclosure quality. Under this approach, each item on the disclosure checklist (see Appendix A) is scored based on the nature and extent of CSR information reported in firms’ annual or standalone CSR reports. A score of 3 is assigned for quantitative disclosures, 2 for specific qualitative disclosures, 1 for general qualitative disclosures, and 0 when no information is provided for the respective item. This rating method enables a sophisticated assessment of disclosure quality, distinguishing between varying degrees of information offered by companies. The CSR index for each company is computed by calculating the percentage of actual values to the total number of items according to the designated formula:
where CSRj denotes the CSR disclosure score for the jth company, evaluated on a 0–3 scale. nj represents the total number of disclosure items, which is 37 for each company. Xij refers to the score assigned to the ith item, where a score of 3 indicates the provision of quantitative data, 2 corresponds to specific qualitative information with detailed explanation, 1 reflects general qualitative disclosure, and 0 signifies the absence of disclosure.
3.2.3. Reliability of CSR Scoring
The process of scoring CSR disclosures in this study was performed by a single primary coder with earlier expertise in CSR content analysis. According to the authors of [72], employing a single experienced coder enhances the reliability and cost-efficiency of the scoring process. To ensure inter-rater reliability and minimize subjectivity, a verification procedure consistent with established methodologies in prior research was applied [73,74,75]. Specifically, 45 annual reports—approximately 5.5% of the total sample—were re-evaluated three months after the initial scoring. A second coder, who was trained in the disclosure index and scoring protocol, independently re-coded these reports. The correlation between the initial scores assigned by the primary coder and those of the second coder was 84%, indicating a substantial level of coding consistency [70,75,76]. Any discrepancies between the scores assigned by the primary and secondary coders were reviewed and resolved through discussion, thereby ensuring consistent and accurate application of the scoring criteria.
3.2.4. Institutional Investors’ Ownership
In order to calculate the IIOW, the number of institutional investors’ shares was divided by the total number of outstanding shares [71,77]. We measured IIOW by calculating the percentage of IIs holding more than 5% of a company’s outstanding common shares, following prior research [41,78,79].
3.2.5. Control Variables
Consistent with prior studies on IC [16,80,81,82], the study models include various control variables to analyze the relationship between CSR, IIOW, and IC. We specifically account for board size (BSIZE) and board independence (BIND), based on the premise that corporate boards play a crucial role in the development and utilization of a company’s IC [81,83,84,85]. BSIZE is measured by the total number of directors serving on a company’s board, while BIND is calculated as the proportion of independent directors on that board [84,86,87]. We also control for audit quality (BIG4), consistent with previous studies, indicating that companies employing a Big 4 auditor exhibit greater transparency in their internal control information compared to those engaging less prominent auditors, thereby enhancing their market value [3]. The variable BIG4 is defined as a dummy variable, coded as 1 if a Big 4 audit company conducts the audit of the company, and 0 if otherwise [3].
We control for intangible assets (INTANG), as they are essential in explaining the persistence of performance differences among companies [88]. INTANG is computed as intangible assets divided by total assets in year t [3]. Company size (FSIZE) is included as it represents a key characteristic that influences a company’s IC, irrespective of the industry in which the firm operates [80,89]. FSIZE is measured as the natural logarithm of market capitalization [90]. We control for companies’ profitability, as indicated by return on assets (ROA), due to its potential relationship with IC value [91]. ROA is computed as net income divided by total assets [25,91]. Company age (FAGE) is incorporated into the analysis to determine the impact of expertise in business competition and resource management on IC performance [89]. FAGE is calculated as the natural logarithm of company age [3,80,92]. We control for company leverage (LEVEG) as previous studies indicate that companies with higher leverage experience increased monitoring from lenders, which may encourage a greater focus on the effective utilization of IC assets [93]. LEVEG is defined as the ratio of total debt to total assets [58].
3.3. Model Specification
This study utilizes unbalanced panel data to investigate the relationships among CSR, IIOW, and IC. Before conducting this study’s primary regressions, diagnostic tests were executed to evaluate estimation issues, including heteroscedasticity and autocorrelation. The Breusch–Pagan/Cook–Weisberg test was applied to detect heteroscedasticity, with the results indicating its presence (p-values < 0.005), necessitating corrective measures. Additionally, the Wooldridge [94] test was utilized to assess autocorrelation, revealing significant autocorrelation issues (p-values < 0.005). To address heteroscedasticity and autocorrelation in our models, we employed a feasible generalized least squares (FGLS) model for panel data to test the study hypotheses. FGLS is widely recommended for panel data analysis, as it provides consistent estimation in the presence of serial autocorrelation and heteroscedasticity [95,96]. Additionally, sector and year dummy variables are incorporated to control for temporal and industry-specific variations. The study hypotheses are tested using the following regression model:
4. Empirical Results
4.1. Descriptive Statistics
Table 2 provides the descriptive statistics, containing the mean, median, standard deviation, minimum, and maximum values for all variables utilized in the primary regression analyses of this study. The mean VAIC value is 5.363, aligning with the range of values reported in previous studies focused on the context of Saudi and Arab countries [58,83,97]. The mean CSR score of our sample companies is 0.990 (33%), with a range from 0.000 to 2.784 (out of a possible 3). This is consistent with previous findings in Saudi Arabia, including 27% from the author of [68], 24% from the author of [87], and 36% from the author of [98], which indicates a persistent trend of lower average CSR scores. The findings concerning the IO indicated that the average IIOW was 8.463%, with a range from 0 to 98%. This result is consistent with previous research in Saudi Arabia, where [23] reported a mean of 8.6%, which is marginally higher than the 7% average observed by [99]. The means of BSIZE and BIND are 8.157 and 48%, respectively. Approximately 45% of the sampled companies undergo audits conducted by Big 4 audit companies. The mean value of INTANG is 0.041. The findings indicate that SIZE has an average value of SR35 billion, ranging from SR60 million to SR7.1 trillion. Furthermore, the sample firms report an average ROA of 3.639%, indicating average profitability relative to total assets. The average company age is 27 years, which is consistent with findings in previous studies [31] in the Saudi context. The analysis sample exhibits a financial leverage score of 24%.
Table 2.
Descriptive statistics.
4.2. Correlation Matrix
Table 3 reports the Pearson correlation matrix for all variables employed in this study, providing an initial assessment of potential multicollinearity among the explanatory variables. The results indicate a significant positive correlation between CSR and IC, supporting the study’s hypotheses and implying that companies with higher CSR disclosures may enhance their IC. Additionally, the findings reveal that IC is significantly and positively associated with IIOW, BSIZE, BIG4, FSIZE, and ROA [3,25,44,80,83,89]. IC demonstrates a significant negative association with FAGE [3]. The results show that all pairwise correlations among variables included in the same regression model are below the threshold of 0.80, indicating that multicollinearity is unlikely to be a significant concern [100]. Furthermore, the variance inflation factor (VIF) values for all variables, as reported in Table 3, remain below 10 across all models, further confirming the absence of multicollinearity issues [101].
Table 3.
Correlation matrix results.
4.3. Main Regression Results
Table 4 exhibits the FGLS regression results, examining the association between CSR and IC, as well as the interaction effect of IIOW, while controlling year- and industry-fixed effects. The FGLS regression model effectively addresses issues of heteroscedasticity and autocorrelation [96,102,103]. Furthermore, to mitigate the impact of outliers, all continuous variables are winsorized at the 1st and 99th percentiles. Column (1) presents the regression results for the CSR-IC relationship, while Column (2) explains the findings related to the interaction effect of IIOW on the CSR-IO relationship. The results presented in Table 4 show that all regression models are statistically significant at the 1% level, underscoring the considerable influence of the majority of explanatory variables on IC.
Table 4.
FGLS regression results.
The results in Column (1) of Table 4 provide support for H1, revealing a positive and statistically significant association between CSR and IC. The CSR coefficient is statistically significant at the 5% level, indicating that an increase in CSR disclosure is associated with growth in a company’s IC. The findings of this study are consistent with prior literature that reports a positive and significant relationship between ESG performance and IC [3]. The findings support stakeholder theory, indicating that companies with robust CSR commitments foster greater innovation via improved intellectual capital [3]. The results of this study are in line with [11], which indicates that companies with superior non-financial ESG performance exhibit a more optimistic tone in IC. This study’s findings align with [104], who found that a company’s ethical approach correlates with elevated levels of subcomponents of IC. Companies that adopt socially responsible human resource policies demonstrate a more substantial improvement in IC.
Second, the findings from Table 5, Column 2, provide robust support for H2, demonstrating that IIOW significantly enhances the positive association between CSR and IC. The interaction term IIOW × CSR is significant at the 1% level, highlighting the pivotal role of IIs in amplifying the influence of CSR on IC development. The findings support stakeholder and institutional theories. This result affirms that IIOW plays a crucial role by fostering an environment where CSR activities are more impactful [19,20,21], encouraging better resource allocation, and ensuring rigorous managerial oversight [22,23]. Their support helps companies leverage CSR initiatives to build IC more effectively, aligning with theories that highlight their role in improving CG and transparency [4,24,40]. Our findings suggest that IIOW strengthens the CSR-IC nexus by enabling companies to align their social responsibility strategies with long-term innovation goals. Institutional investors not only promote CSR activities but also ensure these initiatives translate into tangible benefits, such as enhanced IC, emphasizing their role as pivotal enablers in this relationship. This finding has practical implications, as it highlights the role of institutional investors in shaping sustainable corporate strategies. Encouraging stronger institutional investor engagement may help firms better translate CSR efforts into long-term intangible assets, particularly in emerging markets.
Table 5.
FGLS regression results (DV = MVAIC).
Third, the results in Table 4 indicate that FSIZE has a positive and significant coefficient at the 5% level. This finding suggests that IC development becomes more effective as company size increases, highlighting that larger companies, due to their greater flexibility and proactive capabilities, are better equipped to navigate challenges associated with building IC [3,40,80]. Furthermore, the results in Table 4 indicate that the coefficient for ROA is positive and statistically significant at the 1% level. This result implies that corporate performance improves with the development of IC, aligning with the expectations outlined in the existing IC literature [3,40]. Conversely, the results in Table 4 show that BSIZE has a significant negative coefficient at the 5% level, aligning with prior studies that document a negative association between BSIZE and IC [85]. This finding confirms the argument that smaller boards are more effective in decision-making and oversight, whereas larger boards may hinder company performance due to coordination challenges and inefficiencies [83].
5. Additional Analyses
5.1. Alternative IC Measurement (MVAIC)
To validate the results described in Table 4, an alternative measure for IC, Modified Value-Added Intellectual Coefficient (MVAIC), was employed, as it is widely used in the literature [75,82,92]. While the original VAIC has some limitations, such as the exclusion of relational capital efficiency (RCE) [55], a modified version addresses this shortcoming by incorporating RCE [57]. This enhancement makes the modified MVAIC a more comprehensive extension of the original VAIC framework [97]. We re-estimated our main regression models using MVAIC as an alternative measure of IC. The results in Table 5 confirm the robustness of our results from Table 4. Specifically, CSR continues to exhibit a positive and significant association with IC, and the interaction term (IIOW × CSR) also continues to be positive and significant. These results reinforce the earlier evidence of a strong positive association between CSR and IC, as well as the enhancing effect of IIOW on the CSR-IC nexus.
5.2. Alternative CSR Measurement (CSR Quantity)
In contrast to the results in Table 4, which examine CSR quality, an alternative methodology was applied to quantify CSR disclosure (CSRqn). The same 37-item disclosure checklist used to assess CSR quality, as detailed in Section 3.2.2, was applied. Following prior studies focusing on the Saudi market [61,68], a dichotomous scoring approach was adopted, whereby a score of 1 was assigned to each CSR item disclosed by a company, and 0 otherwise. The CSR quantity score (CSRqn) was subsequently calculated by dividing the total number of disclosed items by the maximum possible score (37) for each firm, as per the following formula:
Using this measure, the regression model outlined in Section 5.3 was re-estimated. The results, displayed in Table 6, reveal that the interaction term remains positive, while CSR continues to demonstrate a positive and significant association with IC. These results align with the regression findings in Table 4, further reinforcing the positive link between CSR and IC.
Table 6.
FGLS regression results (Alternative CSR Measurement).
5.3. Alternative Regression Approach
This section presents the re-estimation of the regression model using quantile regression (QR), which is particularly appropriate when the data may violate key assumptions of ordinary least squares (OLS) regression, such as normality and homoscedasticity. QR facilitates the examination of the effects of explanatory variables across various points in the conditional distribution of the dependent variable, offering a more nuanced and comprehensive understanding of the relationship between CSR, IIOW, and IC. QR is a semi-parametric technique that does not require assumptions regarding the parametric distribution of residuals. It is also more robust to outliers, as it minimizes the sum of absolute residuals rather than the squared residuals [63]. This robustness makes QR particularly well-suited to datasets with skewed distributions or extreme values, which are common in financial and accounting data. As shown in Table 2, the skewness and kurtosis statistics for the raw (unwinsorized) data indicate substantial deviations from normality in several variables—particularly VAIC, IIOW, INTANG, and SIZE—supporting the application of QR in this context. The QR results, reported in Table 7 (columns 1–6), illustrate the effects at different quantile levels. CSR is shown to have a positive and significant association with IC at the 5% and 1% levels for the 0.25 and 0.50 quantiles, respectively, indicating that higher levels of CSR activities correspond to greater IC. Furthermore, the interaction between IIOW and CSR remains positive and significant across the quantiles. These results are consistent with the baseline regression findings reported in Table 5, confirming the robustness of the main analysis and demonstrating the value of examining the distributional effects of CSR on IC.
Table 7.
Quantile regression results.
5.4. Addressing Endogeneity
In this subsection, we address potential endogeneity concerns that may influence our findings. The primary objective of this study is to determine whether firms with higher CSR disclosures are more likely to exhibit elevated levels of IC. However, our analysis may be subject to issues such as reverse causality and simultaneity biases. Specifically, it is plausible that companies with greater IC efficiency possess a greater capacity to allocate resources towards CSR initiatives [16]. Supporting this perspective, the authors of [105] argued that companies with high IC intensity are better equipped to foster a socially responsible approach in managing human resources. To mitigate endogeneity concerns, we implement several robust methodologies, including the two-stage least squares (2SLS) regression, lagged independent variables, Heckman two-stage estimators, and the propensity score matching (PSM) approach. These methods enhance the reliability of our findings by addressing potential biases in the analysis.
5.4.1. Two-Stage Least Squares (2SLS) Regression
First, in line with prior research [3,44], we employ the 2SLS approach to mitigate potential endogeneity concerns. Following recommendations in the literature, the initial CSR value of the firm (CSR_INI) and the industry-year average CSR (CSR_IND) are used as instrumental variables [41,44,84]. In the first stage of the 2SLS, CSR is regressed on its instrumental variables (CSR_INI and CSR_IND), alongside all control variables from the primary regression model, as well as year and sector dummies, to obtain the exogenous predicted CSR (PrCSR) fitting value. The results of this stage are presented in Table 8, Panel 1. In the second stage, we conduct FGLS regression analysis of IC, using the fitted value of PrCSR derived from the first stage and incorporating all control variables. The results, shown in Columns 2–3 of Table 9, indicate that CSR and the interaction term IIOW × CSR remain positively associated with IC. These findings indicate that the observed relationships are not attributable to omitted variable bias.
Table 8.
The 2SLS regression results.
Table 9.
Regression results—lag independent variables.
To assess the reliability of the instrumental variables employed in this study, three key diagnostic tests were conducted. First, the Kleibergen-Paap rk LM statistic (p = 0.0000) rejects the null hypothesis of under-identification, confirming that the model is properly identified [75]. Second, we applied the Kleibergen-Paap rk Wald F-statistic [106] to assess instrument weakness. The F-statistics reported in Table 8 exceed the critical threshold of 10 suggested by the authors of [107], indicating that the instruments are both strong and relevant. Third, we used the Hansen J test to examine over-identification [95]. The non-significant p-values support the exogeneity and validity of the instruments used in the second-stage regressions.
5.4.2. Lag of IVs
Second, in line with prior studies [41,102], we re-estimated the regression model by lagging the independent variables by one year to mitigate potential endogeneity bias arising from reverse causality [108]. The results presented in Table 9, Columns 1 and 2, confirm the robustness of the positive and significant relationships between CSR, the interaction term (IIOW × CSR), and IIOW. These findings suggest that the model is not affected by reverse causality, thereby reinforcing the validity of the estimated relationships.
5.4.3. PSM and Heckman Two-Stage Regression
Third, the PSM approach was employed to address heterogeneities between companies with higher and lower levels of CSR disclosures. A binary variable, CSRDMY, was constructed to indicate firms with relatively high levels of CSR disclosure, taking the value of 1 for companies whose CSR scores exceed the sample median, and 0 otherwise [41,109]. A split-sample matching approach was employed, wherein firms in the treatment group (i.e., those with high CSR disclosure levels) were matched with firms in the control group (i.e., those with low CSR disclosures). In the first stage, a logistic regression model was employed, with CSRDMY as the dependent variable and the explanatory variables from the baseline regression as predictors. The nearest neighbor matching technique without replacement was utilized, linking each high CSR observation to one low CSR observation. To ensure closer matches, a caliper of 0.25 standard deviations of the propensity score was applied [110]. In the second stage, the primary regression models (Table 5) were re-estimated using the matched sample obtained in the first stage. The results, presented in Table 10, columns 1 and 2, reveal that the positive and significant relationship between CSR, the interaction term IIOW × CSR, and IC persists at the 1% significance level. These findings further validate the robustness of the main regression results reported in Table 4.
Table 10.
PSM and Heckman regression results.
Fourth, to address potential self-selection bias in the primary analysis, we applied the two-step procedure proposed by [111]. In the first stage, a probit model was estimated in which the binary variable CSRDMY was regressed on all control variables used in the main regression. In the second stage, IC was modelled as the dependent variable, with CSR and the interaction term IIOW × CSR as the key independent variables. This stage incorporated additional control variables and a self-selection adjustment represented by the inverse Mills ratio (IMR) obtained from the first stage. The results, detailed in Table 10 (columns 3 and 4), corroborate the main regression findings, demonstrating that higher CSR disclosures positively influence companies’ IC.
5.4.4. E-BALANCE
Finally, to further mitigate endogeneity concerns, we employed the entropy balancing method, an advanced technique that more effectively reduces variations in observable variables between treatment and control groups. As highlighted by the authors of [112], entropy balancing enhances the statistical power of tests by reducing data loss and avoiding random matching. This approach has gained widespread use in recent social science research [102,113,114]. For this analysis, CSRDMY was used to identify companies in the top quartile of CSR disclosures as the treatment group, with the remaining sample forming the control group [115]. Using the default Stata 17 entropy balancing code provided by [116], the sample means of the covariates were calculated, as shown in Table 11, Panel A. Regression results from the entropy-balanced sample, presented in Table 12, Panel B, confirm a consistent positive association between CSR, IIOW × CSR, and IC, aligning with our baseline findings in Table 4.
Table 11.
(Panel A) Entropy balancing method results. VAIC univariate comparison.
Table 12.
(Panel B) Regression results using the EBM sample.
6. Conclusions
The study contributes to the expanding body of literature on the CSR disclosure-IC relationship, an area that remains underexplored. It also examines the moderating role of IIOW, providing further insight into how IIOW influences this association. Analyzing a dataset of 145 Saudi companies (828 observations) over 2016–2021, the findings reveal a significant positive association between CSR disclosures and IC. This indicates that increased CSR disclosures enhance IC by fostering trust, reputation, and stakeholder engagement [5,18,48]. Importantly, the study highlights the critical role of IIOW in amplifying the positive effects of CSR disclosures on IC, as institutional investors drive strategic decisions aligned with sustainable and knowledge-oriented practices. Robustness checks, including alternative measurements for IC and CSR, applying an alternative regression approach, and controls for potential endogeneity and self-selection biases, validate these results.
Our study provides significant contributions to the CSR literature by examining the influence of CSR disclosures on IC. The findings underscore CSR as a pivotal resource that enhances the economic value of another critical strategic asset, namely IC. Intellectual capital, encompassing corporate reputation, organizational culture, and stakeholder trust, thrives in an environment fostered by CSR activities. CSR initiatives play a vital role in creating an organizational atmosphere conducive to building trust-based networks with internal and external stakeholders, which, in turn, facilitates knowledge sharing and the development of IC. Companies engaged in robust CSR practices effectively communicate the internal and external benefits to stakeholders, highlighting the broader value of CSR initiatives. Consequently, managers should integrate considerations of CSR’s impact on IC performance into decision-making processes, shifting the focus from short-term profits to long-term value creation.
Moreover, our findings reveal the moderating role of IIOW in strengthening the relationship between CSR and IC performance. Institutional investors, with their capacity to influence strategic direction and resource allocation, enhance the effectiveness of CSR initiatives in fostering IC. This underscores the importance of aligning CSR strategies with institutional ownership to maximize their impact on intellectual capital development. Administrators can leverage the demonstrated positive correlation between IC and CSR to reinforce their organizations’ commitment to socially responsible practices.
From a practical perspective, CSR fosters trust and facilitates the conversion of tacit knowledge into explicit organizational assets, thereby enhancing IC. Managers can utilize CSR initiatives as a strategic tool to attract and retain top talent and strengthen external relationships with key stakeholders. By showcasing the positive interplay between CSR and a critical organizational resource like IC, businesses can build a stronger case for adopting socially responsible business models, further supported by the strategic involvement of institutional investors. This alignment not only drives IC performance but also underscores the broader value of CSR in achieving sustainable organizational success.
While this study provides valuable insights, it has certain limitations. First, the analysis focuses solely on Saudi Arabia, an emerging market, which may restrict the generalizability of the findings. Future research could address this by replicating the study across other emerging markets to enhance external validity. Second, the study does not differentiate between various types of IIOW, such as mutual funds, insurance companies, and financial institutions. Future studies should examine the distinct effects of these ownership types to offer a more nuanced and comprehensive understanding.
Author Contributions
Conceptualization, A.Q. and S.A.Q.; data curation, A.Q.; formal analysis, A.Q.; funding acquisition, E.A.A.A. and M.Z.A.; methodology, A.Q. and S.A.Q.; project administration, E.A.A.A.; resources, E.A.A.A. and M.Z.A.; supervision, E.A.A.A. and A.Q.; validation, A.Q.; writing—original draft, A.Q. and S.A.Q.; writing—review and editing, A.Q. and S.A.Q. All authors have read and agreed to the published version of the manuscript.
Funding
The authors extend their appreciation to Prince Sattam bin Abdulaziz University for funding this research work through the project number (PSAU/2024/02/31723).
Institutional Review Board Statement
Not applicable.
Informed Consent Statement
Not applicable.
Data Availability Statement
The data that support the findings of this study are available on request from the corresponding author. The data are not publicly available due to privacy or ethical restrictions.
Conflicts of Interest
The authors declare no conflicts of interest.
Appendix A
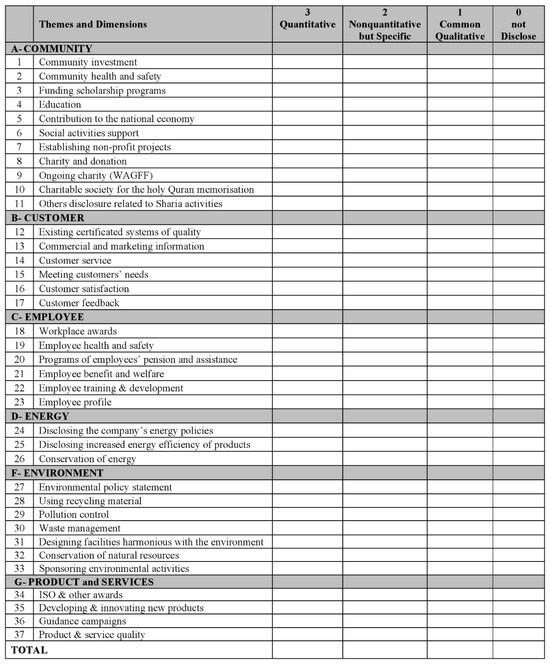
Figure A1.
CSR Disclosure Index.
References
- Shahab, Y.; Gull, A.A.; Ahsan, T.; Mushtaq, R. CEO power and corporate social responsibility decoupling. Appl. Econ. Lett. 2022, 29, 1965–1969. [Google Scholar] [CrossRef]
- Vitolla, F.; Raimo, N.; Marrone, A.; Rubino, M. The role of board of directors in intellectual capital disclosure after the advent of integrated reporting. Corp. Soc. Responsib. Environ. Manag. 2020, 27, 2188–2200. [Google Scholar] [CrossRef]
- Pham, C.-V.; Liu, S.-F.; Chen, S.-H. Corporate ESG performance and intellectual capital: International evidence. Asia Pac. Manag. Rev. 2024, 29, 306–346. [Google Scholar] [CrossRef]
- Mardini, G.H.; Elleuch Lahyani, F. Impact of firm performance and corporate governance mechanisms on intellectual capital disclosures in CEO statements. J. Intellect. Cap. 2022, 23, 290–312. [Google Scholar] [CrossRef]
- Shah, S.Q.A.; Lai, F.W.; Tahir, M.; Shad, M.K.; Hamad, S.; Ali, S.E.A. Intellectual capital and financial performance: Does board size and independent directors matter? An empirical enquiry. J. Islam. Account. Bus. Res. 2024. epub ahead of printing. [Google Scholar] [CrossRef]
- Aftab, J.; Abid, N.; Sarwar, H.; Amin, A.; Abedini, M.; Veneziani, M. Does corporate social responsibility drive financial performance? Exploring the significance of green innovation, green dynamic capabilities, and perceived environmental volatility. Corp. Soc. Responsib. Environ. Manag. 2024, 31, 1634–1653. [Google Scholar] [CrossRef]
- Song, W.; Ren, S.; Yu, J. Bridging the gap between corporate social responsibility and new green product success: The role of green organizational identity. Bus. Strateg. Environ. 2019, 28, 88–97. [Google Scholar] [CrossRef]
- AL-Duais, S.D.; Qasem, A.; Wan-Hussin, W.N.; Bamahros, H.M.; Thomran, M.; Alquhaif, A. CEO Characteristics, Family Ownership and Corporate Social Responsibility Reporting: The Case of Saudi Arabia. Sustainability 2021, 13, 12237. [Google Scholar] [CrossRef]
- Ferraris, A.; Golgeci, I.; Arslan, A.; Santoro, G. Understanding the link between subsidiary CEOs and corporate social responsibility in emerging markets: Moderating role of social capital. Bus. Ethics Environ. Responsib. 2024, 33, 80–93. [Google Scholar] [CrossRef]
- McWilliams, A.; Siegel, D.S. Creating and capturing value: Strategic corporate social responsibility, resource-based theory, and sustainable competitive advantage. J. Manag. 2011, 37, 1480–1495. [Google Scholar] [CrossRef]
- Beretta, V.; Demartini, C.; Trucco, S. Does environmental, social and governance performance influence intellectual capital disclosure tone in integrated reporting? J. Intellect. Cap. 2019, 20, 100–124. [Google Scholar] [CrossRef]
- Gallardo-Vázquez, D.; Valdez-Juárez, L.E.; Lizcano-Álvarez, J.L. Corporate Social Responsibility and Intellectual Capital: Sources of Competitiveness and Legitimacy in Organizations’ Management Practices. Sustainability 2019, 11, 5843. [Google Scholar] [CrossRef]
- Chen, C.-H. The mediating effect of corporate culture on the relationship between business model innovation and corporate social responsibility: A perspective from small- and medium-sized enterprises. Asia Pac. Manag. Rev. 2022, 27, 312–319. [Google Scholar] [CrossRef]
- Aras, G.; Aybars, A.; Kutlu, O. The interaction between corporate social responsibility and value added intellectual capital: Empirical evidence from Turkey. Soc. Responsib. J. 2011, 7, 622–637. [Google Scholar] [CrossRef]
- Xu, J.; Liu, F.; Shang, Y. R&D investment, ESG performance and green innovation performance: Evidence from China. Kybernetes 2021, 50, 737–756. [Google Scholar] [CrossRef]
- Gangi, F.; Salerno, D.; Meles, A.; Daniele, L.M. Do corporate social responsibility and corporate governance influence intellectual capital efficiency? Sustainability 2019, 11, 1899. [Google Scholar] [CrossRef]
- Branco, M.C.; Rodrigues, L.L. Corporate social responsibility and resource-based perspectives. J. Bus. Ethics 2006, 69, 111–132. [Google Scholar] [CrossRef]
- Eissa, A.M.; Elgendy, T.; Diab, A. Earnings management, institutional ownership and investment efficiency: Evidence from a developing country. J. Financ. Report. Account. 2023, 23, 1206–1226. [Google Scholar] [CrossRef]
- Dyck, A.; Lins, K.V.; Roth, L.; Wagner, H.F. Do institutional investors drive corporate social responsibility? International evidence. J. Financ. Econ. 2019, 131, 693–714. [Google Scholar] [CrossRef]
- Chen, T.; Dong, H.; Lin, C. Institutional shareholders and corporate social responsibility. J. Financ. Econ. 2020, 135, 483–504. [Google Scholar] [CrossRef]
- Flammer, C.; Toffel, M.W.; Viswanathan, K. Shareholder activism and firms’ voluntary disclosure of climate change risks. Strateg. Manag. J. 2021, 42, 1850–1879. [Google Scholar] [CrossRef]
- Farooq, M.; Noor, A. The impact of corporate social responsibility on financial constraints: The role of insider and institutional ownership. J. Financ. Report. Account. 2023. epub ahead of printing. [Google Scholar] [CrossRef]
- Qasem, A.; Wan-Hussin, W.N.; Al-Qadasi, A.A.; Ghaleb, B.A.A.; Bamahros, H.M. Implications of sustainability reporting and institutional investors’ ownership for external audit work: Evidence from Saudi Arabia. J. Financ. Report. Account. 2023. epub ahead of printing. [Google Scholar] [CrossRef]
- Al Maeeni, F.; Ellili, N.O.D.; Nobanee, H. Impact of corporate governance on corporate social responsibility disclosure of the UAE listed banks. J. Financ. Report. Account. 2022, 22, 769–795. [Google Scholar] [CrossRef]
- Mardini, G.H.; Elleuch Lahyani, F. Female directors’ representation and intellectual capital efficiency: Does institutional ownership matter? J. Appl. Account. Res. 2024, 25, 397–419. [Google Scholar] [CrossRef]
- Giordino, D.; Jabeen, F.; Nirino, N.; Bresciani, S. Institutional investors ownership concentration and its effect on disclosure and transparency of United Nations sustainable development goals. Technol. Forecast. Soc. Change 2024, 200, 123132. [Google Scholar] [CrossRef]
- Yang, B.; Guo, C.; Fan, Y. Institutional investor networks and ESG performance: Evidence from China. Emerg. Mark. Financ. Trade 2024, 60, 113–137. [Google Scholar] [CrossRef]
- Qasem, A.; AL-Duais, S.D.; Wan-Hussin, W.N.; Bamahros, H.M.; Alquhaif, A.; Thomran, M. Institutional ownership types and ESG reporting: The case of Saudi listed firms. Sustainability 2022, 14, 11316. [Google Scholar] [CrossRef]
- Bose, S.; Podder, J.; Biswas, K. Philanthropic giving, market-based performance and institutional ownership: Evidence from an emerging economy. Br. Account. Rev. 2017, 49, 429–444. [Google Scholar] [CrossRef]
- Abro, A.A.; Alam, N.; Murshed, M.; Mahmood, H.; Musah, M.; Rahman, A.A. Drivers of green growth in the Kingdom of Saudi Arabia: Can financial development promote environmentally sustainable economic growth? Environ. Sci. Pollut. Res. 2023, 30, 23764–23780. [Google Scholar] [CrossRef]
- Boshnak, H.A. Determinants of corporate social and environmental voluntary disclosure in Saudi listed firms. J. Financ. Rep. Account. 2022, 20, 667–692. [Google Scholar] [CrossRef]
- Pucheta-Martínez, M.C.; Chiva-Ortells, C. The role of directors representing institutional ownership in sustainable development through corporate social responsibility reporting. Sustain. Dev. 2018, 26, 835–846. [Google Scholar] [CrossRef]
- Freeman, R.E. Strategic Management: A Stakeholder Approach; Pitman Publishing: Boston, MA, USA, 1984. [Google Scholar]
- Donaldson, T.; Preston, L.E. The stakeholder theory of the corporation: Concepts, evidence, and implications. Acad. Manag. Rev. 1995, 20, 65–91. [Google Scholar] [CrossRef]
- Chouaibi, J.; Chouaibi, S. Does value added of intellectual capital influence voluntary disclosure? The moderating effect of CSR practices. Account. Manag. Inf. Syst. 2020, 19, 651–681. [Google Scholar] [CrossRef]
- Guthrie, J.; Petty, R.; Yongvanich, K.; Ricceri, F. Using content analysis as a research method to inquire into intellectual capital reporting. J. Intellect. Cap. 2004, 5, 282–293. [Google Scholar] [CrossRef]
- Kılıç, M.; Uyar, A.; Kuzey, C.; Karaman, A.S. Does institutional theory explain integrated reporting adoption of Fortune 500 companies? J. Appl. Account. Res. 2020, 22, 114–137. [Google Scholar] [CrossRef]
- Aerts, W.; Cormier, D.; Magnan, M. Intra-industry imitation in corporate environmental reporting: An international perspective. J. Account. Public Policy 2006, 25, 299–331. [Google Scholar] [CrossRef]
- Subramaniam, N.; Akbar, S.; Situ, H.; Ji, S.; Parikh, N. Sustainable development goal reporting: Contrasting effects of institutional and organisational factors. J. Clean. Prod. 2023, 411, 137339. [Google Scholar] [CrossRef]
- Shahveisi, F.; Khairollahi, F.; Alipour, M. Does ownership structure matter for corporate intellectual capital performance? An empirical test in the Iranian context. Eurasian Bus. Rev. 2017, 7, 67–91. [Google Scholar] [CrossRef]
- Alobaid, R.O.H.; Qasem, A.; Al-Qadasi, A.A. Corporate social responsibility, ownership structure, and firm investment efficiency: Evidence from the Saudi stock market. Sustainability 2024, 16, 6584. [Google Scholar] [CrossRef]
- Subramaniam, M.; Youndt, M.A. The influence of intellectual capital on the types of innovative capabilities. Acad. Manag. J. 2005, 48, 450–463. [Google Scholar] [CrossRef]
- Quintana-García, C.; Marchante-Lara, M.; Benavides-Chicón, C.G. Towards sustainable development: Environmental innovation, cleaner production performance, and reputation. Corp. Soc. Responsib. Environ. Manag. 2022, 29, 1330–1340. [Google Scholar] [CrossRef]
- Chkir, I.; El Haj Hassan, B.; Rjiba, H.; Saadi, S. Does corporate social responsibility influence corporate innovation? International evidence. Emerg. Mark. Rev. 2021, 46, 100746. [Google Scholar] [CrossRef]
- Chung, K.H.; Zhang, H. Corporate governance and institutional ownership. J. Financ. Quant. Anal. 2011, 46, 247–273. [Google Scholar] [CrossRef]
- Dakhli, A. The impact of ownership structure on corporate social responsibility: The moderating role of financial performance. Soc. Bus. Rev. 2021, 16, 562–591. [Google Scholar] [CrossRef]
- Qasem, A.; Badru, B.O.; Ghaleb, B.A.; AL-Duais, S.D.; Al-Qadasi, A.A. Corporate social responsibility disclosure in Saudi companies: Analysing the impact of board independence in family and non-family companies. Humanit. Soc. Sci. Commun. 2024, 11, 1044. [Google Scholar] [CrossRef]
- Alharbi, K.M.S. The Impact of the 2030 Vision and Firm Characteristics on Corporate Social Responsibility Disclosure in Saudi Arabia. Ph.D. Thesis, Victoria University, Melbourne, Australia, 2021. [Google Scholar]
- La Rosa, F.; Liberatore, G.; Mazzi, F.; Terzani, S. The impact of corporate social performance on the cost of debt and access to debt financing for listed European non-financial firms. Eur. Manag. J. 2018, 36, 519–529. [Google Scholar] [CrossRef]
- Marr, B.; Gray, D.; Neely, A. Why do firms measure their intellectual capital? J. Intellect. Cap. 2003, 4, 441–464. [Google Scholar] [CrossRef]
- Pulic, A. VAICTM–an accounting tool for intellectual capital management. Int. J. Technol. Manag. 2000, 20, 6. [Google Scholar] [CrossRef]
- Sumedrea, S. Intellectual Capital and Firm Performance: A Dynamic Relationship in Crisis Time. Procedia Econ. Financ. 2013, 6, 137–144. [Google Scholar] [CrossRef]
- Andriessen, D. Making Sense of Intellectual Capital: Designing a Method for the Valuation of Intangibles. Ph.D. Dissertation, Utrecht University of Applied Sciences, Amsterdam, The Netherlands, 2004. [Google Scholar]
- Tiwari, R. Nexus between intellectual capital and profitability with interaction effects: Panel data evidence from the Indian healthcare industry. J. Intellect. Cap. 2022, 23, 588–616. [Google Scholar] [CrossRef]
- Vrontis, D.; Christofi, M.; Battisti, E.; Graziano, E.A. Intellectual capital, knowledge sharing and equity crowdfunding. J. Intellect. Cap. 2021, 22, 95–121. [Google Scholar] [CrossRef]
- Wadhwa, S.; Sahoo, S. Intellectual capital and subscription rate: An empirical investigation in the Indian initial public offering market. Account. Res. J. 2024, 37, 330–349. [Google Scholar] [CrossRef]
- Rahman, M.J.; Liu, H. Intellectual capital and firm performance: The moderating effect of auditor characteristics. Asian Rev. Account. 2023, 31, 522–558. [Google Scholar] [CrossRef]
- Awad Bakry, A.E. Does intellectual capital efficiency improve the corporate social responsibility of Egyptian firms? J. Financ. Report. Account. 2022, 20, 693–711. [Google Scholar] [CrossRef]
- Chowdhury, L.A.M.; Rana, T.; Akter, M.; Hoque, M. Impact of intellectual capital on financial performance: Evidence from the Bangladeshi textile sector. J. Account. Organ. Change 2018, 14, 429–454. [Google Scholar] [CrossRef]
- Mahjoub, L. Disclosure about corporate social responsibility through ISO 26000 implementation made by Saudi listed companies. Cogent Bus. Manag. 2019, 6, 1609188. [Google Scholar] [CrossRef]
- Alotaibi, K.O.; Hussainey, K. Determinants of CSR disclosure quantity and quality: Evidence from non-financial listed firms in Saudi Arabia. Int. J. Discl. Gov. 2016, 13, 364–393. [Google Scholar] [CrossRef]
- Omar, B.F.; Alkayed, H. Corporate social responsibility extent and quality: Evidence from Jordan. Soc. Responsib. J. 2021, 17, 1193–1212. [Google Scholar] [CrossRef]
- Badru, B.O.; Qasem, A. Corporate social responsibility and dividend payments in the Malaysian capital market: The interacting effect of family-controlled companies. J. Sustain. Financ. Invest. 2024, 14, 283–306. [Google Scholar] [CrossRef]
- Ananzeh, H.; Alshurafat, H.; Bugshan, A.; Hussainey, K. The impact of corporate governance on forward-looking CSR disclosure. J. Financ. Report. Account. 2022, 22, 480–499. [Google Scholar] [CrossRef]
- Al-Abdin, A.; Roy, T.; Nicholson, J.D. Researching corporate social responsibility in the Middle East: The current state and future directions. Corp. Soc. Responsib. Environ. Manag. 2018, 25, 47–65. [Google Scholar] [CrossRef]
- Ortas, E.; Gallego-Álvarez, I.; Alvarez, I. National institutions, stakeholder engagement, and firms’ environmental, social, and governance performance. Corp. Soc. Responsib. Environ. Manag. 2019, 26, 598–611. [Google Scholar] [CrossRef]
- Ullah, M.S.; Muttakin, M.B.; Khan, A. Corporate governance and corporate social responsibility disclosures in insurance companies. Int. J. Account. Inf. Manag. 2019, 27, 284–300. [Google Scholar] [CrossRef]
- Ebaid, I.E.-S. Corporate governance mechanisms and corporate social responsibility disclosure: Evidence from an emerging market. J. Glob. Responsib. 2022, 13, 396–420. [Google Scholar] [CrossRef]
- Krippendorff, K. Content Analysis: An Introduction to Its Methodology, 2nd ed.; Sage Publications: Thousand Oaks, CA, USA, 2018. [Google Scholar]
- Wan-Hussin, W.N.; Qasem, A.; Aripin, N.; Ariffin, M.S.M. Corporate responsibility disclosure, information environment and analysts’ recommendations: Evidence from Malaysia. Sustainability 2021, 13, 3568. [Google Scholar] [CrossRef]
- Al-Qadasi, A.A. The power of institutional investors: Empirical evidence on their role in investment in internal audit function. Manag. Audit. J. 2024, 39, 166–190. [Google Scholar] [CrossRef]
- Milne, M.J.; Adler, R.W. Exploring the reliability of social and environmental disclosures content analysis. Account. Audit. Account. J. 1999, 12, 237–256. [Google Scholar] [CrossRef]
- Al-Shaer, H. Do environmental-related disclosures help enhance investment recommendations? UK-based evidence. J. Financ. Report. Account. 2018, 16, 217–244. [Google Scholar] [CrossRef]
- Sadou, A.; Alom, F.; Laluddin, H. Corporate social responsibility disclosures in Malaysia: Evidence from large companies. Soc. Responsib. J. 2017, 13, 177–202. [Google Scholar] [CrossRef]
- AlObaid, R.O.H.; Al Farooque, O.; Qasem, A. Does disclosure of CSR activities improve corporate value? Moderating role of intellectual capital and COVID-19 pandemic. Humanit. Soc. Sci. Commun. 2025, 12, 401. [Google Scholar] [CrossRef]
- Qaderi, S.A.; Ghaleb, B.A.A.; Hashed, A.A.; Chandren, S.; Abdullah, Z. Board characteristics and integrated reporting strategy: Does sustainability committee matter? Sustainability 2022, 14, 6092. [Google Scholar] [CrossRef]
- Qasem, A. The association between institutional monitoring, political connections and audit report lag: Evidence from the Malaysian capital market. J. Account. Emerg. Econ. 2025, 15, 1–28. [Google Scholar] [CrossRef]
- Al-Duais, S.D.; Malek, M.; Abdul Hamid, M.A.; Almasawa, A.M. Ownership structure and real earnings management: Evidence from an emerging market. J. Account. Emerg. Econ. 2022, 12, 380–404. [Google Scholar] [CrossRef]
- Qasem, A.; Mohammed, A.; Battisti, E.; Ferraris, A. Ownership structure and firm sustainable investments: Evidence from emerging markets. Int. J. Emerg. Mark. 2025, 20, 609–637. [Google Scholar] [CrossRef]
- Ginesti, G.; Ossorio, M. The influence of family-related factors on intellectual capital performance in family businesses. J. Manag. Gov. 2021, 25, 535–560. [Google Scholar] [CrossRef]
- Scafarto, V.; Ricci, F.; Magnaghi, E.; Ferri, S. Board structure and intellectual capital efficiency: Does the family firm status matter? J. Manag. Gov. 2021, 25, 841–878. [Google Scholar] [CrossRef]
- Ahlawat, D.; Sharma, P.; Kumar, S. Impact of intellectual capital on financial competitiveness in context of listed Indian healthcare enterprises. Meas. Bus. Excell. 2024, 28, 516–531. [Google Scholar] [CrossRef]
- Buallay, A.; Hamdan, A. The relationship between corporate governance and intellectual capital: The moderating role of firm size. Int. J. Law Manag. 2019, 61, 384–401. [Google Scholar] [CrossRef]
- Shahzad, F.; Hussain Baig, M.; Rehman, I.U.; Latif, F.; Sergi, B.S. What drives the impact of women directors on firm performance? Evidence from intellectual capital efficiency of US listed firms. J. Intellect. Cap. 2020, 21, 513–530. [Google Scholar] [CrossRef]
- Soriya, S.; Kumar, N. Association of Corporate Governance with Intellectual Capital Performance: A Study of S&P 200 Companies. J. Inf. Knowl. Manag. 2021, 21, 2250003. [Google Scholar] [CrossRef]
- Qaderi, S.A.; Ali Ghaleb, B.; Qasem, A.; Waked, S.S.S. Audit committee effectiveness and integrated reporting quality: Does family ownership matter? Cogent Econ. Financ. 2024, 12, 2291893. [Google Scholar] [CrossRef]
- Habbash, M. Corporate governance and corporate social responsibility disclosure: Evidence from Saudi Arabia. Soc. Responsib. J. 2016, 12, 740–754. [Google Scholar] [CrossRef]
- Villalonga, B. Intangible resources, Tobin’sq, and sustainability of performance differences. J. Econ. Behav. Organ. 2004, 54, 205–230. [Google Scholar] [CrossRef]
- Forte, W.; Tucker, J.; Matonti, G.; Nicolò, G. Measuring the intellectual capital of Italian listed companies. J. Intellect. Cap. 2017, 18, 710–732. [Google Scholar] [CrossRef]
- Qasem, A.; Wan-Hussin, W.N.; Ghaleb, B.A.A.; Bamahros, H.M. Institutional investors, political connections and stock recommendations from sell-side analysts: The case of Malaysia. J. Account. Emerg. Econ. 2023, 13, 450–483. [Google Scholar] [CrossRef]
- Dzenopoljac, V.; Yaacoub, C.; Elkanj, N.; Bontis, N. Impact of intellectual capital on corporate performance: Evidence from the Arab region. J. Intellect. Cap. 2017, 18, 884–903. [Google Scholar] [CrossRef]
- Tiwari, R.; Arora, A. Moderating role of gender diversity in the relationship between intellectual capital efficiency and corporate performance. Int. J. Product. Perform. Manag. 2025, 74, 544–563. [Google Scholar] [CrossRef]
- Ghosh, S.K.; Maji, S.G. Empirical validity of value added intellectual coefficient model in Indian knowledge-based sector. Glob. Bus. Rev. 2015, 16, 947–962. [Google Scholar] [CrossRef]
- Wooldridge, J.M. Econometric Analysis of Cross Section and Panel Data, 2nd ed.; MIT Press: Cambridge, MA, USA; London, UK, 2011. [Google Scholar]
- Hansen, L.P. Large sample properties of generalized method of moments estimators. Econom. J. Econom. Soc. 1982, 50, 1029–1054. [Google Scholar] [CrossRef]
- Baltagi, B.H. Econometrics; Springer: Cham, Switzerland, 2023. [Google Scholar]
- Farooque, O.A.; Al Obaid, R.; Khan, A. Does intellectual capital in Islamic banks outperform conventional banks? Evidence from GCC countries. Asian Rev. Account. 2023, 31, 805–831. [Google Scholar] [CrossRef]
- Abdulhaq, A.S.; Muhamed, N.A. Extent of corporate social responsibility disclosure and its determinants: Evidence from Kingdom of Saudia Arabia. South East Asia J. Contemp. Bus. Econ. Law 2015, 7, 40–47. [Google Scholar]
- Al-Bassam, W.M.; Ntim, C.G.; Opong, K.K.; Downs, Y. Corporate boards and ownership structure as antecedents of corporate governance disclosure in Saudi Arabian publicly listed corporations. Bus. Soc. 2018, 57, 335–377. [Google Scholar] [CrossRef]
- Gujarati, D.N.; Porter, D.C. Basic Econometrics, 5th ed.; Tata McGraw-Hill Education: New York, NY, USA, 2009. [Google Scholar]
- Kennedy, P. A Guide to Econometrics; John Wiley & Sons: Hoboken, NJ, USA, 2008. [Google Scholar]
- Qaderi, S.A.; Ghaleb, B.A.; Qasem, A.; Wan-Hussin, W.N. Unveiling the link between female directors’ attributes, ownership concentration, and integrated reporting strategy in Malaysia. Borsa Istanb. Rev. 2024, 24, 1031–1045. [Google Scholar] [CrossRef]
- Hansen, C.B. Generalized least squares inference in panel and multilevel models with serial correlation and fixed effects. J. Econom. 2007, 140, 670–694. [Google Scholar] [CrossRef]
- Su, H.-Y. Business ethics and the development of intellectual capital. J. Bus. Ethics 2014, 119, 87–98. [Google Scholar] [CrossRef]
- Barrena-Martinez, J.; López-Fernández, M.; Romero-Fernandez, P.M. Drivers and Barriers in Socially Responsible Human Resource Management. Sustainability 2018, 10, 1532. [Google Scholar] [CrossRef]
- Kleibergen, F.; Paap, R. Generalized reduced rank tests using the singular value decomposition. J. Econom. 2006, 133, 97–126. [Google Scholar] [CrossRef]
- Stock, J.; Yogo, M. Chapter 6: Asymptotic distributions of instrumental variables statistics with many instruments. In Identification and Inference for Econometric Models: Essays in Honor of Thomas Rothenberg; Cambridge University Press: Cambridge, UK, 2005; pp. 109–120. [Google Scholar]
- Arif, M.; Sajjad, A.; Farooq, S.; Abrar, M.; Joyo, A.S. The impact of audit committee attributes on the quality and quantity of environmental, social and governance (ESG) disclosures. Corp. Gov. Int. J. Bus. Soc. 2021, 21, 497–514. [Google Scholar] [CrossRef]
- Benlemlih, M. Corporate social responsibility and firm debt maturity. J. Bus. Ethics 2017, 144, 491–517. [Google Scholar] [CrossRef]
- Carey, P.; Liu, L.; Qu, W. Voluntary corporate social responsibility reporting and financial statement auditing in China. J. Contemp. Account. Econ. 2017, 13, 244–262. [Google Scholar] [CrossRef]
- Heckman, J.J. Sample selection bias as a specification error. Econom. J. Econom. Soc. 1979, 47, 153–161. [Google Scholar] [CrossRef]
- Hossain, A.T.; Kryzanowski, L. Political corruption and corporate social responsibility (CSR). J. Behav. Exp. Financ. 2021, 31, 100538. [Google Scholar] [CrossRef]
- Zaman, R.; Asiaei, K.; Nadeem, M.; Malik, I.; Arif, M. Board demographic, structural diversity, and eco-innovation: International evidence. Corp. Gov. Int. Rev. 2024, 32, 374–390. [Google Scholar] [CrossRef]
- Chen, H.; Liu, S.; Liu, X.; Wang, J. Do socially responsible audit firms provide higher audit quality? An investigation of corporate social responsibility activity in audit firms. Manag. Audit. J. 2023, 38, 206–240. [Google Scholar] [CrossRef]
- Garcia, J.; de Villiers, C.; Li, L. Is a client’s corporate social responsibility performance a source of audit complexity? Int. J. Audit. 2021, 25, 75–102. [Google Scholar] [CrossRef]
- Hainmueller, J. Entropy balancing for causal effects: A multivariate reweighting method to produce balanced samples in observational studies. Political Anal. 2012, 20, 25–46. [Google Scholar] [CrossRef]
Disclaimer/Publisher’s Note: The statements, opinions and data contained in all publications are solely those of the individual author(s) and contributor(s) and not of MDPI and/or the editor(s). MDPI and/or the editor(s) disclaim responsibility for any injury to people or property resulting from any ideas, methods, instructions or products referred to in the content. |
© 2025 by the authors. Licensee MDPI, Basel, Switzerland. This article is an open access article distributed under the terms and conditions of the Creative Commons Attribution (CC BY) license (https://creativecommons.org/licenses/by/4.0/).