Abstract
Amid the accelerating global transition toward a low-carbon economy, collaborative innovation within the new energy vehicle industry has emerged as a critical mechanism for advancing green technology diffusion and fostering industrial ecosystem sustainability. This study explores the evolutionary features of the cooperative network and the ways in which network embedding influences innovation performance by analyzing 2808 patents pertaining to battery technologies for new energy vehicles (NEVs) in China, which adopted the network embedding theory. The results show that (l) the innovation performance within China’s NEV battery technology innovation cooperation network exhibits significant variation, the industry is undergoing accelerated stratification, and a trend towards head concentration is evident; (2) network size amplifies the beneficial influence of structural holes and centrality on innovation performance; and (3) the mediating role of external knowledge search between network embeddedness and innovation performance is negatively moderated by relationship intensity. By extending the social network theory to the field of new energy vehicle batteries, this study reveals the special law of network embedding in the technology-intensive industry, elucidates the mediating mechanism of external knowledge search, and innovatively proposes the “innovation paradox” of relationship strength, confirming the innovation advantage of weak relationship cross-border reorganization in this field.
1. Introduction
Energy crises and environmental pollution are now worldwide issues, and all countries have pledged to limit carbon emissions and actively work toward low-carbon sustainable development in order to maintain our shared environment [1]. As an essential product of low-carbon, eco-friendly, energy-efficient, and environment-friendly technologies, new energy vehicles (NEVs) can effectively alleviate carbon emissions, environmental pollution, and energy shortages [2,3]. NEVs can have a 30–50% reduction in carbon emissions and a 50% improvement in fuel efficiency over conventional fuel vehicles [4]. Countries are also vigorously promoting NEVs globally through legislation and other measures, and the global sales of NEVs are expected to constitute nearly 20% of the total automobile sales by 2025. As the foremost global market for NEVs, China has established a leading position in policy support, infrastructure development, and consumer demands. In 2023, the Chinese market for NEV sales accounted for over 50% of the global market, with sales consistently ranking first globally for several consecutive years. Consequently, China represents an ideal sample region for investigating innovation within the NEV industry [5].
With the advent of a new wave of technical advancement, the NEV sector is well-positioned to play an integral part in boosting economic expansion [6]. As the “heart” of NEVs, the technological progress, performance improvement, and scale expansion of power batteries [7] are crucial to the growth of NEVs. China’s installed capacity and power battery manufacturing have been following the market trend for NEVs over the last few years [8], accelerating the product technology iteration, including all-solid-state batteries with a 40% cost reduction, pure electric vehicles with a power consumption of only 12 kWh/100 km, and the fifth-generation DM technology. However, there is still a bottleneck in the development of the current battery technology: range, battery life, charging speed, and battery recycling [9]. Three industry characteristics make it necessary to break through these technological bottlenecks, which heavily rely on outside knowledge: first, the cross-border nature of the technology necessitates the integration of multidisciplinary knowledge in subjects like electrochemistry, mechanical engineering, thermodynamics, and others; second, the industry’s energy density is increasing due to the rapid pace of technological iteration, which forces businesses to acquire cutting-edge technologies through patent mergers and acquisitions and industrial alliances; and third, because 73% of the world’s cobalt and 51% of its lithium deposits are concentrated in Australia and the Congo, the geographical monopoly of resources pushes manufacturers to set up knowledge-sharing arrangements with mining organizations in order to manage the supply risk.
Consequently, domestic enterprises must maintain a sense of urgency, foster continuous technological innovation, construct an open and mutually beneficial innovation ecosystem, and actively identify, engage with, and leverage external innovation resources [10]. Currently, China boasts over 7600 enterprises involved in the NEV battery sector. With organizational boundaries increasingly becoming blurred, exclusive reliance on solely its innovation is insufficient to meet competitive demands [11]. Transcending these boundaries and moving from an institutionalized to an open-innovation paradigm is therefore vital. Being an emerging innovation paradigm, open innovation emphasizes the transcendence of traditional closed innovation models, fostering innovation through active engagement with external resources.
In this context, the phenomenon of network embeddedness is particularly important. Network embeddedness is an essential source of corporate resources and knowledge [12,13]. The cooperative network-embedded innovation body can reduce the cost and risk of knowledge acquisition, rapidly accumulate heterogeneous knowledge, fully grasp the market’s present needs, and thus improve the probability of innovation success. Current research predominantly bifurcates network embedding into two dimensions for analysis: relational embedding and structural embedding. These dimensions are then examined independently to ascertain their perceived consequences on innovation performance. Most academics believe that relational and structural embeddedness favorably impact innovation performance when it comes to the relationship between network embeddedness and innovation performance [14,15,16]. However, some scholars believe an “inverted U-shaped” link exists between relational embeddedness and innovation performance, and structural embeddedness significantly impacts innovation performance [17]. Nevertheless, most of the existing network embedding studies center on the steady-state network of the traditional manufacturing industry, hardly explaining the dynamic contradictions in the field of new energy vehicle batteries.
Among them, external knowledge search, as a crucial link in the open innovation process, has been widely used by scholars in collaborative network research. Previous studies have emphasized that when individuals are anchored in a network, internal embeddedness and network centrality affect information access and, thus, external knowledge search [18]. In addition, many studies have devoted attention to the relationship between external knowledge search and innovation performance, and there are four main research perspectives. First, external knowledge search is an essential skill for organizations to acquire, utilize, and federate knowledge, which, in conjunction with internal knowledge, forms the basis of innovation [19,20] and accelerates the innovation process. Second, the search for external knowledge is resource-intensive, which does not favor corporate innovation and sustainable development [21]. The cost and degree of external knowledge search will affect innovation performance differently at different phases, and the relationship between the two shows a positive U-shaped or inverted U-shaped curve [22,23]. Some studies have attributed this variability of results to industry characteristics, data sources, indicator selection, measurement methods, etc. Nevertheless, current research has overlooked the connecting effect of external knowledge search in the association of network embeddedness and innovation performance.
The new energy vehicle batteries field presents a unique paradox, even though scholars generally concur that cooperative networks foster innovation. This is because, despite strong government encouragement, enterprise cooperation is growing quickly, but core technological innovation is still lagging behind the global advanced level. The “network prosperity–innovation lag” paradox highlights the following three theoretical blind spots that require attention: first, the development of technology-intensive industrial networks is not well understood; second, the “black box of conduction”, where network resources are converted into innovation output, is not well understood in the current research; and third, there are insufficient quantitative tools to influence network effects. In order to build a mediation model of “network embedding–external knowledge search–innovation performance”, this study uses social network analysis based on network embedding theory. It does this by examining the influence of network embedding on battery technology innovation performance, the mediating role of external knowledge search, and the moderating role of network size and relationship strength.
This study fills a gap in network research by systematically revealing the topology and dynamic evolution law of the technical cooperation network in the field of new energy automobile batteries, breaking through the boundaries of social network theory in traditional industries. Secondly, it builds a mediation and transmission model of “network embeddedness–external knowledge search–innovation performance” to elucidate the key mechanism of knowledge flow in open innovation ecology, offering a new analytical framework for technology innovation management. Lastly, it is empirically discovered that while too high relationship intensity causes the “innovation paradox” because of path locking, network scale produces the innovation amplification effect through resource pool expansion. This dichotomous discovery corrects the linear cognition of traditional network theory and gives businesses a basis for making decisions about how best to set up their innovation networks.
2. Theoretical Analysis
2.1. Cooperative Network Embeddedness and Innovation Performance
Granovetter (1985) was the one who initially established the fundamental analytical framework of network embeddedness, which included relational and structural embeddedness [24]. As defined, relational embeddedness emphasizes the quality and continuity of social capital as well as the trust and depth of interaction of direct connections. Its core lies in the exchange of resources through direct connections [25], while centrality directly reflects the number of connections between the innovation subject and other nodes, which is highly consistent with the “strong relational resource acquisition capability” emphasized by relational embeddedness. This perspective aligns with Coleman’s (1988) social capital theory, which posits that central nodes in closed networks cultivate trust through repeated interactions, establishing robust reciprocal mechanisms grounded in shared obligations and expectations [26].
Furthermore, centrality may precisely measure how well core nodes in the battery technology network integrate resources and collaborate on technical advancements, exposing the distribution of important players in the ecosystem. While firms occupying structural holes act as an intermediary that links two network participants who have no immediate relationship and have greater information benefits and resource management advantages, structural embeddedness, on the other hand, contributes greater consideration to the subjects in the ecosystem and places greater emphasis on network information dissemination and integrating connections [27], which is the theoretical mapping with structural embeddedness focusing on the “overall network location advantage”. Meanwhile, new energy vehicle battery technology, as a high-tech, possesses cross-industry collaboration needs, and structural holes can better characterize the resource control advantages of nodes. Hence, based on the binary division of embeddedness theory, this article chooses centrality and structural holes as the core indicators of relational embeddedness and structural embeddedness, respectively. Such a choice fits the dual-dependence characteristics of the new energy automobile battery industry on supply chain synergy (high centrality demand) and cross-technology integration (value of structural holes) at the same time.
- (1)
- Centrality and innovation performance
Centrality can be used to quantify the current condition and position of nodes in a system [28]. First, nodes with higher centrality in the network can establish and sustain relationships more easily and efficiently [29], boost the efficiency of resource conversion [30], and foster innovation [31] Second, nodes with higher centrality serve as hubs of knowledge paths in the network [32], thus maximizing the value of filtering and utilizing knowledge [33]. Furthermore, higher centrality usually represents higher network status, and when confronted with heterogeneous information, innovation subjects with higher status are more likely to adopt an open attitude and have a stronger incentive to process heterogeneous information [34]. Additionally, innovation subjects with higher centrality in the innovation network have higher visibility and are subject to more supervision by other innovation subjects in the innovation network. However, greater visibility also means that other innovation subjects will have higher expectations of them regarding their morality and skills, which can lead to the “Pygmalion Effect” [35]. Consequently, pro-social motivation is typically stronger among innovators who are more central in the innovation network, which enhances their innovation. Considering the analysis above, the following is proposed:
H1a.
Network centrality has a positive effect on innovation performance.
- (2)
- Structural holes and innovation performance
Nodes occupying structural holes bridge otherwise disconnected innovation entities, encompassing diverse perspectives. Non-redundant relationships, on the one hand, make it possible to access diverse information within the network [36] and supply for deeper technical innovation activities [37]. On the other hand, when the innovation body with structural flaws obtains important information, it can use selective information shielding to create obstacles to innovation, stopping the information from spreading and encouraging the growth of innovation activities [38]. Simultaneously, innovation subjects in a dominant position in the structural hole can lower the costs of innovation activities and lower operational risk with the aid of adequate innovation capital by using the information and control in the supply network to gain strong bargaining power in the transaction process [38].
H1b.
Structural holes have a positive effect on innovation performance.
2.2. The Mediating Role of External Knowledge Search
When an organization seeks, acquires, integrates, and applies outside information to discern opportunities or address issues in a chaotic setting, this threshold is referred to as an external knowledge search [39]. The degree of external knowledge search substantially affects the innovation performance of the organization, depending on whether the innovation subject is in a structural hole or network centrality position.
Firstly, knowledge search is an indispensable way for enterprises to acquire innovation resources [40], and the degree of network embeddedness in the technological innovation of new energy vehicle batteries will affect the ability of enterprises to acquire knowledge to achieve innovation within the enterprise, thus reducing the disadvantage of having only a single expertise [41]. Compared with edge nodes, nodes with a higher degree of centrality can significantly increase the exposure area and depth of the innovation subject’s access to external knowledge [42], enabling integration and full utilization of internal knowledge. Rich structural gaps increase the effectiveness of knowledge discovery by lowering the limitations of current collaborations [43]. These nodes are more inclined to adopt knowledge strategies to achieve their strategic goals [44], and the nodes establish positive relationships, promoting the long-term flow of information.
Secondly, given the knowledge-intensive nature of the industry, external knowledge acquisition constitutes a crucial pathway for acquiring valuable knowledge and achieving breakthrough innovations [45]. For one thing, external knowledge search increases the motivation and incentives for insiders to participate in and realize innovations [46], accelerates the integration and execution of internal and external resources, and enables the innovation subject to obtain the most advanced knowledge and promotes innovation [47]. For another, knowledge search increases the sensitive perception of external changes, improves the ability of enterprises to adapt to the market, customers, and the environment [48], and further enhances the ability of innovation subjects to explore external technologies and methods [49], thus increasing the added value of innovation and the level of industry chain integration.
Consequently, innovation entities occupying central positions and structural holes within the network are better positioned to conduct external knowledge acquisition, enhancing innovation performance. In light of the aforementioned data, this study suggests the following:
H2a.
External knowledge search of innovation subjects mediates between centrality and innovation performance.
H2b.
External knowledge search of innovation subjects mediates between structural holes and innovation performance.
2.3. Moderating Effect of Network Scale
The conceptualization of network size as a macro-level variable moderating node-level embedding effects finds robust theoretical grounding in multilevel analysis frameworks. As demonstrated by Snijders and Bosker (2012) in their multilevel modeling research, environmental variables at the network level systematically influence micro-level outcomes through resource availability and competitive dynamics [50]. This theoretical position receives empirical validation from Ahuja’s (2000) examination of technical collaboration networks, which revealed that network expansion simultaneously enhances non-redundant knowledge diversity and improves structural hole nodes’ information filtration efficiency through competition–collaboration equilibrium mechanisms [51]. Further reinforcing this perspective, Zaheer and Bell’s (2005) Environment–Capability Matching Theory establishes that network size—as a critical environmental contingency—directly determines nodal embeddedness efficacy [52] explaining how rapidly expanding networks amplify both the resource monopolization capacity of central nodes and the informational dominance of structural hole occupants.
The network size characteristic in the cooperative network reflects the resource richness of the innovation subject embedded in the rest of the organizational relationships. The larger network scale signifies a greater number of innovation entities within the network, which, in turn, facilitates the acquisition of competitive advantage [53]. The expansion of the network scale facilitates broader geographical and quantitative exchange and collaboration in knowledge and technology, thereby increasing the potential for heterogeneous resource acquisition and expediting the innovation process. Therefore, this research proposes the following:
H3a.
Network size positively moderates the relationship between centrality and innovation performance.
H3b.
Network size positively moderates the relationship between structural holes and innovation performance.
2.4. Moderating Effect of Relationship Intensity
- (1)
- The moderating role of relationship strength between external knowledge search and innovation performance
Aligned with Michelfelder and Kratzer’s (2013) theoretical framework, this study conceptualizes relationship strength as an independent moderating variable distinct from network embeddedness structures [54], i.e., relationship strength shapes innovation performance through knowledge redundancy mechanisms rather than positional network attributes. According to the traits of stability, quality, and trust in network organizational interactions, relationship strength can be categorized as either strong or weak relationships [55]. Weak relationships of innovative subjects help firms obtain heterogeneous information in the knowledge search process [40], thus promoting innovation. First, weak relationships can reduce the cost of maintaining relationships, and the innovation subject can establish more new relationships with the other innovation individuals in the community to increase the scope of its external knowledge search. Second, weak relationships are a bridge, reducing knowledge redundancy and making resource flows more efficient. Conversely, strong ties can lead to excessive informational homogeneity, limiting their ability to come up with fresh and practical ideas [56] and diminishing organizational flexibility [57]. Due to the above, this research proposes the following:
H4a.
Relationship intensity negatively moderates the relationship between external knowledge search and innovation performance.
- (2)
- The moderated mediation effect
The following hypothesis is put out in light of the aforementioned theories, which suggest that the strength of the association moderates the two paths of the mediating role of external knowledge search:
H4b.
The mediating function of external knowledge search in the link between centrality and innovation performance is negatively moderated by relationship strength. The greater the relationship strength, the weaker the mediating role of external knowledge search in the relationship between centrality and innovation performance.
H4c.
The mediating function of external knowledge search in the link between structural holes and innovation performance is negatively moderated by relationship strength. The greater the relationship strength, the weaker the mediating role of external knowledge search in the relationship between structural holes and innovation performance.
The theoretical model is shown below (Figure 1).
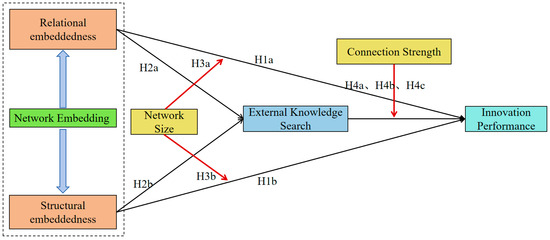
Figure 1.
Theoretical model diagram. (note: red clippings represent direct effects, black arrows represent indirect effects, and blue clippings represent inclusion relationships).
3. Materials and Methods
3.1. Data Sources and Processing
3.1.1. Data Sources
Joint patent applications highlight the integration of technical knowledge in patent cooperation [58], and academics have widely recognized that cooperative innovation networks can be constructed through joint patent application data. Given that patents for inventions, characterized by their novelty, inventiveness, and utility, possess a high degree of technical sophistication, they can effectively represent future development trends and measure the technological innovation capacity of patent applicants. Consequently, drawing upon existing research [59], this research utilizes joint invention patent application data as the foundation for network construction.
This research utilizes the patent search function in the Incopat database (https://www.incopat.com/) to search for domestic patents related to NEV battery technology by inputting the following search term: TIAB = ((new energy vehicle OR new energy automobile OR battery electric vehicle OR battery electric automobile OR pure electric vehicle OR pure electric automobile OR hybrid electric vehicle OR hybrid electric automobile OR plug-in hybrid electric vehicle OR fuel cell electric vehicle OR fuel cell electric automobile) AND (battery)). Since there were only 61 cooperative patents before 2008, excluding nearly 20 patents filed in the name of individuals, only 41 patents remain, which are of little research value. Before 2007, China’s power lithium battery industry had not yet entered the industrialization stage, mainly R&D activities, and substantive cooperation between enterprises had not yet been formed. Consequently, the temporal scope of this research encompasses the period from 2008 to 2023. An extensive search, predicated on the aforementioned search parameters, yielded a total of 39,654 Chinese invention patent applications within this timeframe. From this initial dataset, 3179 joint patent applications were extracted. Following the exclusion of patents filed by independent applicants, the final dataset comprised 2808 joint patent applications.
3.1.2. Network Construction
To address the empirically established “time-lag effect” in technological collaboration outcomes, where measurable innovation impacts typically manifest 3–5 years post-initial cooperation [60]. In addition, in China, the “Ten Cities, Thousand Vehicles” project was launched in 2009, the Energy Saving and New Energy Vehicle Industry Development Plan was enacted in 2012, and the “Double Integral Policy” was launched in 2017, etc. Given the effect of the pilot policies on co-innovation [61], a 4-year timeframe makes it easier to see the notable distinctions between before and after implementation. Thus, this research divides the period of 2008–2023 into four periods: 2008–2011, 2012–2015, 2016–2019, and 2020–2023 to construct cooperative innovation networks based on common patent applicants in patent information. As in Figure 2, the original data are converted into an edge list through data processing and then imported into Ucinet 6.0 to generate a 0–1 matrix, in which “1” signifies that there is a cooperative relationship between the candidates, while “0” denotes the absence of such a relationship. Then, it is imported into Gephi0.9.2 to generate the cooperation network diagram between applicants, where the connection line indicates a connection between two nodes, and the degree of collaboration is indicated by the thickness of the connection line.
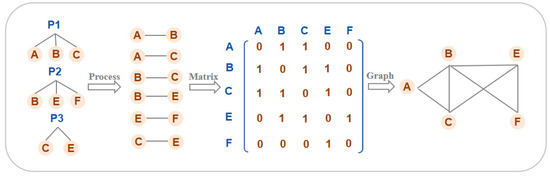
Figure 2.
Schematic diagram for modeling of cooperative innovation network.
3.2. Data Analysis
3.2.1. Changes in Joint Patent Applications
Joint patent applications are vital for major innovation subjects to reduce R&D costs and complement information resources. As shown in Figure 3, since 2008, the total amount of cooperative patent applications has generally risen, and the fitting function of the trend line is y = −49,477.2 + 24.6368x. In response to the detrimental effects of the banking crisis of 2008, the overall number of collaborative patent applications decreased in 2009. After 2009, the number of joint patent applications rose substantially, and in recent years, the upward trend has become increasingly evident. The upward trend is undeniable in recent years.
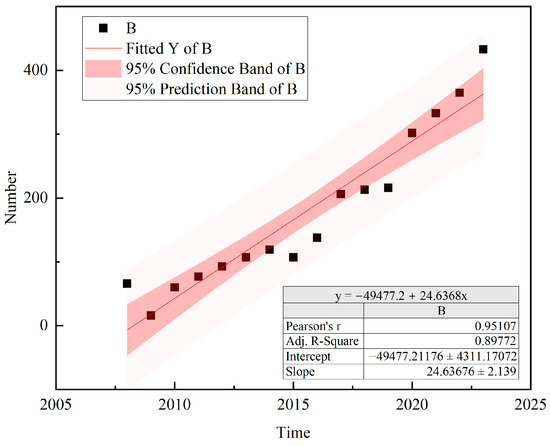
Figure 3.
Joint patent application change graph from 2008 to 2023.
3.2.2. Evolution Diagram of Cooperative Innovation Network
The network diagram of innovation cooperation subjects in four periods is drawn by taking patent applicants as nodes and cooperation relations between patent applicants as connecting lines. The scale of each innovative subject’s cooperation network in the field of NEV battery technology has progressively grown, as shown in Figure 4. A fixed network connected by multiple subjects began to be formed in 2008–2011, and a small-group network with multiple cooperation frequencies was formed in 2012–2015. The scale of the cooperation subjects has gradually expanded. Especially after 2016, the number of innovative subjects in the network and the connection lines are growing explosively.
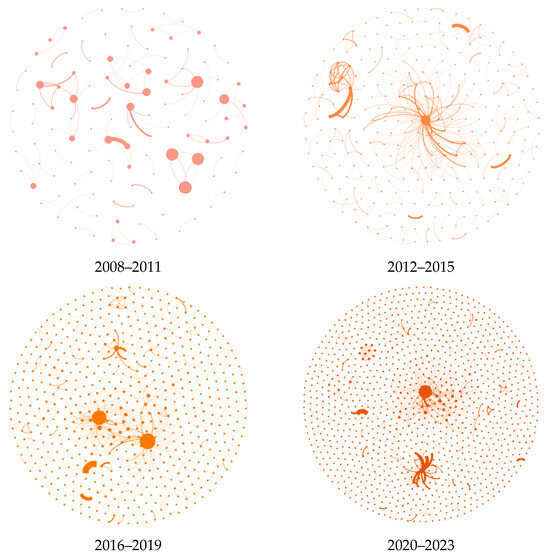
Figure 4.
NEV battery technology network cooperation evolution graph, 2008–2023. (note: The nodes in the graph represent the applicants in the network and the node size represents the size of the applicant degree in the network).
3.2.3. Evolutionary Characteristics of Cooperative Innovation Networks
The structure and features of China’s NEV battery technology patent collaboration network are examined in this study using a number of statistical indicators, including the number of nodes, the number of edges, network density, average path length, and clustering coefficient. As illustrated in Figure 5, between 2008 and 2023, the innovation network exhibited substantial structural evolution, characterized by progressive diversification among core participants and a marked shift toward decentralized connectivity patterns. The “Double Credits” policy implemented in 2017 triggered significant network expansion, with node count and connection lines experiencing exponential growth, much like the regulatory effect Wang et al. (2024) found in their study on pollution abatement [62]. Concurrently, the systematic analysis revealed a paradoxical density decline, demonstrating an inverse relationship between innovative entity proliferation and network cohesion intensity. The average degree of the network grows from 1.744 to 2.037, and the connection between innovation subjects is slowly increasing, but the overall structure still tends to be loose. The average path length increases from 1.571 to 3.097, and the average distance between innovation subjects increases. The clustering coefficient declined in slow fluctuation, increased during 2012–2015 due to the emergence of individual cliques, and then continued to decline, indicating that the cohesion of the network became lower and the overall looser. From the perspective of the overall evolution of the network, the NEV battery technology cooperation network does not have the characteristics of a “small world”.
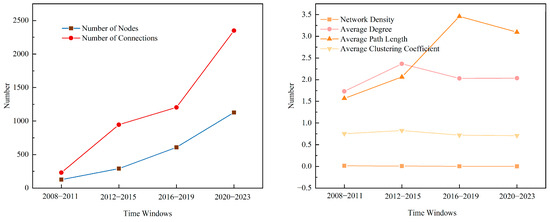
Figure 5.
Evolution of network characterization metrics.
3.3. Empirical Sample and Model Selection
3.3.1. Empirical Samples
We selected innovation subjects, such as enterprises, universities, and research institutes, in the already constructed cooperative innovation network in Section 3.2.2 for empirical analysis. Only 45 innovation subjects existed simultaneously during 2008–2011 and 2012–2015. Taking notice of the adequacy of the data and the credibility of the consequence, the data from 2016–2019 and 2020–2023 were selected for empirical analysis. There were 2206 joint invention patent applications for NEV battery technology from 2016 to 2023, including 1542 applicants. Considering the entry and exit of nodes, nodes with network neutrality of at least 1 in each time window are selected for empirical study, and a total of 192 innovation subjects are screened.
3.3.2. Variable Measures
- (1)
- Explained variables
Scholars frequently evaluate a certain number of patent applications to gauge innovation performance. This study utilizes the volume of invention patent applications as an indicator of innovation performance, given that Zhu and Hu (2021) argued that the number of patents is a feasible, reasonable, and limited way to assess the technological innovation performance of corporations in terms of the number of innovations and the economic value of the two dimensions [63].
- (2)
- Explanatory variables
- Network Centrality (NC)
The value of nodes that are intimately connected to a certain node is known as centrality, and it describes how much a node is at the core of a network. Degree centrality, the most widely employed metric for assessing centrality in social network analysis [58], indicates how many direct connections it has with other nodes in the overall network. Relative point degree centrality is employed to evaluate the network centrality of nodes, while point degree centrality of nodes is not identical due to changes in network size and other factors. Its calculation formula is as follows:
where node i’s relative degree centrality is denoted by NCi, while its point degree centrality and absolute degree centrality are indicated by DCi, which is the number of nodes that are connected to node i. The size of the network, which is also the number of nodes, is marked by n.
- b.
- Structure Hole (SH)
In this research, we utilize the effective scale to quantify the amount of structural gaps in the cooperative network’s inventive subjects, drawing from the work of Hao et al. (2022) [64]. Its calculation formula is as follows:
where j is all the points related to node i, q is a node that includes neither i nor j, and Piq is the percentage of the association between node i and q, and PiqMjq represents the redundancy between the point and a specific point.
- (3)
- Mediation variables
Referring to the study of Wang et al. (2017), we utilize the number of citations of patents filed by an innovation subject to measure the level of external knowledge search of the innovation subject [65]. KS indicates the aggregate of citations of invention patents filed by an innovation subject in this time window.
- (4)
- Modulating variables
- Network Size (NS)
According to Wang et al. (2018), network size is the assortment of nodes that have access to other members [66], which is determined by the total number of nodes. Therefore, we measure it using the total number of nodes in the network.
- b.
- Relationship Intensity (RI)
The average quantity of close ties to the organization is what determines the strength of the innovation network relationship [42]. Drawing on the calculation of existing studies, the number of connection lines between innovation subject i and each of the remaining innovation subjects j is calculated, and then the arithmetic average of the sum of the number of connection lines between that innovation subject and the innovation subjects to which it is connected is calculated. Its calculation formula is as follows:
- (5)
- Control variables
Since the duration of the innovation subject’s establishment may have a consequence on innovation performance, this study primarily chooses the age of the innovation subject (Age) as the control variable, i.e., the difference between the year of the innovation subject from the year of establishment to the last year of the time window in which the observation is located. Furthermore, the model controls for time-invariant and individual-invariant unobservable factors to mitigate the potential impact of unobserved heterogeneity.
3.3.3. Model Selection
In this study, the volume of patent applications an entity receives each year is a measure of its innovation performance. Count data models are theoretically appropriate, considering that the annual patent application volume is a non-negative integer. The Poisson and negative binomial regression models are the most prevalent models for this data type. The mean of innovation performance is 15.04, the variance is 1132.73, the skewness is 4.57 (greater than 0), and the kurtosis is 27.11 (much greater than 3), which suggests that the data from the innovation performance sample are not distributed normally and do not conform to the conditions of OLS regression estimation; therefore, linear regression does not apply to this study. Negative binomial regression extends the Poisson model by incorporating a disturbance term for overdispersion. Poisson regression assumes that the conditional mean of the event equals its conditional variance, a condition known as equidispersion. However, in this analysis, the dependent variable’s mean and variance are unequal, indicating overdispersion. In addition, in this study, the variance of the dependent variable is much larger than the mean, indicating that the greater the difference between the data, the higher the degree of dispersion, so this research uses negative binomial regression for the relevant empirical analysis. In addition, the data in this research are panel data, which need to be tested by the Hausman test, and the test result p-value is 0.0357, which is less than 0.1, so the regression model in this research is a negative binomial regression fixed effect model.
3.3.4. Model Design
According to the conceptual model constructed in this research, the relevant regression model is established, and the model is set as follows:
- (1)
- Benchmark and mediated effect models
Equations (4) and (5) are the baseline regressions, and Equations (6)–(9) are the mediating effect models of centrality and structural holes, respectively. Among them, IPit represents innovation performance; NCit and SHit are the core explanatory variables; KSit is the mediator variable; and Ageit is the control variable. ui is the individual fixed effect; λi is the annual fixed effect. If β1 is significant, it indicates that network centrality can improve innovation performance. If φ1 is significant, it may suggest that network centrality and external knowledge search have a strong positive relationship. If φ1 and γ2 are significant, and γ1 is also significant, there is some mediation; if φ1 and γ2 are significant, but γ1 is not significant, then there is complete mediation. The same can be seen for the mediating model of structural cavities.
- (2)
- Moderating effect models and moderated mediators
- Network size
Equations (10) and (11) are moderating models of network size between centrality and structural holes and innovation performance, respectively. If α3 and α7 are both significant, it suggests that network size has a direct moderating effect on innovation performance in relation to centrality or structural holes.
- b.
- Relationship strength
Equations (12) is a moderating model of relationship intensity between external knowledge search and innovation performance, and if θ3 is significant, it implies the severity of the association between innovation performance and external knowledge search has a direct moderating role.
This research draws on the test method proposed by Wen and Ye (2014) to design a model of moderated mediating effect [67]:
Equations (13)–(16) test the moderating and mediating role of relationship strength between network centrality and innovation performance. If π3 is significant, the test of Equation (16) is performed, and if it is not significant, the test of Equation (15) is performed. In the test results, if e1 and p4 are significant, the relationship strength plays a moderating and mediating role in the second half of the network centrality–external knowledge search–innovation performance. Likewise, the verification of structural cavities can be carried out by Equations (17)–(20). Ucinet was used to calculate the individual characteristic index in the structure of the joint innovation network, and Stata 18.0 for regression analysis, and the variables were reduced to 1% and 99% deciles.
4. Results
4.1. Sample Data Analysis
4.1.1. Descriptive Statistical Analysis
According to Table 1, the results indicate substantial variation in the innovation performance of each innovation subject, as evidenced by the dependent variable innovation performance’s mean value of 15.036, standard deviation of 33.656, and variation in the maximum and minimum values of 238. The degree centrality of the network nodes is less distinct, and the overall level of centrality is lower, as indicated by the independent variable centrality’s mean value of just 0.004 and standard deviation of 0.004. There is less differentiation among the nodes regarding the sum of structural holes, as shown by the mean value of 2.302 with a standard deviation of 2.783. There is a significant variation in the network’s nodes’ external knowledge searchability, as evidenced by the mean value of 71.084 and the large standard deviation of 153.094, with a difference of 1004 between the least and maximum values. The network’s relationship strength is low overall, given an average of 2.77 and a variance of 3.858, suggesting minimal variation in the intensity of the relationships between individual nodes. The overall total of nodes in the two time periods doubles, and the scale is growing, as indicated by the network size mean of 867.5 and the 519 gap between the maximum and smallest values. The sample is more representative since the mean age of innovation subjects is 38.240 years, with a 160-year disparity between the highest and lowest points. This suggests that the time when innovation subjects were established in the sample varies widely.

Table 1.
Statistical indicators for variables.
4.1.2. Correlation Analysis
The variables in this study’s correlation coefficients are displayed in Figure 6a, and the vast majority of the variables have correlation coefficients in the range of 0.7, indicating no multicollinearity. However, the correlation coefficient between centrality and structural holes is notably high (0.93), which can be attributed to the tendency of nodes with high centrality to span diverse associations or sub-networks, thereby connecting to a greater variety of nodes. To further clarify whether there is multicollinearity between the variable structural holes and centrality, this research carries out variance inflation factor detection. As depicted in Figure 6b, the maximum VIF value among the variables is 6.99, every VIF number is less than 10, and the mean VIF is 3.14. Multicollinearity is generally deemed to exist when VIF values exceed 10.
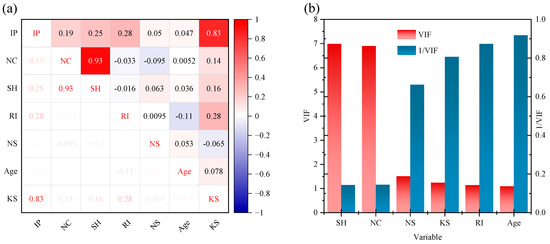
Figure 6.
Correlation analysis graph. (note: (a) Correlation heat map. The results of the graph indicate the correlation between the variables. (b) Variance inflation factor histogram. The results in the graph represent the VIF values of each variable).
4.2. Empirical Results
4.2.1. Total Effect Test
Regression Models 4, 5, and 6 are created regarding innovation performance as the dependent variable in order to explore the impact of centrality and structural flaws on innovation performance. Model 5 incorporates the independent variable centrality based on Model 4, and Model 6 adds the independent variable structural holes based on Model 4, but just one control variable—the age of the innovation body—is added to Model 4, as seen in Table 2. According to the findings, when the independent factors were added, the significance level of the control variables’ impact on innovation performance went from 5% to 10% and non-significant, respectively.
Table 2.
Regression results of total and mediation effects.
Centrality has shown an enormous beneficial effect on innovation performance (β of 0.8366) and passed the significance test (p < 0.01). This implies that more central nodes in the innovation network are more likely to generate innovation performance. Thus, the hypothesis H1a is validated.
Additionally, structural flaws boost innovation performance (β of 0.1007) and pass the significance test (p < 0.01). It reveals that nodes filling structural holes can more easily access heterogeneous resources and information from other nodes, which enhances innovation performance, and hypothesis H1b is verified.
4.2.2. Robustness Test
The robustness of the total effects regression results is checked using the following methods: (1) To regress and alter the explanatory variables. Comprehensive technical innovation input (R&D) indicators include invention patents and utility models. The quantity of invention patents and utility model patent applications are substituted for the explanatory variables to account for any impact of utility model patents on innovation performance. (2) Decreased sample regression for estimation. Foreign companies were not included in the sample, in accordance with established procedures. (3) The initial fixed-effects model was modified to include regional fixed-effects regression. International firms were divided into East, Central, and West areas based on their investment and operational distribution within China to reduce the impact of unobservable, region-specific factors on the estimation results.
The above results are shown in Table 3. The findings of the total effects benchmark regression exhibit strong resilience, as evidenced by the three robustness tests’ results agreeing with the total effects regression’s findings and the regression coefficients’ all being positive at the 1% significance level.
Table 3.
Robustness test results.
4.2.3. Mediator Effect Test
Models 2, 4, 5, and 7 are built as indicated in Table 2 to test the mediating function of external knowledge search in centrality and innovation performance. Model 2 investigates the positive effect of centrality on external knowledge search (β = 0.7372, p < 0.01), suggesting that nodes with higher centrality can access relevant resources through external knowledge search. Model 4 is the result when only control variables are added. Model 5 incorporates the independent variable centrality to Model 4, and Model 7 adds the mediator variable to Model 5. The outcomes from Model 5 to Model 7 show that the degree of influence of the independent variable centrality on performance in innovation reduces from 0.8366 (p < 0.01) to 0.6092 (p < 0.01), and external knowledge search passes the 1% significance level test, suggesting that external knowledge search partially mediates between centrality and innovation performance. H2a is verified.
Models 3, 4, 6, and 8 are built to evaluate the mediating role of external knowledge search in structural holes and innovation performance. Model 3 examines the beneficial impact of structural holes on the external knowledge search. Model 6 adds the independent variable structural holes based on Model 4, and Model 8 adds the mediating variable following Model 6. According to the test findings, the effect of structural holes on innovation performance before and after adding the mediating variable is reduced by nearly 20%, and the p-value is less than 0.01. At the 1% level, external knowledge search is likewise significant, implying that it partially mediates the relationship between innovation performance and structural gaps, and H2b is confirmed.
4.2.4. Moderating Effect Test
- (1)
- The moderating effect of network scale
This research introduces network size as a moderating variable, centrality and structural holes decentered with network size, and interaction terms are constructed to eliminate the covariance problem. The results in Table 4, Model 1, and Model 2 show the effects of centrality, structural holes, and network size on innovation performance without adding the interaction term. The regression outcome of the centrality and network size interaction term on innovation performance is shown in Model 3. The network size possesses a beneficial moderating impact between centrality and innovation performance, as indicated by the regression coefficient of the correlation term β = 0.0397 (p < 0.01). The greater the network size, the more strongly centrality influences innovation performance in a favorable manner, and H3a is supported. Model 4 displays a regression analysis of the interaction between network size and structural holes on innovation performance. The interaction term’s regression coefficient is 0.0041 (p < 0.1), demonstrating that network size regulates the connections between structural holes and innovation performance positively and supports H3b.
Table 4.
Regression results of moderating effects of the network size.
- (2)
- The moderating effects of relationship intensity
This research decentralizes the search for external knowledge and relationship strength, adds relationship strength as a moderator variable, and creates an interaction term to solve the covariance issue, as shown in Table 5. Without including the interaction term, Model 3 displays the implications of relationship strength and outside knowledge hunt on innovation efficacy. The findings indicate that both factors positively affect innovation performance, with β values of 0.0418 and 0.0017, respectively, and are of significance at the 1% level. The coefficient of the effect of external knowledge search on innovation performance is 0.0024 (p < 0.01) after the interaction term is added, and the resulting coefficient of the involvement term is −0.0013 (p < 0.01). Relationship strength negatively moderates the positive effect of exterior knowledge-seeking and innovation performance, supporting H4a.
Table 5.
Regression results of moderating effects of the relationship strength.
In this research, we test the moderated mediation effect based on the previous model design through the following steps: Step (1): Perform the regression of innovation performance on network embeddedness (centrality or structural holes) and the interaction term of network embeddedness and relationship strength, and determine whether cross-term coefficients are significant or not. Step (2): Perform the regression of external knowledge search on network embeddedness (centrality or structural holes) and the interaction term of network embeddedness with relationship strength, and determine whether the coefficients of centrality and structural holes are significant. Step (3): If the cross-term coefficients in Step (1) are significant, use the Model A: innovation performance on network embeddedness (centrality or structural holes), relationship strength, the interaction term of network embeddedness with relationship strength, external knowledge search, and the interaction term of relationship strength with external knowledge search regression to determine whether the cross-term coefficient of relationship strength with external knowledge search is significant. If the cross-term coefficient in Step (1) is not significant, then use Model B: regression of innovation performance on network embeddedness (centrality or structural holes), relationship strength, external knowledge search, and the interaction term of relationship strength with external knowledge search is used to determine whether the coefficient of the interaction term of relationship strength with external knowledge search is significant. When the coefficients in Steps (2) and (3) are significant simultaneously, it means that moderation has a significant mediating effect.
The results are shown in Table 5. Models 1, 5, and 6 are used to test H4b. The Model 5 interaction term coefficient is significant (β = 0.2079, p < 0.1), using Model A for the regression test in Step (3): the Model 1 centrality coefficient is significant (β = 0.8509, p < 0.01), the interaction term coefficient of the external knowledge search and relationship strength in Model 6 is also significant (β = −0.0015, p < 0.01), and the empirical data support H4b. Models 2, 7, and 8 are used to test H4c; the interaction term coefficient of Model 7 is not significant (β = 0.0261, p > 0.1), and the regression test of Step (3) is conducted using Model B: the coefficient of structural holes in Model 2 is significant (β = 0.1168, p < 0.01), and the innovative performance of external knowledge search and relationship strength in Model 8 is significant (β = −0.0012, p < 0.01). H4c is supported by empirical data.
5. Discussion
This study reveals the unique mechanism of innovation network embedding in the intensive industry of new energy vehicle battery technology, while the important findings of this study complement the existing theories.
Firstly, this study innovatively verifies the applicability of network embedding theory in the field of new energy vehicle battery technology and reveals the special law of innovation networks in technology-intensive industry. This study finds the positive synergistic effect of centrality and structural holes on innovation performance, and the positive effect of centrality on innovation performance is higher than that of structural holes (regression coefficients are 0.8366 and 0.1007, respectively), which suggests that utilizing the ability of resource control to rapidly integrate knowledge in the field of new energy automobile battery technology accelerates enterprise innovation faster than occupying structural holes to acquire heterogeneous knowledge, which is consistent with the results of most of the current studies [68]. We also discovered that having a larger network positively influences how centrality and structural holes affect innovation performance in new energy vehicle batteries, meaning that adding one more partner can boost the impact of both by 3.97% and 0.41%, showing the benefits of having more connections for integrating different types of knowledge in technology-focused industries.
Secondly, unlike traditional social network theory that emphasizes the knowledge transfer advantages of strong relationships [40], we find that there is a “relationship strength paradox” in the field of new energy vehicle batteries. Just as the manufacturer-dominated game in supply chain finance inhibits service quality [69], this study’s strong relational embeddedness leading to declining patent performance reveals a similar power distortion effect. For every unit increase in relationship strength, the marginal effect of external knowledge search on innovation performance decreases by 0.13 percent, and the mediating effect of external knowledge search between centrality, structural holes, and innovation performance decreases by 0.15% and 0.12% correspondingly. Most of the existing studies show that the higher the strength of the collaborative relationship between partners, the higher the degree of firms’ participation in regular collaborative R&D activities [70]. This article reverses the existing view, a finding that complements Ahuja’s (2000) theory of alliance networks, which states that “many of the resources and capabilities that can provide firms with a competitive advantage reside precisely in the relationships between firms” [51], and amends Park and Russo’s (1996) suggestion that “firms fail in large part because the parties to the firm compete with each other outside of cooperation” [71]. At the same time, this contrasts with the law of marginal incremental relationship strength found by Rowley et al. (2000) in traditional manufacturing and reaffirms the hypothesis that knowledge reorganization in technology-intensive industries requires wider cooperation [72].
6. Conclusions and Implications
6.1. Conclusions
In the context of sustainable development and innovation-driven strategy, we analyzed the evolutionary characteristics of the NEV battery technology network using social network analysis and explored the influence mechanism between network embedding and innovation performance utilizing statistical analysis. The study conclusions are as follows: first, the evolution of innovation cooperation network generally presents the characteristics of multiple subjects, loose connection, and large differences in innovation performance; second, the overall test shows that there is a significant positive correlation between network embeddedness and innovation performance; third, the mediation effect shows that network embeddedness positively influences the innovation performance through the external knowledge search; and fourth, the binary regulating mechanism shows that the network scale expands the positive correlation between network positive relationship between network embedding and innovation performance, while relationship strength constrains the mediating effect of external knowledge search between network embedding and innovation performance.
6.2. Practical Implications
Firstly, the “three-circle” approach is used for building a network. The middle circle extends to universities and scientific research institutes and creates a patent-sharing pool; the peripheral circle includes diverse subjects like material suppliers and energy enterprises; and the core circle concentrates on forging strategic alliances with head enterprises (e.g., Ningde Times and BYD) and achieving technology co-development through joint laboratories. The network dynamic assessment mechanism is also established to balance the risk of centralizing the network structure. When the core nodes are over-aggregated, the activation plan for edge nodes is initiated, which includes luring start-ups to engage in technological research through the mechanism of “unveiling the list of commanding officers”.
Secondly, a differentiated network embedding strategy should be implemented. On the one hand, it focuses on consolidating the core position of the industrial chain, deepening strategic cooperation with industry leaders by taking the lead in formulating industry technical standards, and building a patent system covering key materials and systems integration. At the same time, it aims to focus on cross-field technology integration, lay out the cutting-edge direction with artificial intelligence, energy management, and other cross-cutting fields, and set up a special team to dock with scientific research institutions and innovative enterprises. On the other hand, establish a clear cooperation mechanism, use major resources to enhance the technological influence of the industrial alliance, set aside part of the resources to explore collaborative innovation in emerging fields, and continuously enhance its technological leadership by dynamically optimizing the cooperation network, taking into account both technological deepening and cross-border breakthroughs.
Thirdly, an effort must be made to create a framework for exchanging knowledge. To encourage the flow, sharing, and circulation of knowledge, innovation subjects should, on the one hand, realize the sharing of patented technologies, the sharing of core components, external supply, joint product research and development, etc., through the creation of a knowledge base and a technical knowledge-sharing platform. Conversely, use the contractual arrangement to build enduring partnerships with other businesses, academic institutions, and scientific research centers in the sector; create a collaborative innovation mechanism among industry, academia, and research institutions; and expand the scope and channel of knowledge search.
Fourthly, innovate dynamic governance models of relationship strength. Four sorts of cooperative partnerships have been established through the implementation of a “relationship spectrum” management strategy: strategic, project-based, exploratory, and temporary. For strategic relationships, an “innovation isolation period” is set up to regularly assess the degree of technological isomerization, and when patent similarity reaches a certain level, it is mandatory to bring in a third-party organization to conduct a technology audit. Implement a pilot mechanism for exploratory relationships, and decide whether to upgrade to project-based cooperation through joint technology testing. Establishing a weak relationship activation fund is dedicated to supporting cross-border cooperation. At the same time, a relationship health index is constructed to dynamically optimize the relationship by taking into account the dimensions of knowledge novelty and resource complementarity.
6.3. Limitations and Future Studies
This study has a few limitations that should be taken into account for subsequent investigations. First, the data for the empirical study carried out in this research are only available for two time windows because of the entry and exit of innovation subjects. Future research can split the life cycle of innovation subjects, increase the number of innovation subjects taking part in the empirical study, and broaden the scope of the data. Second, the high-dimensional system of HJB equations made up of network embedding metrics and external knowledge searches in this study can be jointly solved by future research using the deep Galerkin method [73] suggested by Wang et al. (2024), which will better capture the dynamic evolutionary features of innovation networks.
Author Contributions
D.L.: conceptualization, methodology, visualization, software, writing—original draft, and writing—review and editing. L.L.: conceptualization, investigation, formal analysis, visualization, writing—original draft, and writing—review and editing. W.L.: conceptualization, investigation, formal analysis, visualization, software, supervision, validation, resources, and writing—review and editing. All authors have read and agreed to the published version of the manuscript.
Funding
The authors gratefully acknowledge financial support from the National Social Science Foundation of China (Grant No. 22BJY128).
Institutional Review Board Statement
Not applicable.
Informed Consent Statement
Not applicable.
Data Availability Statement
The raw data supporting the conclusions of this article will be made available by the authors upon request.
Conflicts of Interest
The authors declare no conflicts of interest.
Abbreviations
The following abbreviations are used in this manuscript:
| NEVs | new energy vehicles |
References
- Zhang, Z.; Hu, G.; Mu, X.; Kong, L. From low carbon to carbon neutrality: A bibliometric analysis of the status, evolution and development trend. J. Environ. Manag. 2022, 322, 116087. [Google Scholar] [CrossRef] [PubMed]
- Liu, Z.; Hao, H.; Cheng, X.; Zhao, F. Critical issues of energy efficient and new energy vehicles development in China. Energy Policy 2018, 115, 92–97. [Google Scholar] [CrossRef]
- Su, C.-W.; Yuan, X.; Tao, R.; Umar, M. Can new energy vehicles help to achieve carbon neutrality targets? J. Environ. Manag. 2021, 297, 113348. [Google Scholar] [CrossRef] [PubMed]
- Yuan, X.; Liu, X.; Zuo, J. The development of new energy vehicles for a sustainable future: A review. Renew. Sustain. Energy Rev. 2015, 42, 298–305. [Google Scholar] [CrossRef]
- Jiang, Z.; Xu, C. Policy incentives, government subsidies, and technological innovation in new energy vehicle enterprises: Evidence from China. Energy Policy 2023, 177, 113527. [Google Scholar] [CrossRef]
- Khan, K.; Su, C.W.; Rehman, A.U.; Ullah, R. Is technological innovation a driver of renewable energy? Technol. Soc. 2022, 70, 102044. [Google Scholar] [CrossRef]
- Feng, Z.; Luo, N.; Shalpegin, T.; Cui, H. The influence of carbon emission reduction instruments on blockchain technology adoption in recycling batteries of the new energy vehicles. Int. J. Prod. Res. 2024, 62, 891–908. [Google Scholar] [CrossRef]
- Zahoor, A.; Yu, Y.; Zhang, H.; Nihed, B.; Afrane, S.; Peng, S.; Sápi, A.; Lin, C.J.; Mao, G. Can the new energy vehicles (NEVs) and power battery industry help China to meet the carbon neutrality goal before 2060? J. Environ. Manag. 2023, 336, 117663. [Google Scholar] [CrossRef]
- Dehghani-Sanij, A.R.; Tharumalingam, E.; Dusseault, M.B.; Fraser, R. Study of energy storage systems and environmental challenges of batteries. Renew. Sustain. Energy Rev. 2019, 104, 192–208. [Google Scholar] [CrossRef]
- Radziwon, A.; Bogers, M. Open innovation in SMEs: Exploring inter-organizational relationships in an ecosystem. Technol. Forecast. Soc. Change 2019, 146, 573–587. [Google Scholar] [CrossRef]
- Wilhelm, M.; Dolfsma, W. Managing knowledge boundaries for open innovation—Lessons from the automotive industry. Int. J. Oper. Prod. Manag. 2018, 38, 230–248. [Google Scholar] [CrossRef]
- Soniewicki, M.; Hauke-Lopes, A. Network Embeddedness and Company Competitiveness. J. Comput. Inf. Syst. 2023, 65, 344–359. [Google Scholar] [CrossRef]
- Uzzi, B.; Gillespie, J.J. Knowledge spillover in corporate financing networks: Embeddedness and the firm’s debt performance. Strateg. Manag. J. 2002, 23, 595–618. [Google Scholar] [CrossRef]
- Ge, C.; Lv, W.; Wang, J. The Impact of Digital Technology Innovation Network Embedding on Firms’ Innovation Performance: The Role of Knowledge Acquisition and Digital Transformation. Sustainability 2023, 15, 6938. [Google Scholar] [CrossRef]
- Pan, X.; Song, M.L.; Zhang, J.; Zhou, G. Innovation network, technological learning and innovation performance of high-tech cluster enterprises. J. Knowl. Manag. 2019, 23, 1729–1746. [Google Scholar] [CrossRef]
- Pomegbe, W.W.K.; Li, W.; Dogbe, C.S.K.; Otoo, C.O.A. Enhancing the innovation performance of small and medium-sized enterprises through network embeddedness. J. Compet. 2020, 12, 156. [Google Scholar] [CrossRef]
- Yang, B.; Li, X.; Kou, K. Research on the influence of network embeddedness on innovation performance: Evidence from China’s listed firms. J. Innov. Knowl. 2022, 7, 100210. [Google Scholar]
- Schillebeeckx, S.J.; Lin, Y.; George, G.; Alnuaimi, T. Knowledge recombination and inventor networks: The asymmetric effects of embeddedness on knowledge reuse and impact. J. Manag. 2021, 47, 838–866. [Google Scholar] [CrossRef]
- Segarra-Ciprés, M.; Bou-Llusar, J.C. External knowledge search for innovation: The role of firms’ innovation strategy and industry context. J. Knowl. Manag. 2018, 22, 280–298. [Google Scholar] [CrossRef]
- Zhang, Y.; Zhang, X.; Zhang, H. The Influence of External Knowledge Searches on Enterprises’ Innovation Performance: A Meta-Analysis. Sustainability 2022, 14, 8081. [Google Scholar] [CrossRef]
- Laursen, K.; Salter, A. Open for innovation: The role of openness in explaining innovation performance among UK manufacturing firms. Strateg. Manag. J. 2006, 27, 131–150. [Google Scholar] [CrossRef]
- Grimpe, C.; Sofka, W. Search patterns and absorptive capacity: Low-and high-technology sectors in European countries. Res. Policy 2009, 38, 495–506. [Google Scholar] [CrossRef]
- Sun, J.; Shen, Z.-Y. Research on external search and innovation performance from the contingency perspective: The moderating effect of organizational slack. South China J. Econ. 2014, 9, 1–13. [Google Scholar]
- Granovetter, M. Economic action and social structure: The problem of embeddedness. Am. J. Sociol. 1985, 91, 481–510. [Google Scholar] [CrossRef]
- Uzzi, B. Social structure and competition in interfirm networks. Adm. Sci. Q. 1997, 42, 37–69. [Google Scholar]
- Coleman, J.S. Social capital in the creation of human capital. Am. J. Sociol. 1988, 94, S95–S120. [Google Scholar] [CrossRef]
- Wang, X.-X.; Jiao, H.-Y. The impact of network positions in scientific collaboration on pharmaceutical firms’ technological innovation performance: Moderating roles of scientific collaboration strength and patent stock. Front. Public Health 2022, 10, 980845. [Google Scholar] [CrossRef]
- Owen-Smith, J.; Powell, W.W. Knowledge networks as channels and conduits: The effects of spillovers in the Boston biotechnology community. Organ. Sci. 2004, 15, 5–21. [Google Scholar] [CrossRef]
- Aalbers, R.; Dolfsma, W.; Koppius, O. Individual connectedness in innovation networks: On the role of individual motivation. Res. Policy 2013, 42, 624–634. [Google Scholar] [CrossRef]
- Guan, J.; Liu, N. Exploitative and exploratory innovations in knowledge network and collaboration network: A patent analysis in the technological field of nano-energy. Res. Policy 2016, 45, 97–112. [Google Scholar] [CrossRef]
- Gilsing, V.; Nooteboom, B.; Vanhaverbeke, W.; Duysters, G.; Van Den Oord, A. Network embeddedness and the exploration of novel technologies: Technological distance, betweenness centrality and density. Res. Policy 2008, 37, 1717–1731. [Google Scholar] [CrossRef]
- Lee, C.-Y.; Wang, M.-C.; Huang, Y.-C. The double-edged sword of technological diversity in R&D alliances: Network position and learning speed as moderators. Eur. Manag. J. 2015, 33, 450–461. [Google Scholar]
- Dahlander, L.; Gann, D.M.; Wallin, M.W. How open is innovation? A retrospective and ideas forward. Res. Policy 2021, 50, 104218. [Google Scholar] [CrossRef]
- Landis, B. Personality and social networks in organizations: A review and future directions. J. Organ. Behav. 2016, 37, 107–121. [Google Scholar] [CrossRef]
- Rosenthal, R.; Jacobson, L. Pygmalion in the classroom. Urban Rev. 1968, 3, 16–20. [Google Scholar] [CrossRef]
- Burt, R.S.; Kilduff, M.; Tasselli, S. Social network analysis: Foundations and frontiers on advantage. Annu. Rev. Psychol. 2013, 64, 527–547. [Google Scholar] [CrossRef]
- Qian, X.; Yang, Y.; Xu, W. Firm network location, absorptive capacity and innovation performance-An interaction effect model. Manag. World 2010, 13, 118–129. [Google Scholar]
- Kim, D.-Y.; Zhu, P. Supplier dependence and R&D intensity: The moderating role of network centrality and interconnectedness. J. Oper. Manag. 2018, 64, 7–18. [Google Scholar]
- Kneeland, M.K.; Schilling, M.A.; Aharonson, B.S. Exploring uncharted territory: Knowledge search processes in the origination of outlier innovation. Organ. Sci. 2020, 31, 535–557. [Google Scholar] [CrossRef]
- Granovetter, M.S. The strength of weak ties. Am. J. Sociol. 1973, 78, 1360–1380. [Google Scholar] [CrossRef]
- Cassetta, E.; Monarca, U.; Dileo, I.; Di Berardino, C.; Pini, M. The relationship between digital technologies and internationalisation. Evid. Ital. SMEs. Ind. Innov. 2019, 27, 311–339. [Google Scholar] [CrossRef]
- Li, M.; Su, J.; Hu, C. The impact of enterprise network location and relationship strength on technology innovation performance in industry university research cooperation. Sci. Technol. Prog. Policy 2020, 37, 118–124. [Google Scholar]
- Wang, C.; Rodan, S.; Fruin, M.; Xu, X. Knowledge networks, collaboration networks, and exploratory innovation. Acad. Manag. J. 2014, 57, 484–514. [Google Scholar] [CrossRef]
- Li, P.; Bathelt, H. Location strategy in cluster networks. J. Int. Bus. Stud. 2018, 49, 967–989. [Google Scholar] [CrossRef]
- Liao, W.; Gu, J.; Li, K. Roles of related and unrelated external technologies in shaping regional breakthrough technological advantages. Technol. Forecast. Soc. Change 2025, 210, 123871. [Google Scholar] [CrossRef]
- Kim, M.; Koo, D.W.; Han, H.S. Innovative behavior motivations among frontline employees: The mediating role of knowledge management. Int. J. Hosp. Manag. 2021, 99, 103062. [Google Scholar] [CrossRef]
- Wang, T.; Yu, X.; Cui, N. The substitute effect of internal R&D and external knowledge acquisition in emerging markets. Eur. J. Mark. 2020, 54, 1117–1146. [Google Scholar] [CrossRef]
- Dyer, J.H.; Hatch, N.W. Using Supplier Networks to Learn Faster. MIT Sloan Management Review, 15 April 2004. [Google Scholar]
- Wang, C.; Chin, T.; Lin, J.-H. Openness and firm innovation performance: The moderating effect of ambidextrous knowledge search strategy. J. Knowl. Manag. 2020, 24, 301–323. [Google Scholar] [CrossRef]
- Snijders, T.A.B.; Bosker, R.J. Multilevel analysis: An introduction to basic and advanced multilevel modeling, 2nd ed. Struct. Equ. Model.-A Multidiscip. J. 2013, 20, 541–550. [Google Scholar]
- Ahuja, G. Collaboration networks, structural holes and innovation: A longitudinal study. Adm. Sci. Q. 2000, 45, 425–455. [Google Scholar] [CrossRef]
- Zaheer, A.; Bell, G.G. Benefiting from Net-work Position: Firm Capabilities, Structural holes, and Performance. Strateg. Manag. J. 2005, 26, 809–825. [Google Scholar] [CrossRef]
- Fainshmidt, S.; Frazier, M.L. What Facilitates Dynamic Capabilities? The Role of Organizational Climate for Trust. Long Range Plan. 2017, 50, 550–566. [Google Scholar] [CrossRef]
- Michelfelder, I.; Kratzer, J. Why and how combining strong and weak ties within a single interorganizational R&D collaboration outperforms other collaboration structures. J. Prod. Innov. Manag. 2013, 30, 1159–1177. [Google Scholar]
- Aven, B.; Morse, L.; Iorio, A. The valley of trust: The effect of relational strength on monitoring quality. Organ. Behav. Hum. Decis. Process. 2021, 166, 179–193. [Google Scholar] [CrossRef]
- Liu, N.; Mao, J.; Guan, J. Knowledge convergence and organization innovation: The moderating role of relational embeddedness. Scientometrics 2020, 125, 1899–1921. [Google Scholar] [CrossRef]
- Wang, D.; Zhao, X.; Zhang, Z. The time lags effects of innovation input on output in national innovation systems: The case of China. Discret. Dyn. Nat. Soc. 2016, 2016, 1963815. [Google Scholar] [CrossRef]
- Jin, Y.; Cao, X. An Empirical Analysis on the Impact of Innovation Network Structure on Crossover Innovation Performance of Emerging Technologies. Comput. Intell. Neurosci. 2022, 2022, 8312086. [Google Scholar] [CrossRef]
- Wang, H.; Wang, Q.; Xiao, Y.; Chen, H.; Su, Z.; Xiang, C. Collaborative network, technological progress and potato production in China. Potato Res. 2024, 1–23. [Google Scholar] [CrossRef]
- Wang, J. Knowledge creation in collaboration networks: Effects of tie configuration. Res. Policy 2016, 45, 68–80. [Google Scholar] [CrossRef]
- You, C.; Luo, Q.; Liu, W. The Role of Urban Digital Intelligence in Fostering Sustainable Collaborative Innovation: An Analysis of Spillover Effects. Sustainability 2025, 17, 1890. [Google Scholar] [CrossRef]
- Wang, X.; Sethi, S.P.; Chang, S. Pollution abatement using cap-and-trade in a dynamic supply chain and its coordination. Transp. Res. Part E Logist. Transp. Rev. 2022, 158, 102592. [Google Scholar] [CrossRef]
- Zhu, X.; Hu, C. Is patent an effective tool to measure technological innovation performance. Stud. Sci. Sci. 2021, 39, 1498–1503. [Google Scholar]
- Hao, J.-J.; Li, C.; Yuan, R.; Khansa, P.; Muhammad Asif, K.; Sun, X. Dual Innovation performance through knowledge-based network structure: Evidence from electronic information industry. Eng. Econ. 2022, 33, 47–58. [Google Scholar]
- Wang, Y.; Guo, B.; Yin, Y. Open innovation search in manufacturing firms: The role of organizational slack and absorptive capacity. J. Knowl. Manag. 2017, 21, 656–674. [Google Scholar] [CrossRef]
- Wang, Y.; Urban, F.; Zhou, Y.; Chen, L. Comparing the technology trajectories of solar PV and solar water heaters in China: Using a patent lens. Sustainability 2018, 10, 4166. [Google Scholar] [CrossRef]
- Wen, Z.; Ye, B. Different methods for testing moderated mediation models: Competitors or backups? Acta Psychol. Sin. 2014, 46, 714–726. [Google Scholar] [CrossRef]
- Lyu, Y.; He, B.; Zhu, Y.; Li, L. Network embeddedness and inbound open innovation practice: The moderating role of technology cluster. Technol. Forecast. Soc. Change 2019, 144, 12–24. [Google Scholar] [CrossRef]
- Zhang, S.; Shu, J.; Wang, X.; Zhang, Z. A supply chain system involving the interaction of guarantee finance with product quality and after-sales service. IEEE Trans. Eng. Manag. 2024, 71, 3414–3429. [Google Scholar] [CrossRef]
- Li, X.; Liu, X. The impact of the collaborative innovation network embeddedness on enterprise green innovation performance. Front. Environ. Sci. 2023, 11, 1190697. [Google Scholar] [CrossRef]
- Park, S.H.; Russo, M.V. When competition eclipses cooperation: An event history analysis of joint venture failure. Manag. Sci. 1996, 42, 875–890. [Google Scholar] [CrossRef]
- Rowley, T.; Behrens, D.; Krackhardt, D. Redundant governance structures: An analysis of structural and relational embeddedness in the steel and semiconductor industries. Strateg. Manag. J. 2000, 21, 369–386. [Google Scholar] [CrossRef]
- Wang, X.; Zhang, Y.; Zhang, S. Dynamic order allocation in a duopoly hybrid workforce of competition: A machine learning approach. Eur. J. Oper. Res. 2024, 315, 668–690. [Google Scholar] [CrossRef]
Disclaimer/Publisher’s Note: The statements, opinions and data contained in all publications are solely those of the individual author(s) and contributor(s) and not of MDPI and/or the editor(s). MDPI and/or the editor(s) disclaim responsibility for any injury to people or property resulting from any ideas, methods, instructions or products referred to in the content. |
© 2025 by the authors. Licensee MDPI, Basel, Switzerland. This article is an open access article distributed under the terms and conditions of the Creative Commons Attribution (CC BY) license (https://creativecommons.org/licenses/by/4.0/).