Article

Spatiotemporal Evolution of Anthropogenic Emissions and Their Impact on Air Pollution in Guangdong Province from 2006 to 2020

1
College of Environment and Climate, Institute for Environmental and Climate Research, Jinan University, Guangzhou 511443, China
2
Sustainable Energy and Environmental Thrust, The Hong Kong University of Science and Technology (Guangzhou), Guangzhou 511458, China
*
Author to whom correspondence should be addressed.
Sustainability 2025, 17(11), 4844; https://doi.org/10.3390/su17114844
Submission received: 5 April 2025 / Revised: 7 May 2025 / Accepted: 21 May 2025 / Published: 25 May 2025
(This article belongs to the Section Air, Climate Change and Sustainability)

Abstract

:
Air quality in Guangdong Province has improved in recent years, but progress varies across different provincial sub-regions, particularly between Pearl River Delta (PRD) and non-PRD (NPRD) regions. To unveil possible causes of this, this study established a high-resolution gridded emission inventory for Guangdong (2006–2020) by integrating multi-year Point of Interest (POI) data and road network information. The spatiotemporal evolutions of anthropogenic sulfur dioxide (SO2), nitrous oxide (NOX), and particulate matter (PM10 and PM2.5) emissions were analyzed, with a focus on their impacts on PM2.5 pollution using the CMAQ model. Spatial shifts in emission sources were quantified using spatial statistical methods, including the average nearest neighbor index (ANNI), kernel density analysis (KDA), standard deviational ellipse (SDE), and mean center (MC). From 2006 to 2020, emissions decreased significantly for SO2 (88%), NOX (26%), PM10 (64%), and PM2.5 (68%). Emission hotspots shifted toward NPRD regions, driven by stricter environmental policies and industrial restructuring, lowering PRD-to-NPRD emission ratios for SO2 (from 1.25 to 0.87), NOX (1.67–1.51), and PM10 (0.94–0.89). The spatial evolution of emissions varied across sources. For example, the emission share of industrial sources in the PRD declined despite an increase in enterprises, whereas vehicle emissions remained concentrated in the PRD. CMAQ modeling results revealed that overall emission reductions from 2012 to 2020 lowered provincial PM2.5 concentrations by 9.2–10.5 μg/m3. Accounting for spatial evolution further enhanced PM2.5 reductions in the PRD by 1.4 μg/m3 (April) and 1.1 μg/m3 (October). Conversely, PM2.5 improvements in NPRD regions weakened, with reductions declining by 0.2–3.2 μg/m3 (April) and 0.1–1.4 μg/m3 (October). These findings provide guidance for formulating region-specific strategies, aiming for more equitable air quality improvements across Guangdong.

1. Introduction

Guangdong Province, located in the southern coastal area of China, has experienced significant urbanization and industrialization in recent decades. This rapid development has caused serious deterioration in the air quality in Guangdong Province, making it one of the most polluted provinces in China. To address this severe air pollution, the local government in Guangdong Province has implemented a series of environmental policies, including the “Action Plan for Air Pollution Prevention and Control” [1] and the “Battle for Blue Skies” [2]. These efforts have significantly improved the provincial air quality, with the annual average concentration of fine particulate matter < 2.5 μm in diameter (PM2.5) in Guangdong Province decreasing from 43 μg/m3 in 2013 to 21 μg/m3 in 2023 [3]. However, this improvement is uneven across the province. Based on the comparison of air quality changes between the Pearl River Delta (PRD) region and non-PRD regions of Guangdong Province (NPRD) from 2014 to 2022, the concentrations of sulfur dioxide (SO2), nitrogen dioxide (NO2), and PM2.5 in the PRD region decreased by 4–6% more than in the NPRD region during this period. Conversely, the concentration of the 90th percentile of the maximum daily 8 h average ozone (MDA8-90) in the PRD region increased by 9% more than in the NPRD region.
Such uneven air quality improvement in Guangdong may be due to regional differences in policy implementation [4,5]. Current emission reduction measures primarily focus on the PRD region, with examples including the “Measures for the Prevention and Control of Air Pollution in the Pearl River Delta Region” in 2009 [6] and the “Pearl River Delta Clean Air Action Plan 2011 Annual Implementation Plan ” in 2011 [7]. In 2008, to promote economic structural upgrades and optimize the industrial layout, the government introduced the “Cage for Birds” policy, which facilitated the orderly transfer of labor-intensive, low-value-added, high-energy-consuming, and highly polluting industries from the PRD region to areas such as Guangxi, Hunan, Hubei, and NPRD regions [5,8,9,10,11,12,13,14,15]. In addition, the imbalance in economic development between the PRD and NPRD regions has led to differences in emission source activity levels and emission changes [16,17]. For example, in 2020, the gross domestic product (GDP) of the PRD region was 4.2 times that of the NPRD region, while the number of vehicles in the PRD region was 2.5 times that of the NPRD region [18].
Clarifying the spatial evolution characteristics of emissions is essential for the continuous improvement of air quality and serves as the scientific basis for formulating regionally differentiated control strategies. In recent years, national-scale [19,20,21,22,23,24,25,26,27], regional-scale [9,16,28,29,30,31,32,33,34,35,36,37,38,39], and urban-scale [40,41] trend emission inventories have been developed, among which some analyze the spatial evolution of emissions. These inventories cover a range of pollutants, including volatile organic compounds (VOCs), NOX, SO2, particulate matter (PM10), PM2.5, carbon monoxide (CO), and ammonia (NH3). For example, Wang et al. (2023) analyzed industrial carbon emissions in Guangdong Province from 1998 to 2013 and reported a spatial expansion of emissions from the PRD region to eastern and western Guangdong [28]. Similarly, Li and Xie (2014) highlighted increasing trends in biogenic VOC emissions across Chinese provinces, particularly in northeastern and northwestern regions [22], while Wu et al. (2016) observed a shift of anthropogenic VOC emissions from coastal to inland areas during 2008–2012 [23]. Bian et al. (2019) developed a provincial emission inventory for Guangdong (2006–2015) and found decreasing trends for SO2, NOX, PM, and CO, despite rising NH3 and VOC levels [9]. Globally, similar studies on emission trends and spatial evolution have been conducted in other regions. For instance, William F Lamb et al. (2021) analyzed sector-specific global GHG emissions from 1990 to 2018, focusing on temporal trends, spatial evolution, and regional contributions to emission dynamics [27].
Although several studies have developed long-term regional emission inventories for various sources in Guangdong Province [9,35,38], there is a notable scarcity of analyses examining the spatial evolution of these emissions. Compared with trend analysis of total emissions, analyzing the spatial evolution characteristics of emissions is more challenging. This type of analysis requires not only quantifying changes in emissions from major pollution sources but also characterizing the spatial shifts in these emissions. However, existing studies typically allocate emissions to domain grids, using geographic coordinates for point sources or spatial allocation profiles for sources without precise locations. Due to the frequent lack of historical environmental statistical data, especially from earlier periods, it is difficult to continuously obtain accurate emission and location information for enterprises. As a result, many industrial sources and other point sources are often represented as area sources in trend emission inventories. In addition, spatial profiles, such as population density, road networks, land use data, and light density, need to be updated annually due to changes in geographic information.
Point of interest (POI) data, which provide geographic information for electronic maps, can be utilized to improve the spatial characterization of emissions sources, such as cooking, residential combustion, transportation, and industrial emissions [41,42,43,44,45,46,47,48,49]. More importantly, POI data are updated annually, enabling the capture of spatial changes in emission sources. Therefore, the present study developed a gridded trend emission inventory for Guangdong Province covering the period from 2006 to 2020. This inventory incorporates changes in emissions and spatial profiles by utilizing multi-year POI data and road network information. Moreover, this research analyzed the spatial evolution characteristics of anthropogenic SO2, NOX, and PM10 emissions from power plants, industrial sources, and vehicle emissions within Guangdong Province during this period, and explored their impact on air quality. The findings of this study provide a scientific basis and data foundation for the government to develop future region- and city-specific air pollution control measures aiming to effectively reduce emissions and improve air quality.

2. Data and Methods

2.1. Establishment of the Guangdong Province Trend Emission Inventory

This study established trend emission inventories for Guangdong Province for the years 2006, 2012, 2017, and 2020 based on the methodology used by Bian et al. (2019) [9,50,51]. The period from 2013 to 2017 corresponded to the implementation of the National Air Pollution Prevention and Control Action Plan (“Ten Measures on Air Pollution”) [52], and the period from 2018 to 2020 corresponded to the implementation of the National “Blue Sky Protection Campaign” [53]. Additionally, data constraints influenced the selection of these years. High-resolution environmental statistics and POI data are not uniformly available across all years. Earlier years often lacked standardized reporting formats and data, leading to potential biases. For instance, High-resolution POI data were sparse for earlier years (e.g., 323,800 POI points in 2006 vs. 7.1 million in 2020). This means that analyzing all intermediate years would amplify uncertainties caused by missing or inconsistent data. Thus, selecting 2006, 2012, 2017, and 2020 captured the primary trends of pollutant emissions in Guangdong. The emission inventories encompassed major sources, including power plants, industrial sources, vehicle sources, non-vehicle sources, and dust sources, covering the pollutants SO2, NOX, PM10, and PM2.5.
Activity-level data were primarily derived from environmental statistics and statistical yearbooks. Environmental statistics provided the precise locations of the enterprises which were employed to analyze the spatial changes of emissions. However, significant variations in the number of enterprises included in the environmental statistics across different years made it challenging to detect changes in emissions in Guangdong using environmental statistics alone. For example, the 2006 environmental statistics excluded certain industrial enterprises outside the PRD region, while the 2020 data included a significantly larger number of industrial enterprises due to enhanced and expanded statistical coverage. To address these discrepancies and the resulting biases in emission characterization, this study integrated trends in activity-level data from regional power generation or product output in statistical yearbooks with emission estimates for power plants and industrial sources based on environmental statistics (denoted here as area-format power plant and industrial emissions).
To verify the accuracy and reliability of the 2006–2020 Guangdong Province atmospheric pollutant emission inventory developed in this study, a comparative analysis was conducted. This involved examining the trends of key pollutant (SO2 and PM10) emissions from our inventory against the normalized trends of observed annual concentrations of these pollutants obtained from two monitoring networks. The national air quality monitoring network, comprising 125 stations (77 in the PRD and 48 in the NPRD), provided concentration data (after averaging and normalization) for SO2, NO2, PM10, CO, O3, and PM2.5 spanning 2013–2020. Additionally, a longer dataset (2006–2020) for these pollutants was available from the 23 stations within the Guangdong–Hong Kong–Macao Pearl River Delta Regional Air Quality Monitoring Network (covering only the PRD region). Given the absence of national monitoring data prior to 2013, the 2013 concentration data from the national network were used as proxies for 2012 values in our comparative analysis.

2.2. POI Data Acquisition and Preprocessing

For power plants and industrial emissions estimated using activity-level data from statistical yearbooks, the POI data for Guangdong Province from 2006, 2012, 2017, and 2020 sourced from Baidu Maps were used to represent spatial changes. In addition, POI data, including the locations of parking lots and gas stations, were utilized to represent spatial changes in vehicle emissions, as these POIs indicate the level of vehicular activity in a given region. The POI data were processed as follows: (1) the data were categorized into two main groups of industrial-related POIs and traffic-service-related POIs; (2) keywords were used to filter each category of POI data. Positive selection identified POIs related to emission activities, while negative exclusion removed unrelated POIs. For example, “glass”, “ceramics”, “cement”, “food manufacturing”, and “chemical industry” identified industrial POIs involved in emission activities, whereas keywords such as “committee”, “office”, and “branch” excluded non-emission-related POIs; (3) duplicate POI entries that might represent the same companies were removed.

2.3. Analysis of Spatial Changes of Emissions

Power plants, industrial sources, and vehicle sources are significant contributors to emissions in Guangdong Province. Therefore, this study used these sources as examples to analyze spatial changes in emissions within the province. To effectively reveal the spatial changes of these key emission sources, dynamic spatial allocation factors were employed to account for interannual variability. Emissions from these key sources were allocated to a 3 km × 3 km grid, enabling a detailed analysis of the spatial distribution of emissions for the years 2006, 2012, 2017, and 2020.
This study employed spatial statistical analysis methods, including the average nearest neighbor index (ANNI), kernel density analysis (KDA), standard deviational ellipse (SDE), and mean center (MC), to analyze spatial changes in source locations. Environmental statistics data and POI data for enterprises in various industries were utilized to represent power plants and industrial sources. POI data from gas stations and parking lots were used to represent vehicle sources. The ANNI can reveal the spatial distribution patterns of sources, including clustering, dispersion, and random distribution patterns [54,55]. If sources exhibited a clustered spatial distribution pattern, KDA was further used to identify specific clustering areas and evaluate the degree of clustering in different regions [55,56,57,58]. The SDE and MC can reveal the central points of spatial evolution, the main range of spatial distribution, and the directional trends of the spatial distribution of sources [54,59].
This study developed dynamic spatial allocation profiles for area-format power plant and industrial emissions as well as vehicle emissions at a resolution of 3 km × 3 km based on the data, such as POI, population, and road network data. For power plants and industrial sources with precise locations, emissions were allocated using the latitude and longitude information for each enterprise. For area-format power plants and industrial emissions estimated based on urban energy or product data from yearbooks that could not be directly allocated to specific enterprises, industrial-related POI data were employed for spatial allocation. The spatial allocation weight for each grid was set to K i , and the emissions allocated to each grid, E i , were calculated using Equations (1) and (2):
K i = N i N s u m ,
E i = K i · E s u m .
In these equations, i is the grid cell index, N i represents the number of industrial-related POIs within a given grid cell, N s u m is the total number of industrial-related POIs within Guangdong, and E s u m (t) indicates the total emissions to be allocated.
A method considering traffic volume and “standard road length” [45,60] was utilized to allocate vehicle emissions. Following the method proposed by Wang et al. (2017) [45], vehicle-service-related POI data were used to capture the variations in traffic volume among different roads within the same road class (e.g., arterial roads, highways, and secondary roads). This method primarily uses vehicle-service-related POIs, such as parking lots and gas stations, as weighting factors to adjust traffic volumes. The traffic volume adjustment factor for each road was designated as R a , b , while the spatial allocation weight for each grid was represented as F i . The allocated emissions E i are then calculated accordingly:
R a , b = N a N a v g , b ,
L i = b = 1 m a = 1 n L a , b · Q b · R a , b ,
F i = L i L s u m ,
E i = F i · E s u m ,
where i represents the grid index, a represents the road index, b represents the road type, m represents the number of road types, and n b represents the number of roads of type b , which are typically categorized into six or four types: namely, national expressways, ordinary national roads, ordinary provincial roads, provincial expressways, county roads, and township roads, or urban expressways, main roads, secondary roads, and branch roads, respectively. R a , b denotes the traffic volume adjustment factor for road a of type b , N a represents the number of vehicle-service-related POIs around road a of type b , N a v g , b represents the average number of vehicle-service-related POIs around all of the roads of type b in the study area, L i (km) is the standard length of all of the types of roads in grid i , L a , b (km) is the length of road a of type b , Q b (km/km) is the standard length conversion factor for different roads, and L s u m (km) represents the total standard length of all of the types of roads in all of the grids within the study area.

2.4. Simulations of the Impact of Emission Spatial Evolution on Air Quality

This study employed the CMAQ model to simulate the impact of emission spatial evolution on air quality in Guangdong Province, following the same model configuration applied in Zhang et al. (2023) [61]. The study employed the WRF/SMOKE-PRD/CMAQ model system to simulate PM2.5 concentrations in Guangdong with two nested domains. The outer domain (D1) covered East Asia, Southeast Asia, and parts of the Pacific Ocean with a 27 km × 27 km resolution, while the inner domain (D2) focused on Guangdong and surrounding regions at a finer 9 km × 9 km resolution. Meteorological inputs for the CMAQ model were generated by the Weather Research and Forecasting (WRFv3.9) model, initialized using NCEP Final (FNL) Operational Global Analysis data. The chemical mechanisms incorporated SAPRC07 for gas-phase chemistry and AERO6 for aerosol processes [62]. PM2.5 was evaluated against observations from 36 monitoring sites in the PRD region. Overall, the model captured observed PM2.5 concentrations well, with a normalized mean bias (NMB) of −1.44%, demonstrating good overall model reliability. Detailed configurations of this model can be found in our previous study [61].
The emissions inventory for the simulation included the Guangdong Province air pollutant emissions inventory from 2012 to 2020, the MEIC emission inventory, and biogenic source emissions data estimated using the MEGAN model. The selection of 2012 and 2020 as the focus years for simulating the impact of anthropogenic emissions on PM2.5 pollution was primarily driven by data availability and quality. While we attempted to collect the 2006 POI data, totaling 323,800 data points, its significant data deficiencies, especially concerning road-related POI data, could have led to substantial errors in the spatial allocation of emissions. In contrast, POI data became more comprehensive and reliable after 2012, for example with 1,328,106 data points collected in 2012 and 7,100,378 POI data points collected in 2020. Therefore, this study utilized air pollutant emissions trend inventories for 2012 and 2020 in addition to meteorological data for 2020 as input data.
To evaluate the impact of emissions and spatial evolution on air quality in Guangdong Province, three scenarios (Base, Case 1, and Case 2) were established, as shown in Table 1. Base: This scenario served as the baseline scenario, using 2020 meteorological data and the 2020 air pollutant emissions inventory as input data. Case 1: Building on the Base scenario, this scenario adjusted the emissions of NOX, SO2, and PM2.5 to 2012 levels while keeping the spatial distribution unchanged. Case 1 was compared with the Base scenario to analyze the impact of changes in emissions from 2012 to 2020 on air quality. Case 2: This case further modified Case 1 by adjusting the spatial distribution of emissions. Case 2 was compared with Case 1 to assess the impact of changes in the spatial distribution of emissions on air quality from 2012 to 2020. In each scenario, April and October, respectively, represent the spring and autumn seasons and were used as the simulation periods. These two periods were selected because they exhibit relatively high PM2.5 pollution patterns and were less influenced by interregional transport compared to the winter periods in Guangdong [63,64,65].

3. Results and Discussion

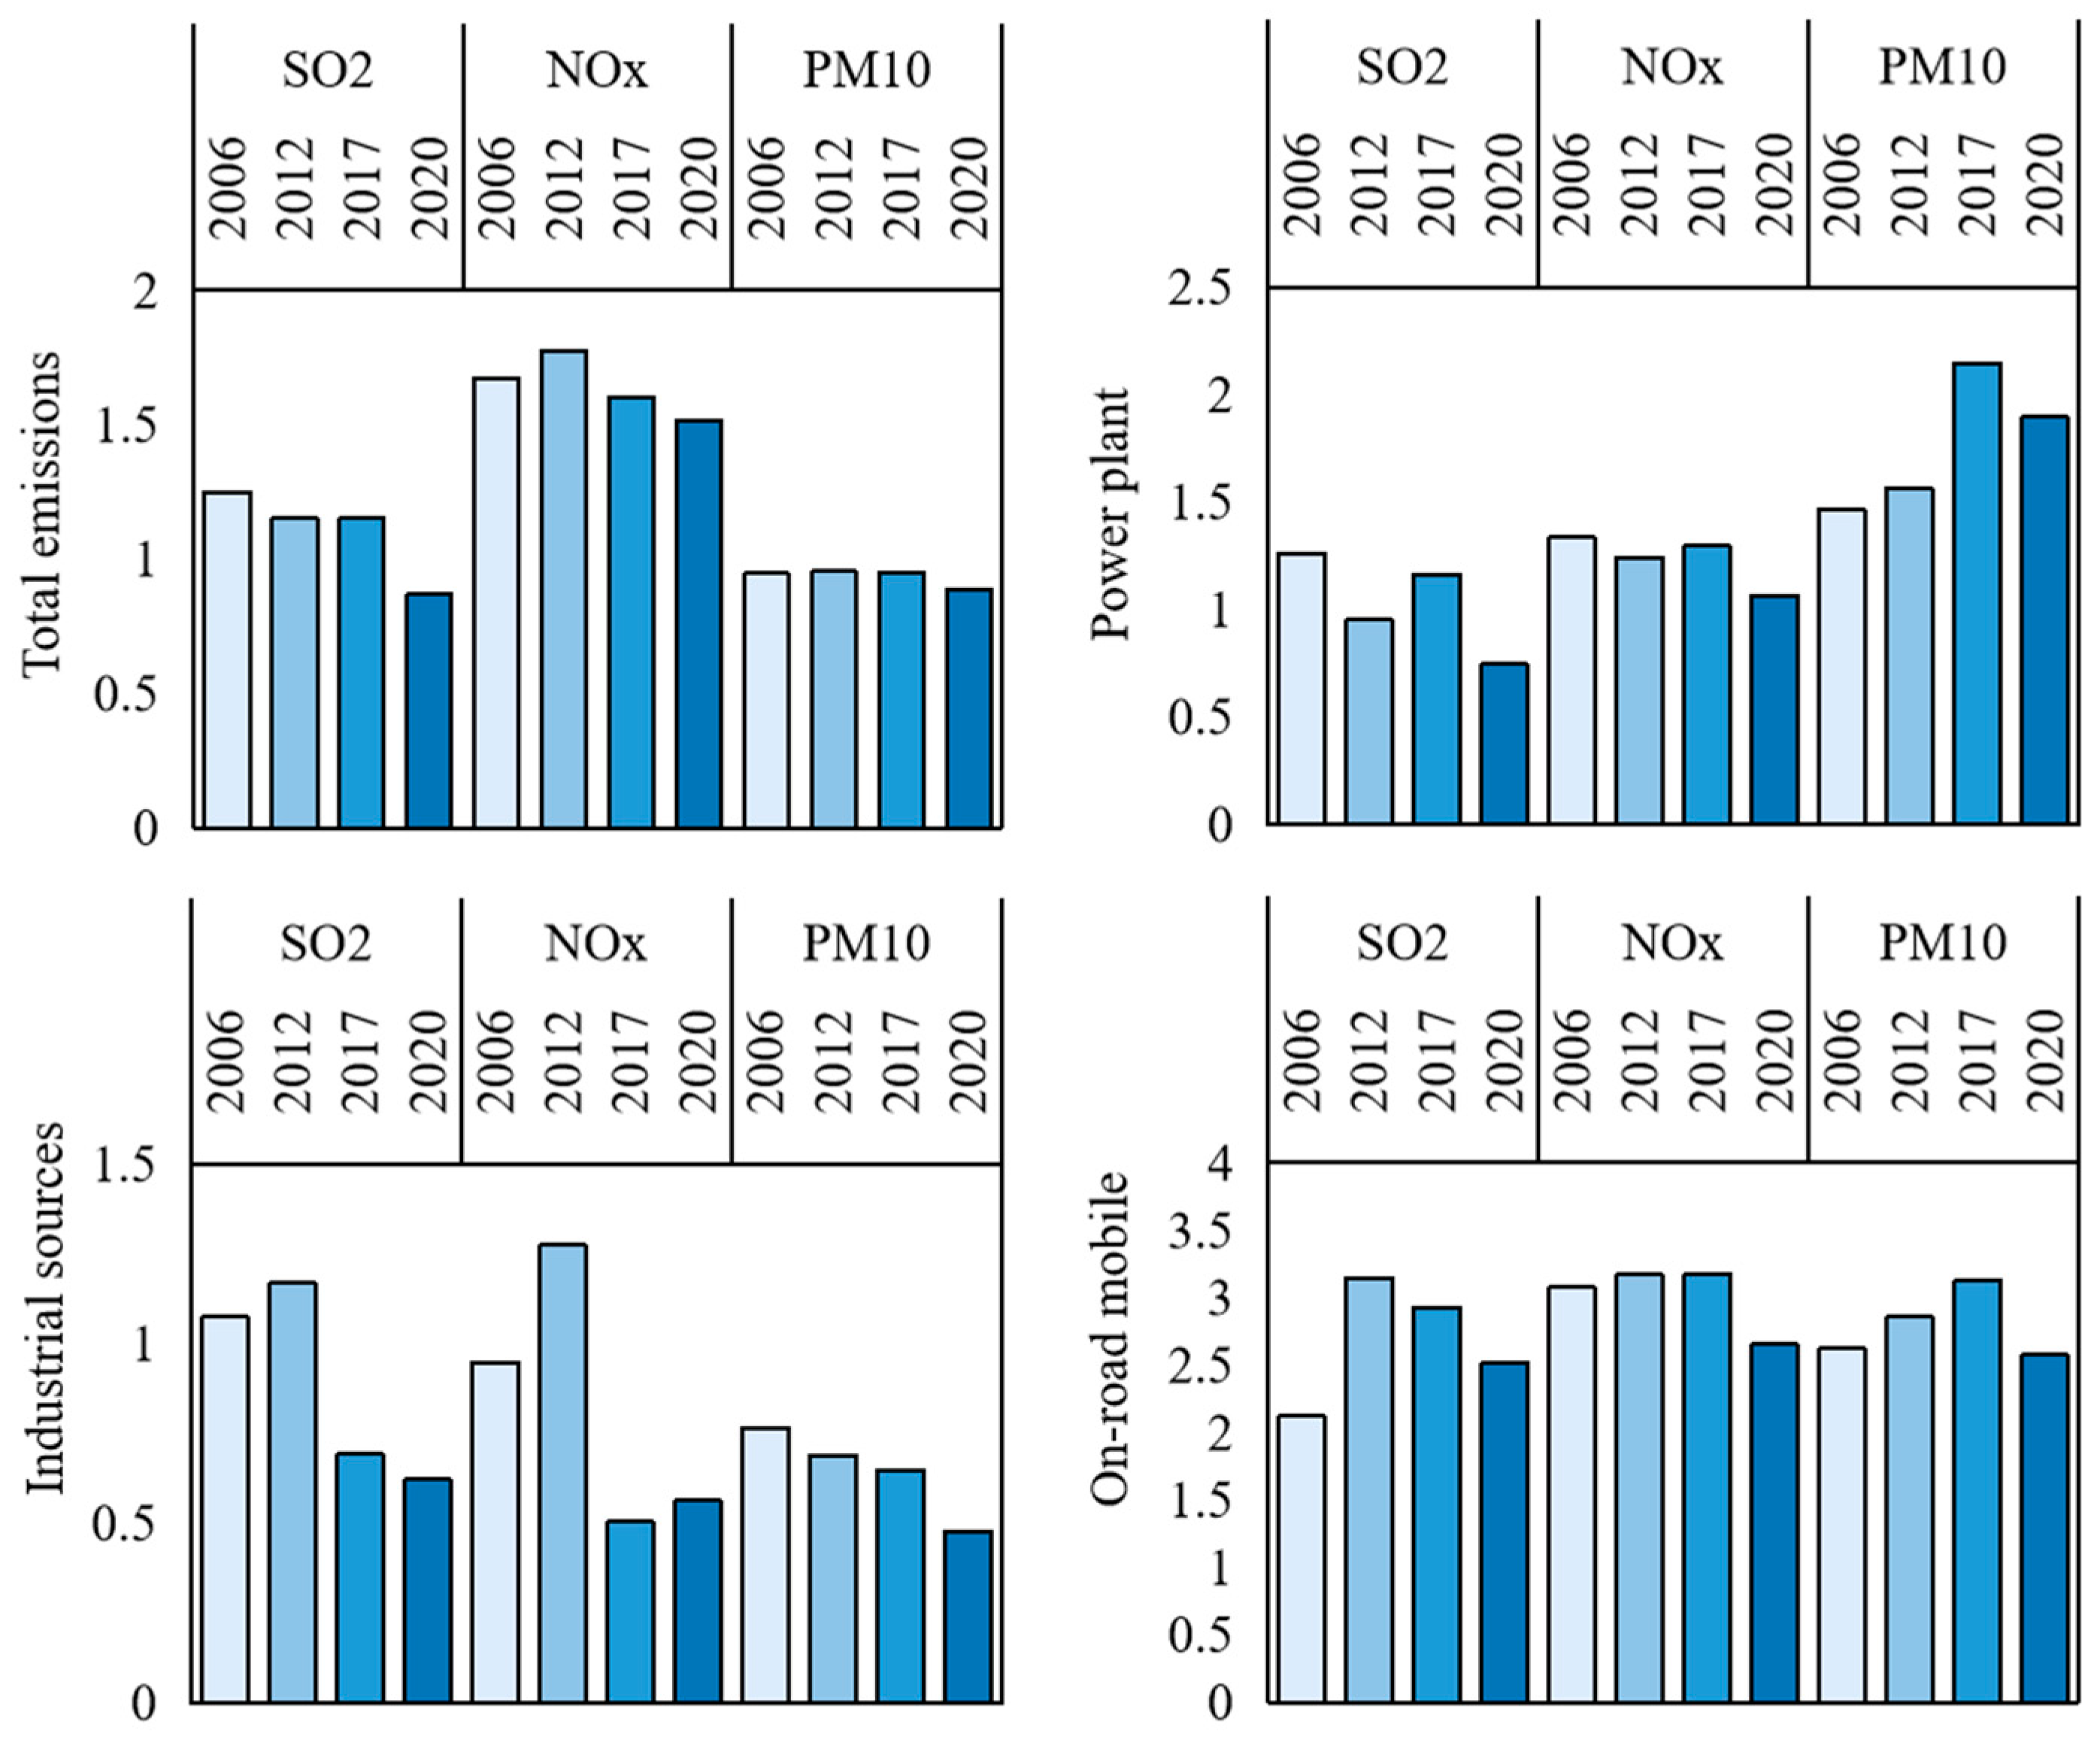
3.1. Temporal Trends of Annual Emissions in Guangdong Province

Figure 1 shows the changes in emissions and source distributions of SO2, NOX, PM10, and PM2.5 in Guangdong Province, including the PRD and NPRD regions, for the years 2006, 2012, 2017, and 2020. Between 2006 and 2020, SO2 emissions in Guangdong Province significantly decreased by 1034 kt, reflecting an 88% reduction. PM10 emissions also displayed a substantial decrease of 1602 kt, representing a 64% reduction. PM2.5 emissions declined by 944 kt, a reduction of 68%. NOX emissions initially increased by 203 kt (13%) from 2006 to 2012, but then decreased by 597 kt (35%) from 2012 to 2020. The PRD region achieved greater reductions in SO2, NOX, PM10, and PM2.5 emissions compared with the NPRD region. From 2006 to 2020, reductions in SO2 and PM10 emissions in the PRD region were 4% and 2% higher than those in the NPRD, respectively. Between 2012 and 2020, NOX reductions in the PRD were 5% higher than in the NPRD. The trends in SO2 emissions and ground-level SO2 concentrations were closely aligned, indicating the reliability of the quantified emission trends in this study (Figure 2). For example, from 2013 to 2020, ambient SO2 concentrations decreased by 63.2% in the PRD and by 43.8% in the NPRD.
The reduction in SO2, PM10, and PM2.5 emissions in Guangdong Province primarily stemmed from power plants and industrial sources. Since 2006, the Guangdong government has implemented a series of measures to reduce air pollutant emissions [66,67,68,69,70]. These measures include promoting clean fuels, enhancing the removal efficiency of coal-fired power plants and industrial enterprises, and conducting ultra-clean transformations, with a focus on reducing emissions from power plants and industrial sources. Compared with SO2, PM10, and PM2.5 emissions, the reduction in NOX emissions was slight. Between 2006 and 2012, increased coal consumption (up 43%) and a 141% rise in the number of vehicles [71,72] led to a 31% increase in NOX emissions from industrial sources and a 30% increase from vehicle sources, making these sources the main contributors to NOX emissions. However, after 2012, with the implementation of measures such as the use of clean fuels in power plants, denitrification measures, stricter vehicle emission standards, and the elimination of high-emission vehicles, NOX emissions began to decline gradually. The NOX emissions from power plants and vehicle sources decreased by 370 and 228 kt, respectively. Similarly, a study by Tian et al. (2022) utilizing a combination of a ground-level air pollutant emission inventory and satellite monitoring data to verify the impact of policies aimed at reducing power plant emissions, observed a significant decrease in satellite-measured NO2 column density in certain Canadian provinces. Their inventory data indicated a reduction in annual NO2 emissions from 205 kt in 2008 to 136 kt in 2017, highlighting the effectiveness of emission control strategies in other regions as well [63].

3.2. Comparison of Temporal Emission Trends of Major Sources Between the PRD and NPRD Regions
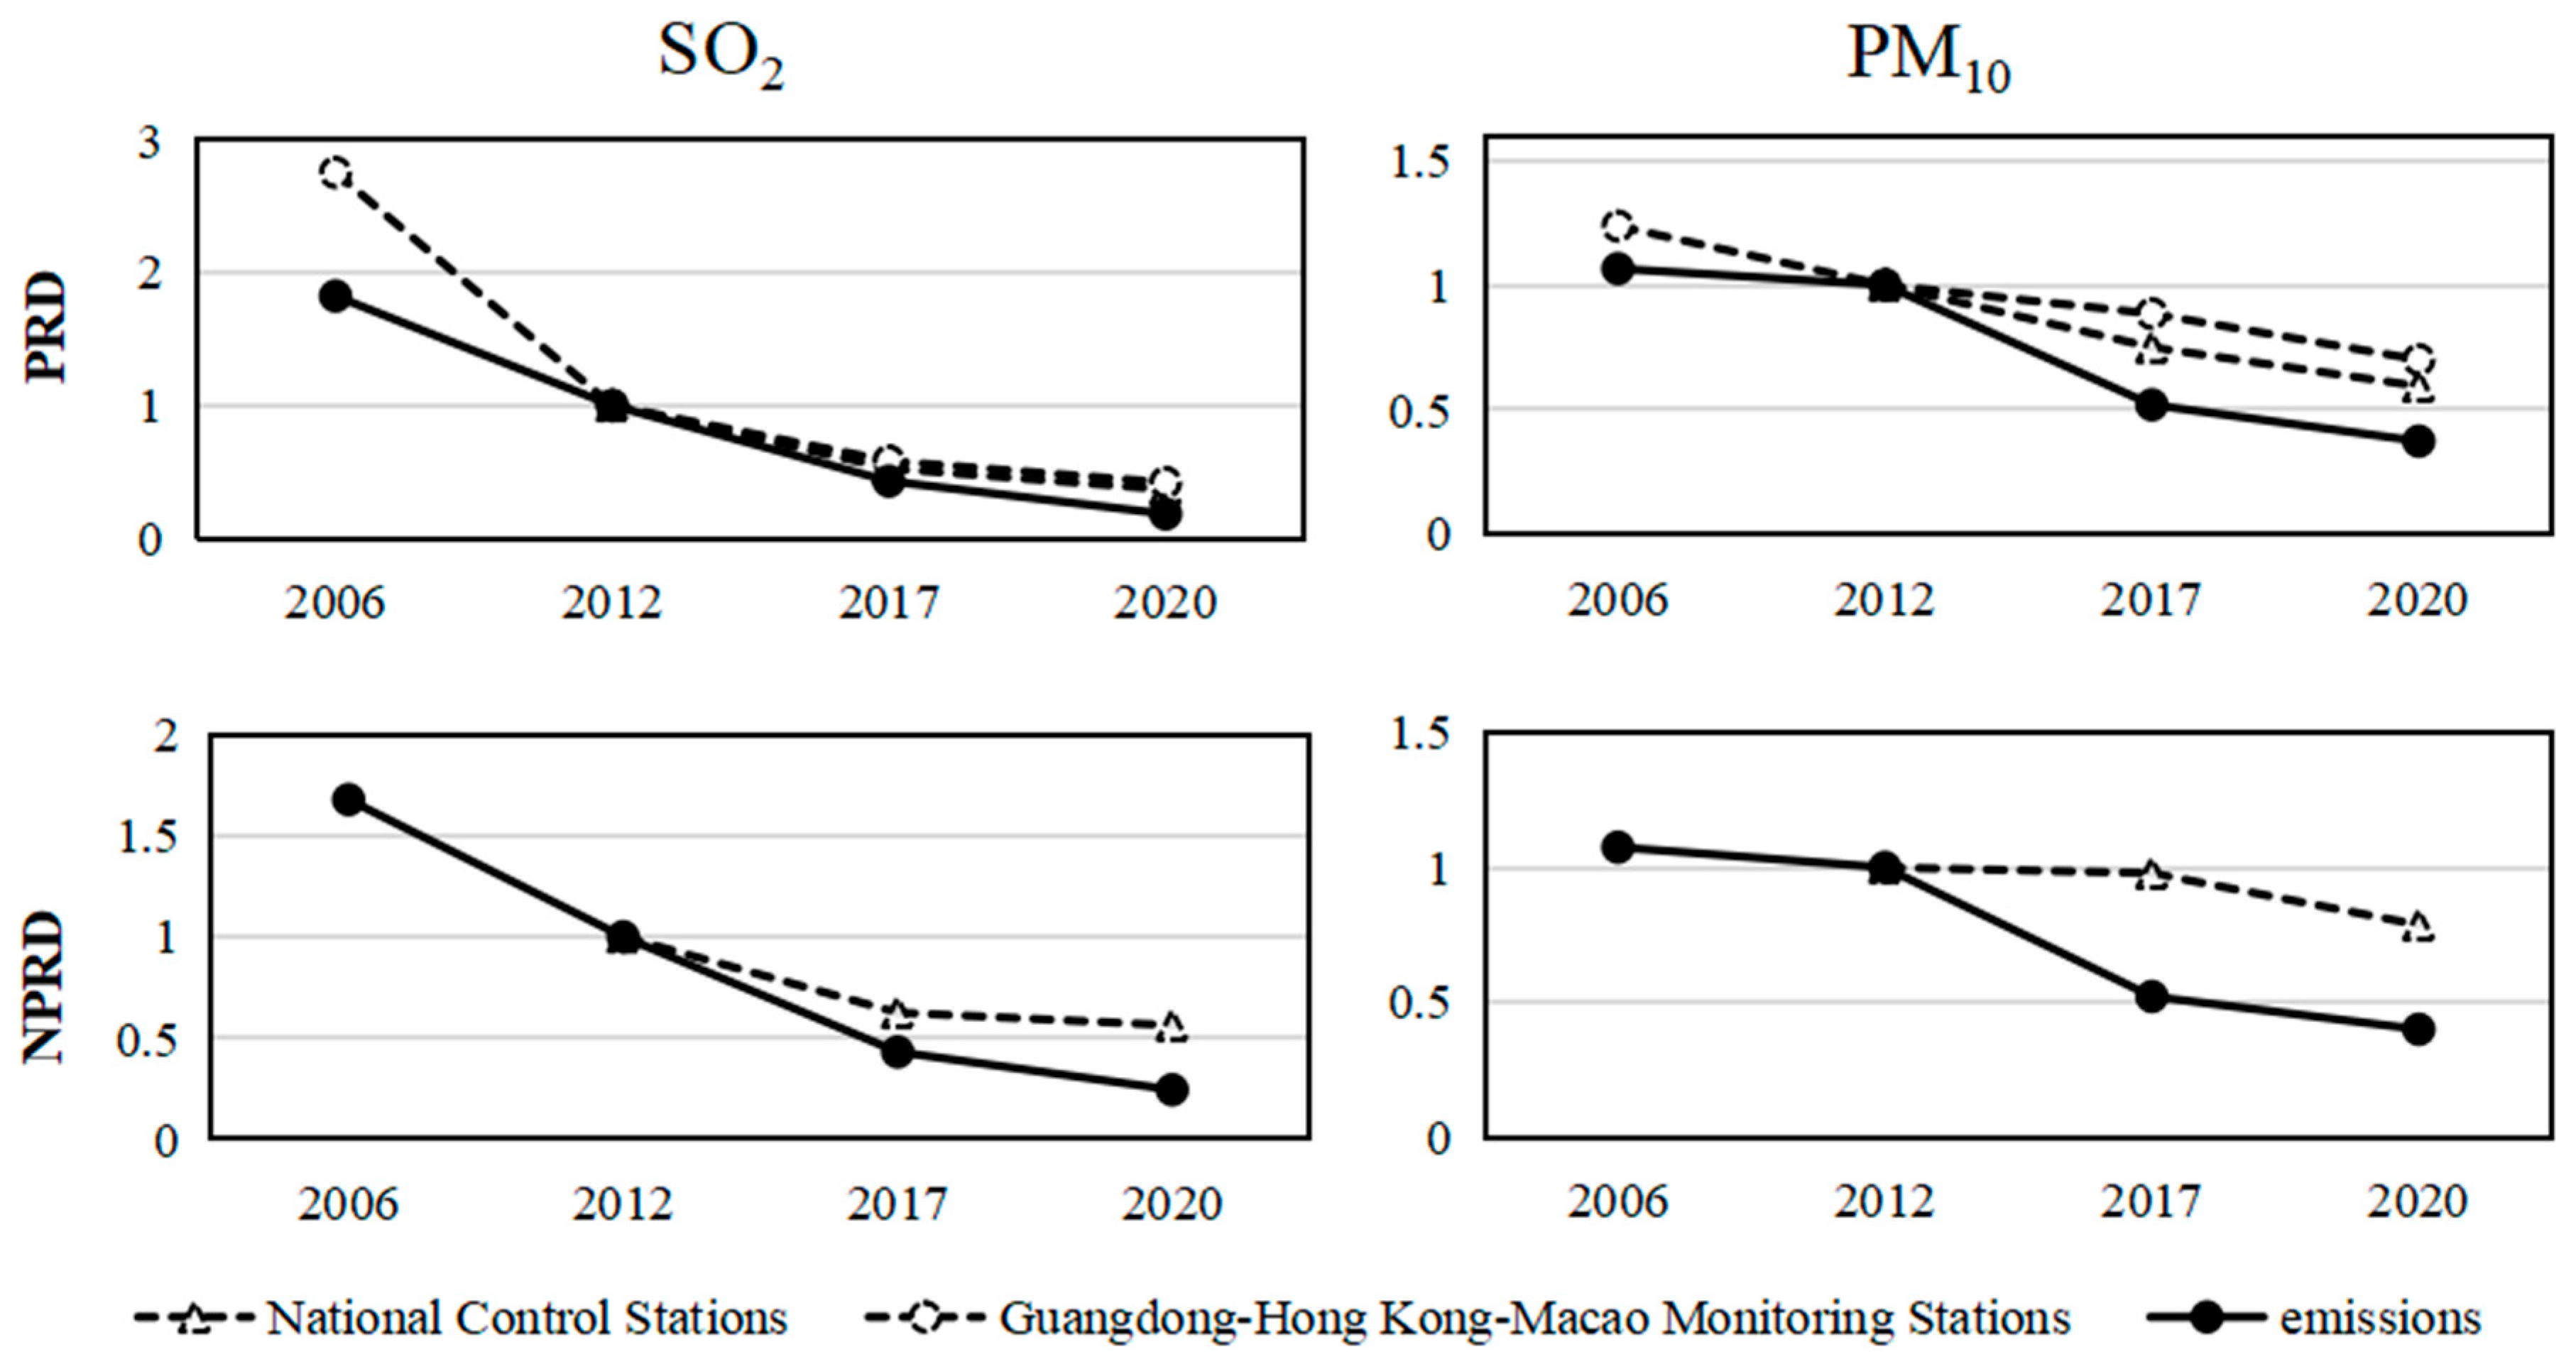
3.2.1. SO2

Figure 3 depicts the changes in the emission ratio (RP/N, emissions in PRD/emissions in NPRD) for SO2, NOX, and PM10 from major sources in the PRD and NPRD regions from 2006 through 2020. During 2006–2020, the total SO2 emission RP/N declined from 1.25 to 0.87, indicating a shift in the primary source of SO2 emissions from the PRD to the NPRD region.
Power plants and industrial sources are the main contributors to SO2 emissions in Guangdong Province (Figure 1). The spatial changes in SO2 emissions primarily stemmed from these sources, with RP/N values of power plants and industrial sources decreasing from 1.26 and 1.08 in 2006, respectively, to 0.75 and 0.62 in 2020, respectively. The greater reduction in SO2 emissions in the PRD region can be attributed to two reasons. First, the emission reduction policies in the PRD were more stringent and comprehensive, with measures such as controlling sulfur content in fuel, flue gas desulfurization, shutting down small coal-fired power units, and transitioning to gas in power plants being implemented more rapidly and intensively than in the NPRD. Second, the PRD underwent extensive industrial restructuring, which led to the relocation of many labor-intensive industries to other regions of Guangdong. This shift resulted in a corresponding decline in emissions in the PRD region and enhanced emissions in the NPRD region.

3.2.2. NOX

From 2006 to 2020, RP/N exhibited an initial increase followed by a decrease. Between 2006 and 2012, RP/N for total NOX emissions rose from 1.67 to 1.77. During this period, power plants and vehicle sources were the main contributors to NOX emissions, with spatial changes primarily being influenced by vehicle sources. The increase in the number of vehicles in the PRD was approximately three times that in the NPRD, leading to higher NOX emission growth in the PRD region [71,72].
From 2012 to 2020, RP/N for total NOX emissions gradually declined from 1.77 to 1.51. During this period, the primary sources of NOX emissions shifted to vehicle and non-vehicle sources. Spatial changes in NOX emissions continued to be significantly influenced by power plants and vehicle sources, with RP/N for these sources decreasing from 1.24 and 3.17 in 2012, respectively, to 1.07 and 2.65 in 2020, respectively. Guangdong Province implemented various NOX reduction policies for power plants during this period, including denitrification, ultra-low emission retrofitting, and the closure of small coal-fired units. For vehicle sources, policies included stricter emission standards, improved fuel quality, the regulation of high-emission vehicles, and the promotion of new energy vehicles. These measures were implemented more rapidly and intensively in the PRD, leading to a shift in primary NOX emission areas from the PRD to the NPRD. Notably, from 2012 to 2017, RP/N for industrial sources dropped from 1.27 to 0.51. This reduction was primarily due to industrial relocation policies, such as the “vacating the cage for new birds” initiative, which shifted NOX-emitting industries from the PRD region to the NPRD region.

3.2.3. PM10

Because the sources of PM2.5 and PM10 are similar, and their spatial changes exhibit similar patterns, this analysis used PM10 as an example. From 2006 to 2020, the ratio of PM10 emissions in the PRD to those in the NPRD (RP/N) decreased from 0.94 to 0.89. This can be primarily attributed to a combination of factors specific to the NPRD region in 2006: lower removal efficiency of industrial emissions compared to later years, significant dust emissions due to insufficient road and construction dust control, and a certain contribution from biomass burning. The spatial changes in PM10 emissions were mainly influenced by industrial sources, with RP/N for industrial sources dropping from 0.76 to 0.48 during this period. This decline was primarily due to the implementation of dust removal measures, comprehensive industrial reforms, and the industrial relocation policies within Guangdong Province. As a key control area for PM10, the PRD exhibited a more significant reduction in emissions compared with the NPRD region. Consequently, the primary PM10 emission areas shifted from the PRD region to the NPRD region.

3.3. Spatial Evolution of Major Emission Sources in Guangdong Province
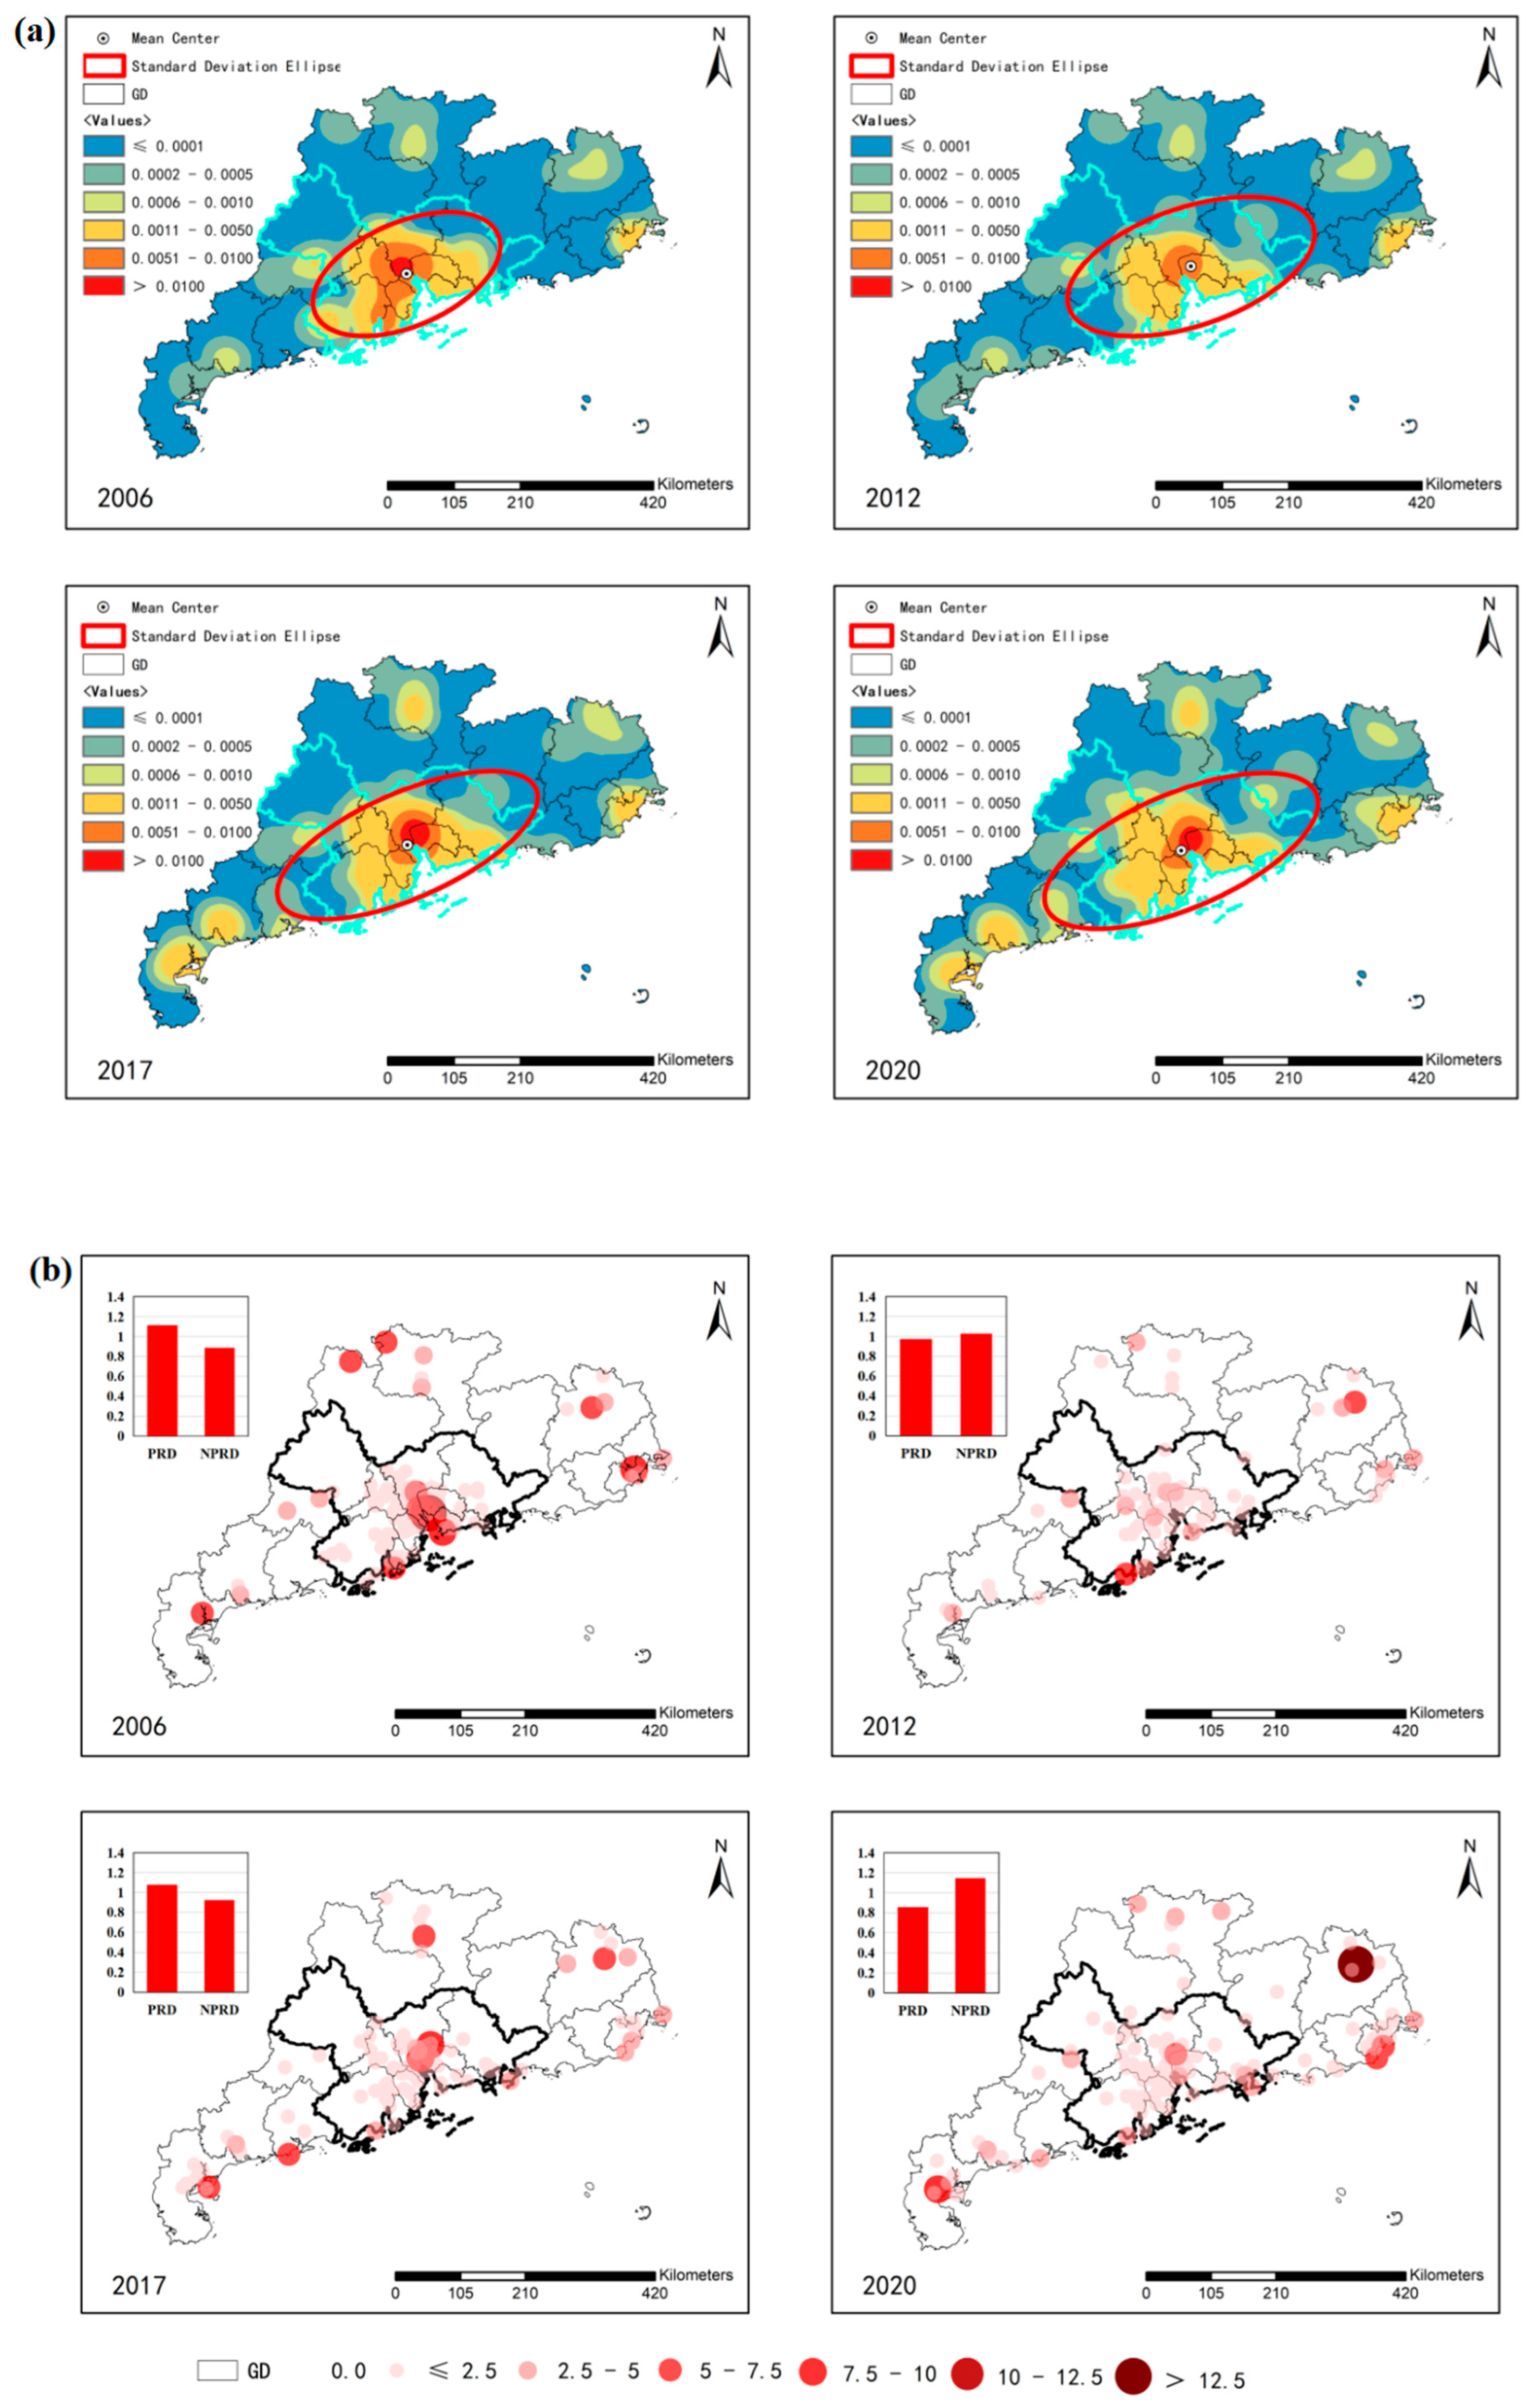
3.3.1. Power Plants

Figure 4a illustrates the spatial distribution of power plants in Guangdong Province across four time periods: 2006, 2012, 2017, and 2020. The red ellipse denotes the standard deviation ellipse, representing the main center of power plant distribution and its spatial variation over time. In 2006, the location of power plants was heavily concentrated in the PRD region, particularly around Guangzhou and Dongguan. This initial distribution reflected the early industrial development focus within the PRD. By 2012, the concentration remained in the PRD, but there was a noticeable expansion toward the eastern, western, and northern parts of Guangdong. This shift was attributed to regional development policies encouraging industrial expansion beyond the PRD. By 2017, the distribution pattern displayed a more pronounced shift toward the northeast, reflecting the ongoing decentralization of power plant locations. In 2020, the continued expansion into the NPRD region was evident.
The spatial shift in power plant locations from the PRD to NPRD was influenced by a series of policies and measures implemented in the PRD [53,64,65]. Policies have been implemented in the PRD that prohibit the construction and expansion of coal-fired power plants, necessitating the relocation of existing plants to less-developed regions. In addition, policies aimed at promoting balanced regional development have incentivized the establishment of power plants in eastern, western, and northern Guangdong.
The spatial distribution of pollutant emissions (SO2 as an example) from power plants in Guangdong Province also underwent similar changes from 2006 to 2020, as shown in Figure 4b. During this period, the primary emissions of power plants in Guangdong Province gradually shifted from the PRD to NPRD regions such as Zhanjiang, Maoming, Yangjiang, Yunfu, Shaoguan, and Shantou. The contributions of SO2 and NOX emissions (Supplementary Materials Figure S1) in the PRD region both exhibited a declining trend, while those in the northern and western parts of Guangdong displayed an increasing trend. This spatial redistribution of emissions closely aligned with the relocation of power plants, suggesting that the migration of power plants was a significant factor influencing the spatial distribution of power plant pollutant emissions. However, the relocation of power plants also led to elevated pollutant emissions in eastern and western Guangdong, while the contributions of SO2 and NOX emissions in the PRD decreased from 55.8% and 57.1% in 2006, respectively, to 42.7% and 51.6% in 2020, respectively; by contrast, the contribution ratios in northern Guangdong increased from 18.1% and 17.5% in 2006, respectively, to 25.0% and 18.2% in 2020, respectively; meanwhile, in western Guangdong, the contribution ratios increased from 8.8% and 8.6% in 2006, respectively, to 14.9% and 14.2% in 2020, respectively.

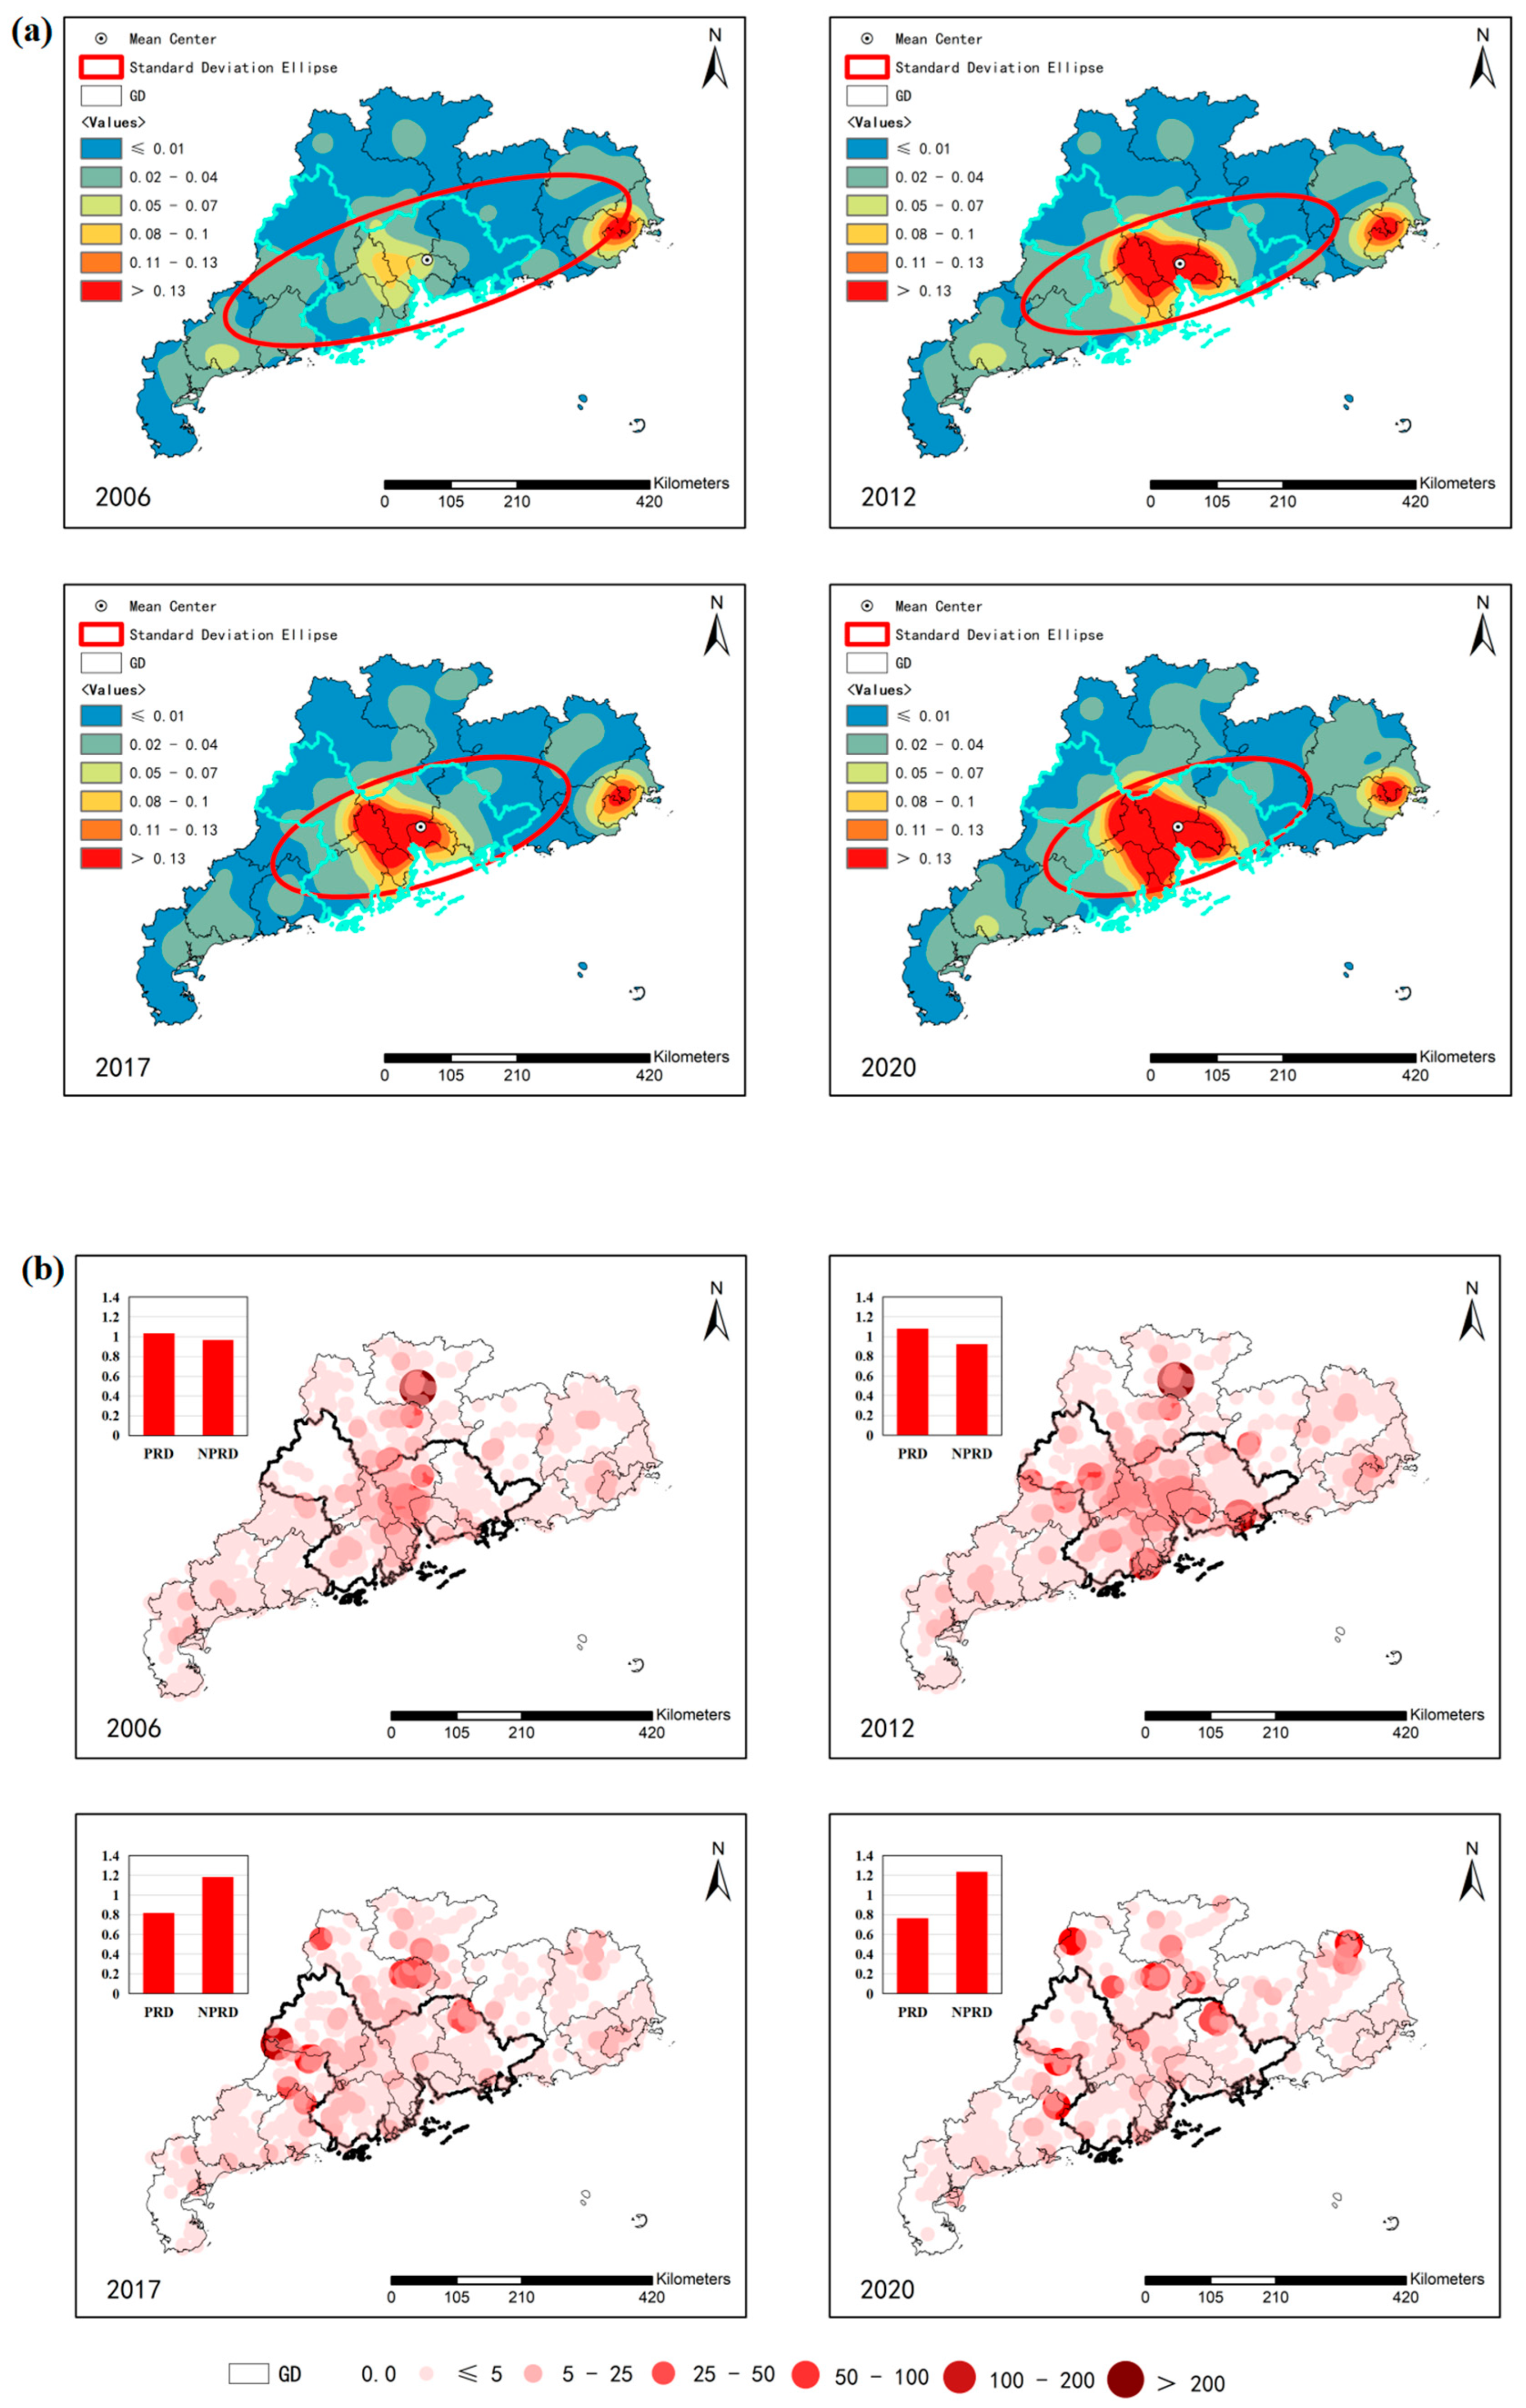
3.3.2. Industrial Sources

As shown in Figure 5a, the number of industrial enterprise locations in the PRD region of Guangdong Province significantly increased from 2006 to 2020. However, during this period, the spatial distribution of industrial enterprises shifted from a relatively widespread southwest–northeast orientation to a more concentrated distribution within the PRD region. In 2006, industrial enterprises were relatively dispersed, extending along a southwest–northeast axis across Guangdong. The distribution became more centralized, with a marked concentration in the PRD region by 2020. The densification was particularly evident in the core urban areas of Guangzhou, Shenzhen, and Dongguan. The length of the major axis of the standard deviation ellipse decreased from 337.20 to 222.39 km, and the eccentricity dropped from 0.69 to 0.58. The eccentricity of the standard deviation ellipse (SDE) quantifies the deviation of the spatial distribution from a circular shape, ranging from 0 (perfect circle) to 1 (extremely elongated linear pattern). In this study, the decline in eccentricity from 0.69 (2006) to 0.58 (2020) indicates a transition from a dispersed, southwest–northeast elongated distribution of industrial sources to a more compact and centralized clustering in the PRD region. This reflects policy-driven industrial agglomeration, where enterprises were concentrated in core PRD cities (e.g., Guangzhou, Shenzhen, Dongguan) despite overall growth in enterprise numbers. Data from the “Guangdong Statistical Yearbook” indicated that the number of large-scale industrial enterprises in Guangdong Province increased from 37,523 in 2006 to 58,504 in 2020, representing a growth of 56%. This growth was even more pronounced in the PRD region, where the proportion of large-scale industrial enterprises rose from 80% in 2006 to 84% in 2020 [18,71,72,73].
Figure 5b displays the spatial change of SO2 emissions from industrial sources across four time periods: 2006, 2012, 2017, and 2020. From 2006 to 2020, the primary emission from industrial sources shifted significantly from the PRD region to the NPRD region. During this period, the contributions of SO2 and NOX emissions to the total emissions in Guangdong Province declined by 13.4% and 12.4%, respectively. Conversely, the contributions from the northern and western regions of Guangdong increased significantly, with SO2 emissions rising by 24.9% and 11.2% in the northern and western regions, respectively, and NOX emissions increasing by 20.9% and 13.3% in the northern and western regions, respectively.
This spatial redistribution of emissions was inversely related to the spatial distribution of industrial enterprises. While the number of large-scale industrial enterprises in the PRD increased, leading to a higher concentration in this region, the emissions did not follow this trend. Two main factors contributed to this phenomenon. First, pollution-intensive industries, such as cement and ceramics production, were relocated from the PRD to the northern and western regions under the industrial relocation policy. This policy relocated pollution-intensive industries, such as cement and ceramics production, from the PRD to less developed regions, transferring their associated emissions. Consequently, major industrial emission sources moved from cities such as Guangzhou, Dongguan, and Foshan to northern cities such as Meizhou, Qingyuan, and Shaoguan, as well as to western cities such as Yangjiang and Yunfu. Second, the PRD implemented stricter environmental regulations, including the “Guangdong Province Air Pollution Control Action Plan (2014–2017)” and the “Pearl River Delta Regional Heavy Air Pollution Emergency Plan (2014).” These policies intensified the management of industrial sources in the PRD, promoted the retrofitting of desulfurization, denitrification, and dust removal equipment, and advanced pollution reduction efforts for industrial sources. These findings suggest that stricter environmental standards and regulatory measures can mitigate the high-intensity, concentrated emissions resulting from industrial clustering in the PRD.

3.3.3. Vehicle Sources

In the present study, parking lots and gas stations were utilized as proxies to analyze the spatial distribution and evolution of vehicle ownership in Guangdong Province. Due to the relatively poor quality of POI data for gas stations and parking lots in 2006, the analysis primarily focused on the period from 2012 to 2020. As shown in Figure 6a, the locations of parking lots and gas stations in Guangdong Province were predominantly concentrated in the PRD region, particularly in major cities such as Guangzhou and Shenzhen. In 2020, new clusters emerged in NPRD areas, particularly around major intersections of highways and national roads in cities including Zhanjiang, Maoming, Yangjiang, Shaoguan, and Shantou.
During this period, the standard deviation ellipses for the POIs related to parking lots and gas stations displayed slight increases in both the major and minor axes, which grew from 165.65 and 75.26 km, respectively, to 165.55 and 75.48 km, respectively. This change reflected a trend in which the spatial distribution of these facilities expanded outward from the PRD region. This expansion correlated with changes in vehicle ownership trends documented in the “Guangdong Statistical Yearbook”. From 2012 to 2020, vehicle ownership in NPRD areas grew by 252%, compared with a growth rate of 114% in the PRD region [18,72].
The spatial distribution of vehicle NOX emissions in Guangdong Province for the years 2012 and 2020 is illustrated in Figure 6b. In 2012, vehicle NOX emissions were predominantly concentrated in the PRD region, particularly in bustling urban areas such as Guangzhou, Foshan, Dongguan, Shenzhen, and Zhongshan. These areas contributed over 70% of the total NOX emissions from vehicle sources in the province. Beyond the PRD, other high-emission areas were observed in NPRD cities, including Shantou, Chaozhou, and Jieyang in eastern Guangdong and Shaoguan and Meizhou in northern Guangdong, especially at major intersections of provincial and national roads.
Between 2012 and 2020, there was a shift in the spatial distribution of vehicle NOX emissions across Guangdong Province. While the PRD region remained the primary contributor to NOX emissions, its share of the total emissions decreased, with the contribution gap between the PRD and NPRD regions narrowing from 52.1% to 45.3%. Conversely, the contributions from eastern and northern Guangdong increased, with NOX emissions in these regions rising from 6.9% and 8.5% for eastern and northern Guangdong, respectively, to 7.3% and 11.7%, respectively. This shift in spatial distribution was attributed to several factors. The implementation of stricter national standards and the phase-out of high-emission vehicles played a crucial role in reducing overall NOX emissions in the PRD. Further, as economic development and urbanization progressed in NPRD regions, vehicle ownership and traffic volumes increased, leading to higher emissions in these areas. In addition, the expansion of transportation networks and infrastructure in NPRD regions facilitated greater vehicular movement, thereby contributing to the rise in NOX emissions.

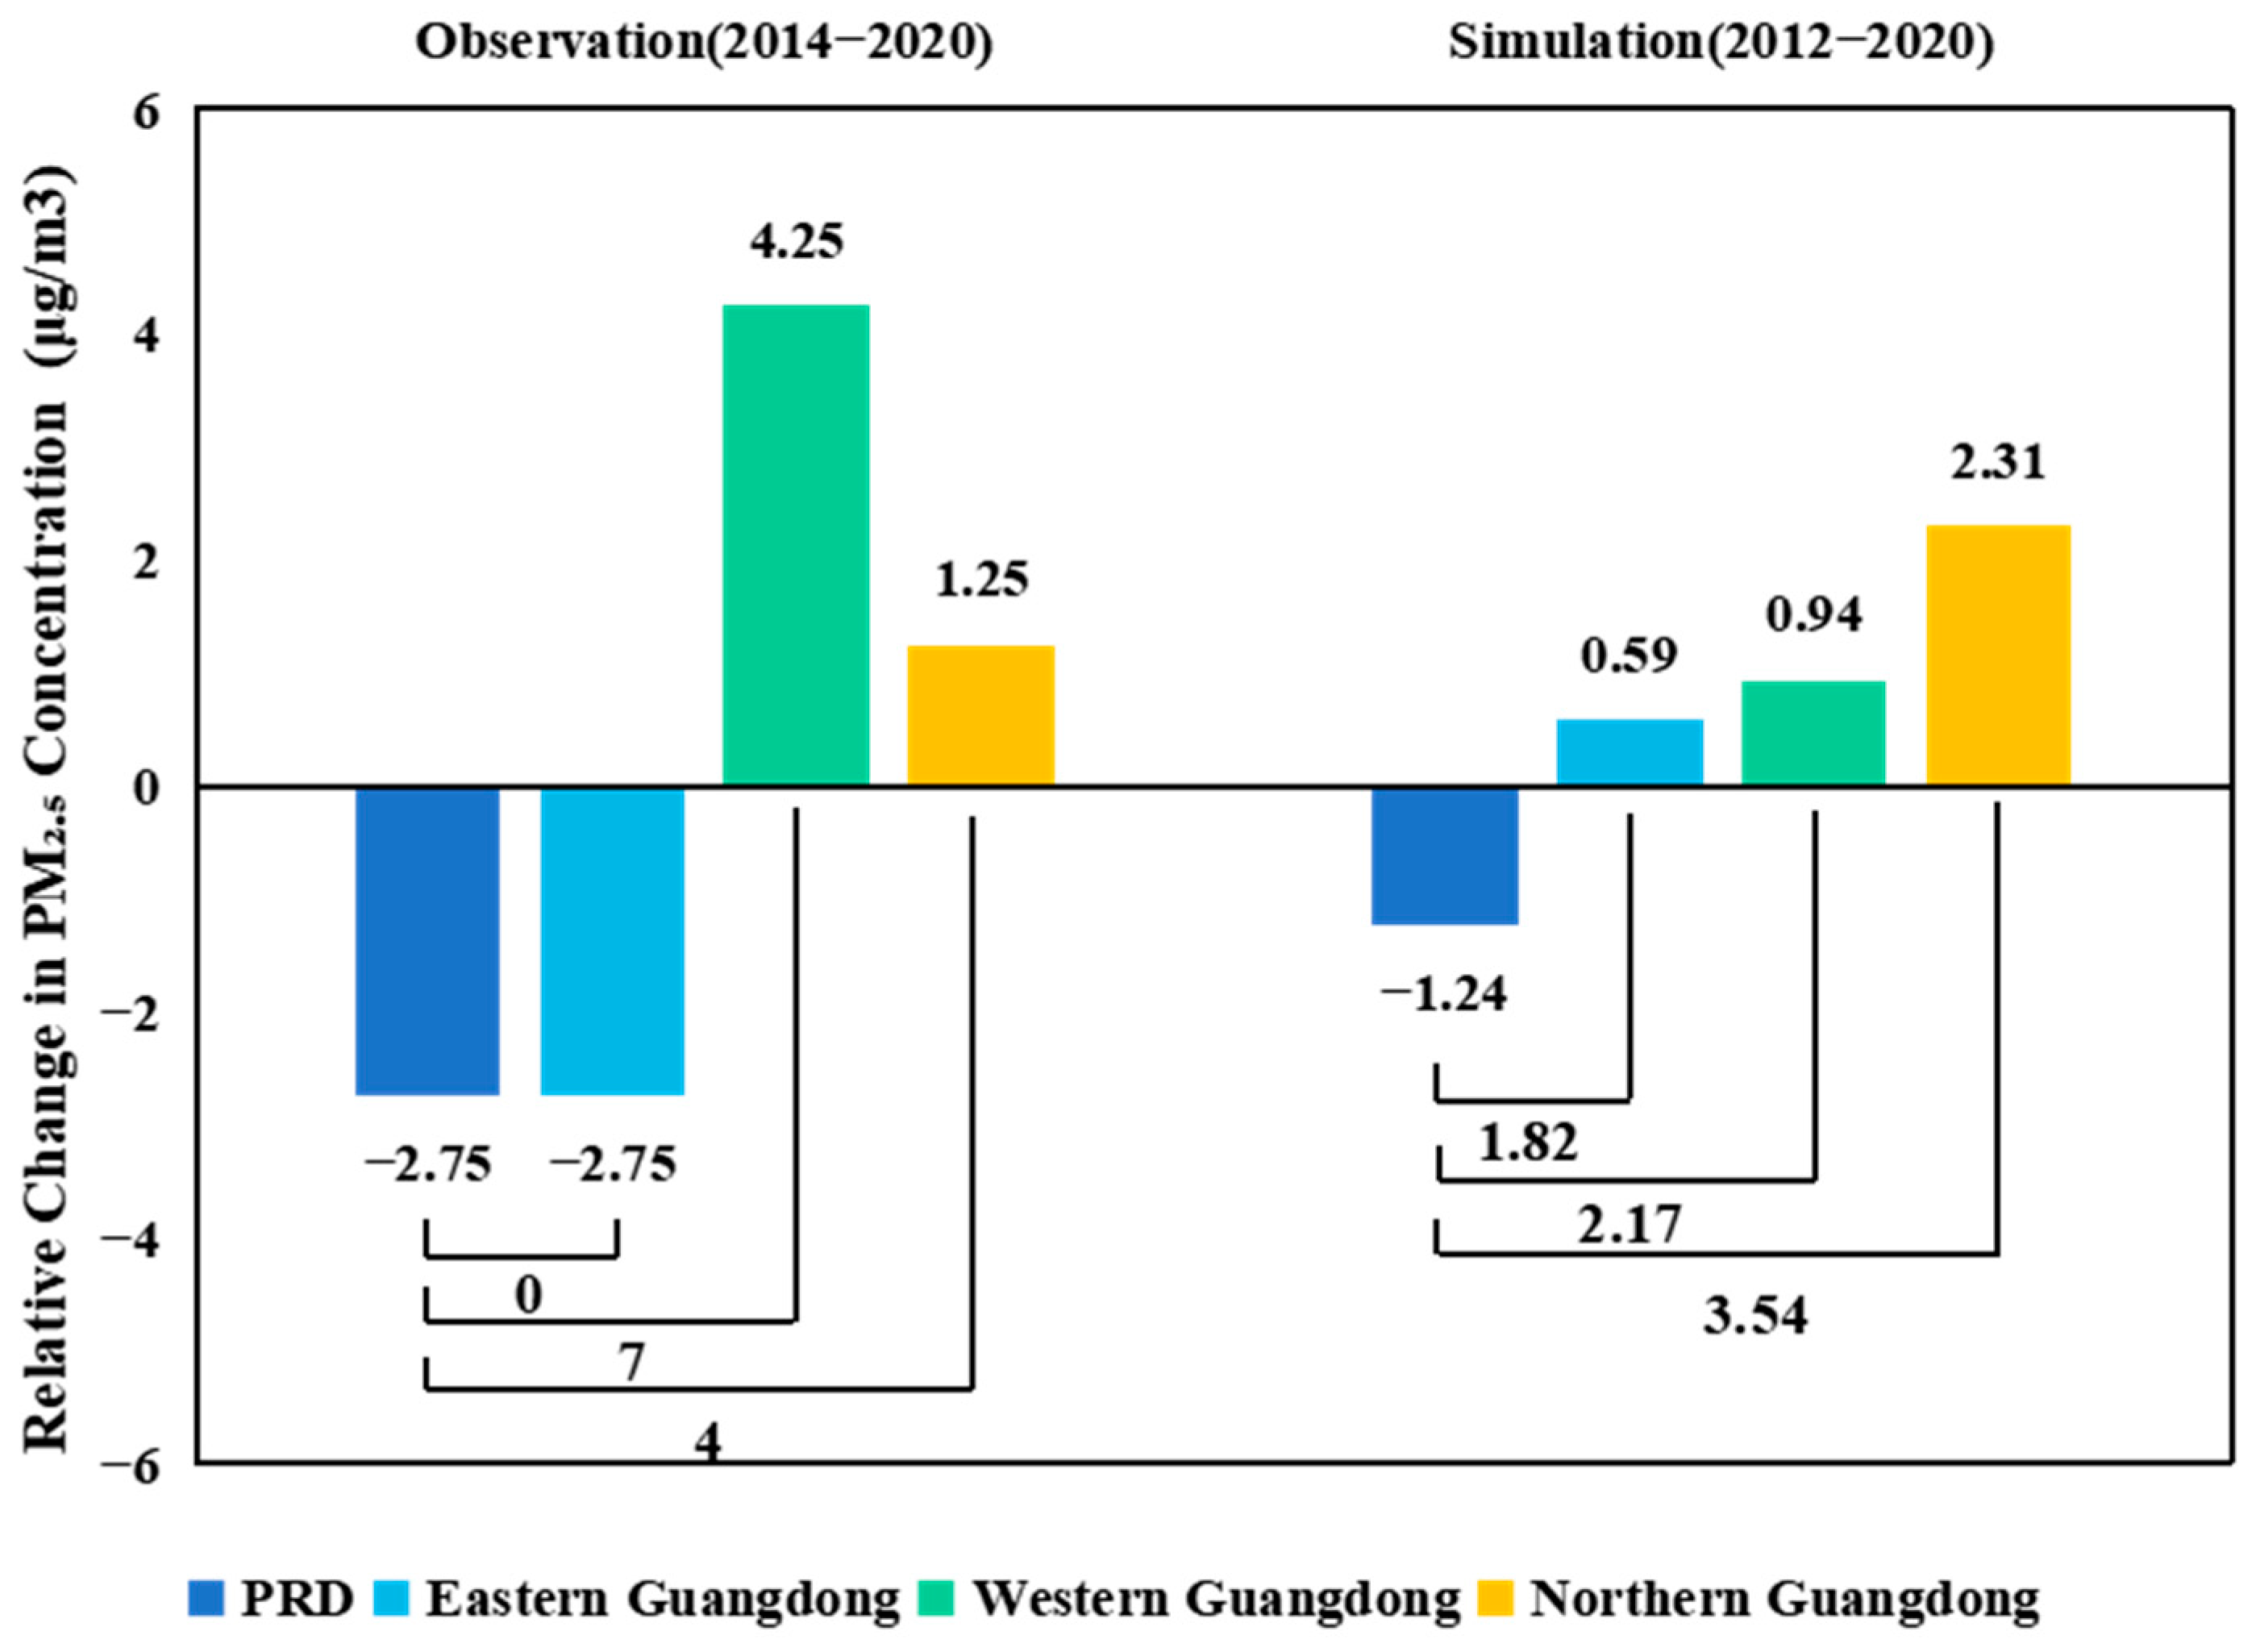
3.4. Impact of Emission Evolution on PM2.5 Pollution in Guangdong Province

3.4.1. Impact of Total Emission Changes

Figure 7 illustrates the impact of emission changes from 2012 to 2020 on PM2.5 pollution in Guangdong Province. The meteorological data and emission inventories in 2020 were utilized as inputs in the Base scenario; meanwhile, in the Case 1 scenario, the emissions in Guangdong were adjusted back to 2012 levels while the spatial distribution remained unchanged. A comparison between the Base scenario and Case 1 revealed that the reduction in precursor emissions in Guangdong from 2012 to 2020 resulted in a significant decrease in PM2.5 concentrations. Specifically, the average PM2.5 concentration in Guangdong in April decreased by 10.5 µg/m3, and that in October declined by 9.2 µg/m3. The relatively smaller reduction in October was attributed to the greater influence of the transboundary transport of precursors from external regions during the autumn, which diminished the local effect on PM2.5 reduction compared with April.
The decline in PM2.5 concentrations varied across different sub-regions of Guangdong. In April, the PRD region exhibited an average reduction of 14.9 µg/m3 in PM2.5 concentrations in 2020 compared with 2012, representing a 38.2% decline. In the NPRD regions, PM2.5 concentrations decreased by 16.2 µg/m3 in eastern Guangdong, 15.5 µg/m3 in western Guangdong, and 11.5 µg/m3 in northern Guangdong, with reduction rates of 39.7%, 38.9%, and 34.5%, respectively. These rates were comparable to those observed in the PRD region. As shown in Figure 6a, the most significant decreases in PM2.5 concentrations occurred primarily in central PRD cities, including Zhaoqing, Zhongshan, Shenzhen, Huizhou, and Guangzhou. These cities are known for relatively high precursor emissions and elevated PM2.5 pollution levels within the PRD. Notably, Zhaoqing, historically one of the cities with the highest PM2.5 concentrations in the PRD, saw the most substantial improvement. Cities in eastern Guangdong, such as Shantou and Jieyang, western Guangdong cities like Yangjiang, and northern Guangdong cities such as Yunfu and Heyuan also exhibited large reductions in PM2.5 concentrations, with declines ranging from 42.1% to 47.1%. These cities similarly had high precursor emissions and PM2.5 pollution levels, which contributed to the notable improvements.
In October, the average PM2.5 concentration in the PRD region decreased by 13.5 µg/m3 between 2012 and 2020, a reduction of 33%. In NPRD regions, PM2.5 concentrations decreased by 15.9 µg/m3 in eastern Guangdong, 13.8 µg/m3 in western Guangdong, and 7.6 µg/m3 in northern Guangdong, with corresponding reduction rates of 34.9%, 33.6%, and 28.6%, respectively. As shown in Figure 6b, under the influence of prevailing northeasterly winds, the most significant PM2.5 reductions occurred in the central and downwind areas of the PRD, including cities such as Zhaoqing, Zhongshan, Shenzhen, and Huizhou. In the NPRD regions, cities such as Shantou and Jieyang in eastern Guangdong, Yangjiang in western Guangdong, and Yunfu in northern Guangdong also exhibited greatly improved PM2.5 concentrations, with reductions ranging from 31.1% to 39.3%.
According to available observational data, the observed average PM2.5 concentration in the PRD was 43 µg/m3 in 2013 and 21 µg/m3 in 2020, reflecting a 51.2% decrease during this period. Using model simulations, Zhang et al. (2023) [61] estimated that close to 60% of the PM2.5 reduction in PRD between 2013 and 2020 was due to reduced precursor emissions in Guangdong Province. Similarly, this study demonstrated that during the period from 2012 to 2020, the reduction in precursor emissions across Guangdong Province led to an average PM2.5 improvement in the PRD of 33–38.2%, which was comparable to the results of Zhang et al. (2023). Although the study periods differed, both analyses confirmed that decreased precursor emissions in Guangdong were the primary factor driving PM2.5 improvements in the PRD. Likewise, the decline in precursor emissions across Guangdong also contributed significantly to the improvement in PM2.5 concentrations in NPRD regions.

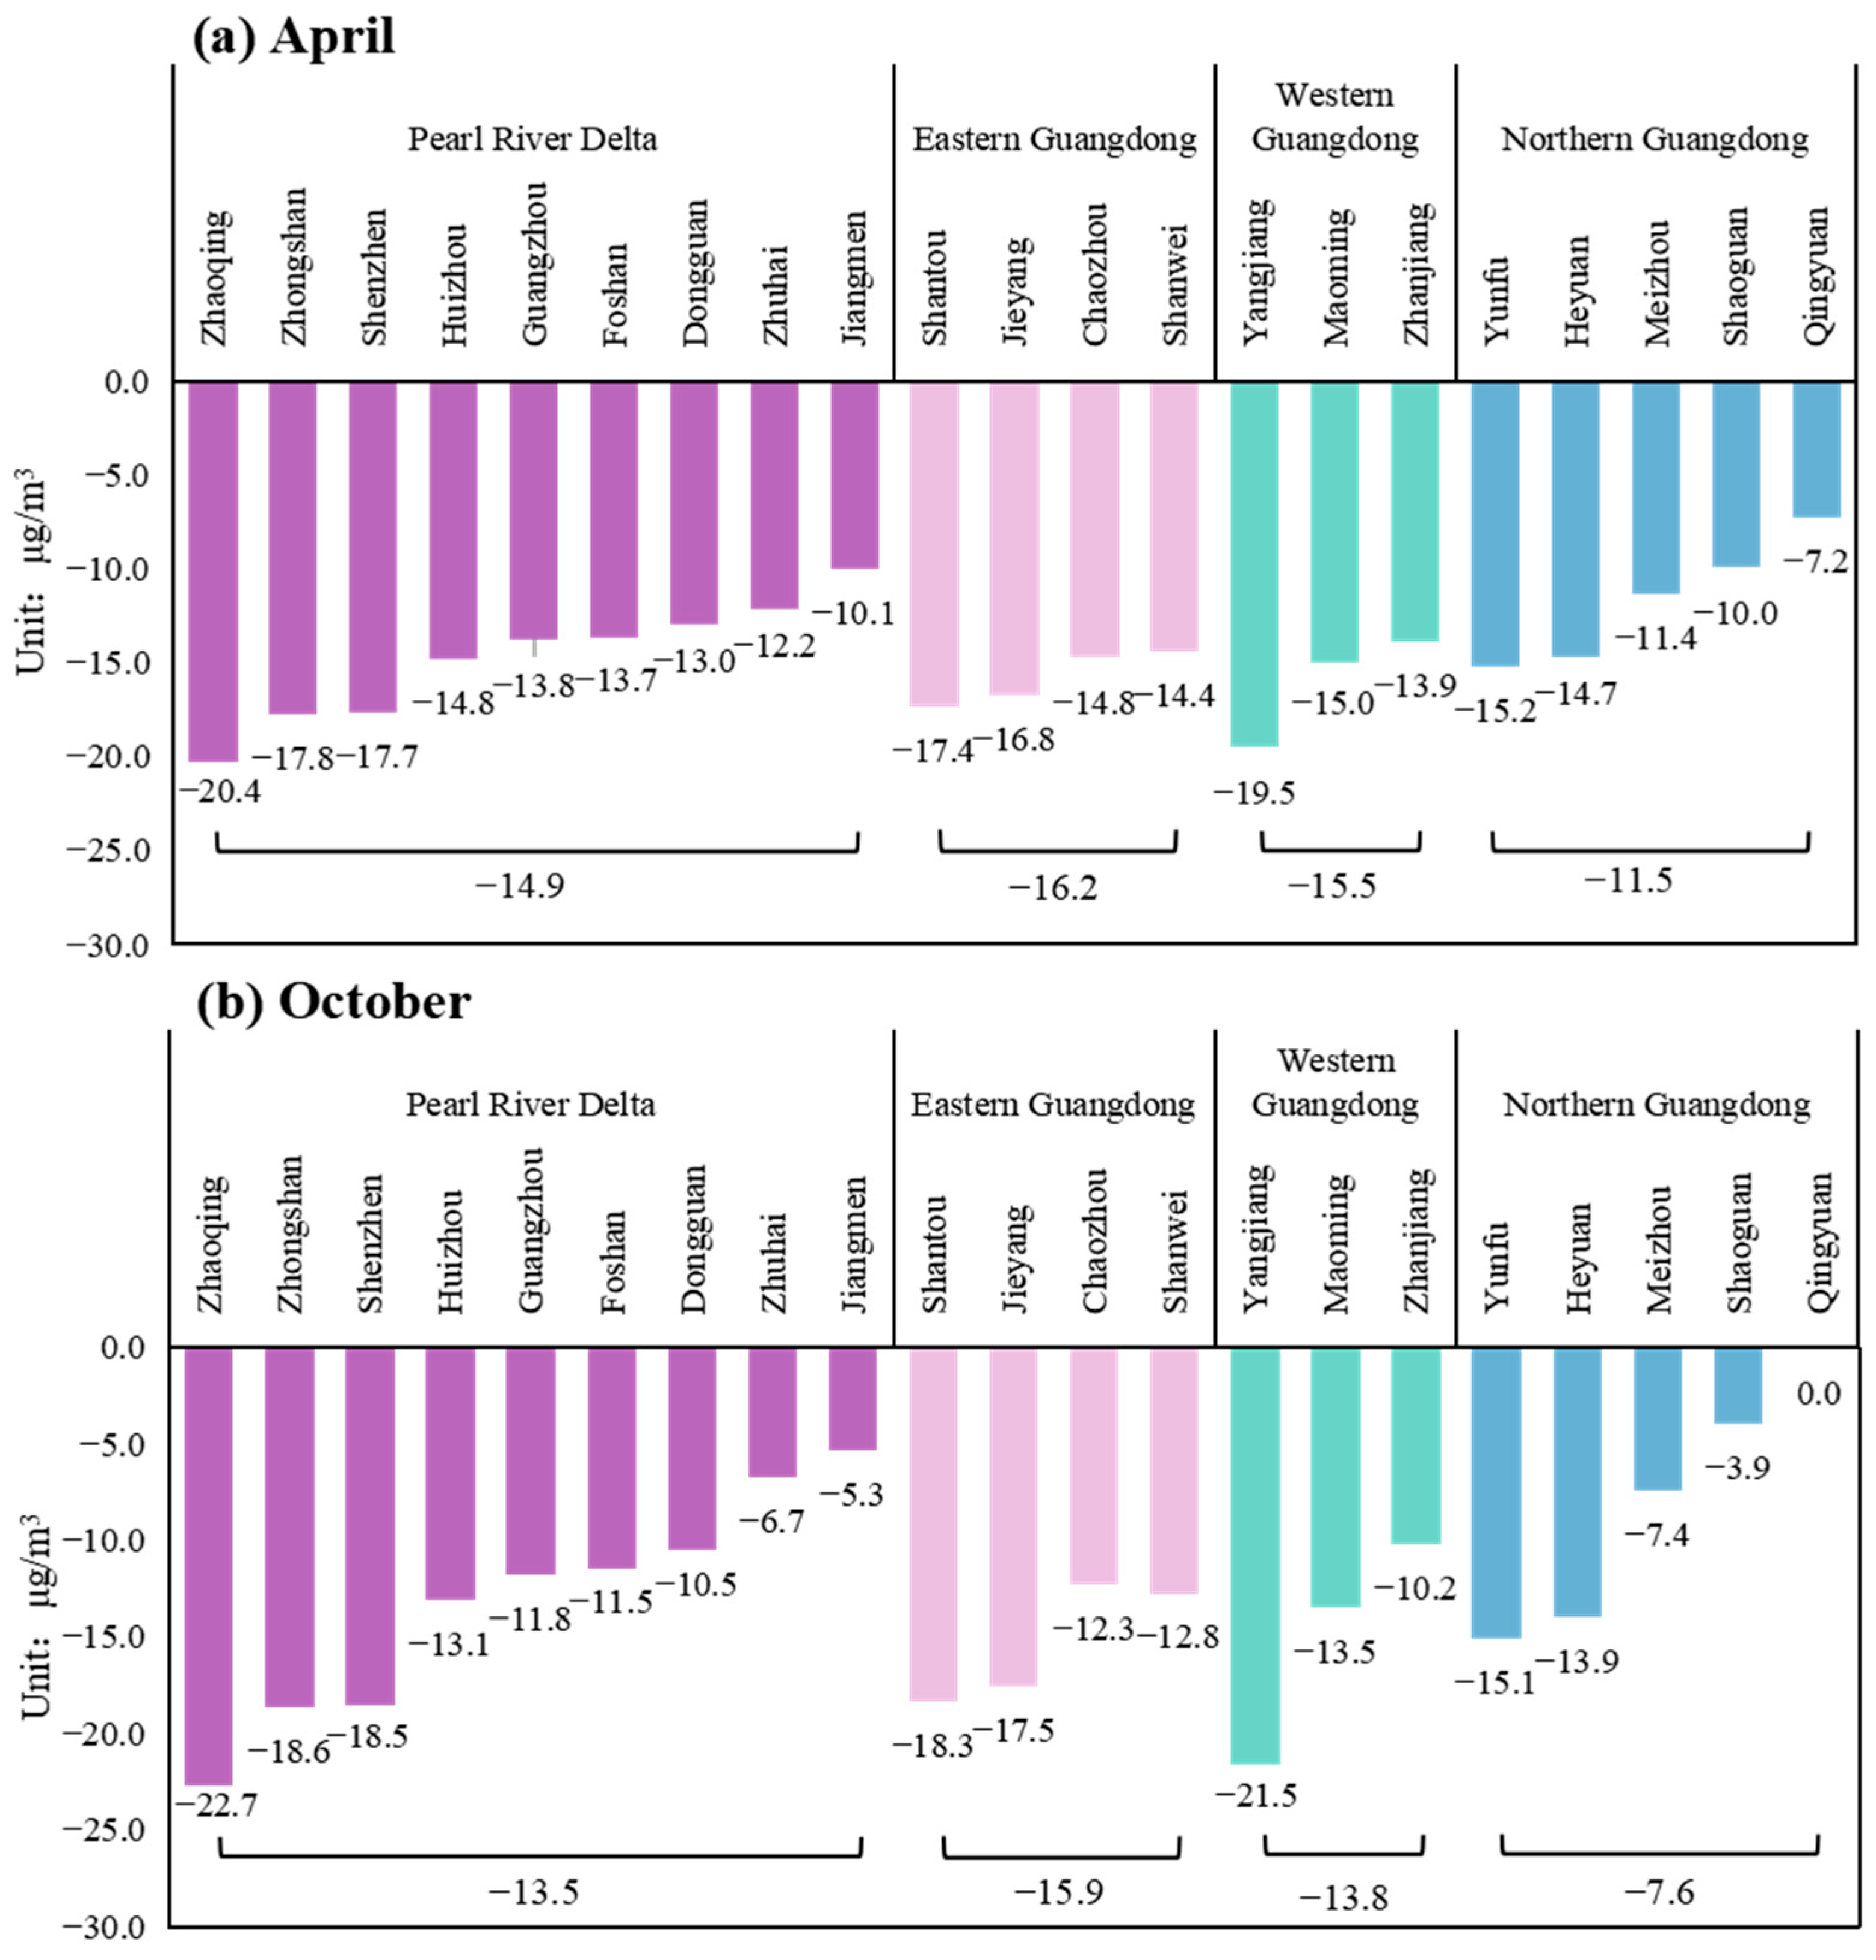
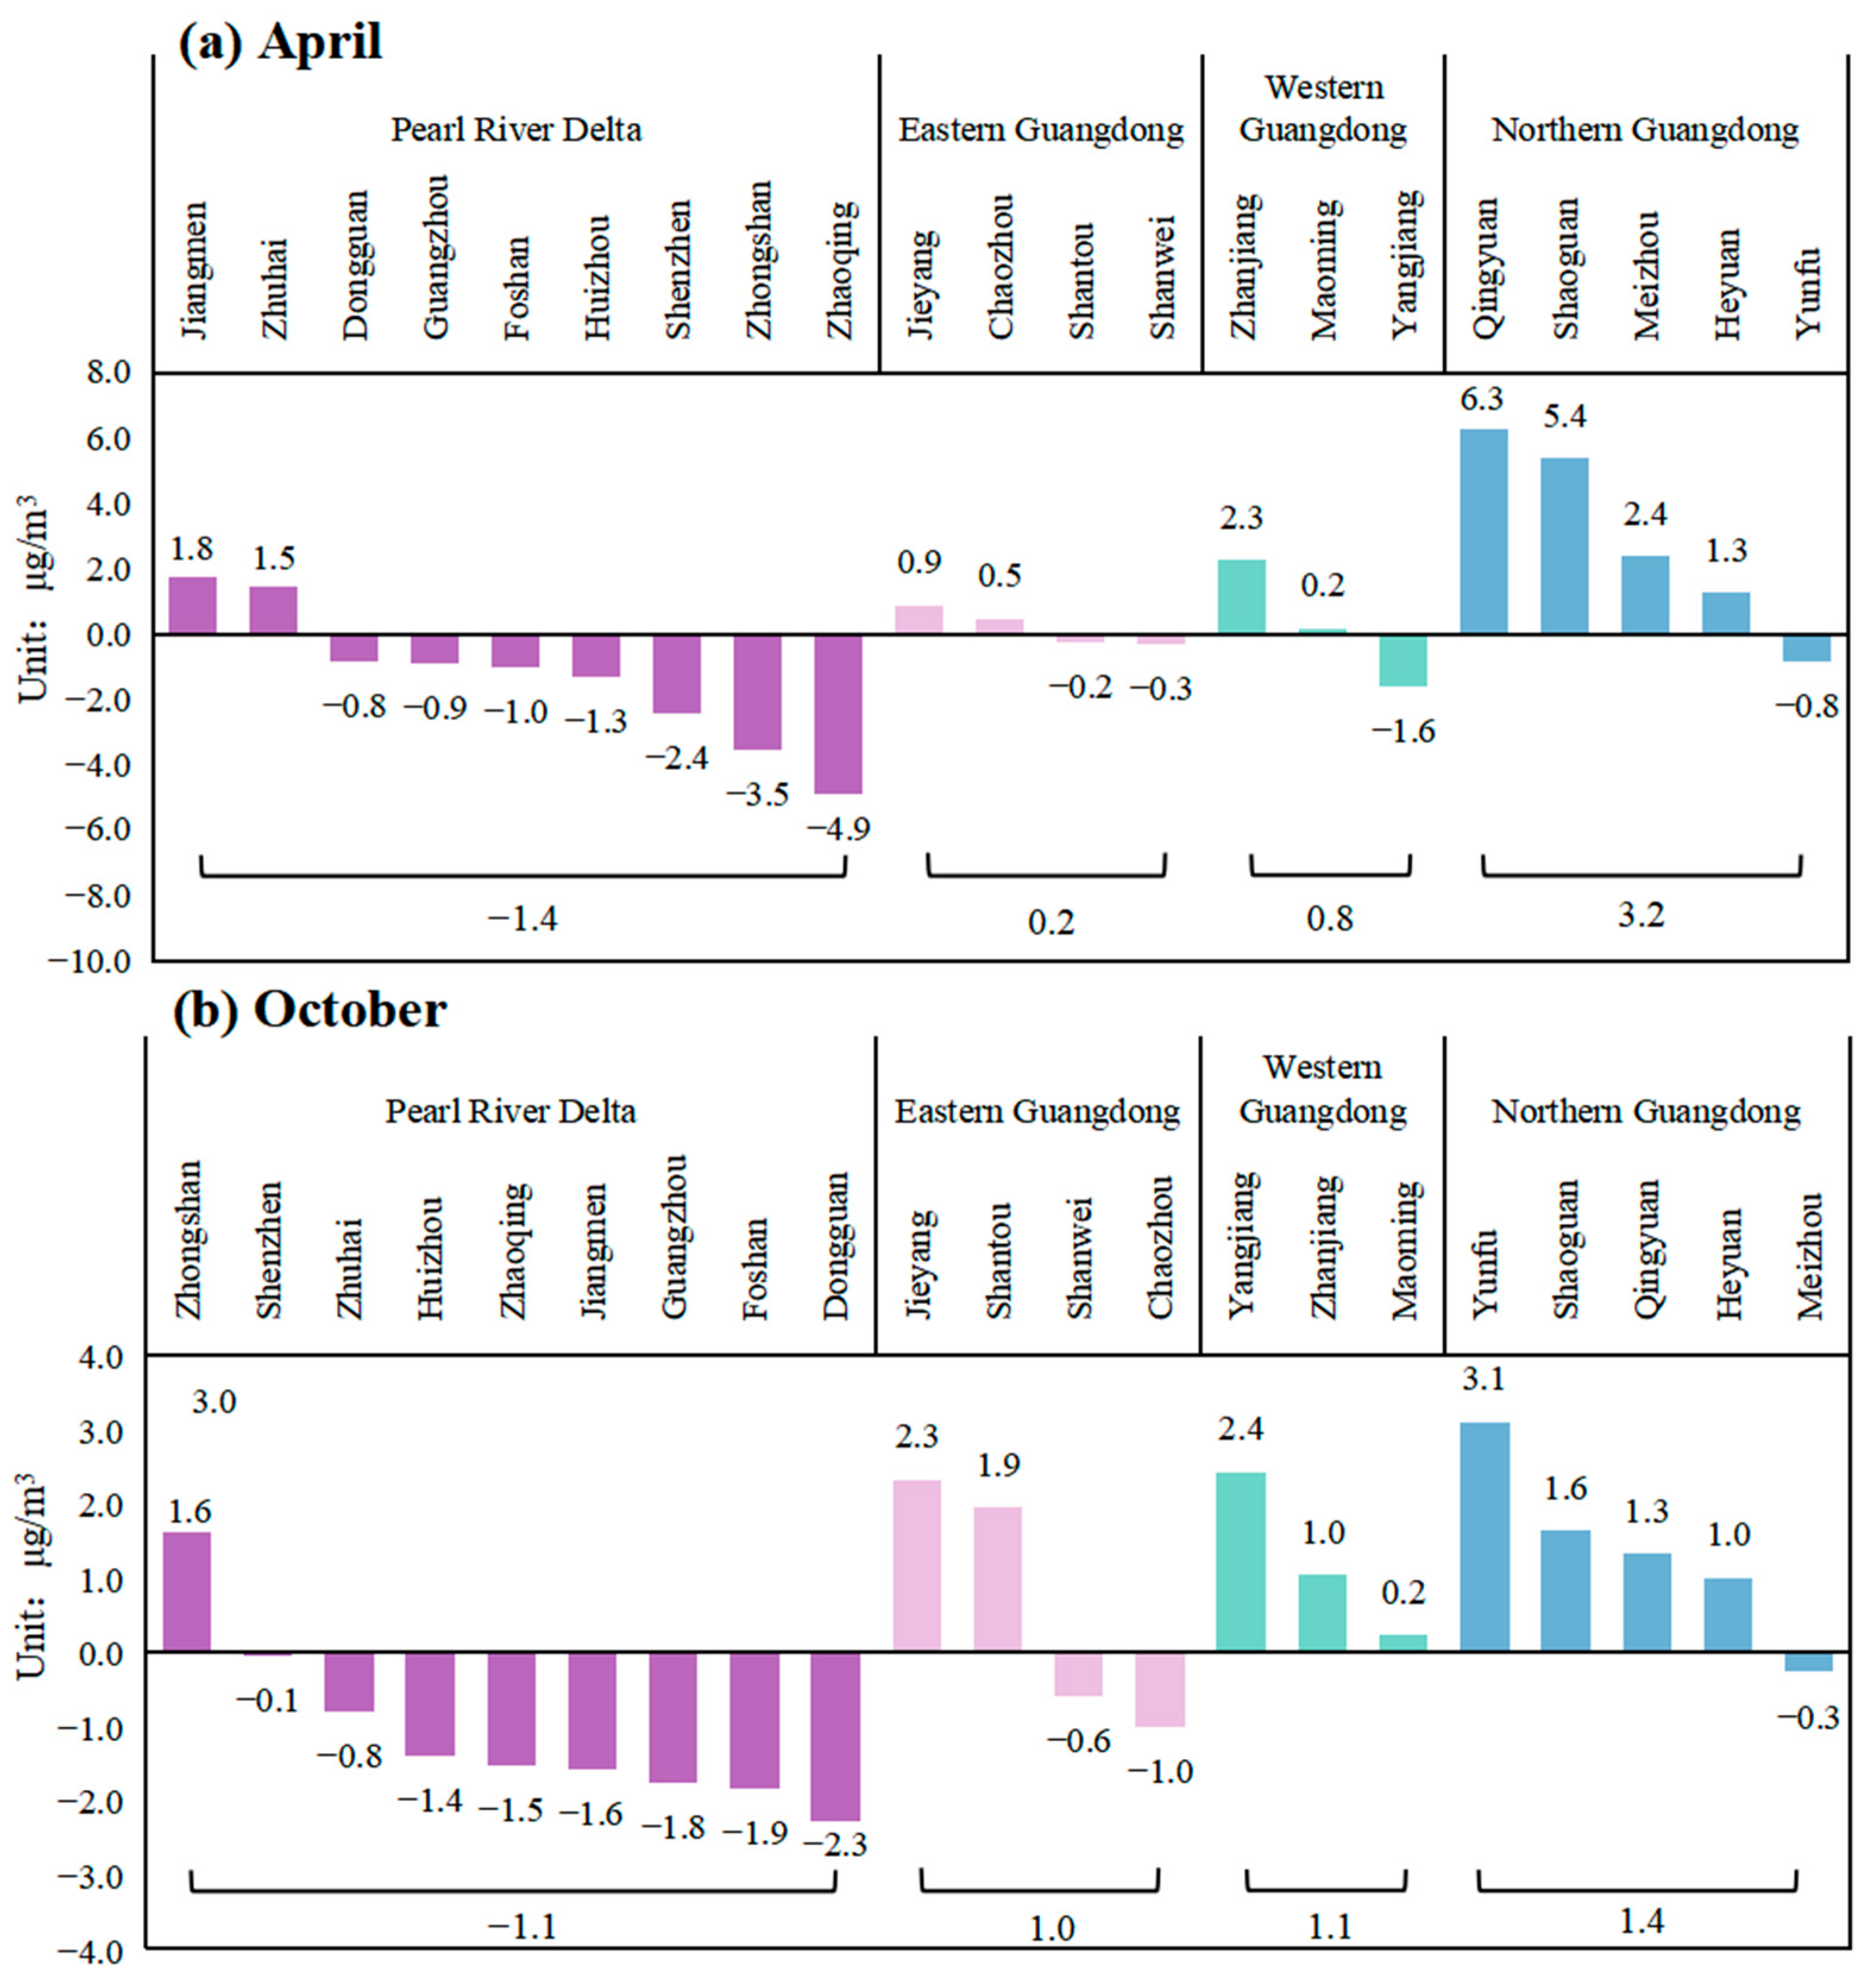
3.4.2. Impact of Spatial Changes

Figure 8 depicts the impact of spatial changes in emissions on PM2.5 pollution in Guangdong Province. In Case 2, the spatial distribution of emissions was adjusted to the 2012 level based on Case 1. A comparison between Cases 1 and 2 revealed that the spatial changes in precursor emissions had a minimal effect on the overall PM2.5 concentration in Guangdong Province from 2012 to 2020, with changes in April and October being only 0.1 μg/m3.
However, the effect of spatial changes in precursor emissions varied across different sub-regions. In April, in addition to the total emissions, spatial changes in precursor emissions further reduced the PM2.5 concentration in the PRD region by 1.4 μg/m3, corresponding to a decrease of 9.1%. Specifically, the PM2.5 concentrations in Zhaoqing, Zhongshan, Shenzhen, and Huizhou within the PRD region declined by 4.9, 3.5, 1.7, and 0.9 μg/m3, respectively. In October, the PM2.5 concentration in the PRD region further decreased by 1.1 μg/m3, equivalent to an 8.0% reduction. Notably, among downwind cities, reductions were obvious in Dongguan, Foshan, Guangzhou, and Jiangmen, with decreases of 2.3, 1.9, 1.8, and 1.6 µg/m3, respectively. These findings suggest that policies such as industrial upgrading (referred to as the “cage for birds” strategy), industrial relocation, and more stringent emission reduction measures can further enhance air quality in the PRD region.
However, compared with the PRD region, PM2.5 concentrations in NPRD areas increased. In April, PM2.5 concentrations in northern, western, and eastern Guangdong rose by 3.2, 0.8, and 0.2 μg/m3, respectively, with Qingyuan in northern Guangdong exhibiting the most significant increase at 6.5 μg/m3. In October, PM2.5 concentrations increased by 1.4 µg/m3 in northern Guangdong, 1.1 µg/m3 in western Guangdong, and 1.0 µg/m3 in eastern Guangdong, with Yunfu in northern Guangdong displaying the most notable increase at 3.1 µg/m3. According to the above analysis, the proportion of precursor emissions, such as SO2, NOX, and PM2.5, gradually increased in the NPRD. This rising proportion led to a smaller improvement in PM2.5 pollution in these areas compared with the PRD region. In addition to differences in precursor emission control strategies, industrial relocation policies drove some emissions toward NPRD areas. Research by Zhang et al. (2023) [61] indicates that changes in precursor emissions in NPRD regions can impact PM2.5 concentrations in the PRD by 16–18%. This suggests that the transfer of emissions to NPRD areas not only hinders improvements in PM2.5 concentrations within those regions but also undermines overall reductions in PM2.5 pollution in the PRD.
The analysis indicates that changes in the spatial distribution of emissions have resulted in unequal improvements in PM2.5 pollution between the PRD and NPRD regions. For example, in April, the disparity in PM2.5 improvement between the PRD and NPRD regions reached 2.7 µg/m3, while the difference between the PRD and northern Guangdong was 4.6 µg/m3. In October, the inequality in PM2.5 improvement between these regions declined to 2.3 µg/m3, with a difference of 2.5 µg/m3 between the PRD and northern Guangdong. Observations revealed a similar pattern of unequal PM2.5 improvement between the PRD and NPRD regions. As illustrated in Figure 9, PM2.5 concentrations in the PRD further decreased by 2.75 µg/m3 compared with the provincial average, whereas they increased by 4.25 and 1.25 µg/m3 in western and northern Guangdong, respectively. This difference aligns with the quantified results of this study, indicating that changes in the spatial distribution of precursor emissions are a major factor contributing to the unequal improvement in PM2.5 levels within Guangdong Province.

4. Conclusions

This study comprehensively analyzed the temporal trends, spatial evolution, and impacts of anthropogenic emissions of major pollutants (SO2, NOX, PM10, and PM2.5) in Guangdong Province from 2006 to 2020. The results indicated a significant reduction in pollutant emissions due to a series of air pollution control measures implemented by the Guangdong provincial government [66,67,68,69,70]. The study also revealed a clear shift in emission hotspots from the PRD region towards the NPRD region; these were primarily driven by stricter environmental policies in the PRD and associated industrial restructuring. This spatial evolution was accompanied by a notable redistribution of emission sources, including the relocation of power plants.
This study analyzed the impact of both total emission changes and their spatial evolution on air quality using CMAQ model. Precursor emission reductions were a primary driver of PM2.5 improvement in Guangdong. However, the spatial evolution of emissions enhanced regional disparities in air quality improvements across Guangdong, with more pronounced improvement in the PRD and suppressed improvement in NPRD regions. These regional disparities of PM2.5 improvement present new challenges: while the PRD has substantially reduced emissions, the NPRD now bears a larger share, necessitating more refined air pollution control strategies tailored to each region’s specific needs and development. Furthermore, the potential for relocated emissions to offset gains in other areas, exacerbated by cross-regional pollutant transport (where NPRD emissions impact PRD PM2.5), underscores the need for coordinated efforts. Strengthening controls in the NPRD, particularly northern Guangdong, is crucial for narrowing the regional gap.
While the findings of this study provide valuable insights, several limitations should be noted. First, the analysis relied on emission inventories and model simulations, which may have introduced uncertainties due to potential biases in emission estimates and meteorological inputs. For example, the influence of transboundary pollutant transport from neighboring provinces was not explicitly quantified, which could affect the interpretation of PM2.5 mitigation in the NPRD regions. Second, this study focused on major pollutants (SO2, NOX, PM10, and PM2.5) but did not account for the role of VOCs or secondary organic aerosols, which are critical precursors for ozone and secondary PM2.5 formation. Finally, apart from policy interventions and socioeconomic drivers, climatic features, such as precipitation, temperature, and humidity, that can impact the biogenic VOCs emissions, biomass burning, soil emissions and agriculture emissions, were not considered in this study [74,75,76]. Future work could integrate these factors to achieve a more comprehensive understanding of air pollution dynamics.

Supplementary Materials

The following supporting information can be downloaded at: https://www.mdpi.com/article/10.3390/su17114844/s1, Figure S1. Evolution of NOX emissions from power plants in Guangdong Province from 2006 to 2020; Figure S2. Evolution of NOX emissions from industrial sources in Guangdong Province from 2006 to 2020.

Author Contributions

J.L.: Conceptualization, Methodology, Formal analysis, Data curation, Writing—original draft, Writing—review and editing. K.Z.: Investigation. C.C.: Data curation, Writing—review and editing. Z.H.: Methodology, Supervision, Conceptualization, Writing—review and editing. Y.H.: Investigation, Data curation. Q.S.: Data curation. M.Z.: Data curation. H.C.: Investigation. J.Z.: Supervision, Writing—review and editing. All authors have read and agreed to the published version of the manuscript.

Funding

This work was supported by the National Key Research and Development Program of China (No. 2023YFC3705603).

Institutional Review Board Statement

Not applicable.

Informed Consent Statement

Not applicable.

Data Availability Statement

Data will be made available on request.

Acknowledgments

We thank LetPub (www.letpub.com.cn) for its linguistic assistance during the preparation of this manuscript.

Conflicts of Interest

The authors declare that the research was conducted in the absence of any commercial or financial relationships that could be construed as potential conflicts of interest.

References

  1. State Council of the People’s Republic of China. Action Plan for Air Pollution Prevention and Control; State Council of the People’s Republic of China: Beijing, China, 2013.
  2. Guangdong Provincial Government. Implementation Plan of Guangdong Province for Winning the Battle for Blue Skies (2018–2020); Guangdong Provincial Government: Guangzhou, China, 2019.
  3. Guangdong Provincial Department of Ecology and Environment. 2023 Guangdong Provincial Ecological Environment Bulletin; Guangdong Environmental Protection Department: Guangzhou, China, 2023. Available online: https://gdee.gd.gov.cn/hjzkgb/content/post_4411008.html (accessed on 4 April 2025).
  4. Ma, P.; Cao, S.; Liu, Y.; Huang, J. Analysis of Vehicle Emission Characteristics and Variations in Guangdong Province from 2006 to 2012. Res. Environ. Sci. 2015, 28, 855–861. [Google Scholar]
  5. Mo, H.; You, Y.; Wu, L.; Yan, F.; Chang, M.; Wang, W.; Wang, P.; Wang, X. Potential impact of industrial transfer on PM2.5 and economic development under scenarios oriented by different objectives in Guangdong, China. Environ. Pollut. 2023, 316, 120562. [Google Scholar] [CrossRef] [PubMed]
  6. Guangdong Provincial Government. Measures for the Prevention and Control of Air Pollution in the Pearl River Delta Region of Guangdong Province; Guangdong Provincial Government: Guangzhou, China, 2009.
  7. Guangdong Environmental Protection Department. Notice on Issuing the 2011 Implementation Plan for the Pearl River Delta Clean Air Action Plan; Guangdong Environmental Protection Department: Guangzhou, China, 2011. [Google Scholar]
  8. Guangdong Provincial Committee of the Communist Party of China; Guangdong Provincial Government. Decision of the People’s Government of Guangdong Province on Promoting Industrial Transfer and Labor Transfer; Guangdong Provincial Committee of the Communist Party of China: Guangzhou, China; Guangdong Provincial Government: Guangzhou, China, 2008.
  9. Bian, Y.; Huang, Z.; Ou, J.; Zhong, Z.; Xu, Y.; Zhang, Z.; Xiao, X.; Ye, X.; Wu, Y.; Yin, X.; et al. Evolution of anthropogenic air pollutant emissions in Guangdong Province, China, from 2006 to 2015. Atmos. Chem. Phys. 2019, 19, 11701–11719. [Google Scholar] [CrossRef]
  10. Chen, L.; Xu, L.; Yang, Z. Accounting carbon emission changes under regional industrial transfer in an urban agglomeration in China’s Pearl River Delta. J. Clean. Prod. 2017, 167, 110–119. [Google Scholar] [CrossRef]
  11. Wei, D.; Liu, Y.; Zhang, N. Does industry upgrade transfer pollution: Evidence from a natural experiment of Guangdong province in China. J. Clean. Prod. 2019, 229, 902–910. [Google Scholar] [CrossRef]
  12. Liu, Y. Industrial resettlement and environmental pollution in Guangdong Province: An empirical study on twenty-one prefecture-level cities by DID. Ind. Econ. Rev. 2016, 4, 91–106. [Google Scholar]
  13. Yin, X.; Huang, Z.; Zheng, J.; Yuan, Z.; Zhu, W.; Huang, X.; Chen, D. Source contributions to PM2.5 in Guangdong province, China by numerical modeling: Results and implications. Atmos. Res. 2017, 186, 63–71. [Google Scholar] [CrossRef]
  14. Yang, C. Restructuring the export-oriented industrialization in the Pearl River Delta, China: Institutional evolution and emerging tension. Appl. Geogr. 2012, 32, 143–157. [Google Scholar] [CrossRef]
  15. Yang, B.; Mao, Y. Industrial relocation policy and firm migration: An empirical analysis from Guangdong industrial relocation survey data. South China J. Econ. 2014, 3, 1000–6249. [Google Scholar]
  16. Cui, X.; Lei, Y.; Zhang, F.; Zhang, X.; Wu, F. Mapping spatiotemporal variations of CO2 (carbon dioxide) emissions using nighttime light data in Guangdong Province. Phys. Chem. Earth. 2019, 110, 89–98. [Google Scholar] [CrossRef]
  17. Yang, L.; Zhang, H.; Liao, X.; Wang, H.; Bian, Y.; Liu, G.; Luo, W. The Relationship between Spatial Characteristics of Urban-Rural Settlements and Carbon Emissions in Guangdong Province. Int. J. Environ. Res. Public Health 2023, 20, 2659. [Google Scholar] [CrossRef] [PubMed]
  18. Guangdong Provincial Bureau of Statistics. Guangdong Statistical Yearbook, 1st ed.; China Statistics Press: Beijing, China, 2021.
  19. Zhang, L.; Weng, D.; Xu, Y.; Hong, B.; Wang, S.; Hu, X.; Zhang, Y.; Wang, Z. Spatio-temporal evolution characteristics of carbon emissions from road transportation in the mainland of China from 2006 to 2021. Sci. Total Environ. 2024, 917, 170430. [Google Scholar] [CrossRef]
  20. Wei, C. Historical trend and drivers of China’s CO2 emissions from 2000 to 2020. Environ. Dev. Sustain. 2024, 26, 2225–2244. [Google Scholar] [CrossRef]
  21. Cai, H.; Xie, S. Estimation of vehicular emission inventories in China from 1980 to 2005. Atmos. Environ. 2007, 41, 8963–8979. [Google Scholar] [CrossRef]
  22. Li, L.Y.; Xie, S.D. Historical variations of biogenic volatile organic compound emission inventories in China, 1981–2003. Atmos. Environ. 2014, 95, 185–196. [Google Scholar] [CrossRef]
  23. Wu, R.; Bo, Y.; Li, J.; Li, L.; Li, Y.; Xie, S. Method to establish the emission inventory of anthropogenic volatile organic compounds in China and its application in the period 2008–2012. Atmos. Environ. 2016, 127, 244–254. [Google Scholar] [CrossRef]
  24. Zheng, C.; Shen, J.; Zhang, Y.; Huang, W.; Zhu, X.; Wu, X.; Chen, L.; Gao, X.; Cen, K. Quantitative assessment of industrial VOC emissions in China: Historical trend, spatial distribution, uncertainties, and projection. Atmos. Environ. 2017, 150, 116–125. [Google Scholar] [CrossRef]
  25. Jiang, L.; Chen, Y.; Zhou, H.; He, S. NOX emissions in China: Temporal variations, spatial patterns and reduction potentials. Atmos. Pollut. Res. 2020, 11, 1473–1480. [Google Scholar] [CrossRef]
  26. Ohara, T.; Akimoto, H.; Kurokawa, J.-i.; Horii, N.; Yamaji, K.; Yan, X.; Hayasaka, T. An Asian emission inventory of anthropogenic emission sources for the period 1980–2020. Atmos. Chem. Phys. 2007, 7, 4419–4444. [Google Scholar] [CrossRef]
  27. Lamb, W.F.; Wiedmann, T.; Pongratz, J.; Andrew, R.; Crippa, M.; Olivier, J.G.; Wiedenhofer, D.; Mattioli, G.; Al Khourdajie, A.; House, J.; et al. A review of trends and drivers of greenhouse gas emissions by sector from 1990 to 2018. Environ. Res. Lett. 2021, 16, 073005. [Google Scholar] [CrossRef]
  28. Wang, R.; Ci, H.; Zhang, T.; Tang, Y.; Wei, J.; Yang, H.; Feng, G.; Yan, Z. Spatial-Temporal Evolution Characteristics of Industrial Carbon Emissions in China’s Most Developed Provinces from 1998–2013: The Case of Guangdong. Energies 2023, 16, 2249. [Google Scholar] [CrossRef]
  29. Zhu, J.; Li, X.; Huang, H.; Yin, X.; Yao, J.; Liu, T.; Wu, J.; Chen, Z. Spatiotemporal Evolution of Carbon Emissions According to Major Function-Oriented Zones: A Case Study of Guangdong Province, China. Int. J. Environ. Res. Public Health 2023, 20, 2075. [Google Scholar] [CrossRef]
  30. Huang, H.; Sha, Q.; Zhu, M.; Wang, Y.; Lu, M.; Zhang, X.; Tang, M.; Huang, Z.; Shi, B.; Bai, L.; et al. Evolution of emission characteristics and species of industrial VOCs emission in Pearl River Delta Region, 2010~2017. China Environ. Sci. 2020, 40, 4641–4651. [Google Scholar]
  31. Wu, D.; Bi, X.; Deng, X.; Li, F.; Tan, H.; Liao, G.; Huang, J. Effect of atmospheric haze on the deterioration of visibility over the Pearl River Delta. Acta Meteorol. Sin.-Engl. Ed. 2007, 21, 215–223. [Google Scholar]
  32. He, M.; Zheng, J.; Yin, S.; Zhang, Y. Trends, temporal and spatial characteristics, and uncertainties in biomass burning emissions in the Pearl River Delta, China. Atmos. Environ. 2011, 45, 4051–4059. [Google Scholar] [CrossRef]
  33. Yang, X.; Ma, Y.; Ju, Y.; Cai, Q.; Guo, F. Temporal and spatial distribution of air pollutants emitted from field burning of straw crops in Southern China during 2005–2014. J. Agro-Environ. Sci. 2018, 37, 358–368. [Google Scholar]
  34. Sun, X.-B.; Liao, C.-H.; Zeng, W.-T.; Zhang, Y.-B.; Liang, X.-M.; Ye, D.-Q. Emission Inventory of Atmospheric Pollutants and VOC Species from Crop Residue Burning in Guangdong Province. Huan Jing Ke Xue= Huanjing Kexue 2018, 39, 3995–4001. [Google Scholar] [PubMed]
  35. Zhang, C.; Li, J.; Zhao, W.; Yao, Q.; Wang, H.; Wang, B. Open biomass burning emissions and their contribution to ambient formaldehyde in Guangdong province, China. Sci. Total Environ. 2022, 838, 155904. [Google Scholar] [CrossRef]
  36. Zhong, Z.; Zheng, J.; Zhu, M.; Huang, Z.; Zhang, Z.; Jia, G.; Wang, X.; Bian, Y.; Wang, Y.; Li, N. Recent developments of anthropogenic air pollutant emission inventories in Guangdong province, China. Sci. Total Environ. 2018, 627, 1080–1092. [Google Scholar] [CrossRef]
  37. Cui, X.; Sha, Q.e.; Li, C.; Wang, Y.; Wu, L.; Zhang, X.; Zheng, J.; Yan, M. Assessment of emission reduction effect of major air pollution control measures in the Pearl River Delta from 2013 to 2017. Acta Sci. Circumstantiae 2021, 41, 1800–1808. [Google Scholar]
  38. Ming, G.-Y.; Zhu, M.-N.; Sha, Q.-E.; Zhang, X.-C.; Rao, S.-J.; Chen, C.; Liu, H.-L.; Zheng, J.-Y. Evolution Characteristics of Atmospheric Formaldehyde Emissions in Guangdong Province from 2006 to 2020. Huan Jing Ke Xue= Huanjing Kexue 2023, 44, 4819–4831. [Google Scholar] [PubMed]
  39. Zhou, Y.; Shan, Y.; Liu, G.; Guan, D. Emissions and low-carbon development in Guangdong-Hong Kong-Macao Greater Bay Area cities and their surroundings. Appl. Energy 2018, 228, 1683–1692. [Google Scholar] [CrossRef]
  40. Zhang, Y.; Zhang, L.; Wang, Y.; Chen, F. Research on the carbon emission evolution of land use and its influential factors of Chizhou City in Anhui Province. J. China Agric. Univ. 2014, 19, 216–223. [Google Scholar]
  41. Wang, J.; Zhang, J. Evolutionary Mechanism of Energy-related Carbon Emissions in Baoding. Enuivonmental Sci. Technol. 2014, 37, 201–205. [Google Scholar]
  42. Qin, Z.; Tang, W.; Yin, Y.; Mao, M.; Wang, B. Spatial distribution of PM2.5 emission from cooking sources in Chengdu based on internet big data method. Acta Sci. Circumstantiae 2017, 37, 4511–4518. [Google Scholar]
  43. Lin, P.; Gao, J.; Xu, Y.; Schauer, J.J.; Wang, J.; He, W.; Nie, L. Enhanced commercial cooking inventories from the city scale through normalized emission factor dataset and big data. Environ. Pollut. 2022, 315, 120320. [Google Scholar] [CrossRef]
  44. Wang, K.; Gao, C.; Wang, C.; Tong, Y.; Wang, S.; Wang, R.; Liu, Y. Research on Emission Inventory Processing Tool based on CSGD Data. Res. Environ. Sci. 2019, 32, 1090–1098. [Google Scholar]
  45. Wang, K.; Gao, J.; Tian, H.; Dan, M.; Yue, T.; Xue, Y.; Zou, P.; Wang, C. An emission inventory spatial allocatemethod based on POI data. China Environ. Sci. 2017, 37, 2377–2382. [Google Scholar]
  46. Pan, Y. Characteristic Analysis and Estimation for Exhaust Emissions of New-Energy Buses with Multi-Source Data. Ph.D. Dissertation, Southeast University, Nanjing, China, 2020. [Google Scholar]
  47. Li, B.; Wang, J.; Wu, S.; Jia, Z.; Li, Y.; Wang, T.; Zhou, S. New Method for Improving Spatial Allocation Accuracy of Industrial Energy Consumption and Implications for Polycyclic Aromatic Hydrocarbon Emissions in China. Environ. Sci. Technol. 2019, 53, 4326–4334. [Google Scholar] [CrossRef]
  48. Wang, X.; Cai, Y.; Liu, G.; Zhang, M.; Bai, Y.; Zhang, F. Carbon emission accounting and spatial distribution of industrial entities in Beijing-Combining nighttime light data and urban functional areas. Ecol. Inf. 2022, 70, 101759. [Google Scholar] [CrossRef]
  49. Tian, D.; Zhang, J.; Li, B.; Xia, C.; Zhu, Y.; Zhou, C.; Wang, Y.; Liu, X.; Yang, M. Spatial analysis of commuting carbon emissions in main urban area of Beijing: A GPS trajectory-based approach. Ecol. Indic. 2024, 159, 111610. [Google Scholar] [CrossRef]
  50. Zheng, J.; Zhang, L.; Che, W.; Zheng, Z.; Yin, S. A highly resolved temporal and spatial air pollutant emission inventory for the Pearl River Delta region, China and its uncertainty assessment. Atmos. Environ. 2009, 43, 5112–5122. [Google Scholar] [CrossRef]
  51. Zheng, J.; Wang, S.; Huang, Z. Technical Methods and Applications for Establishing a High-Resolution Regional Atmospheric Emission Inventory, 1st ed.; Science Press: Beijing, China, 2014. [Google Scholar]
  52. State Council of the People’s Republic of China. Circular of the State Council on the Issuance of the Action Plan for the Prevention and Control of Air Pollution; State Council of the People’s Republic of China: Beijing, China, 2013.
  53. State Council of the People’s Republic of China. Circular of the State Council on the Issuance of the Three-Year Action Plan for Winning the Battle for Blue Sky Defense; State Council of the People’s Republic of China: Beijing, China, 2018.
  54. Gao, Y.; Yang, Q.; Liang, L.; Zhao, Y. Spatial Pattern and Influencing Factors of Retailing Industries in Xi’an Based on POI Data. Sci. Geogr. Sin. 2020, 40, 710–719. [Google Scholar]
  55. Wu, K.; Zhang, H.; Wang, Y.; Wu, Q.; Ye, Y. Identify of the multiple types of commercial center in Guangzhou and its spatial pattern. Prog. Geogr. 2016, 35, 963–974. [Google Scholar]
  56. Chen, w.; Liu, L.; Liang, Y. Retail center recognition and spatial aggregating feature analysis of retail formats in Guangzhou based on POI data. Geogr. Res. 2016, 35, 703–716. [Google Scholar]
  57. Xue, B.; Xiao, X.; Li, J.; Jiang, L.; Xie, X. POI-Based Analysis on Retail’s Spatial Hot Blocks at a City Level: A Case Study of Shenyang, China. Econ. Geogr. 2018, 38, 36–43. [Google Scholar]
  58. Hao, F.; Wang, S.; Feng, Z.; Yu, T.; Ma, L. Spatial pattern and its industrial distribution of commercial space in Changchun based on POI data. Geogr. Res. 2018, 37, 366–378. [Google Scholar]
  59. Liu, C.; Xue, S. Spatial heterogeneity of public service facilities in central Shanghai. Hum. Geogr. 2019, 134, 122–130. [Google Scholar]
  60. Zheng, J.; Che, W.; Wang, Z. Traffic flow and road network-based spatial allocation of regional mobile source emission inventories. Acta Sci. Circumstantiae 2009, 29, 815–821. [Google Scholar]
  61. Zhang, J.; Huang, Y.; Zhou, N.; Huang, Z.; Shi, B.; Yuan, X.; Sheng, L.; Zhang, A.; You, Y.; Chen, D.; et al. Contribution of anthropogenic emission changes to the evolution of PM2.5 concentrations and composition in the Pearl River Delta during the period of 2006–2020. Atmos. Environ. 2023, 318, 120228. [Google Scholar] [CrossRef]
  62. Carter, W.P. Development of the SAPRC-07 chemical mechanism. Atmos. Environ. 2010, 44, 5324–5335. [Google Scholar] [CrossRef]
  63. Tian, X.; An, C.; Nik-Bakht, M.; Chen, Z. Assessment of reductions in NO2 emissions from thermal power plants in Canada based on the analysis of policy, inventory, and satellite data. J. Clean. Prod. 2022, 341, 130859. [Google Scholar] [CrossRef]
  64. Shi, X.; Elmore, A.; Li, X.; Gorence, N.J.; Jin, H.; Zhang, X.; Wang, F. Using spatial information technologies to select sites for biomass power plants: A case study in Guangdong Province, China. Biomass Bioenergy 2008, 32, 35–43. [Google Scholar] [CrossRef]
  65. Li, J.; Cockerill, T.; Liang, X.; Gibbins, J. Locating New Coal-fired Power Plants with Carbon Capture Ready Design—A GIS Case Study of Guangdong Province in China. In Proceedings of the 10th International Conference on Greenhouse Gas Control Technologies, Amsterdam, The Netherlands, 19–23 September 2011; Volume 4, pp. 2824–2830. [Google Scholar]
  66. Guangdong Provincial Government. Outline of the Pearl River Delta Environmental Protection Plan (2004–2020); Guangdong Provincial Government: Guangzhou, China, 2005.
  67. Guangdong Provincial Government. The Eleventh Five-Year Plan for Environmental Protection and Ecological Construction in Guangdong Province; Guangdong Provincial Government: Guangzhou, China, 2007.
  68. Guangdong Provincial Government. Pearl River Delta Integrated Environmental Protection Plan (2009–2020); Guangdong Provincial Government: Guangzhou, China, 2010.
  69. Guangdong Provincial Government. Pearl River Delta Clean Air Action Plan 2011 Annual Implementation Plan; Guangdong Provincial Government: Guangzhou, China, 2011.
  70. Guangdong Provincial Government. Guangdong Environmental Protection Planning Program (2006–2020); Guangdong Provincial Government: Guangzhou, China, 2011.
  71. Guangdong Provincial Bureau of Statistics. Guangdong Statistical Yearbook, 1st ed.; China Statistics Press: Beijing, China, 2007.
  72. Guangdong Provincial Bureau of Statistics. Guangdong Statistical Yearbook, 1st ed.; China Statistics Press: Beijing, China, 2013.
  73. Guangdong Provincial Bureau of Statistics. Guangdong Statistical Yearbook, 1st ed.; China Statistics Press: Beijing, China, 2018.
  74. Peñuelas, J.; Staudt, M. BVOCs and global change. Trends Plant Sci. 2010, 15, 133–144. [Google Scholar] [CrossRef]
  75. Huang, J.; Liu, R.; Wang, Q.; Gao, X.; Han, Z.; Gao, J.; Gao, H.; Zhang, S.; Wang, J.; Zhang, L.; et al. Climate factors affect N2O emissions by influencing the migration and transformation of nonpoint source nitrogen in an agricultural watershed. Water Res. 2022, 223, 119028. [Google Scholar] [CrossRef]
  76. Martins, C.S.; Nazaries, L.; Delgado-Baquerizo, M.; Macdonald, C.A.; Anderson, I.C.; Hobbie, S.E.; Venterea, R.T.; Reich, P.B.; Singh, B.K. Identifying environmental drivers of greenhouse gas emissions under warming and reduced rainfall in boreal–temperate forests. Funct. Ecol. 2017, 31, 2356–2368. [Google Scholar] [CrossRef]
Figure 1. Changes in the total emissions and emission source structure of key atmospheric pollutants in Guangdong Province from 2006 to 2020.
Sustainability 17 04844 g001
Figure 2. Comparison between pollutant monitoring concentrations in national monitoring sites and Guangdong–Hong Kong–Macao monitoring sites and emissions trends.
Sustainability 17 04844 g002
Figure 3. Variation of the emission ratio (RP/N) of total emissions and key sources of SO2, NOX, and PM10 in the Pearl River Delta and non-Pearl River Delta regions.
Sustainability 17 04844 g003
Figure 4. Spatial statistical analysis indicators of power plant locations and the evolution of SO2 emissions from 2006 to 2020. (a) Spatial analysis of power plant locations; (b) spatial evolution of SO2 emissions.
Sustainability 17 04844 g004
Figure 5. Spatial statistical analysis indicators of the industrial source locations and evolution of SO2 emissions from 2006 to 2020. (a) Spatial analysis of industrial source locations; (b) spatial evolution of SO2 emissions.
Sustainability 17 04844 g005
Figure 6. (a) Spatial statistics of parking lot and gas station POIs and (b) distribution of NOX emissions from vehicle sources in 2012 and 2020.
Sustainability 17 04844 g006
Figure 7. Impact of emission changes on PM2.5 concentrations (μg/m3) in Guangdong Province during (a) April and (b) October, simulated using the CMAQ model. The figure illustrates the changes in PM2.5 concentrations between the Base and Case 1 scenarios for various cities in Guangdong.
Sustainability 17 04844 g007
Figure 8. Impact of emission changes on PM2.5 concentrations (μg/m3) in Guangdong Province during (a) April and (b) October, simulated using the CMAQ model. The figure illustrates the changes in PM2.5 concentrations between the Cases 1 and 2 scenarios for various cities in Guangdong.
Sustainability 17 04844 g008
Figure 9. Comparison of simulated (2012−2020, CMAQ model) and observed (2013−2020) relative changes in PM2.5 concentrations in sub-regions of Guangdong Province compared with the provincial average.
Sustainability 17 04844 g009
Table 1. Configuration of CMAQ simulation scenarios.
ScenarioMeteorological DataEmission LevelsSpatial DistributionComparison Basis
Base2020 (observed meteorology)2020 emissions (SO2, NOX, PM2.5)Fixed spatial distribution (2020 profiles)Baseline scenario
Case 12020 (same as Base)2012 emissions (SO2, NOX, PM2.5)Fixed spatial distribution (2020 profiles)Base vs. Case 1 (impact of emission quantity changes, 2012–2020)
Case 22020 (same as Base)2012 emissions (SO2, NOX, PM2.5)Adjusted spatial distribution (2012 profiles)Case 1 vs. Case 2 (impact of spatial redistribution, 2012–2020)
Disclaimer/Publisher’s Note: The statements, opinions and data contained in all publications are solely those of the individual author(s) and contributor(s) and not of MDPI and/or the editor(s). MDPI and/or the editor(s) disclaim responsibility for any injury to people or property resulting from any ideas, methods, instructions or products referred to in the content.

