
Calculation of Overtopping Risk Probability and Assessment of Risk Consequences of Cascade Reservoirs


Abstract
1. Introduction
2. Methods
2.1. Overtopping Risk Probability Calculation for Reservoirs
2.1.1. Risk Probability Calculation Process for Cascade Reservoir Systems
2.1.2. Development of Reservoir Breach and Flood Routing Models
2.1.3. The Uncertainty of Inflow Flood and Wind-Wave Factors
2.2. Overtopping Flood Routing in Cascade Reservoir Systems
2.3. Risk Assessment of Cascade Reservoir Systems
2.3.1. Vulnerability Estimation
2.3.2. Hazard Estimation
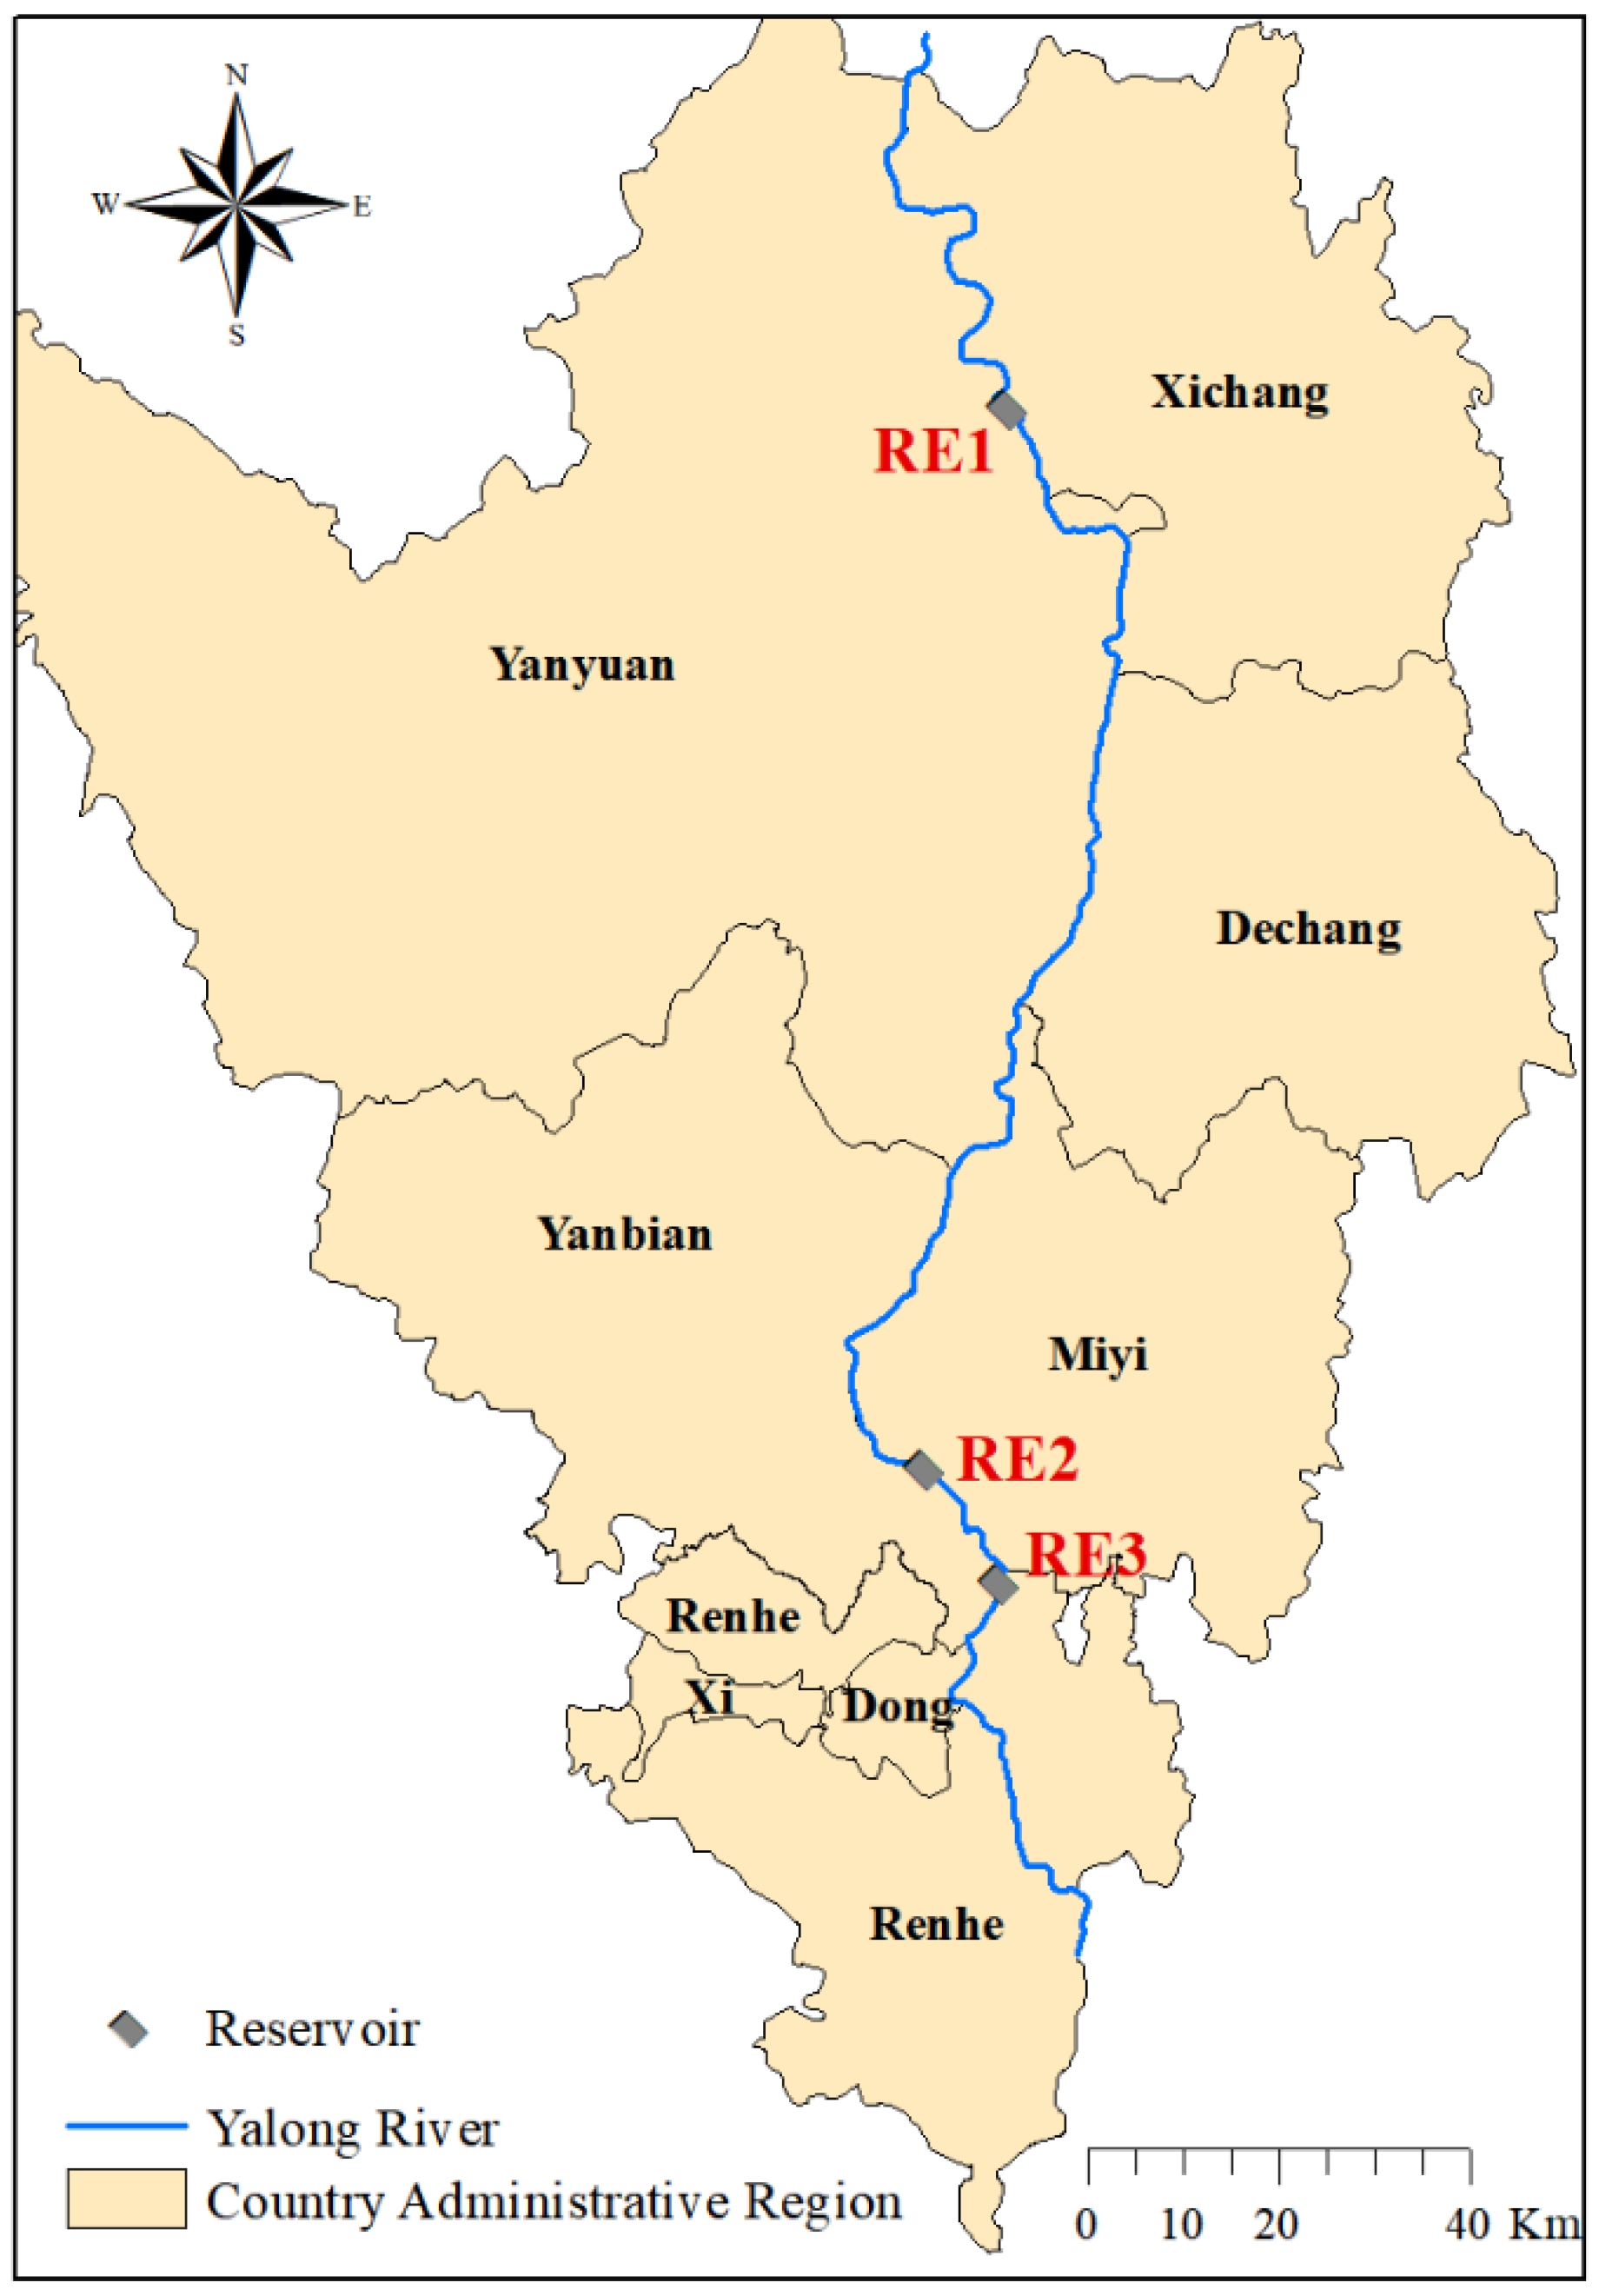
2.4. Project Overview
3. Results
3.1. Model Validation
3.2. Flood Inundation Scenario of Cascade Reservoir Systems
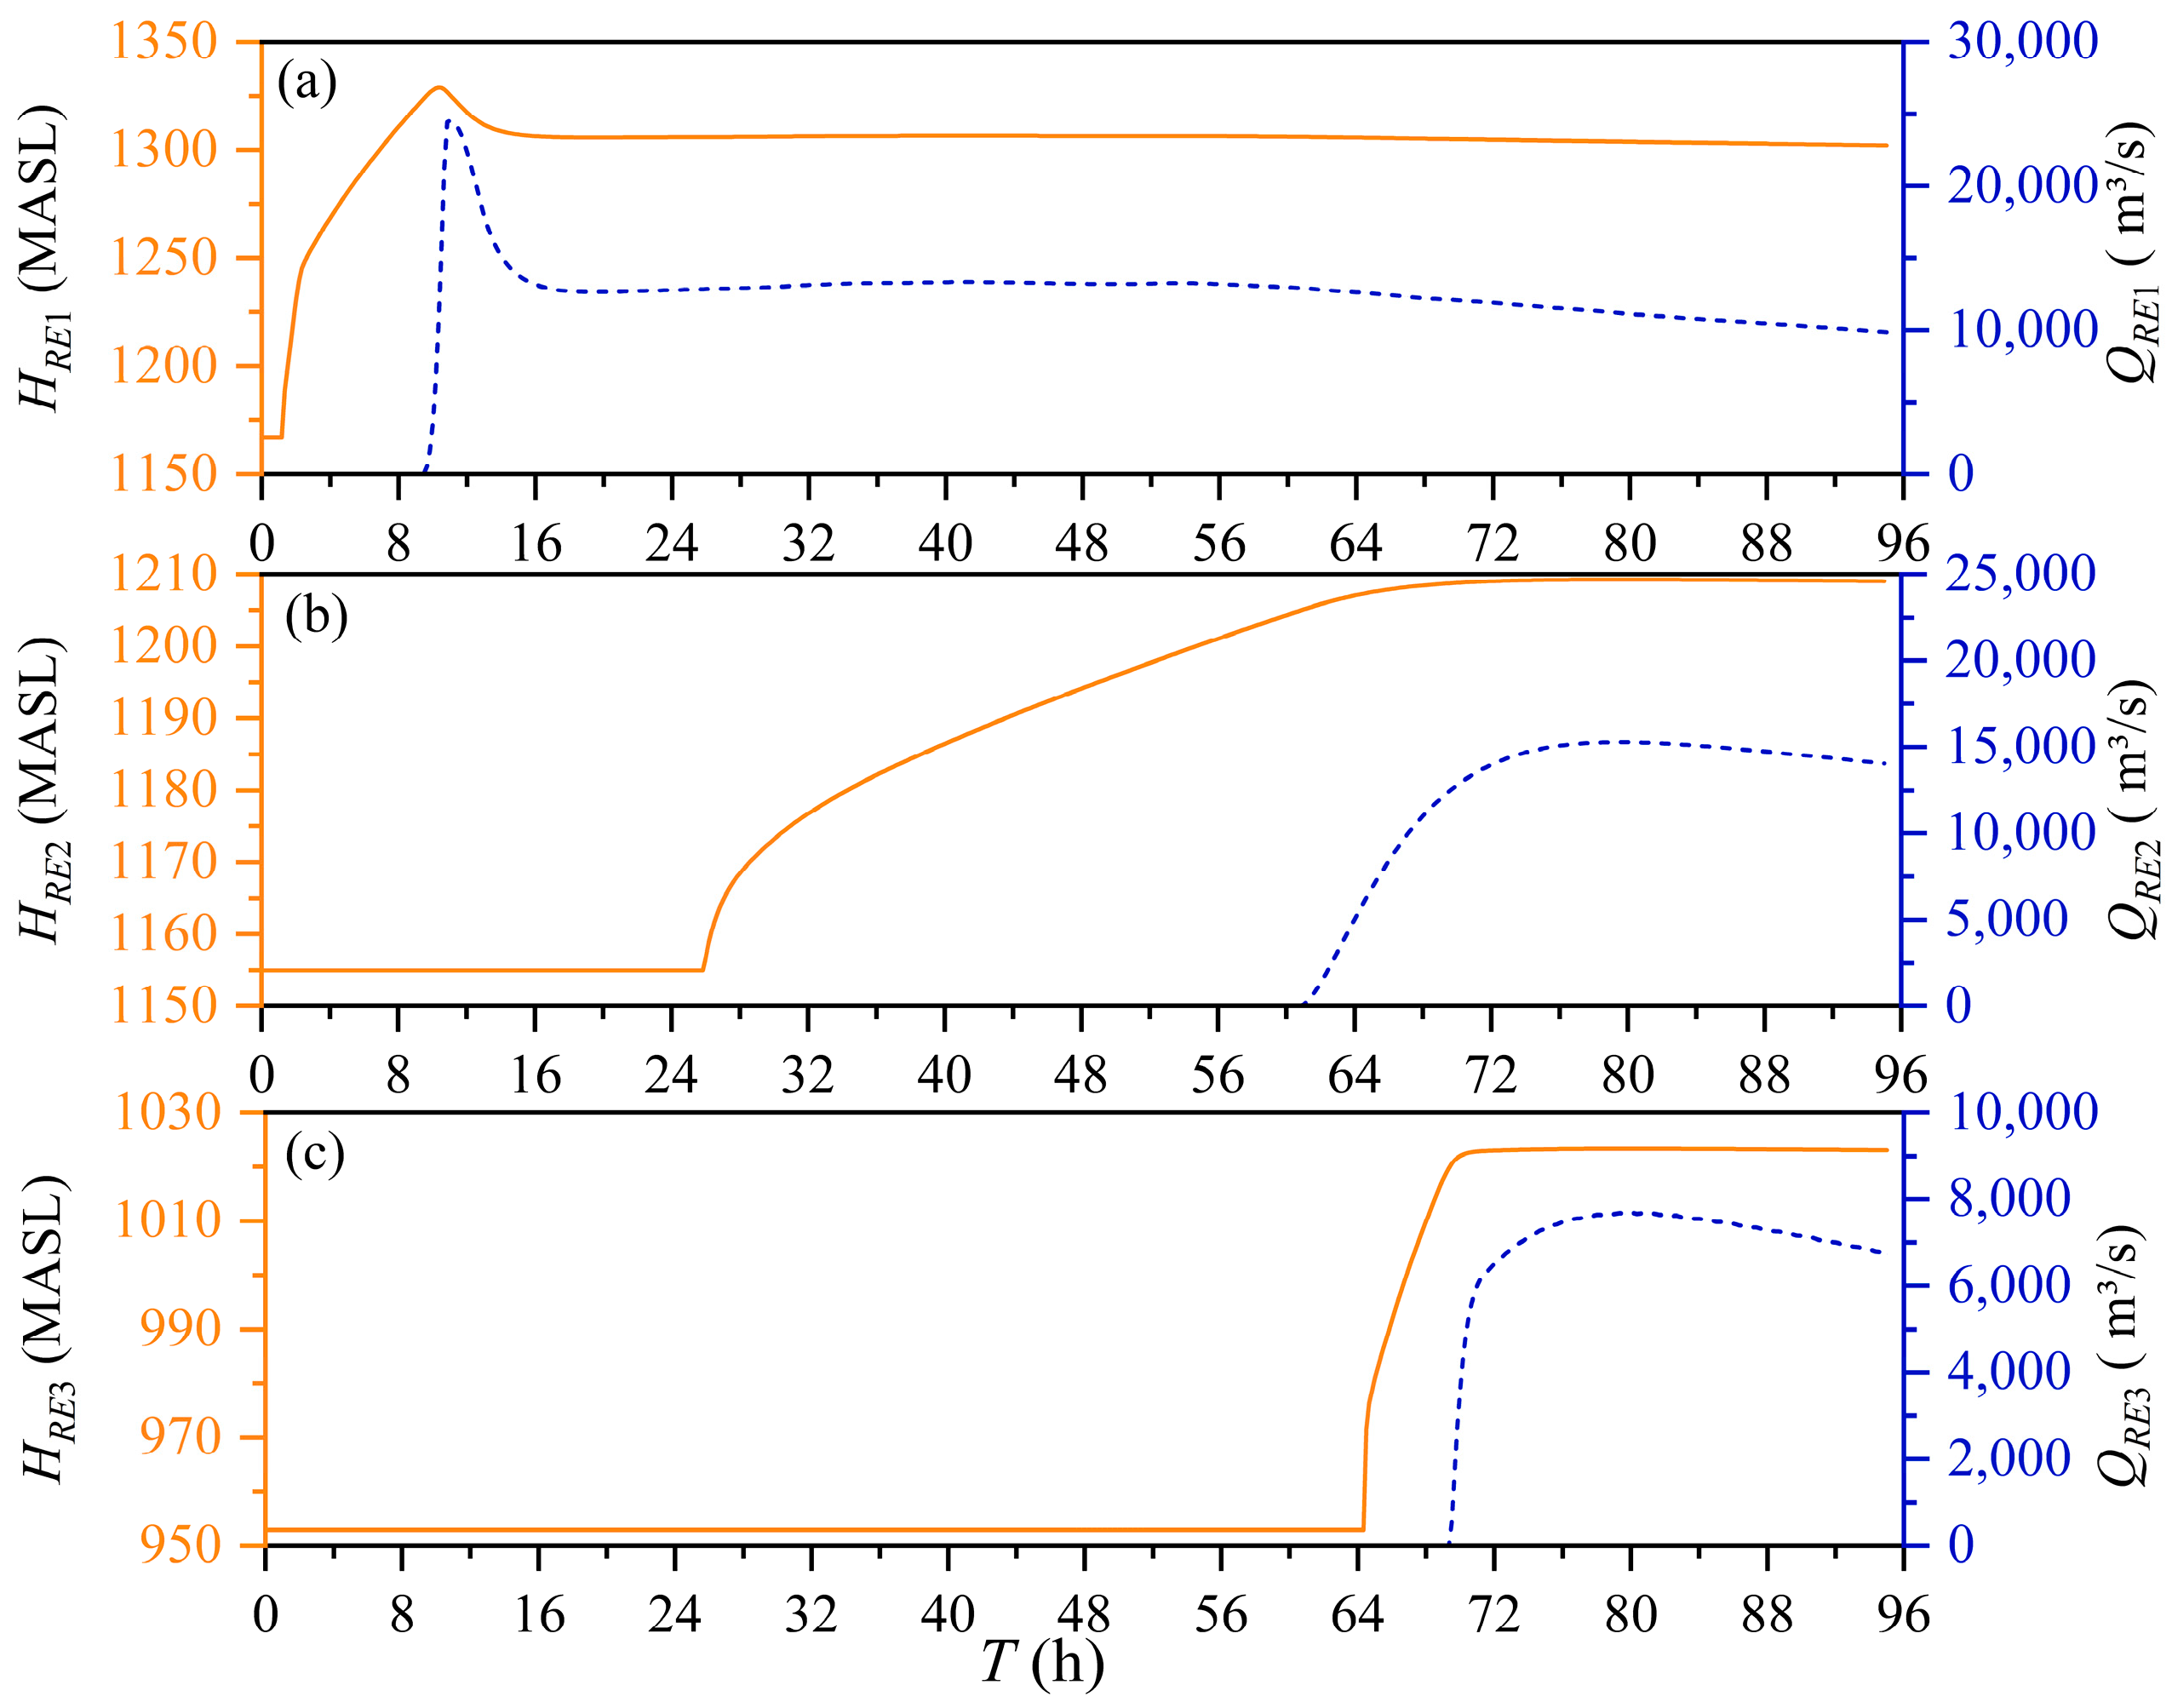
3.2.1. Water Level-Discharge Process
3.2.2. Severity of Flood Inundation
- 1.
- Scenario 1
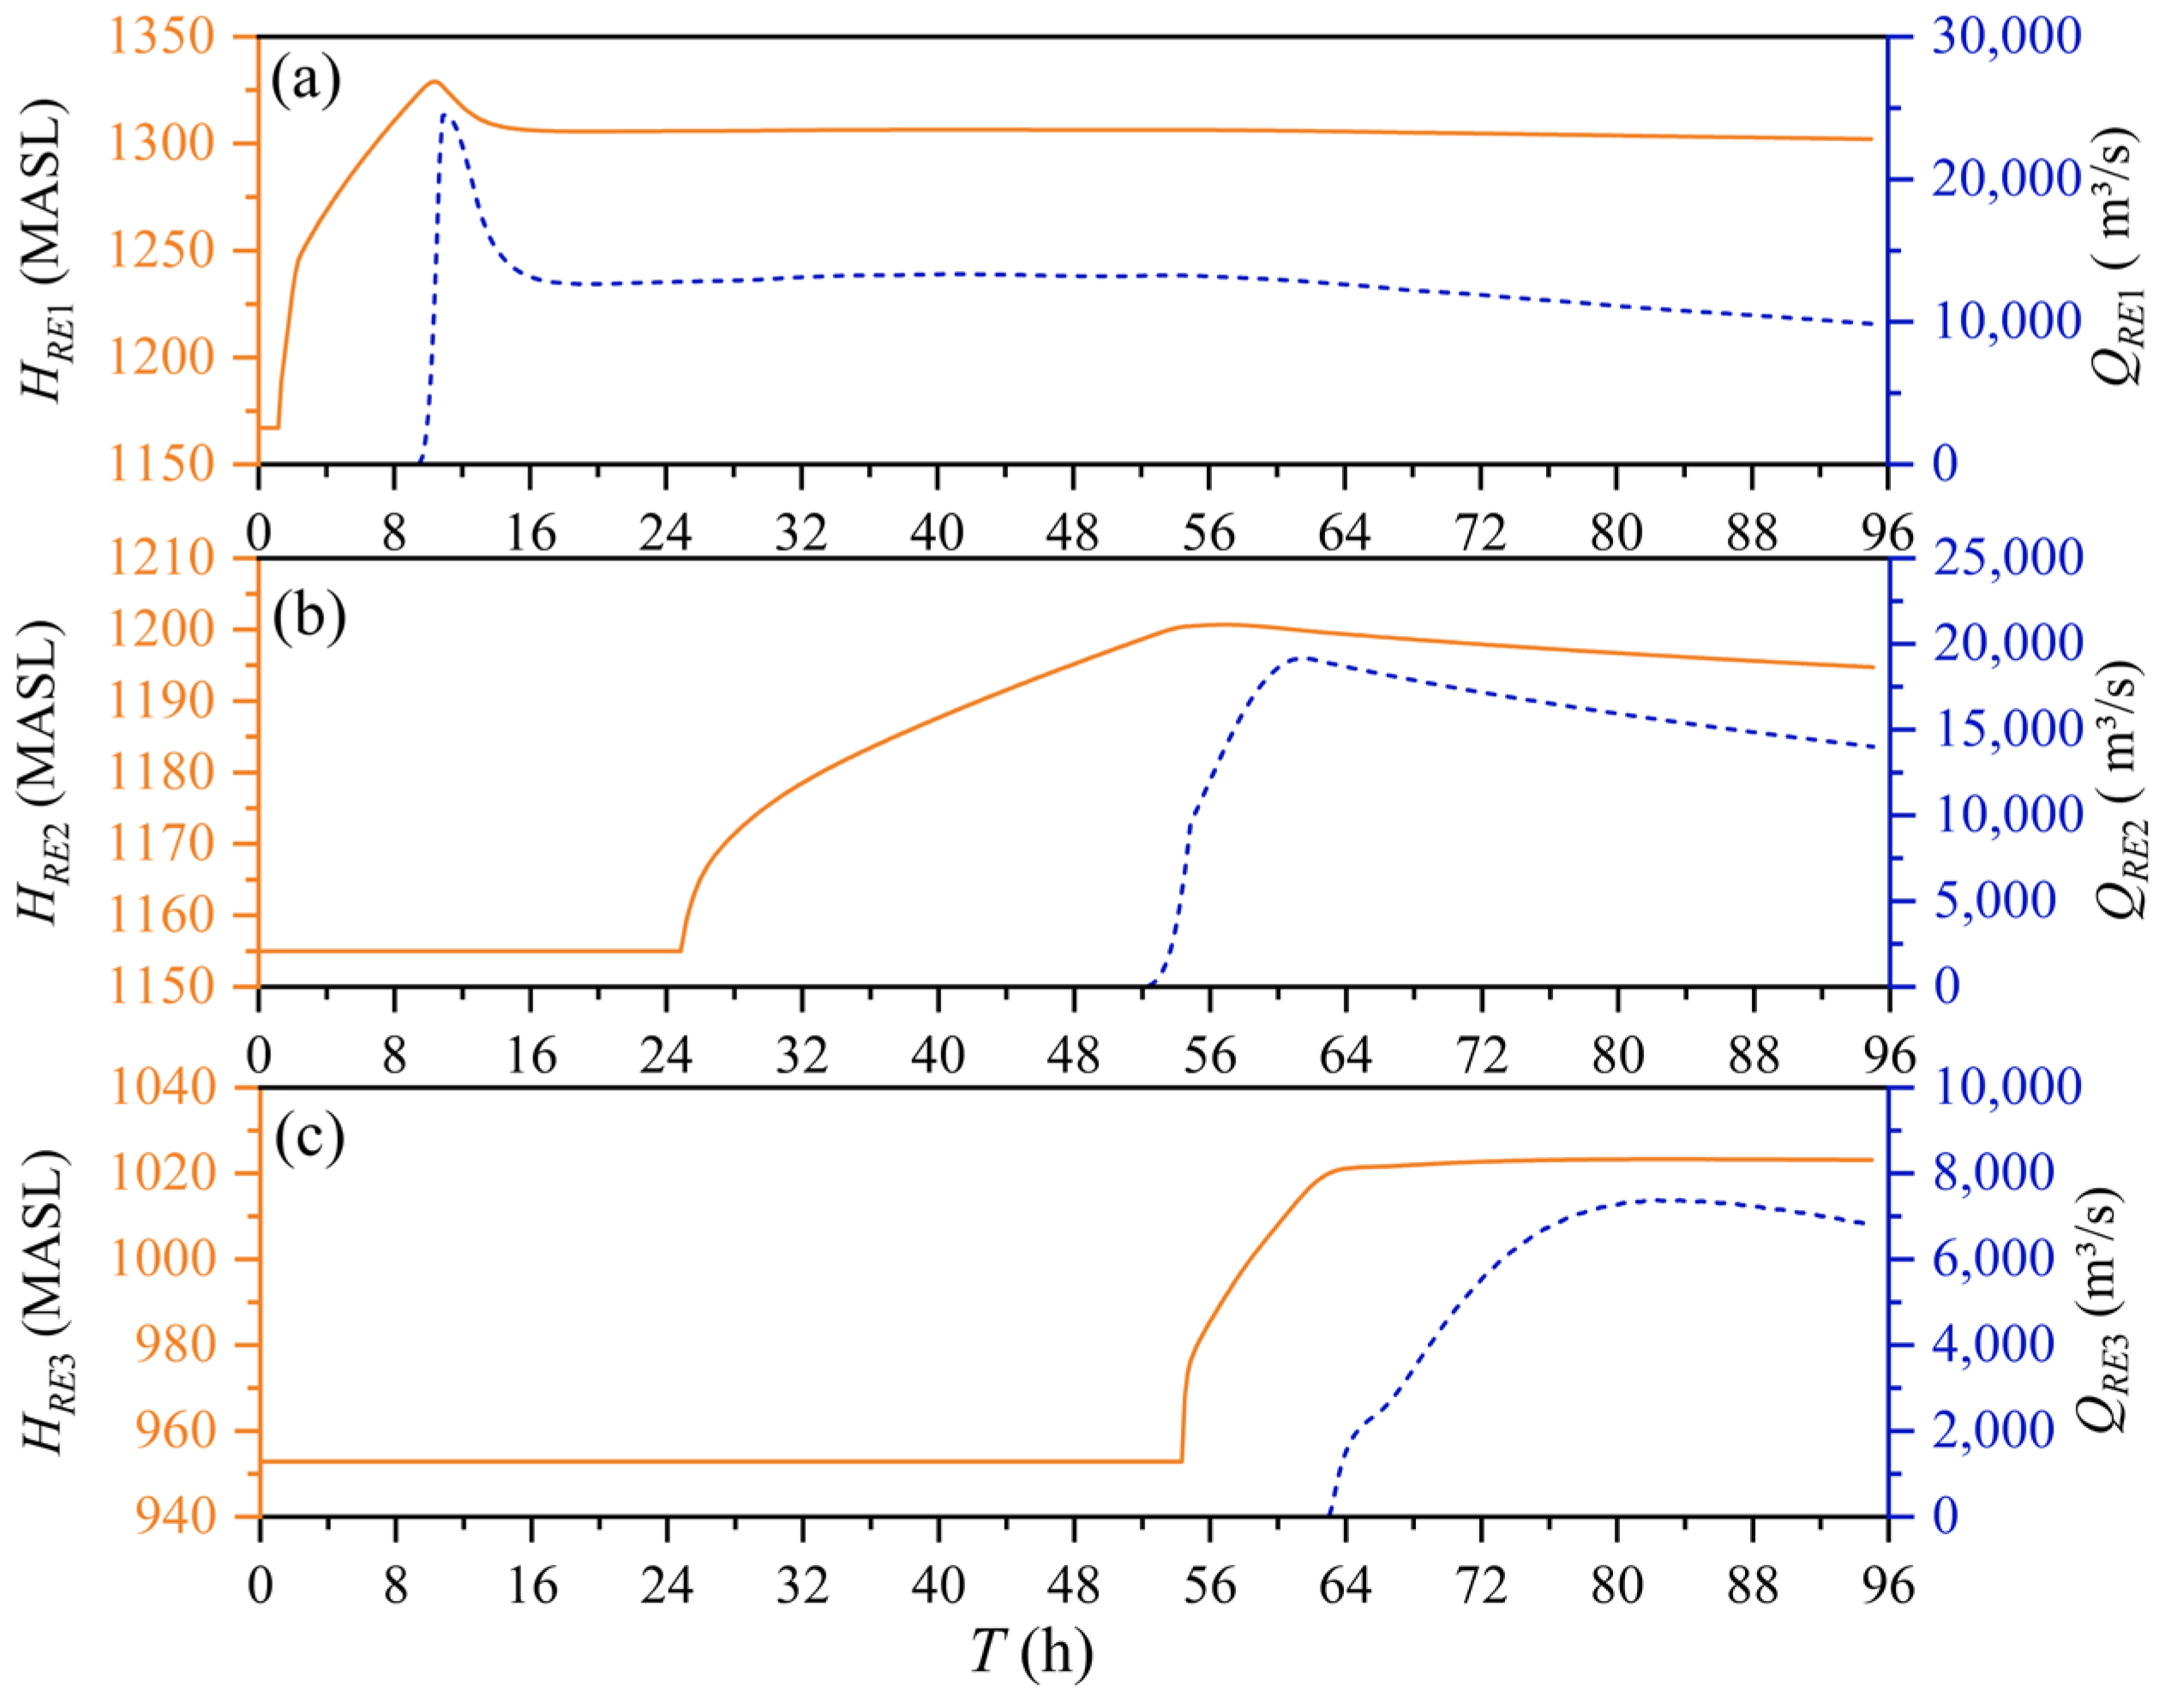
- 2.
- Scenario 2
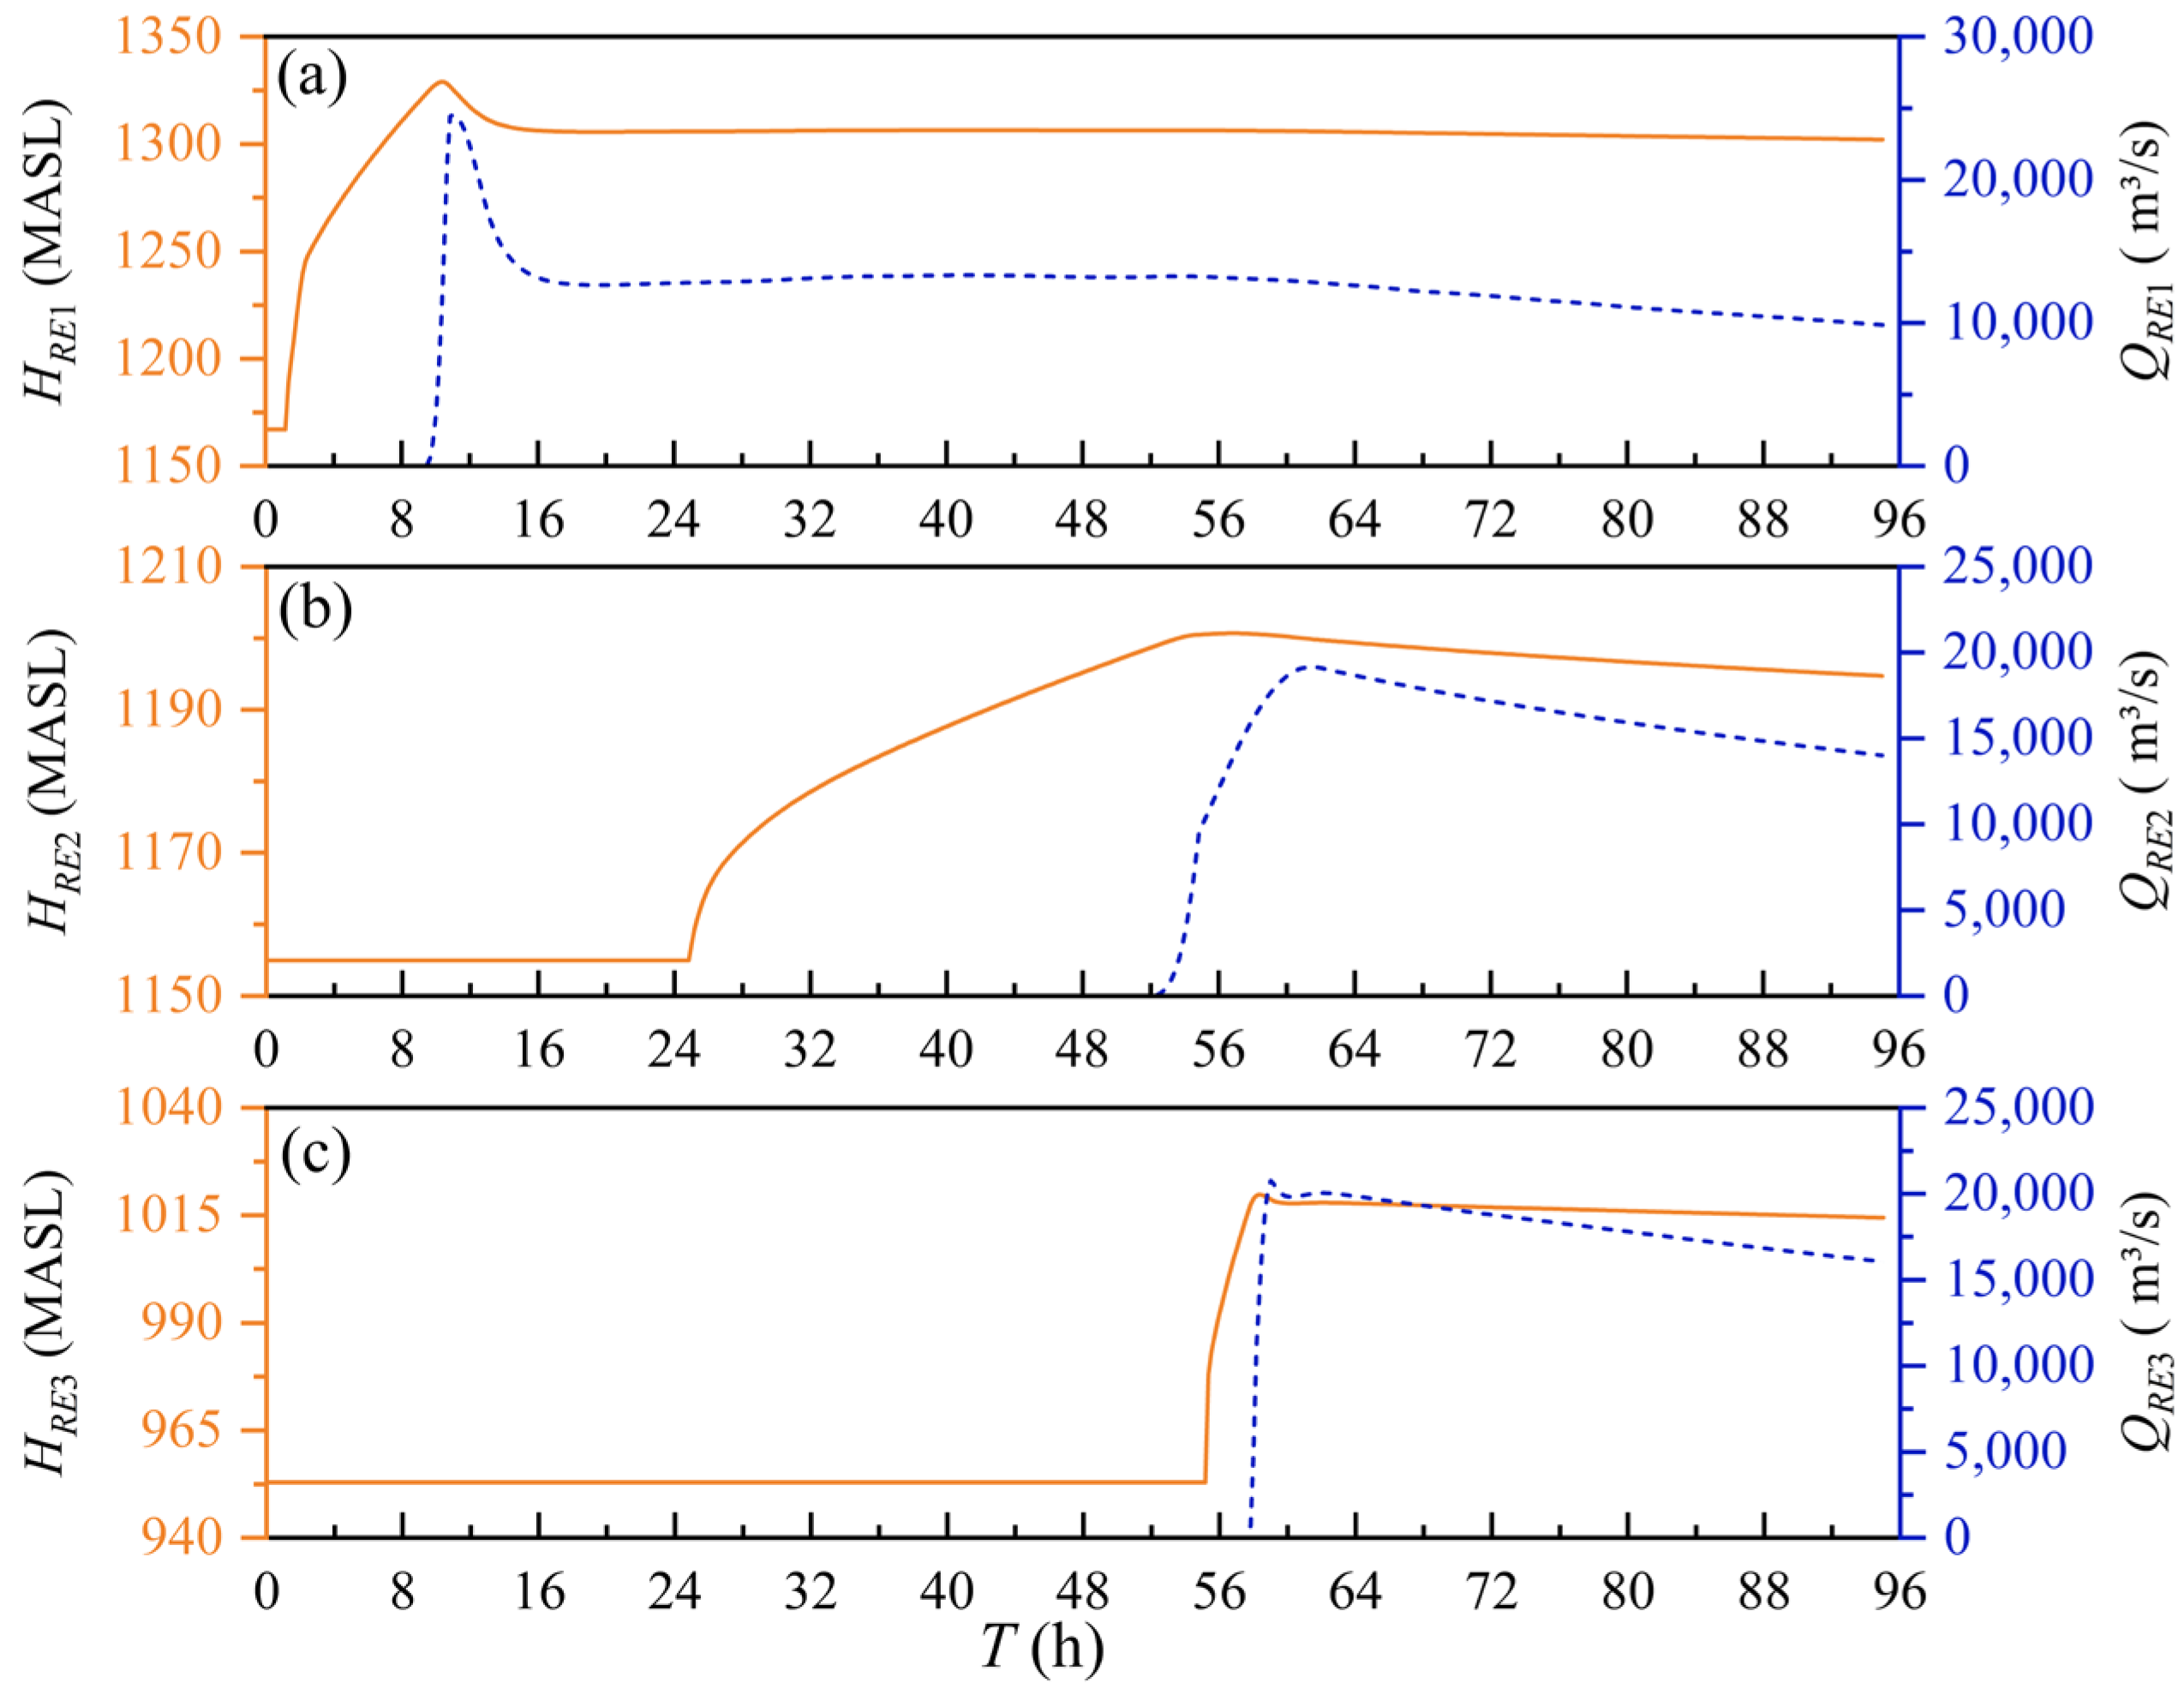
- 3.
- Scenario 3
3.3. Risk Loss Analysis
4. Conclusions
Author Contributions
Funding
Institutional Review Board Statement
Informed Consent Statement
Data Availability Statement
Conflicts of Interest
Nomenclature
| Abbreviations | |
| MASL | meters above sea level |
| RE1 | reservoir 1 |
| RE2 | reservoir 2 |
| RE3 | reservoir 3 |
| General | |
| A | cross-sectional area of flow (m2) |
| B0 | breach width (m) |
| C | weir flow coefficient (-) |
| cf | bed friction coefficient (-) |
| Ci | peak discharge coefficient (-) |
| d | average water depth (m) |
| D | height of the reservoir dam (m) |
| Dk | dam crest height of the k-th reservoir (m) |
| Dw | length of the wind zone (m) |
| ei | wind setup height at the water surface for the i-th random variable (m) |
| ej | wind-induced wave height at the reservoir surface corresponding to the j-th simulation (m) |
| wind setup height of the k-th reservoir (m) | |
| f | Coriolis parameter (-) |
| F | length of the wind zone (m) |
| g | gravitational acceleration (m/s2) |
| h | water depth (m) |
| H | water surface elevation (MASL) |
| H0 | upstream water depth (m) |
| randomly simulated maximum pre-dam water level after flood regulation for the k-th reservoir (m) | |
| HI | hazard index (-) |
| Hj | reservoir water depth in front of the dam corresponding to the j-th simulation after a flood (m) |
| total local head of the k-th reservoir (m) | |
| Hm | average water depth at the dam forebay (m) |
| Hw | wave height (m) |
| k | unit vector in the vertical direction (-) |
| K | composite friction coefficient (-) |
| reservoir spacing (km) | |
| Ln | weir crest length of the n-th reservoir (m) |
| N | total number of random simulations (-) |
| P | probability of a single reservoir experiencing an overtopping event (-) |
| Pd | dam flood control design standard (-) |
| Pf | flood control failure probability (-) |
| Ps | socially acceptable overtopping risk (-) |
| Ptotal | overtopping risk rate of the cascade reservoir system (-) |
| q | lateral inflow or outflow per unit length (m2/s) |
| dam-break discharge (m3/s) | |
| Qm | peak discharge (m3/s) |
| Qn | discharge at the cross section of the n-th reservoir (m3/s) |
| R | wave run-up (m) |
| RI | risk index (-) |
| Rj | wave surge height at the reservoir corresponding to the j-th simulation (m) |
| wave run-up height of the k-th reservoir (m) | |
| S | riverbed gradient (-) |
| S0 | bed slope (-) |
| Sf | friction slope (-) |
| flood propagation time (s) | |
| V | velocity (m/s) |
| VI | vulnerability index (-) |
| vt | horizontal eddy viscosity coefficient (m2/s) |
| vw | flood wave velocity (m/s) |
| x | spatial coordinate along the flow direction (m) |
| Zi | total elevation (m) |
| Zn | upstream water head above the weir of the n-th reservoir (m) |
| transmission coefficient between reservoirs (-) | |
| angle between the wind direction and the normal to the dam axis (°) | |
| flow parameter (-) | |
| mean deviation of v (-) | |
| mean deviation of wave run-up (-) | |
| standard deviation of wave run-up (-) | |
| standard deviation of v (-) |
References
- Mehta, A.M.; Weeks, C.S.; Tyquin, E. Towards Preparedness for Dam Failure: An Evidence Base for Risk Communication for Downstream Communities. Int. J. Disaster Risk Reduct. 2020, 50, 101820. [Google Scholar] [CrossRef]
- Tosun, H.; Hariri-Ardebili, M.A. Post-2023 Türkiye Earthquake Risk Assessment of Cascade Dams in Upper Euphrates Basin. Water Secur. 2024, 21, 100164. [Google Scholar] [CrossRef]
- Gabriel-Martin, I.; Sordo-Ward, A.; Garrote, L.; Castillo, L.G. Influence of Initial Reservoir Level and Gate Failure in Dam Safety Analysis. Stochastic Approach. J. Hydrol. 2017, 550, 669–684. [Google Scholar] [CrossRef]
- Zhang, S.; Tan, Y. Risk Assessment of Earth Dam Overtopping and Its Application Research. Nat. Hazards 2014, 74, 717–736. [Google Scholar] [CrossRef]
- El-Awady, A.; Ponnambalam, K.; Bennett, T.; Zielinski, A.; Verzobio, A. Bayesian Network Approach for Failure Prediction of Mountain Chute Dam and Generating Station. In Sustainable and Safe Dams Around the World/Un Monde de Barrages Durables et Sécuritaires; CRC Press: Boca Raton, FL, USA, 2019; ISBN 978-0-429-31977-8. [Google Scholar]
- Dong, K.; Li, Z.; Lu, X.; Chen, C.; Sheng, J.; Chen, J.; Wu, Z. Analysis of Dam Overtopping Failure Risks Caused by Landslide-Induced Surges Considering Spatial Variability of Material Parameters. Front. Earth Sci. 2021, 9, 675900. [Google Scholar] [CrossRef]
- Aven, T. Risk Assessment and Risk Management: Review of Recent Advances on Their Foundation. Eur. J. Oper. Res. 2016, 253, 1–13. [Google Scholar] [CrossRef]
- Ge, W.; Jiao, Y.T.; Li, Z.K.; Zhang, Z.S.; Guo, X.Y. Status and Development Trend of Research on Risk Consequences Caused by Dam Breach. Adv. Water Sci. 2020, 31, 143–151. [Google Scholar] [CrossRef]
- Wang, T.; Li, Z.; Ge, W.; Zhang, H.; Zhang, Y.; Sun, H.; Jiao, Y. Risk Consequence Assessment of Dam Breach in Cascade Reservoirs Considering Risk Transmission and Superposition. Energy 2023, 265, 126315. [Google Scholar] [CrossRef]
- Zhou, K.F.; Li, L.; Sheng, J.B. Evaluation Model of Loss of Life Due to Dam Breach in China. J. Saf. Environ. 2007, 7, 145–149. [Google Scholar]
- Wang, Z.J.; Song, W.T.; Ma, X.T. A Method of Estimating Economic Loss Caused by Dam-Break. J. Yangtze River Sci. Res. Inst. 2014, 31, 30–34. [Google Scholar]
- Wang, R.Z.; Li, L.; Sheng, J. On Criterion of Social and Environmental Risk of Reserviors Dams. J. Saf. Environ. 2006, 6, 8–11. [Google Scholar]
- Jiang, Q.L. Research on Quantitative Model for Risk Assessment of Earch-Dammed Reservoir Staged Operation in Flood Season. Master’s Thesis, Guangxi University, Nanning, China, 2015. [Google Scholar]
- Fluixá-Sanmartín, J.; Altarejos-García, L.; Morales-Torres, A.; Escuder-Bueno, I. Empirical Tool for the Assessment of Annual Overtopping Probabilities of Dams. J. Water Resour. Plann. Manag. 2019, 145, 4018083. [Google Scholar] [CrossRef]
- Zhou, G.G.D.; Li, S.; Lu, X.; Tang, H. Large-Scale Landslide Dam Breach Experiments: Overtopping and “Overtopping and Seepage” Failures. Eng. Geol. 2022, 304, 106680. [Google Scholar] [CrossRef]
- Li, P.; Liang, C. Risk Analysis for Cascade Reservoirs Collapse Based on Bayesian Networks under the Combined Action of Flood and Landslide Surge. Math. Probl. Eng. 2016, 2016, 1–13. [Google Scholar] [CrossRef]
- Huang, Z. Risk and Benefit Research of Chengbihe Reservoir Operation by Stages. Master’s Thesis, Guangxi University, Nanning, China, 2013. [Google Scholar]
- Wu, Z.; Chen, C.; Li, J.; Chen, J.; Bian, K. Time-Variant Probability Analysis of Seepage Failure for High Core Rockfill Dams Under Rapid Drawdown of Reservoir Water Level; Elsevier: Amsterdam, The Netherlands, 2023. [Google Scholar]
- Wang, T.; Li, Z.K.; Ge, W.; Zhang, Y.D.; Jiao, Y.T.; Sun, H.Q.; Zhang, H. Calculation of Dam Risk Probability of Cascade Reservoirs Considering Risk Transmission and Superposition. J. Hydrol. 2022, 609, 127768. [Google Scholar] [CrossRef]
- Brunner, G.W. HEC-RAS River Analysis System: Hydmuiic Reference Manual Version 5.0; Hydrologic Engineering Center of US Army Corps of Engineers: Davis, CA, USA, 2016. [Google Scholar]
- Gu, S.L.; Wu, Y.S.; Xie, H.W.; Yuan, X. Numerical Simulation of Overflow of Two Dimensional Broad-Crested Weir Based on SPH Method. South North Water Transf. Water Sci. Technol. 2017, 15, 127–131, 137. [Google Scholar] [CrossRef]
- Beza, M.; Fikre, A.; Moshe, A.; Vignali, V. Dam Breach Modeling and Downstream Flood Inundation Mapping Using HEC-RAS Model on the Proposed Gumara Dam Ethiopia. Adv. Civ. Eng. 2023, 2023, 8864328. [Google Scholar] [CrossRef]
- Lu, M. Simulation of Mountain Flood Inundation in Small Watershed Based on HEC-RAS Model and Its Application to the Control of Qianyou River Reach. Master’s Thesis, Xi’an University of Technology, Xi’an, China, 2024. [Google Scholar]
- Murphy, B. Environmental Hazards: Assessing Risk and Reducing Disaster (Fifth Edition) by Keith Smith and David N. Petley. Can. Geogr. 2010, 54, 258–259. [Google Scholar] [CrossRef]
- Saaty, T.L. The Analytic Hierarchy Process: Planning, Priority Setting, Resource Allocation; McGraw-Hill: New York, NY, USA, 1980; ISBN 978-0-07-054371-3. [Google Scholar]
- Liu, W.; Carling, P.A.; Hu, K.; Wang, H.; Zhou, Z.; Zhou, L.; Liu, D.; Lai, Z.; Zhang, X. Outburst Floods in China: A Review. Earth Sci. Rev. 2019, 197, 102895. [Google Scholar] [CrossRef]


| Hazard Level | Vulnerability Level | Risk Level | |||
|---|---|---|---|---|---|
| Hazard Index Range | Classification | Vulnerability Index Range | Classification | Risk Index Range | Classification |
| 0.00–0.20 | None | 0.00–0.20 | Extremely low | 0.00~0.04 | Extremely Low |
| 0.20–0.40 | Mild | 0.20–0.40 | Mild | 0.04~0.16 | Low |
| 0.40–0.60 | Moderate | 0.40–0.60 | Severe | 0.16~0.36 | Moderate |
| 0.60–0.80 | Serious | 0.60–0.80 | High | 0.36~0.64 | High |
| 0.80–1.00 | Extremely Serious | 0.80–1.00 | Very High | 0.64~1.00 | Extremely High |
| Reservoir | RE1 | RE2 | RE3 |
|---|---|---|---|
| Dead water level (MASL) | 1321.0 | 1155.0 | 1012.0 |
| Normal reservoir level (MASL) | 1330.0 | 1200.0 | 1015.0 |
| Design flood level (MASL) | 1330.44 | 1203.5 | 1018.67 |
| Crest elevation (MASL) | 1334.0 | 1205.0 | 1020.0 |
| Crest length (m) | 516.0 | 774.69 | 468.7 |
| Total reservoir capacity (108 m3) | 7.6 | 61.3 | 0.91 |
| Verification flood standard | 5000 years | 5000 years | 1000 years |
| Verification flood peak flow (m3/s) | 18,880 | 23,900 | 23,600 |
| Reservoir | Scenario 1 | Scenario 2 | Scenario 3 | |||
|---|---|---|---|---|---|---|
| Peak Flow (104 m3/s) | Maximum Water Level (MASL) | Peak Flow (104 m3/s) | Maximum Water Level (MASL) | Peak Flow (104 m3/s) | Maximum Water Level (MASL) | |
| RE1 | 2.45 | 1329.05 | 2.45 | 1329.05 | 2.45 | 1329.05 |
| RE2 | 1.53 | 1209.3 | 1.92 | 1200.69 | 1.92 | 1200.69 |
| RE3 | 0.738 | 1023.4 | 0.769 | 1023.31 | 2.01 | 1019.82 |
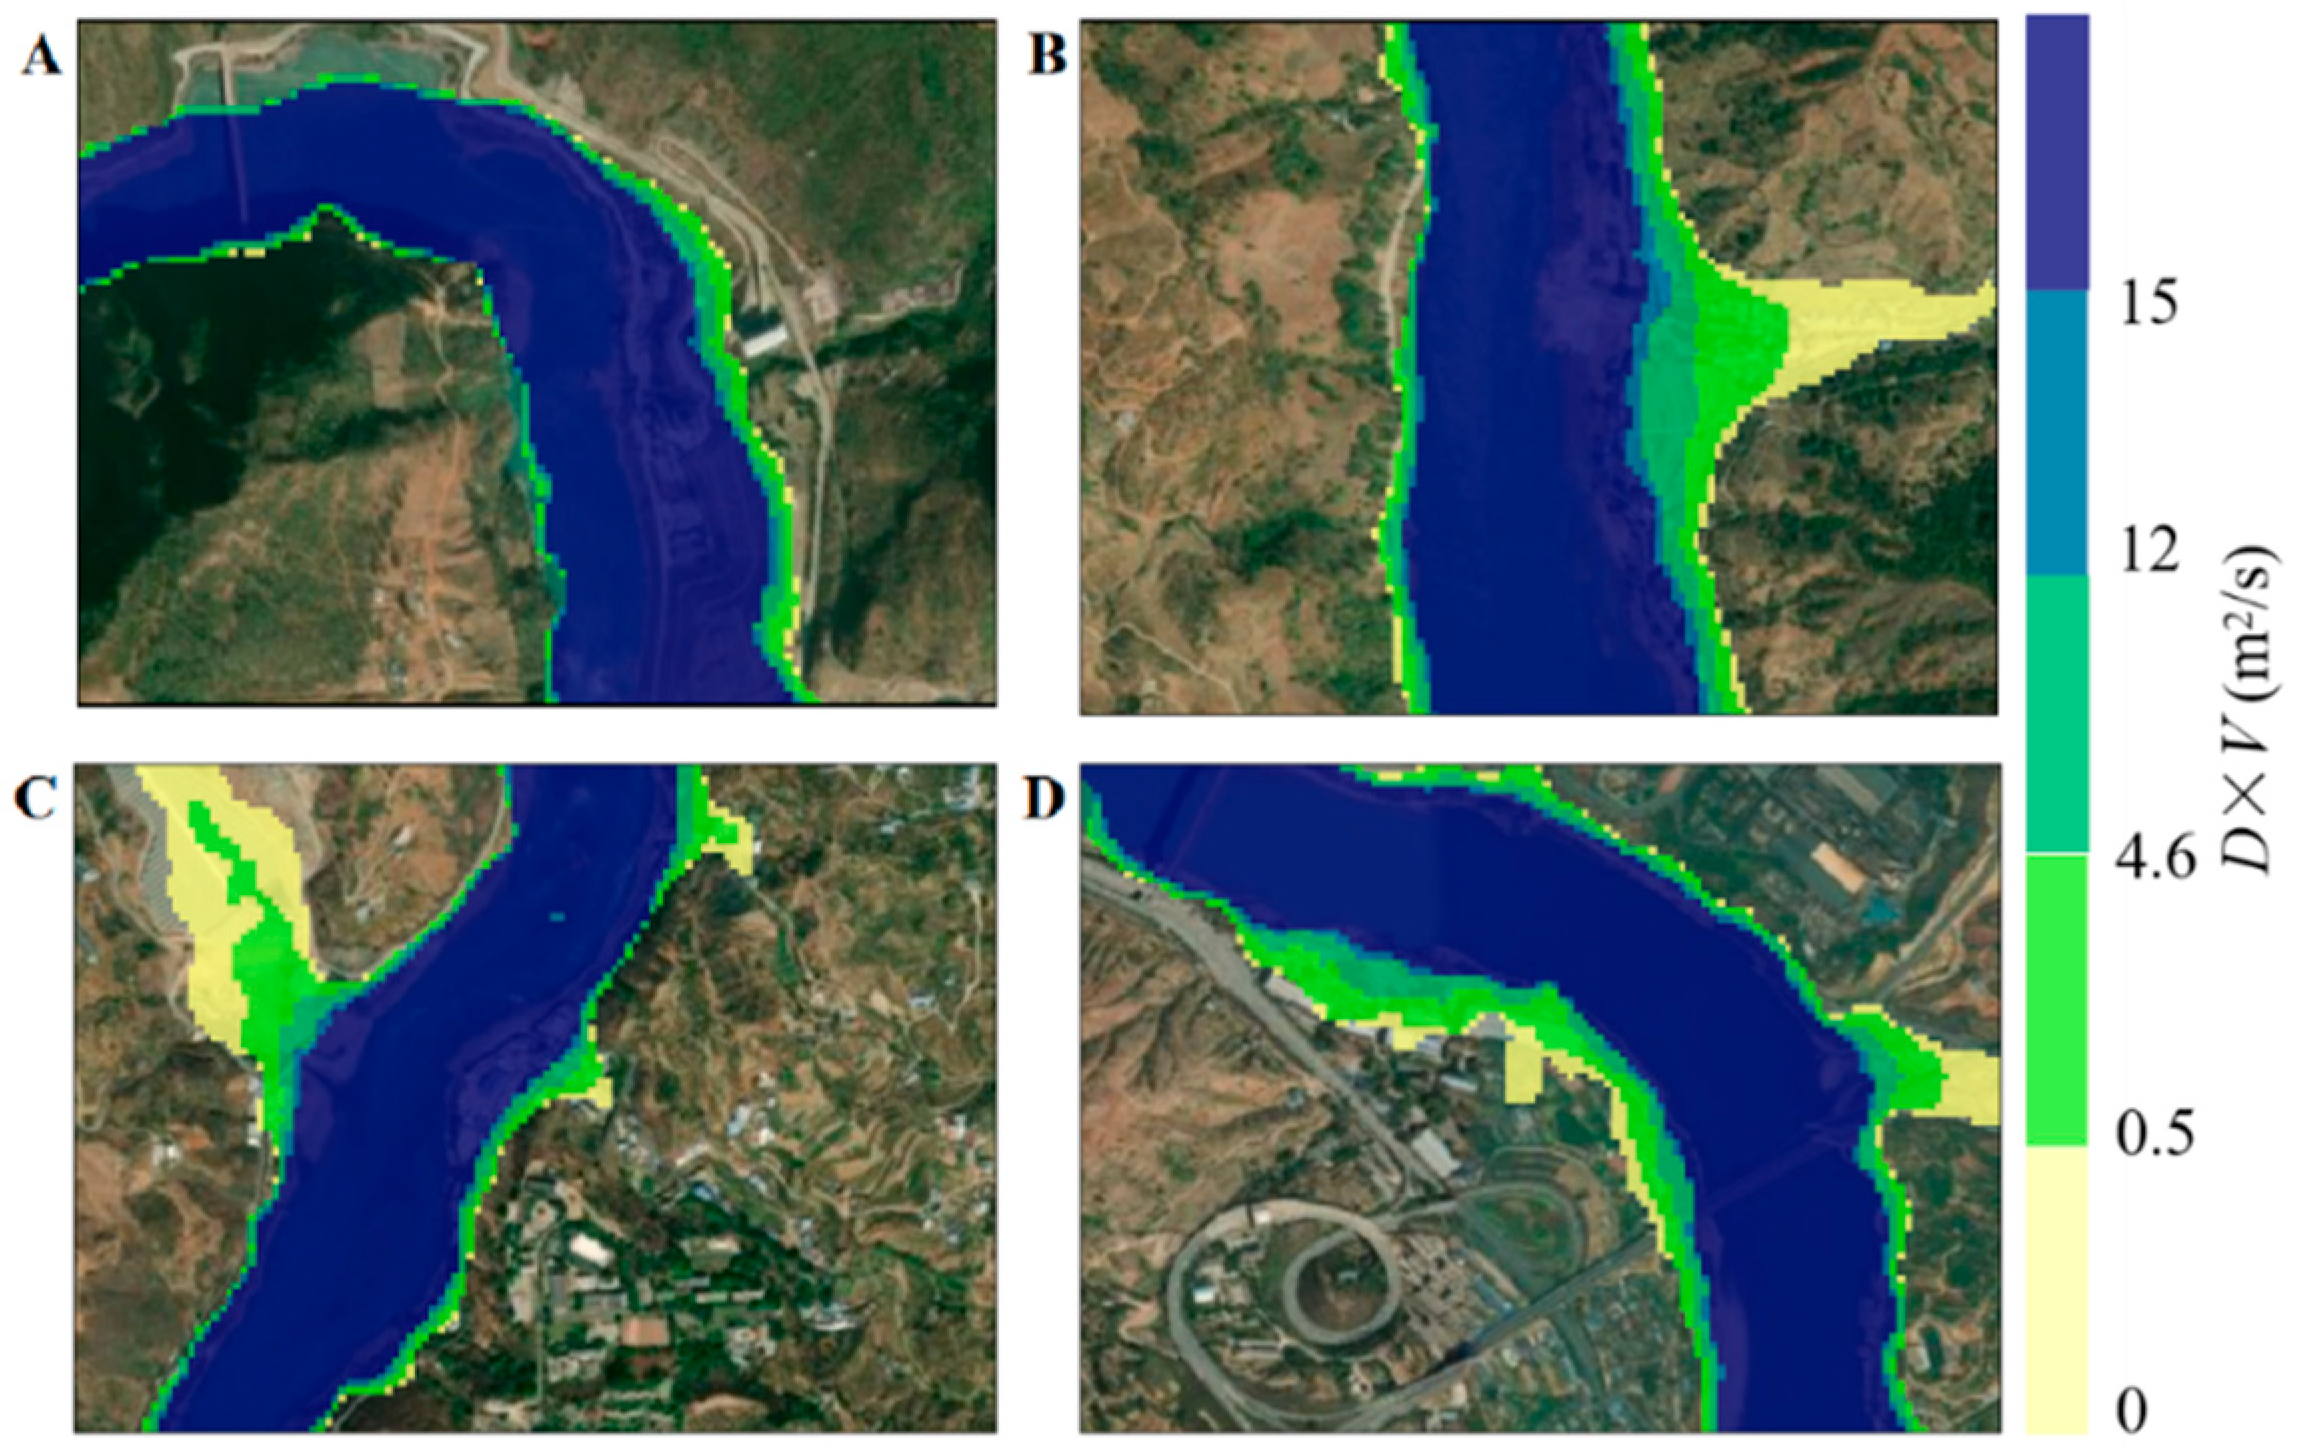
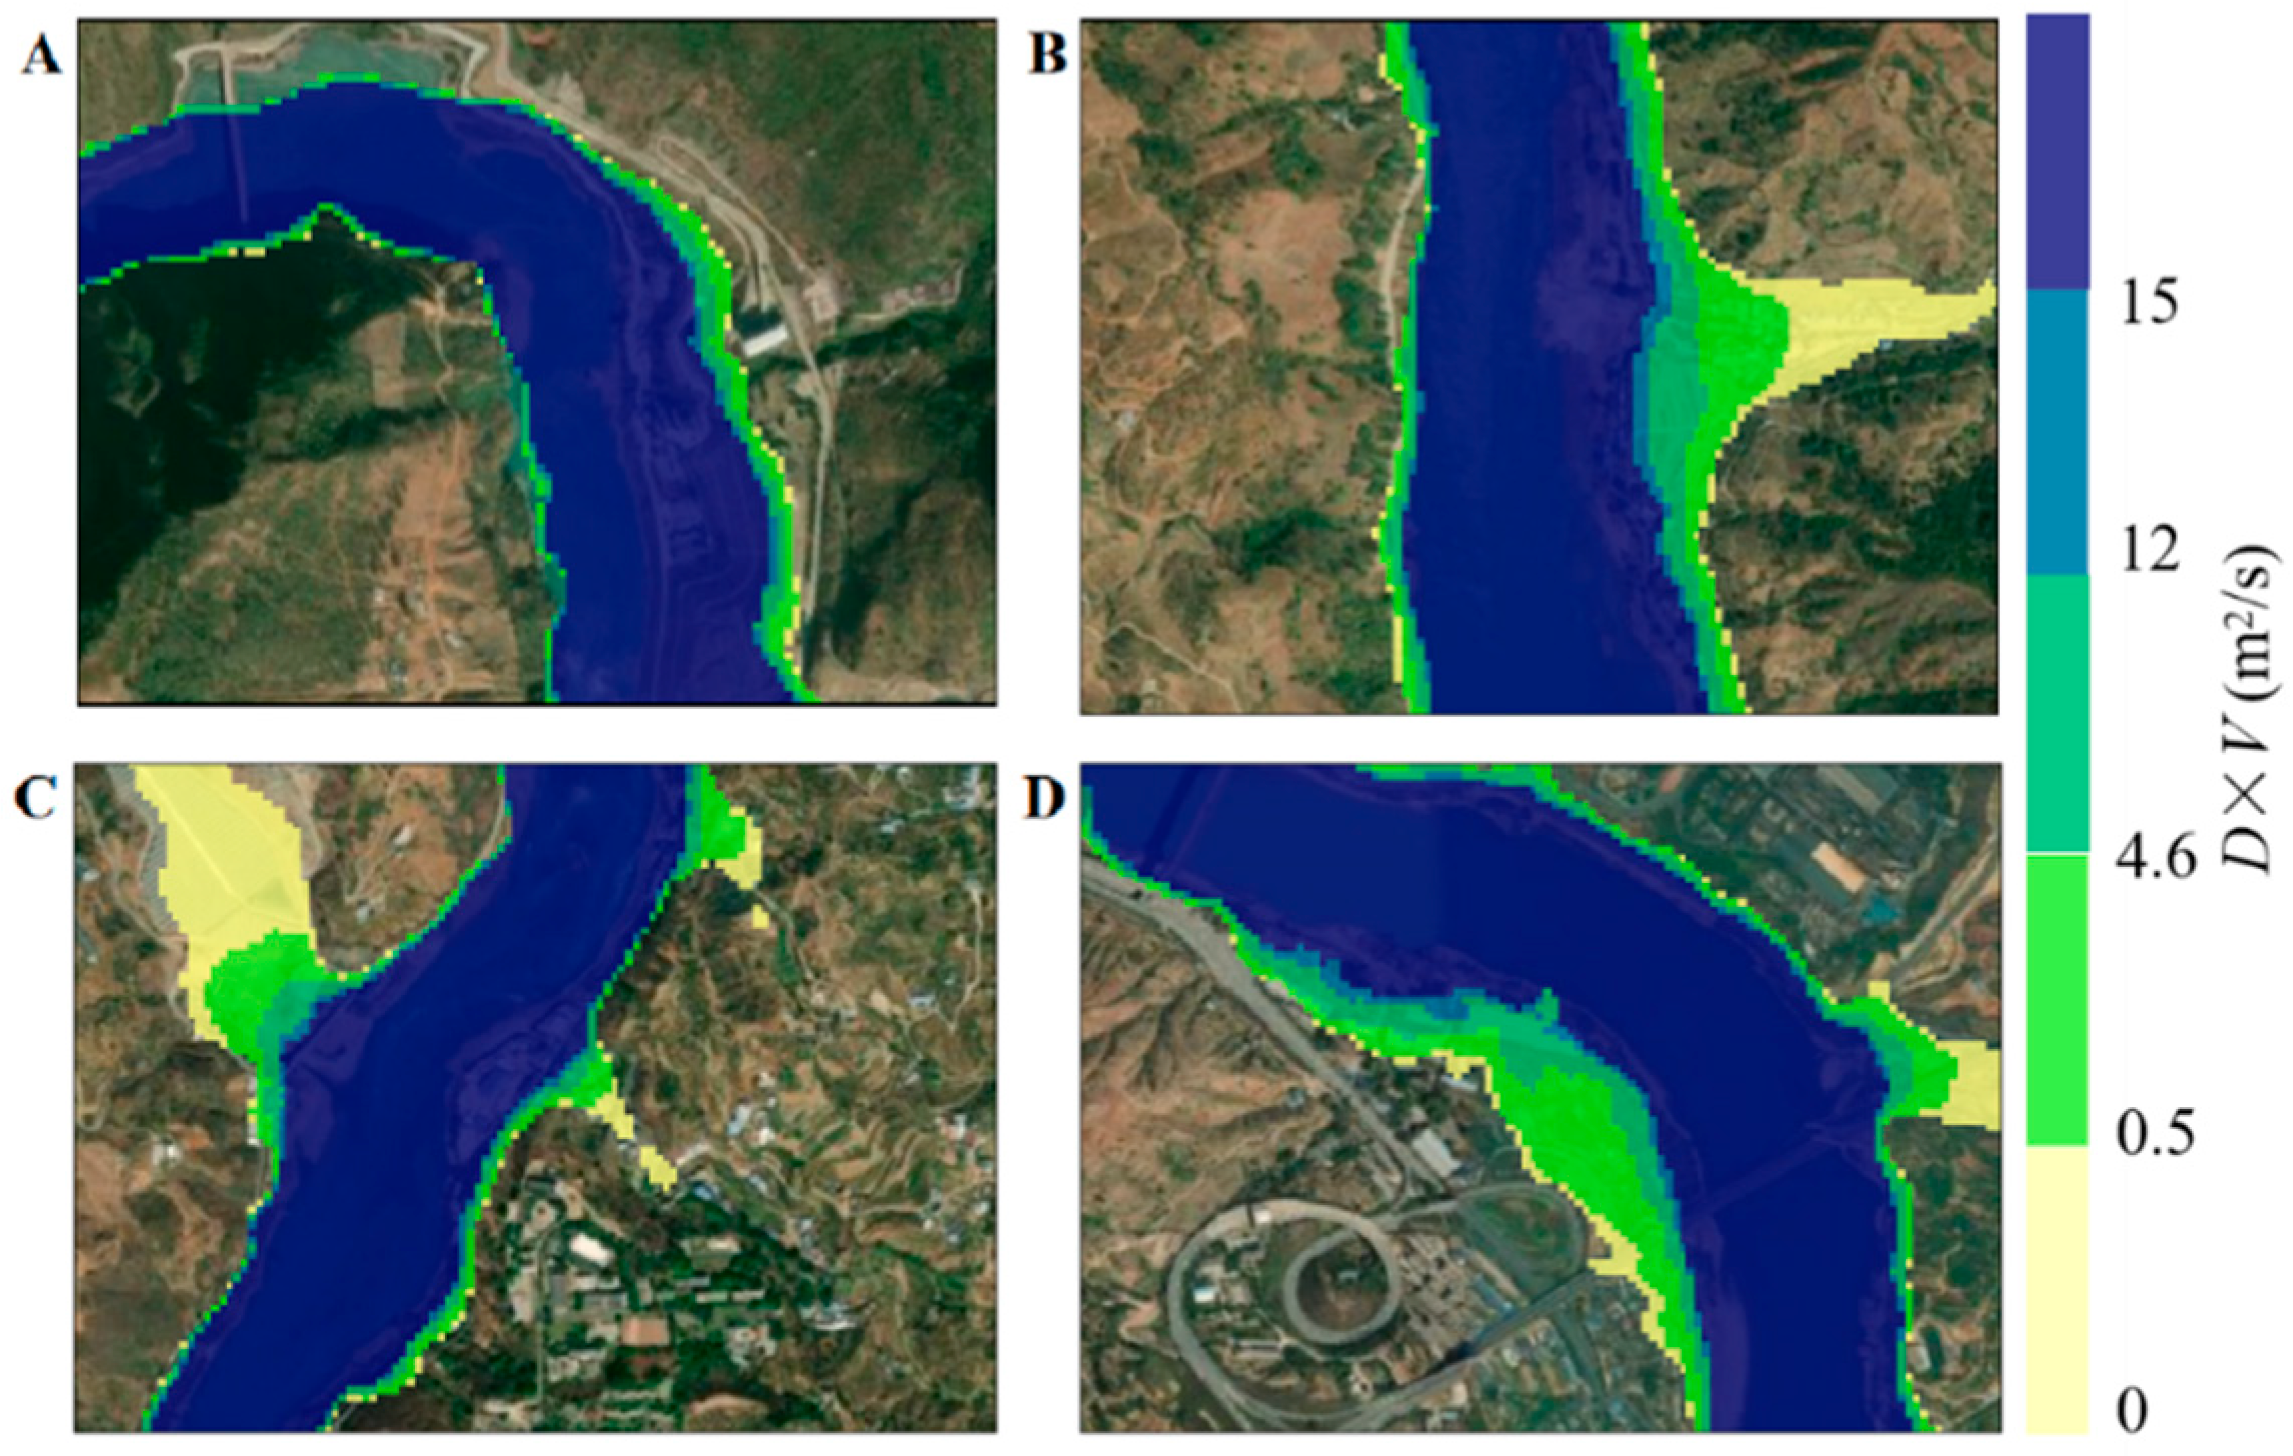
| Flood Severity | Depth·Velocity·(D·V) m2/s |
|---|---|
| Extremely | D·V ≤ 0.5 m2/s |
| Low | 0.5 < D·V ≤ 4.6 m2/s |
| Moderate | 4.6 m2/s < D·V ≤ 12 m2/s |
| High | 12 m2/s < D·V ≤ 15 m2/s |
| Extremely high | D·V > 15 m2/s |
| Representative Location | Extremely Low | Low | Medium | High | Extremely High | Total Area |
|---|---|---|---|---|---|---|
| A | 0.006 | 0.022 | 0.025 | 0.01 | 0.199 | 0.262 |
| B | 0.028 | 0.035 | 0.018 | 0.011 | 0.142 | 0.234 |
| C | 0.058 | 0.042 | 0.012 | 0.011 | 0.125 | 0.248 |
| D | 0.048 | 0.076 | 0.051 | 0.017 | 0.117 | 0.309 |
| Representative Location | Extremely Low | Low | Medium | High | Extremely High | Total Area |
|---|---|---|---|---|---|---|
| A | 0.006 | 0.022 | 0.025 | 0.010 | 0.199 | 0.262 |
| B | 0.038 | 0.042 | 0.029 | 0.014 | 0.145 | 0.268 |
| C | 0.062 | 0.048 | 0.015 | 0.016 | 0.126 | 0.267 |
| D | 0.048 | 0.076 | 0.051 | 0.017 | 0.117 | 0.309 |
| Representative Location | Extremely Low | Low | Medium | High | Extremely High | Total Area |
|---|---|---|---|---|---|---|
| A | 0.006 | 0.022 | 0.025 | 0.010 | 0.199 | 0.262 |
| B | 0.038 | 0.042 | 0.029 | 0.014 | 0.145 | 0.268 |
| C | 0.076 | 0.034 | 0.018 | 0.016 | 0.134 | 0.278 |
| D | 0.024 | 0.085 | 0.056 | 0.019 | 0.136 | 0.320 |
| Scenario | Vulnerability | Hazard | Risk | |||||
|---|---|---|---|---|---|---|---|---|
| Loss of Life (Person) | Direct Economic Loss (104 ¥) | Indirect Economic Loss (104 ¥) | Social and Environmental Loss | Adjusted Vulnerability | Risk Probability | Adjusted Hazard | ||
| 1 | 2184 | 1176.74 | 712.04 | 1.44 | 0.804 | 1.6 × 10⁻⁵ | 0.361 | 0.290 |
| 2 | 2243 | 1210.62 | 726.37 | 13.75 | 0.843 | 4 × 10⁻⁶ | 0.207 | 0.175 |
| 3 | 2298 | 1229.28 | 737.57 | 42.30 | 0.862 | 4 × 10⁻⁶ | 0.184 | 0.159 |
Disclaimer/Publisher’s Note: The statements, opinions and data contained in all publications are solely those of the individual author(s) and contributor(s) and not of MDPI and/or the editor(s). MDPI and/or the editor(s) disclaim responsibility for any injury to people or property resulting from any ideas, methods, instructions or products referred to in the content. |
© 2025 by the authors. Licensee MDPI, Basel, Switzerland. This article is an open access article distributed under the terms and conditions of the Creative Commons Attribution (CC BY) license (https://creativecommons.org/licenses/by/4.0/).
Share and Cite
Jia, M.; Lu, X.; Ding, X.; Chu, J.; Ma, X.; Tang, X. Calculation of Overtopping Risk Probability and Assessment of Risk Consequences of Cascade Reservoirs. Sustainability 2025, 17, 4839. https://doi.org/10.3390/su17114839
Jia M, Lu X, Ding X, Chu J, Ma X, Tang X. Calculation of Overtopping Risk Probability and Assessment of Risk Consequences of Cascade Reservoirs. Sustainability. 2025; 17(11):4839. https://doi.org/10.3390/su17114839
Chicago/Turabian StyleJia, Meirong, Xin Lu, Xiangyi Ding, Junying Chu, Xinyi Ma, and Xiaojie Tang. 2025. "Calculation of Overtopping Risk Probability and Assessment of Risk Consequences of Cascade Reservoirs" Sustainability 17, no. 11: 4839. https://doi.org/10.3390/su17114839
APA StyleJia, M., Lu, X., Ding, X., Chu, J., Ma, X., & Tang, X. (2025). Calculation of Overtopping Risk Probability and Assessment of Risk Consequences of Cascade Reservoirs. Sustainability, 17(11), 4839. https://doi.org/10.3390/su17114839