
Credible Variable Speed Limits for Improving Road Safety: A Case Study Based on Italian Two-Lane Rural Roads


Abstract
1. Introduction
2. Methods
2.1. Data Collection
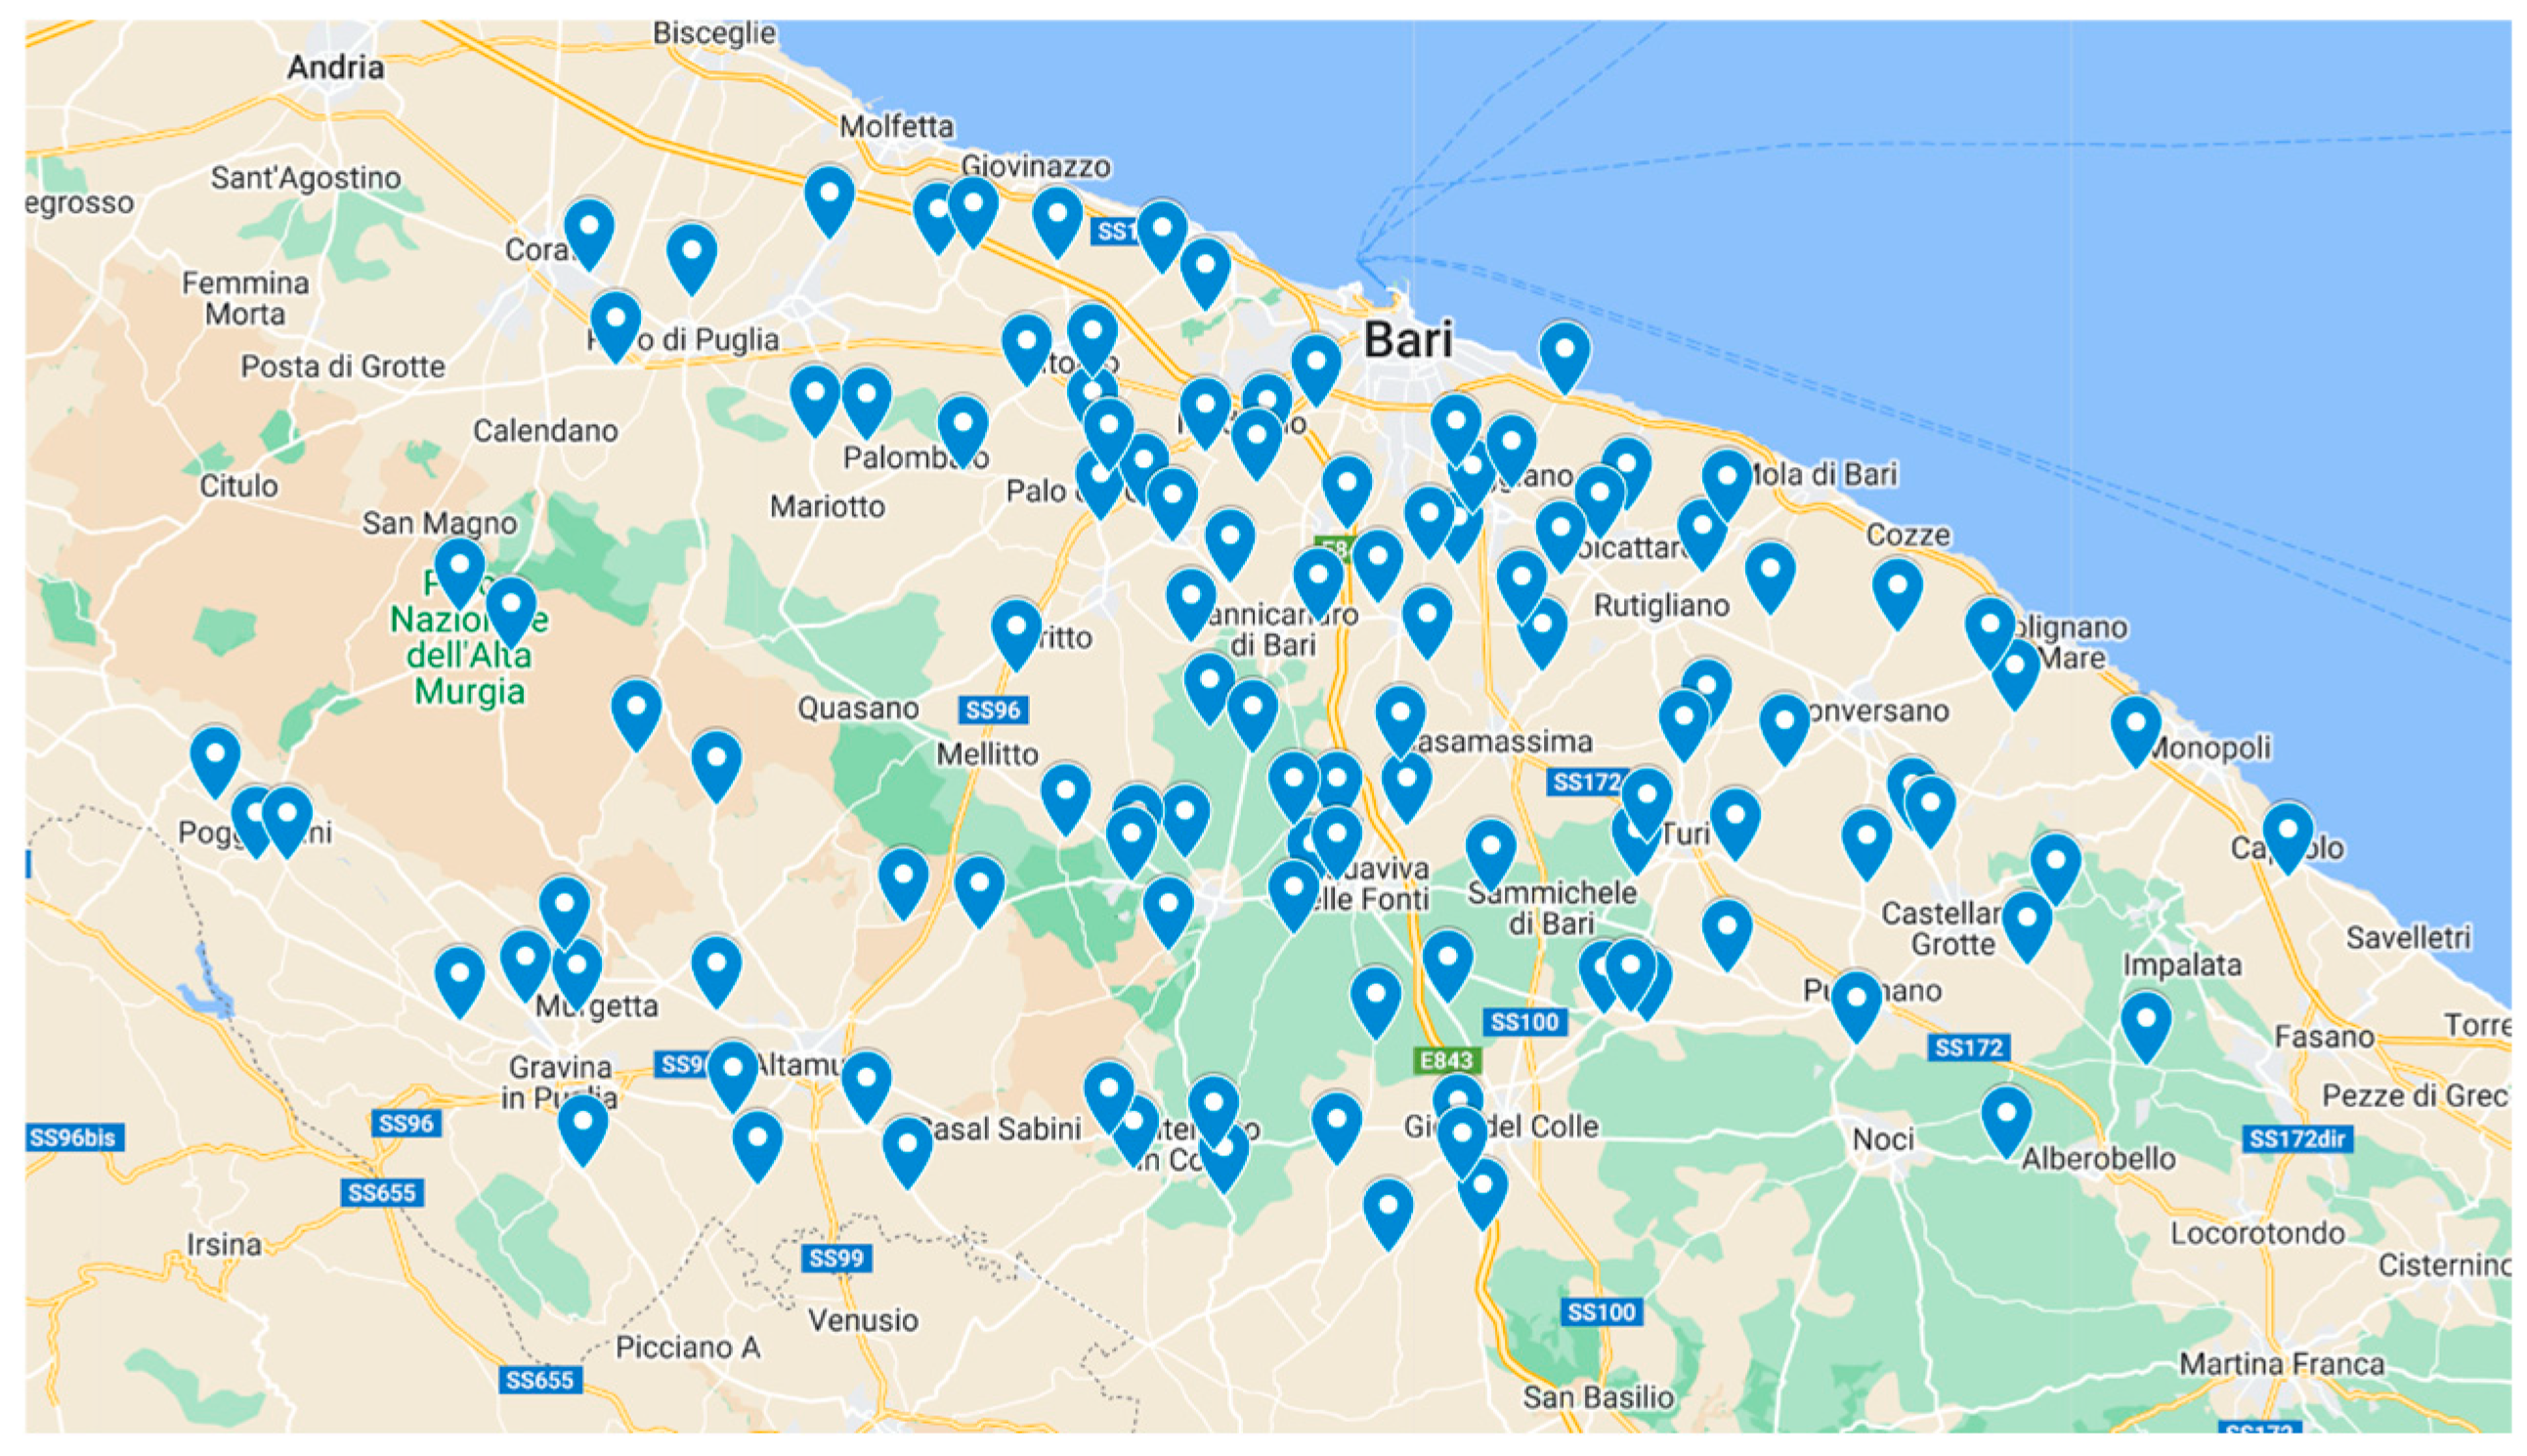
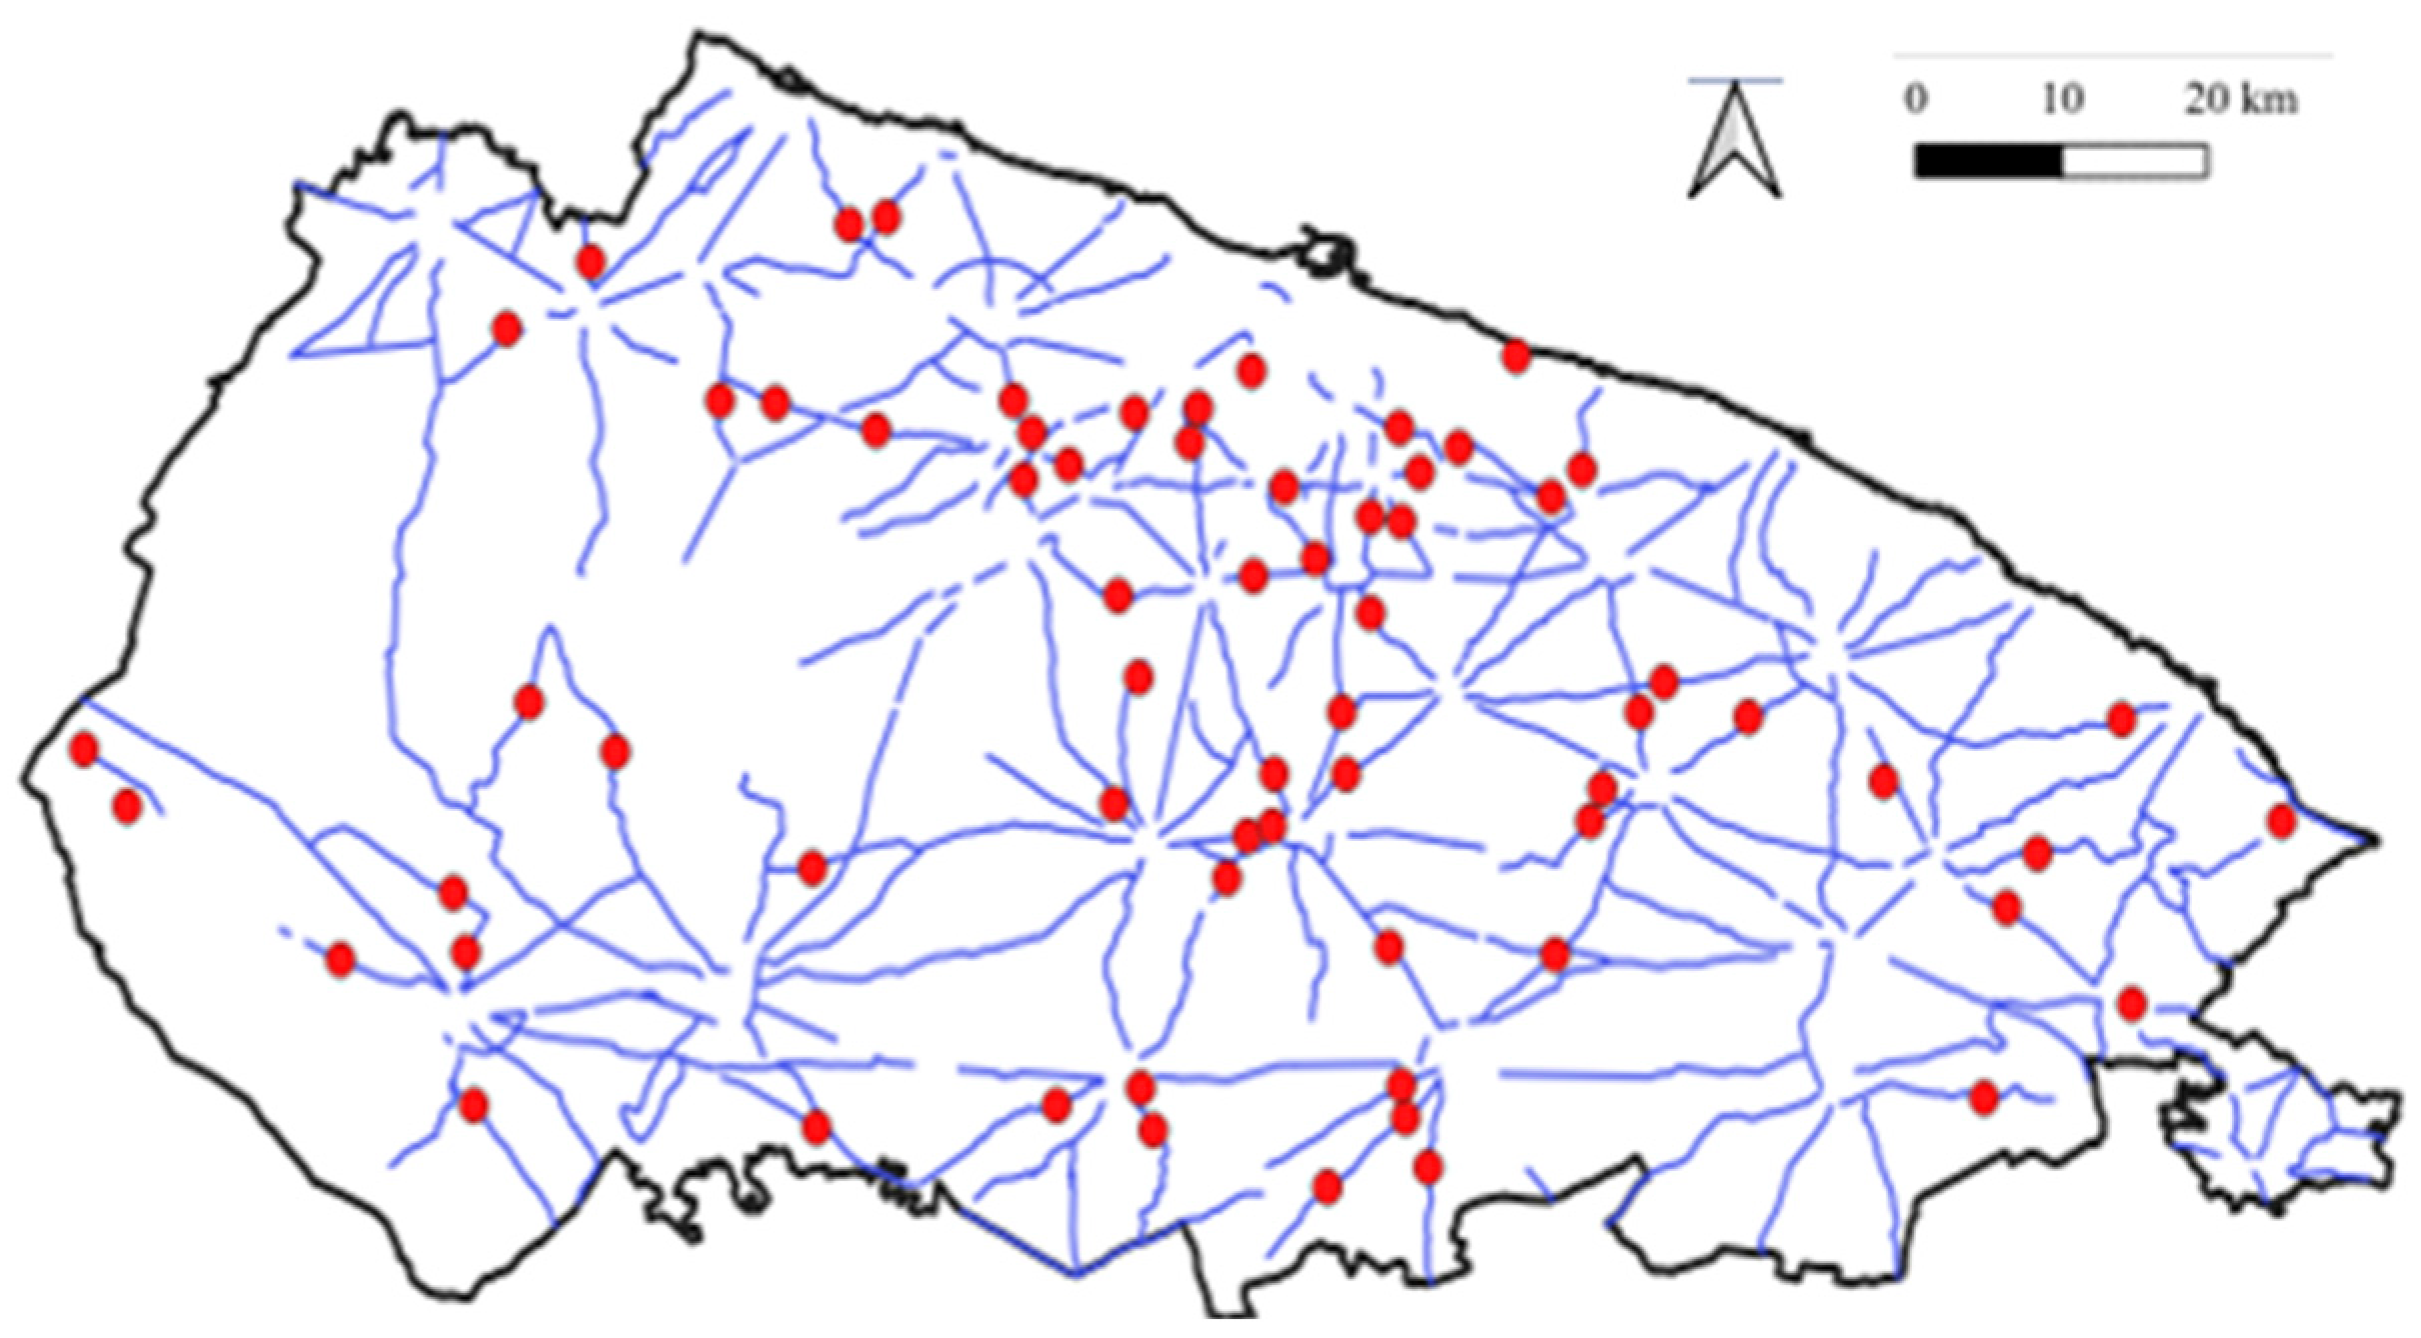
2.1.1. Traffic Survey Campaign
2.1.2. Definition of Variables
- CCR is the curvature change ratio (gon/km).
- is the i-th angle of deviation of the i-th curve (gon). The angle of deviation can be related to a single curve or multiple curves on the road layout.
- is the length of the j-th road element (km). This formula can be applied to a single element included between two consecutive tangents or to the entire road. In the latter case, the sum of all the j-th L elements is the total length of the investigated road. In this second case, the CCR provides an overall idea of the tortuosity of the road.
- Traffic, “ADT”, is a continuous variable, representing the average daily traffic obtained from one week of data recording with the speed counter. Traffic data were obtained by the 2023 monitoring campaign and compared to historical data. A stability in the ADT values was found from 2017 to 2023, to use the values obtained during the monitoring phase for crash predictions as well. Thus, there is just one ADT value for each road, no matter what timeframe is considered.
- Vehicle composition, “VLegg”, is a continuous variable. This variable represents the percentage of light vehicles recorded during the monitoring phase by the speed counters. It is expressed as a percentage of the total vehicles recorded at each monitoring station. The heavy vehicles are a complement to 100 of the provided number. The same consideration made for the ADT about its time stability is applicable to the percentage of light vehicles. It remained stable through the years studied, so it was possible to rely on one value only for both operating speed and the safety model, no matter what timeframe was considered.
- Speed Limit, “Limit”, is a factor variable. The posted speed limits were collected during the monitoring phase. Thanks to Google Street View, the current speed limits were compared with the ones between 2015 and 2019 to define whether they have been constant through the years. No variations were detected. The recorded and posted speed limits are 50 km/h, 60 km/h, 70 km/h, 80 km/h, and 90 km/h, depending on the characteristics of the roads. On the same road, the posted speed limit varies according to different conditions. Thus, for the purpose of the analysis, only the posted speed limit preceding the use of the counter was used. Thus, the speed limits were categorized as follows:
- ○
- 0 = 50 km/h—Limit50
- ○
- 1 = 60 km/h—Limit60
- ○
- 2 = 70 km/h—Limit70
- ○
- 3 = 80 km/h—Limit80
- Vehicle traveling at speeds greater than the posted speed limit, “SupL”, is a continuous variable expressed as a percentage of vehicles traveling at speeds greater than the posted speed limit. The data came from the monitoring phase with the speed counters. Thus, this variable could have been applied just for the operating speed model, because no clues were available about this behavior in the period 2015–2019.
- School day, “Scholastic”, is a binary variable. The numeral 0 indicates that the recorded values happened during an in-school period, and 1 signifies that the monitoring phase happened outside an in-school period. Thus, this variable could have been applied just for the operating speed model, because no clues were available about this behavior in the period of 2015–2019.
- L is the length of each of the investigated sites/roads expressed in km.
- CCR is intended as a synthetic measure of the variability of the horizontal alignment of the road, as expressed in Equation (1). The values of the CCR represent the complex/tortuous alignment with several sharp curves. This variable could be applied to all the desired time spans since it is constant throughout time, expressing a geometric condition.
- Rmax is intended as the maximum radius of curvature among the curves of the site, measured in meters (m). This variable could also be applied to all the desired time spans since it is constant throughout time, expressing a geometric condition.
- Rain. In this case, also, different measures were alternatively considered during the definition of the models, given their correlation. More details will be provided in Section 2.2.2. The two considered rain variables are the following:
- ○
- Days of rain (GG); that is, a continuous variable representing the count of days with a rain phenomenon during the monitoring period.
- ○
- Amount of rain (mm); that is, a continuous variable, expressed in millimeters, the cumulative amount of rain that fell during the monitoring period.
- Intersection density, “IntDensity”, is a continuous variable representing the ratio of intersections on the investigated road over the extent of the road. It is a kilometric frequency of intersections, including minor and major ones. This variable could be applied to all the desired time spans since it is constant throughout time, expressing a geometric condition.
- Intersection typology, “IntTyp”, is a factor variable representing the intersection typology on the investigated road (0: three-legged intersections; 1: four-legged intersections or roundabouts; 2: mixed typologies of intersections). This variable could be applied to all the desired time spans since it is constant throughout time, expressing a geometric condition.
- Cross-section variability, “VarSez”, is a continuous variable, representing the difference between the maximum and minimum cross-sectional dimensions of the investigated road, measured in meters (m). This variable could be applied to all the desired time spans since it is constant throughout time, expressing a geometric condition.
2.1.3. Description of Variables
2.2. Statistical Analysis
2.2.1. Operating Speed Model
2.2.2. Safety Performance Function Model
- Total F+I crashes occurring, derived from the count of F+I crashes recorded between 2015 and 2019 on the investigated roads by the ACI-ISTAT dataset. This category is further divided into the following three sub-categories, separately used as outcome variables:
- ○
- Intersection (Int) is a continuous variable counting the number of F+I crashes occurring at the intersections.
- ○
- Segment (Seg) is a continuous variable counting the number of F+I crashes occurring on the tangent segments of the road sections.
- ○
- Curve (Cur) is a continuous variable counting the number of F+I crashes occurring on the curved parts of the road sections.
- Multi-vehicle crashes, including rear-end, sideswipe, side crashes, and front crashes, “MultiVeic”. This variable derives from the count of multivehicle F+I crashes that occurred between 2015 and 2019 on the investigated roads (ACI-ISTAT dataset).
- Single-vehicle crashes, including run-off-road and hit-obstacles crashes, “SingVeic”. This variable derives from the count of single-vehicle F+I crashes occurring between 2015 and 2019 on the investigated roads (ACI-ISTAT dataset).
3. Results and Discussion
3.1. Operating Speed Model: Results and Discussion
3.2. Safety Performance Functions (SPFs): Results and Discussion
4. Conclusions
Author Contributions
Funding
Institutional Review Board Statement
Informed Consent Statement
Data Availability Statement
Acknowledgments
Conflicts of Interest
References
- Chen, S.; Zong, S.; Chen, T.; Huang, Z.; Chen, Y.; Labi, S. A taxonomy for autonomous vehicles considering ambient road infrastructure. Sustainability 2023, 15, 11258. [Google Scholar] [CrossRef]
- Pompigna, A.; Mauro, R. Smart roads: A state of the art of highways innovations in the Smart Age. Eng. Sci. Technol. Int. J. 2022, 25, 100986. [Google Scholar] [CrossRef]
- Lie, A.; Tingvall, C.; Michael, J.P.; Fell, J.C.; Dinh-Zarr, T.B. Vision Zero and impaired driving: Near and longer-term opportunities for preventing death and injuries. Accid. Anal. Prev. 2024, 194, 107344. [Google Scholar] [CrossRef]
- Mayorov, V.I.; Denisenko, V.V.; Solovev, S.G. A systemic approach to road safety in the EU. Jurídicas CUC 2023, 19, 259–278. [Google Scholar] [CrossRef]
- Guo, Q.; Li, L.; Ban, X.J. Urban traffic signal control with connected and automated vehicles: A survey. Transp. Res. Part C Emerg. Technol. 2019, 101, 313–334. [Google Scholar] [CrossRef]
- Babić, D.; Fiolić, M.; Babić, D.; Gates, T. Road markings and their impact on driver behaviour and road safety: A systematic review of current findings. J. Adv. Transp. 2020, 2020, 7843743. [Google Scholar] [CrossRef]
- Khondaker, B.; Kattan, L. Variable speed limit: An overview. Transp. Lett. 2015, 7, 264–278. [Google Scholar] [CrossRef]
- Choudhary, P.; Imprialou, M.; Velaga, N.R.; Choudhary, A. Impacts of speed variations on freeway crashes by severity and vehicle type. Accid. Anal. Prev. 2018, 121, 213–222. [Google Scholar] [CrossRef]
- Alnawmasi, N.; Mannering, F. The impact of higher speed limits on the frequency and severity of freeway crashes: Accounting for temporal shifts and unobserved heterogeneity. Anal. Methods Accid. Res. 2022, 34, 100205. [Google Scholar] [CrossRef]
- Doecke, S.D.; Kloeden, C.N.; Dutschke, J.K.; Baldock, M.R.J. Safe speed limits for a safe system: The relationship between speed limit and fatal crash rate for different crash types. Traffic Inj. Prev. 2018, 19, 404–408. [Google Scholar] [CrossRef]
- Yao, Y.; Carsten, O.; Hibberd, D. A close examination of speed limit credibility and compliance on UK roads. IATSS Res. 2020, 44, 17–29. [Google Scholar] [CrossRef]
- Yao, Y.; Carsten, O.; Hibberd, D.; Li, P. Exploring the relationship between risk perception, speed limit credibility and speed limit compliance. Transp. Res. Part F Traffic Psychol. Behav. 2019, 62, 575–586. [Google Scholar] [CrossRef]
- Sil, G.; Nama, S.; Maji, A.; Maurya, A.K. Effect of horizontal curve geometry on vehicle speed distribution: A four-lane divided highway study. Transp. Lett. 2020, 12, 713–722. [Google Scholar] [CrossRef]
- Yu, R.; Abdel-Aty, M. An optimal variable speed limits system to ameliorate traffic safety risk. Transp. Res. Part C Emerg. Technol. 2014, 46, 235–246. [Google Scholar] [CrossRef]
- Kononov, J.; Durso, C.; Reeves, D.; Allery, B.K. Relationship between traffic density, speed, and safety and its implications for setting variable speed limits on freeways. Transp. Res. Rec. 2012, 2280, 1–9. [Google Scholar] [CrossRef]
- Wang, B.; Guang, X.; Zhou, Q.; Lv, Q. Control Method of Variable Speed Limits at the Freeway Tunnel Entrance under Rainy Weather. In Proceedings of the CICTP 2019, Nanjing, China, 6–8 July 2019; pp. 3626–3635. [Google Scholar]
- Zhang, X.; Wang, K.; Tao, H.; Wang, Y.; Li, J. Research on speed limit method of expressway main road based on rainy environment and its influence on vehicle confluence. In Proceedings of the CICTP 2019, Nanjing, China, 6–8 July 2019; pp. 3512–3523. [Google Scholar]
- Ma, H.; Xu, J. The Speed Limit Determination of Tunnel Entrance And Exit Section On Rainy Days. In IOP Conference Series: Earth and Environmental Science, Proceedings of the 2020 2nd International Conference on Civil Engineering, Environment Resources and Energy Materials, Changsha, China, 18–20 September 2020; IOP Publishing: Bristol, UK, 2021; Volume 634, p. 012137. [Google Scholar]
- Rämä, P. Effects of weather-controlled variable speed limits and warning signs on driver behavior. Transp. Res. Rec. 1999, 1689, 53–59. [Google Scholar] [CrossRef]
- Yan, B.; Fang, C.; Qiu, H.; Zhu, W. Intelligent speed limit system for safe expressway driving in rainy and foggy weather based on Internet of things. J. Shanghai Jiaotong Univ. Sci. 2023, 28, 10–19. [Google Scholar] [CrossRef]
- Bassani, M.; Cirillo, C.; Molinari, S.; Tremblay, J.M. Random effect models to predict operating speed distribution on rural two-lane highways. J. Transp. Eng. 2016, 142, 04016019. [Google Scholar] [CrossRef]
- Thiessen, A.; El-Basyouny, K.; Gargoum, S. Operating speed models for tangent segments on urban roads. Transp. Res. Rec. 2017, 2618, 91–99. [Google Scholar] [CrossRef]
- Martinelli, V.; Ventura, R.; Bonera, M.; Barabino, B.; Maternini, G. Estimating operating speed for county road segments–Evidence from Italy. Int. J. Transp. Sci. Technol. 2023, 12, 560–577. [Google Scholar] [CrossRef]
- Park, E.S.; Fitzpatrick, K.; Das, S.; Avelar, R. Exploration of the relationship among roadway characteristics, operating speed, and crashes for city streets using path analysis. Accid. Anal. Prev. 2021, 150, 105896. [Google Scholar] [CrossRef]
- Pu, Z.; Li, Z.; Jiang, Y.; Wang, Y. Full Bayesian before-after analysis of safety effects of variable speed limit system. IEEE Trans. Intell. Transp. Syst. 2020, 22, 964–976. [Google Scholar] [CrossRef]
- Coropulis, S.; Berloco, N.; Gentile, R.; Intini, P.; Ranieri, V. Traffic microsimulation for road safety assessments of vehicle automation scenarios: Model comparison and sensitivity analysis. Simul. Model. Pract. Theory 2024, 130, 102868. [Google Scholar] [CrossRef]
- He, Y.; Zhang, H.; Ding, N.; Zhang, S.; Guo, A.; Mei, X.; Xiang, W. Effects of ambient temperature on drivers’ speed-selective behavior at different risk levels: A driving simulation study. J. Transp. Saf. Secur. 2025, 17, 299–333. [Google Scholar] [CrossRef]
- Morris, D.M.; Pilcher, J.J. The cold driver: Cold stress while driving results in dangerous behavior. Biol. Psychol. 2016, 120, 149–155. [Google Scholar] [CrossRef] [PubMed]
- Perco, P. Influence of the general character of horizontal alignment on operating speed of two-lane rural roads. Transp. Res. Rec. 2008, 2075, 16–23. [Google Scholar] [CrossRef]
- Discetti, P.; Dell’Acqua, G.; Lamberti, R. Models of operating speeds for low-volume roads. Transp. Res. Rec. 2011, 2203, 219–225. [Google Scholar] [CrossRef]
- Russo, F.; Biancardo, S.A.; Busiello, M. Operating speed as a key factor in studying the driver behaviour in a rural context. Transport 2016, 31, 260–270. [Google Scholar] [CrossRef]
- Malaghan, V.; Pawar, D.S.; Dia, H. Modeling operating speed using continuous speed profiles on two-lane rural highways in India. J. Transp. Eng. Part A Syst. 2020, 146, 04020124. [Google Scholar] [CrossRef]
- González-Hernández, B.; Llopis-Castelló, D.; García, A. Operating speed models for heavy vehicles on tangents of two-lane rural roads. Adv. Transp. Stud. 2020, 50, 5. [Google Scholar]
- Marchionna, A.; Perco, P. Operating speed-profile prediction model for two-lane rural roads in the Italian context. Adv. Transp. Stud. 2008, 14, 57–68. [Google Scholar]
- National Research Council (US). Transportation Research Board. Task Force on Development of the Highway Safety Manual, & Transportation Officials. Joint Task Force on the Highway Safety Manual. In Highway Safety Manual; AASHTO: Washington, DC, USA, 2010; Volume 1. [Google Scholar]
- Intini, P.; Berloco, N.; Coropulis, S.; Gentile, R.; Ranieri, V. The Use of Macro-Level Safety Performance Functions for Province-Wide Road Safety Management. Sustainability 2022, 14, 9245. [Google Scholar] [CrossRef]
- Lord, D.; Mannering, F. The statistical analysis of crash-frequency data: A review and assessment of methodological alternatives. Transp. Res. Part A Policy Pract. 2010, 44, 291–305. [Google Scholar] [CrossRef]
- Haglund, M.; Åberg, L. Speed choice in relation to speed limit and influences from other drivers. Transp. Res. Part F Traffic Psychol. Behav. 2000, 3, 39–51. [Google Scholar] [CrossRef]
- Tate, F.; Turner, S. Road geometry and drivers’ speed choice. Road Transp. Res. J. Aust. N. Z. Res. Pract. 2007, 16, 53–64. [Google Scholar]
- Elvik, R.; Vaa, T.; Hoye, A.; Sorensen, M. (Eds.) The Handbook of Road Safety Measures; Emerald Group Publishing: Manchester, UK, 2009. [Google Scholar]
- Hauer, E. The Art of Regression Modeling in Road Safety; Springer: New York, NY, USA, 2015; Volume 38. [Google Scholar]
- Törnros, J. Effect of driving speed on reaction time during motorway driving. Accid. Anal. Prev. 1995, 27, 435–442. [Google Scholar] [CrossRef]
- Mohamed, S.A.; Mohamed, K.; Al-Harthi, H.A. Investigating factors affecting the occurrence and severity of rear-end crashes. Transp. Res. Procedia 2017, 25, 2098–2107. [Google Scholar] [CrossRef]
- Lee, Y.M.; Chong, S.Y.; Goonting, K.; Sheppard, E. The effect of speed limit credibility on drivers’ speed choice. Transp. Res. Part F Traffic Psychol. Behav. 2017, 45, 43–53. [Google Scholar] [CrossRef]
- Goldenbeld, C.; van Schagen, I. The credibility of speed limits on 80 km/h rural roads: The effects of road and person (ality) characteristics. Accid. Anal. Prev. 2007, 39, 1121–1130. [Google Scholar] [CrossRef]
- Elvik, R.; Vadeby, A.; Hels, T.; van Schagen, I. Updated estimates of the relationship between speed and road safety at the aggregate and individual levels. Accid. Anal. Prev. 2019, 123, 114–122. [Google Scholar] [CrossRef]
- Colonna, P.; Berloco, N.; Intini, P.; Ranieri, V. The method of the friction diagram: New developments and possible applications. Transp. Infrastruct. Syst. 2017, 8, 309–316. [Google Scholar]
- Al-Kaisy, A.; Raza, S. A Novel Network Screening Methodology for Rural Low-Volume Roads. J. Transp. Technol. 2023, 13, 599–614. [Google Scholar] [CrossRef]
- Dai, Y.; Zhao, X.; Luan, S.; Wang, Y. Exploring the Effects of Variable Speed Limit on the Car-Following Process on Bridges in Fog with Consideration of Human Factors. J. Transp. Eng. Part A Syst. 2025, 151, 04025013. [Google Scholar] [CrossRef]
- Saha, P.; Ahmed, M.M.; Young, R.K. Safety effectiveness of variable speed limit system in adverse weather conditions on challenging roadway geometry. Transp. Res. Rec. 2015, 2521, 45–53. [Google Scholar] [CrossRef]
- Yang, G.; Ahmed, M.M.; Gaweesh, S. of variable speed limit in a connected vehicle environment on truck driver behavior under adverse weather conditions: Driving simulator study. Transp. Res. Rec. 2019, 2673, 132–142. [Google Scholar] [CrossRef]
- Guo, J.; Ma, C.; Xu, X.; Zhao, Y.; Lu, X. Investigation on variable speed limit control strategy of expressway under adverse weather conditions. Phys. A Stat. Mech. Its Appl. 2022, 602, 127616. [Google Scholar] [CrossRef]
- Islam, M.T.; Hadiuzzaman, M.; Fang, J.; Qiu, T.Z.; El-Basyouny, K. Assessing mobility and safety impacts of a variable speed limit control strategy. Transp. Res. Rec. 2013, 2364, 1–11. [Google Scholar] [CrossRef]
- Hellinga, B.; Mandelzys, M. Impact of driver compliance on the safety and operational impacts of freeway variable speed limit systems. J. Transp. Eng. 2011, 137, 260–268. [Google Scholar] [CrossRef]
- Lee, C.; Hellinga, B.; Saccomanno, F. Evaluation of variable speed limits to improve traffic safety. Transp. Res. Part C Emerg. Technol. 2006, 14, 213–228. [Google Scholar] [CrossRef]
- Lee, C.; Abdel-Aty, M. Testing effects of warning messages and variable speed limits on driver behavior using driving simulator. Transp. Res. Rec. 2008, 2069, 55–64. [Google Scholar] [CrossRef]
- Hassan, H.M.; Abdel-Aty, M.A.; Choi, K.; Algadhi, S.A. Driver behavior and preferences for changeable message signs and variable speed limits in reduced visibility conditions. J. Intell. Transp. Syst. 2012, 16, 132–146. [Google Scholar] [CrossRef]
- Allaby, P.; Hellinga, B.; Bullock, M. Variable speed limits: Safety and operational impacts of a candidate control strategy for freeway applications. IEEE Trans. Intell. Transp. Syst. 2007, 8, 671–680. [Google Scholar] [CrossRef]
- Singh, S.; Maitra, S. Investigating the feasibility of dynamic speed limit on Indian highways. Case Stud. Transp. Policy 2024, 17, 101215. [Google Scholar] [CrossRef]
- El Esawey, M.; Sengupta, J.; Babineau, J.E.; Takyi, E. Safety evaluation of variable speed limit system in British Columbia. J. Transp. Saf. Secur. 2022, 14, 1776–1797. [Google Scholar] [CrossRef]
- Fudala, N.J.; Fontaine, M.D. Work Zone Variable Speed Limit Systems: Effectiveness and System Design Issues (No. FHWA/VTRC 10-R20); Virginia Transportation Research Council: Charlottesville, VA, USA, 2010. [Google Scholar]
- Daniels, S.; Martensen, H.; Schoeters, A.; Van den Berghe, W.; Papadimitriou, E.; Ziakopoulos, A.; Kaiser, S.; Breuss, E.A.; Soteropoulos, A.; Wijnen, W.; et al. A systematic cost-benefit analysis of 29 road safety measures. Accid. Anal. Prev. 2019, 133, 105292. [Google Scholar] [CrossRef]
- Donnell, E.T.; Porter, R.J.; Li, L.; Hamilton, I.; Himes, S.; Wood, J. Reducing Roadway Departure Crashes at Horizontal Curve Sections on Two-Lane Rural Highways (No. FHWA-SA-19-005); Federal Highway Administration. Office of Safety: Washington, DC, USA, 2019.
- Li, H.; Zhu, M.; Graham, D.J.; Zhang, Y. Are multiple speed cameras more effective than a single one? Causal analysis of the safety impacts of multiple speed cameras. Accid. Anal. Prev. 2020, 139, 105488. [Google Scholar] [CrossRef] [PubMed]
- Kalambay, P.; Pulugurtha, S.S. Data-driven exploration of traffic speed patterns to identify potential road links for variable speed limit sign implementation. Urban Plan. Transp. Res. 2024, 12, 2319711. [Google Scholar] [CrossRef]
- Li, D.; Fooladivanda, D.; Martínez, S. Data-driven variable speed limit design for highways via distributionally robust optimization. In Proceedings of the 2019 18th European Control Conference (ECC), Naples, Italy, 25–28 June 2019; pp. 1055–1061. [Google Scholar]
- Huang, Y.; Ma, X.; Ren, L. Train Trajectory-Following Control Method Using Virtual Sensors. Sensors 2024, 24, 5385. [Google Scholar] [CrossRef]


| Variable Name (Numeric) | Mean Value | Standard Deviation | Variable Name (Categorical) | Count | Percentage |
|---|---|---|---|---|---|
| ADT (veh/day) | 4258.32 | 3630.14 | Posted speed limit—0 (50 Km/h) | 50 | 48.5 |
| VLeg (%) | 92.18 | 5.97 | Posted speed limit—1 (60 Km/h) | 12 | 11.7 |
| L (km) | 10.27 | 8.56 | Posted speed limit—2 (70 Km/h) | 39 | 37.9 |
| VarSez (m) | 1.53 | 2.06 | Posted speed limit—3 (80 Km/h) | 2 | 1.9 |
| Rmax (m) | 721.62 | 385.92 | Intersection typology—0 (3-legged) | 53 | 51.5 |
| CCR (gon/km) | 38.25 | 37.88 | Intersection typology—1 (4-legged) | 39 | 37.9 |
| IntDensity (N int/km) | 1.07 | 0.98 | Intersection typology—2 (mixed) | 11 | 10.7 |
| Vm (km/h) | 74.72 | 9.93 | |||
| V85 (km/h) | 90.12 | 11.94 | |||
| SupL (%) | 77.75 | 20.55 | |||
| Days of rain | 2.07 | 1.70 | |||
| Amount of rain (mm) | 10.33 | 14.49 |
| Explanatory Variables | Coeff. Estimate | Std. Error | t-Value | p-Value |
|---|---|---|---|---|
| ADT | −3.927 × 10⁻⁴ | 2.750 × 10⁻⁴ | −1.428 | <0.001 |
| VLegg | −0.865 | 0.148 | −5.835 | <0.001 |
| SupL | 0.258 | 0.045 | 5.678 | <0.001 |
| mm | −0.110 | 0.065 | −1.713 | 0.043 |
| IntType1 | −5.276 | 1.892 | −2.789 | 0.006 |
| IntType2 | −4.564 | 3.260 | −1.40 | 0.104 |
| CCR | −0.064 | 0.024 | −2.680 | 0.008 |
| Likelihood ratio test (reference: null model): χ2(8) = 491.86, p < 0.001, R2 = 0.62 | ||||
| Ntot = Number of Crashes = Dependent Variable | ||||
| Explanatory Variables | Coeff. Estimate | Std. Error | z-value | p-value |
| (Intercept) | −2.916 | 1.020 | −2.858 | 0.004 |
| ADT | 1.192 × 10⁻⁴ | 1.344 × 10⁻⁵ | 8.868 | <0.001 |
| VLegg | 0.031 | 0.014 | 2.324 | 0.020 |
| Limit60 | 0.340 | 0.225 | 1.513 | 0.130 |
| Limit70 | 0.938 | 0.229 | 4.100 | <0.001 |
| Limit80 | 1.649 | 0.525 | 3.141 | 0.002 |
| L | 0.008 | 0.007 | 1.113 | 0.026 |
| Rmax | −5.041 × 10⁻⁵ | 1.413 × 10⁻⁵ | −3.567 | <0.001 |
| Dispersion parameter: 2.58, AIC = 1237.1; Likelihood ratio test (reference: null model): χ2(8) = 84.659, p < 0.001, R2 = 0.26 | ||||
| MultiVeic = number of multi-vehicle crashes = Dependent Variable | ||||
| Explanatory Variables | Coeff. Estimate | Std. Error | z-value | p-value |
| (Intercept) | −4.214 | 1.347 | −3.129 | 0.002 |
| ADT | 1.511 × 10⁻⁵ | 1.754 × 10⁻⁵ | 8.613 | <0.001 |
| VLegg | 0.017 | 0.010 | 1.748 | 0.008 |
| Limit60 | −0.012 | 0.280 | −0.042 | 0.097 |
| Limit70 | 0.390 | 0.206 | 1.888 | 0.005 |
| Limit80 | 0.260 | 0.596 | 0.436 | 0.007 |
| CCR | −0.004 | 0.002 | 1.688 | 0.009 |
| L | 0.003 | 0.010 | 0.320 | 0.047 |
| Dispersion parameter: 2.32, AIC = 886.0; Likelihood ratio test (reference: null model): χ2(8) = 295.49, p < 0.001, R2 = 0.27 | ||||
| SingleVeic = number of single-vehicle crashes = Dependent Variable | ||||
| Explanatory Variables | Coeff. Estimate | Std. Error | z-value | p-value |
| (Intercept) | −1.552 | 0.494 | −3.143 | 0.002 |
| ADT | 4.425 × 10⁻⁵ | 2.380 × 10⁻⁵ | 1.860 | 0.006 |
| Limit60 | 0.068 | 0.311 | 0.219 | 0.008 |
| Limit70 | 0.306 | 0.196 | 1.561 | 0.012 |
| Limit80 | 0.452 | 0.641 | 0.705 | 0.048 |
| CCR | −0.002 | 0.003 | −0.685 | 0.049 |
| L | 1.401 × 10⁻⁴ | 0.011 | 0.012 | 0.009 |
| mm_P | 4.414 × 10⁻⁴ | 7.178 × 10⁻⁴ | 0.615 | 0.050 |
| Dispersion parameter: 0.82, AIC = 831.3; Likelihood ratio test (reference: null model): χ2(8) = 308.43, p < 0.001, R2 = 0.23 | ||||
| Curve = number of crashes happening on curves = Dependent Variable | ||||
| Explanatory Variables | Coeff. Estimate | Std. Error | z-value | p-value |
| (Intercept) | −2.753 | 0.646 | −4.263 | <0.001 |
| ADT | 5.337 × 10⁻⁵ | 2.864 × 10⁵ | 1.863 | 0.036 |
| CCR | 0.007 | 0.002 | 2.812 | 0.005 |
| mm_P | 0.002 | 0.001 | 1.583 | 0.011 |
| Dispersion parameter = 0.63, AIC = 645.2; Likelihood ratio test (reference: null model): χ2(4) = 447.48, p < 0.001, R2 = 0.39 | ||||
| Rett = number of crashes on straight tangents = Dependent Variable | ||||
| Explanatory Variables | Coeff. Estimate | Std. Error | z-value | p-value |
| (Intercept) | 1.103 | 0.383 | −2.877 | 0.004 |
| ADT | 1.723 × 10⁻⁴ | 2.178 × 10⁻⁵ | 7.912 | <0.001 |
| Limit60 | −0.153 | 0.290 | −0.526 | 0.599 |
| Limit70 | 0.151 | 0.172 | 0.877 | 0.038 |
| Limit80 | 0.142 | 0.679 | 0.210 | 0.083 |
| IntTyp1 | −0.509 | 0.185 | −2.749 | 0.006 |
| IntTyp2 | −0.814 | 0.275 | −2.967 | 0.003 |
| mm_P | −5.449 × 10⁻⁴ | 5.837 × 10⁻⁴ | −0.934 | 0.035 |
| L | −0.021 | 0.012 | −1.899 | 0.052 |
| Dispersion parameter = 4.50, AIC = 788.77; Likelihood ratio test (reference: null model): χ2(9) = 70.336, p < 0.001, R2 = 0.37 | ||||
| Int = number of crashes happening at intersections = Dependent Variable | ||||
| Explanatory Variables | Coeff. Estimate | Std. Error | z-value | p-value |
| (Intercept) | −2.694 | 0.291 | −9.256 | <0.001 |
| ADT | 1.322 × 10⁻⁴ | 2.947 × 10⁻⁵ | 4.4484 | <0.001 |
| Limit60 | −0.715 | 0.477 | −1.497 | 0.013 |
| Limit70 | −0.087 | 0.254 | −0.346 | 0.730 |
| Limit80 | 0.520 | 0.642 | 0.809 | 0.042 |
| IntTyp1 | 0.566 | 0.270 | 2.094 | 0.036 |
| IntTyp2 | 0.511 | 0.373 | 1.368 | 0.017 |
| IntDensity | 0.066 | 0.116 | 0.565 | 0.051 |
| Dispersion parameter = 1.17, AIC = 509.67; Likelihood ratio test (reference: null model): χ2(8): 567.51, p < 0.001, R2 = 0.38 | ||||
| Ntot | MultiVeic | SingVeic | Curve | Rett | Int | |
|---|---|---|---|---|---|---|
| ADT (veh/day) | + | + | + | + | + | + |
| VLeg (%) | + | + | ||||
| Limit60 | - | - | - | |||
| Limit70 | + | + | + | + | ||
| Limit80 | + | + | + | + | + | |
| L (km) | + | + | + | - | ||
| Rmax (m) | - | |||||
| CCR | - | - | + | |||
| Amount of rain (mm) | + | + | - | |||
| IntType1 | - | + | ||||
| IntType2 | - | + | ||||
| IntDensity (N int/km) | + |
Disclaimer/Publisher’s Note: The statements, opinions and data contained in all publications are solely those of the individual author(s) and contributor(s) and not of MDPI and/or the editor(s). MDPI and/or the editor(s) disclaim responsibility for any injury to people or property resulting from any ideas, methods, instructions or products referred to in the content. |
© 2025 by the authors. Licensee MDPI, Basel, Switzerland. This article is an open access article distributed under the terms and conditions of the Creative Commons Attribution (CC BY) license (https://creativecommons.org/licenses/by/4.0/).
Share and Cite
Coropulis, S.; Intini, P.; Introcaso, N.; Ranieri, V. Credible Variable Speed Limits for Improving Road Safety: A Case Study Based on Italian Two-Lane Rural Roads. Sustainability 2025, 17, 4833. https://doi.org/10.3390/su17114833
Coropulis S, Intini P, Introcaso N, Ranieri V. Credible Variable Speed Limits for Improving Road Safety: A Case Study Based on Italian Two-Lane Rural Roads. Sustainability. 2025; 17(11):4833. https://doi.org/10.3390/su17114833
Chicago/Turabian StyleCoropulis, Stefano, Paolo Intini, Nicola Introcaso, and Vittorio Ranieri. 2025. "Credible Variable Speed Limits for Improving Road Safety: A Case Study Based on Italian Two-Lane Rural Roads" Sustainability 17, no. 11: 4833. https://doi.org/10.3390/su17114833
APA StyleCoropulis, S., Intini, P., Introcaso, N., & Ranieri, V. (2025). Credible Variable Speed Limits for Improving Road Safety: A Case Study Based on Italian Two-Lane Rural Roads. Sustainability, 17(11), 4833. https://doi.org/10.3390/su17114833