Abstract
Water resources are vital for sustainable development in arid regions, where glacial runoff plays a significant role in maintaining water supply. This study quantitatively assesses the sustainability of water resources in the Manas River Basin (MnsRB) and the Muzati River Basin (MztRB), situated on the northern and southern slopes of the Tianshan Mountains, respectively, over the period from 1991 to 2050. Freshwater availability was simulated and projected using the Variable Infiltration Capacity Chinese Academy of Sciences (VIC-CAS) hydrological model. Furthermore, three development modes—traditional development, economic growth, and water-saving—were established to estimate future water consumption. The levels of water stress were also applied to assess water resources sustainability in the MnsRB and MztRB. Results indicate that from 1991 to 2020, the average annual available freshwater resources were 13.94 × 10⁸ m3 in the MnsRB and 14.27 × 10⁸ m3 in the MztRB, with glacial runoff contributing 20.24% and 65.58%, respectively. Under the SSP5-8.5 scenario, available freshwater resources are projected to decline by 10.94% in the MnsRB and 4.37% in the MztRB by 2050. Total water withdrawal has increased significantly over the past 30 years, with agriculture water demand accounting for over 80%. The levels of water stress during this period were 1.14 for the MnsRB and 0.87 for the MztRB. Glacial runoff significantly mitigates water stress in both basins, with average reductions of 21.16% and 69.84% between 1991 and 2050. Consequently, clear policies, regulations, and incentives focused on water conservation are vital for effectively tackling the increasing challenge of water scarcity in glacier-covered arid regions.
1. Introduction
Climate change has severely impacted water security, hindering socioeconomic development and destabilizing ecosystems, making it a critical global challenge [1]. Since the 1950s, approximately 700 million people have endured prolonged droughts, and between 16% and 39% of urban areas experienced surface water shortages from 1971 to 2000 [2]. A quarter of the global population experiences “extremely high” water resource pressure [3]. Research indicates that by 2030, 40% of countries will encounter challenges related to water resources, threatening 4.8 billion people with water security problems and between 2 billion and 4 billion with water shortages [4,5].
The current global demand for water by the domestic, industrial, and agricultural sectors is approximately 4600 km3 per year, and this demand is expected to increase by 20% to 30% by 2050 [6]. In the context of global warming and rapid population growth, the escalating demand for water from human activities is poised to impact water security significantly. This rising demand increasingly exacerbates the imbalance between water supply and demand [6]. Research indicates that the 10% of watersheds under the greatest pressure from water shortages are responsible for producing 35% of the world’s food [7].
Global warming has significantly impacted the cryosphere, accelerating glacial melting and retreat [8,9,10,11]. Projections with medium confidence indicate that by 2100, one-third of the annual runoff in 56 major glacial basins worldwide will decrease by more than 10% [12]. The influence of glacial meltwater on runoff is markedly more significant in arid regions than in humid areas [13]. Rising temperatures and shifts in precipitation patterns have intensified water resource challenges, particularly in arid areas, making these challenges a critical factor that limits sustainable development in these areas [14,15,16]. As water availability continues to decline, competition for these limited resources is anticipated to escalate. Consequently, there is an urgent need for the implementation of effective adaptation and mitigation strategies to address these cascading effects [17].
In 2015, the United Nations General Assembly formally introduced 17 Sustainable Development Goals (SDGs), with Goal 6 highlighting the critical need for “providing water and sanitation for all and implementing sustainable management” [18]. The Food and Agriculture Organization (FAO) of the United Nations and the Water Resources Organization (UN-Water) have published a progress report on water stress, utilizing the SDG 6.4.2 indicator, which measures the levels of water stress (LWS) and outlines its accounting methodology [19]. Nevertheless, the current LWS framework and its assessment primarily concentrate on arid regions devoid of glacier cover, with existing case studies mainly limited to the national scale [20,21]. Notably, there is a paucity of assessments conducted at the watershed scale in glacier-covered arid areas [17].
The Tianshan Mountains, often designated as the “Water Tower of Central Asia”, are distinguished by their extensive and well-developed modern glacial systems [22,23]. The abundant glaciers and snow accumulation in these mountainous regions are vital for ensuring water resources that support socioeconomic development, maintain oasis agriculture production, and protect ecological stability in the arid areas of Central Asia [24]. Current research on water resource assessment primarily focuses on forecasting water supply and demand [25,26,27] and evaluating water resource security [28,29]. Despite the existing knowledge, a significant gap remains in the analysis of watershed-scale water stress in glaciated arid regions. It is crucial to establish specific guidance for policy formulation and practical implementation in these glacier-covered areas. Furthermore, we bridge the gap by connecting the assessment of water supply, demand, and sustainability to carry out integrated watershed-scale research.
Consequently, we have selected the MnsRB and the MztRB as representative watersheds for this study. These two basins exhibit significant differences in glacier coverage, climatic conditions, and socioeconomic development, making them particularly suitable for comparative analysis. This selection allows us to investigate the contrasting characteristics and water resource challenges faced by these watersheds, thereby providing valuable insights into the broader issues of water resource management in glacier-covered arid regions.
The Variable Infiltration Capacity Chinese Academy of Sciences (VIC-CAS) hydrological model is employed to simulate and estimate the availability of water resources within the two basins under investigation. Three distinct water usage scenario modes are established by integrating water consumption data with socioeconomic statistics to analyze future water demand. In alignment with the SDG 6.4 indicator, the LWS index is utilized to evaluate the sustainability of water resources in these basins. Furthermore, a quantitative assessment of the mitigating effects of glacial water resources on water stress levels is conducted. The findings of this study aim to provide scientific guidance for the effective management of water resources of the river basins in the Tianshan Mountains.
2. Setting and Methods
2.1. Study Area
The MnsRB is situated in the remote regions of the Eurasian continent, spanning the coordinates of 84°42′–86°35′ E and 43°22′–45°20′ N. The terrain slopes gradually from the southeast to northwest. With an average annual runoff of 12.9 × 10⁸ m3, the basin covers an area of approximately 2.7 × 10⁴ km2 [30]. The MnsRB experiences a typical temperate continental arid climate characterized by predominant precipitation on plains adjacent to mountainous regions, with an annual precipitation of 110–200 mm. Most of the annual precipitation occurs between April and August, accounting for approximately 70% of the yearly average precipitation [31]. Further, annual evaporation ranges between 1500 and 2000 mm. The elevation within the MnsRB varies between 846 and 5138 m. Additionally, areas above 3600 m, accounting for approximately 12% of the basin area, are perpetually covered with snow and glaciers. Meltwater from glaciers and snow provides 35% of river runoff (Figure 1).
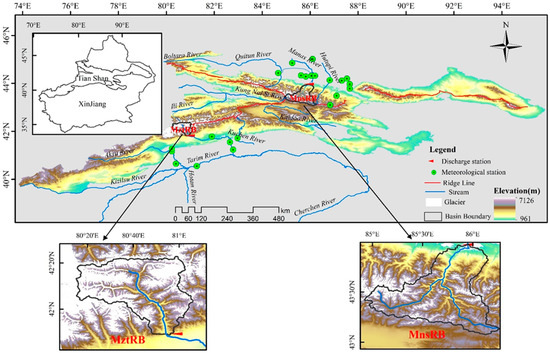
Figure 1.
The location of the study area.
At the end of 2020, the total population of the MnsRB was approximately 1.01 million, and the regional GDP was 70.57 billion CNY. Further, the value added by primary, secondary, and tertiary industries was 16.22 billion CNY, 24.17 billion CNY, and 30.18 billion CNY, respectively, with the three industrial sectors accounting for 23.0%, 34.2%, and 42.8% of the economy, respectively. The agricultural sector dominates the economic development in the basin, and the sown area of significant crops is 320,100 ha.
The MztRB lies deep within the heart of the Eurasian continent and experiences a continental monsoon climate, characterized by four distinct seasons with significant temperature differences between day and night. The average annual temperature is 7.0 °C. The MztRB exhibits a distinct vertical gradient in precipitation, which is concentrated in the high mountainous areas. The annual precipitation distribution is uneven, being mainly concentrated from May to September. The Muzati River, with a length of 282 km and an altitude ranging from 1884 to 6779 m, is the largest of the five headwaters of the Weigan River. The MztRB has a catchment area of 2845 km2 above the Po Cheng Zi hydrological station. There are 243 glaciers distributed in the MztRB, with a total glacier area of 1.28 × 10³ km2 [32]. The average annual runoff of the Muzati River is 14.52 × 10⁸ m3, accounting for approximately half of the total runoff of the Weigan River. The runoff of the Muzati River is unevenly distributed throughout the year, with a significant concentration during the summer months (June to August), constituting 69.6% of the annual runoff and mainly comprising glacier meltwater.
At the end of 2020, the total population in the MztRB was 589,700, and the regional GDP was 26.41 billion CNY. The added values of the primary, secondary, and tertiary industries were 5.35 billion CNY, 11.38 billion CNY, and 9.67 billion CNY, respectively. The proportions of the three industrial sectors were 20.27:43.12:36.61. The main crop sown area was 223,400 ha, while the livestock population was 1.8 million.
2.2. The Available Freshwater Resources
Generally, the available freshwater resources of a socioeconomic system include directly accessible surface and groundwater resources. In arid and semi-arid regions, precipitation is minimal, and recharge to groundwater is limited; hence, the sustainable availability of groundwater is restricted. The long-term and extensive groundwater extraction in arid regions has led to an unsustainable or almost unsustainable state for regional water resources [17]. Due to limited groundwater extraction in the MnsRB and MztRB, we did not consider it an available freshwater resource.
Most surface water resources in the MnsRB and MztRB originate from mountainous upstream areas. While the water resources in the mid- and downstream regions are essential for sustaining natural vegetation, they are limited because annual evaporation significantly exceeds yearly precipitation. Consequently, this study does not consider the surface water resources generated in the mid and downstream areas of the two basins as available resources. Furthermore, to ensure the stability of the natural ecosystem and support human development in these basins, we deduct the ecological water requirements when evaluating surface water resources.
2.3. Runoff Simulation
An updated hydrological model, VIC-CAS, which couples the glacier module, has been successfully utilized in the northwestern arid region of China [32,33]. The input parameters and model data consist of meteorological forcing data, climate model data, primary and secondary glacier inventory data, soil and vegetation data, topographic elevation data, and monthly runoff observation data. Detailed information is provided in Table 1.

Table 1.
Input data and sources required for the VIC-CAS model.
This study utilizes five Earth system models representing the following three shared socioeconomic pathways (SSPs): SSP1-2.6, SSP2-4.5, and SSP5-8.5. These models are used to project the effects of future climate change on hydrological processes (Table 2). To downscale the five selected global climate models (GCMs), we adopt quantile delta mapping, an extensively applied method in prior research [34,35]. The baseline period spans from 1971 to 2013, while the daily future climate data extend from 2014 to 2100.
Table 2.
List of CMIP6 models utilized in this research.
The simulation efficiency of the model is systematically assessed through four evaluation metrics, namely the Nash–Sutcliffe efficiency coefficient (NS), the square of correlation coefficient (R2), the relative bias (Er), and root mean square error (RMSE). The results for MnsRB indicate that the simulations performed well, achieving a high NS and R2 of over 0.90 each, a low Er of less than 3%, and a RMSE of 13.42 m3/s for monthly runoff. Similarly, MztRB yielded satisfactory results, with NS and R2 both exceeding 0.95, an Er of less than 1.4% [36], and a RMSE of 10.85 m3/s for monthly runoff.
2.4. Water Consumption in the Socioeconomic System
2.4.1. Agricultural Water
Agricultural water demand (AWD) includes irrigation water for crops and water for livestock. The quota method is employed to calculate the irrigation quota for different types of crops. Simultaneously, the water allocation for crops and livestock follow the Xinjiang Agricultural Irrigation Water Quota and the Xinjiang Industrial and Domestic Water Quota. The formula for calculating irrigation water is as follows:
where Wa is the irrigation water consumption, mi is the irrigated area of classified crops, is the irrigation quota of classified crops, ηi is the irrigation efficiency, and i is the crop type index.
The formula for calculating livestock water consumption is as follows:
where Wl represents livestock water consumption, Li denotes the number of large or small livestock, and Qi represents the water quota allocated to each livestock.
2.4.2. Industrial Water
Industrial water demand (IWD) is calculated based on the water consumption per 10,000 CNY of industrial output value, as follows:
where Wi is annual industrial water consumption, Xi is the annual industrial added value, and Qi is the water consumption per 10,000 CNY of added value, sourced from the Xinjiang Water Resources Bulletin and relevant basin county reports.
2.4.3. Domestic Water
Domestic water demand (DWD), covering both urban and rural residents, is calculated as follows:
where Wd is annual domestic water consumption, Ri is the urban or rural population, and Qi is the water quota for urban or rural residents.
2.4.4. Ecological Water
Ecological water demand (EWD) varies by interpretation [37,38,39] but is defined in this study as the water required for river ecosystems and artificial vegetation, following the definition by Wang and Cheng (2002) [40] for arid inland river basins.
EWD for river ecosystems, or ecological baseflow, can be calculated using methods like the Tennant method [41,42], 7Q10 method [43], or average monthly flow during the driest month [44]. This study employs the Tennant method, which considers 10% of annual runoff as the ecological water requirement.
EWD for artificial vegetation is calculated using the area quota method, with water quotas derived from the Xinjiang Agricultural Water Quota:
where We is the EWD for artificial vegetation, mi is the area of classified artificial vegetation, and is the water consumption quota.
2.4.5. Estimation of Future Water Requirements
In the middle and lower reaches of the basins, annual precipitation is below 200 mm, with minimal runoff. Oasis agriculture exemplifies dry irrigation practices, making it the primary water consumer in these regions. Therefore, selecting an appropriate development mode is crucial for water conservation. This study proposes the following three scenarios for future water demand: the traditional development mode, the economic growth mode, and the water-saving mode.
- (1)
- Traditional Development Mode
This scenario estimates future water demand based on current socioeconomic conditions. Given that agricultural water consumption comprises approximately 80% of total water use in the two river basins, and acknowledging existing water shortages, it maintains current irrigated areas. Data on irrigated areas are based on 2020 figures, while population and industrial statistics are drawn from different SSPs grid data.
A 30-year water use target is informed by policy documents, such as the “Outline for Agricultural Development and Water Conservation in Xinjiang Uygur Autonomous Region” and the “Water Security Assurance Plan for Xinjiang Uygur Autonomous Region during the 14th Five-Year Plan”, which is detailed in Table 3.
Table 3.
Future water usage targets in the MnsRB and MztRB under the traditional development mode.
- (2)
- Economic Growth Mode
This scenario optimizes the traditional development mode with a focus on regional economic growth. It assumes that water resources will predominantly support economic development, projecting a 20% increase in sown crop area compared to the traditional development mode, while maintaining consistent water demand indicators (Table 4).
Table 4.
Set of water demands under the economic growth mode scenario.
- (3)
- Water-Saving Mode
This scenario seeks to enhance the traditional development mode with an emphasis on conservation and efficient water use. It aims to reduce per capita domestic water consumption and water usage per 10,000 CNY of industrial output by 10% relative to the traditional development mode [45]. The growth rates for irrigated crop area and ecological water requirements remain consistent with those in the traditional development mode (Table 5).
Table 5.
Water demand under the water-saving mode scenario.
2.5. Sources and Preprocessing of Socioeconomic Data
The socioeconomic data utilized in this study comprise current statistics, population figures, and GDP estimates across various future shared socioeconomic pathways (SSPs). Current statistics include urban and rural populations, the added value of primary, secondary, and tertiary industries, cultivated area for crops and livestock, and the extent of artificial forests.
To improve data accuracy and availability, watershed boundaries are overlaid with county-level administrative boundaries, allowing for the identification of administrative areas within each watershed. Factors such as settlement area and distribution are considered using county- and township-level administrative statistics to derive precise socioeconomic data at the watershed scale. County-level socioeconomic statistics are sourced from multiple yearbooks covering 1991 to 2020, including the China County Statistical Yearbook, Xinjiang Statistical Yearbook, Xinjiang Construction Corps Statistical Yearbook, Changji Hui Autonomous Prefecture Statistical Yearbook, and Aksu Prefecture Statistical Yearbook. The agricultural water consumption quota is obtained from the Xinjiang Agricultural Irrigation Water Consumption Quota, while the domestic water consumption quota comes from the Xinjiang Industrial and Domestic Water Consumption Quota. Additionally, water consumption per 10,000 CNY of industrial added value is calculated based on data from Changji Prefecture and Aksu, as reported in the Xinjiang Water Resources Bulletin from 2001 to 2020.
SSPs are scenario frameworks developed by the Intergovernmental Panel on Cli-mate Change to facilitate comprehensive analyses of climate change impacts and adaptation strategies [46,47]. Key elements within the SSP scenarios include population and economic data. In this study, we utilize population projection data from the dataset titled “Provincial and Gridded Population Projections for China under SSPs from 2010 to 2100”, produced by Professor Wang Can’s research team at the School of Environment, Tsinghua University [48]. This dataset features a spatial resolution of 1 km × 1 km and has been widely used in various studies [4,49]. For GDP estimation, we rely on output value grid estimation data for primary, secondary, and tertiary industries generated by Professor Jiang Tong’s research team at Nanjing University of Information Science and Technology [50,51], with a spatial resolution of 5 km × 5 km.
This study employs three emission scenarios, SSP1, SSP2, and SSP5, with estimated time series data ranging from 2021 to 2050. The preprocessing of population and GDP projection data involves the following two main steps: first, the annual estimated data are clipped in ArcGIS according to basin boundaries for the three scenarios; second, ArcGIS statistical tools, in conjunction with Excel, are used to calculate annual population and secondary industry value projections at the basin scale.
2.6. Evaluation of Water Sustainability
According to the United Nations 2030 SDGs and relevant studies by the FAO, the level of water stress (LWS) is used to characterize regional water resource development and utilization, reflecting carrying capacity and overload levels. The formula for calculating water stress is outlined as follows:
where S denotes the freshwater resource, and D represents freshwater withdrawal. LWS is classified into the following five grades: <10% indicates low stress, 10–20% suggests a low-to-medium stress, 20–40% suggests a medium-to-high stress, 40–80% suggests a high stress, and >80% suggests an extremely high stress.
In this study, freshwater withdrawal specifically refers to water consumption within the socioeconomic system, considering the ecological water requirements needed to sustain natural ecosystems. Therefore, the formula can be reformulated as follows [17]:
where Ds represents the water consumption of the socioeconomic system, R refers to total runoff of the upper watershed, E represents ecological water requirement, LWSg refers to the LWS when glacial runoff is excluded, and Rg represents glacial runoff.
3. Results
3.1. Interannual Variations in Available Freshwater Resources
Over the past two decades, the available freshwater resources in the MnsRB on the northern slope of the Tianshan Mountains have shown an increasing trend (Figure 2a), with an annual average of 13.94 × 10⁸ m3.
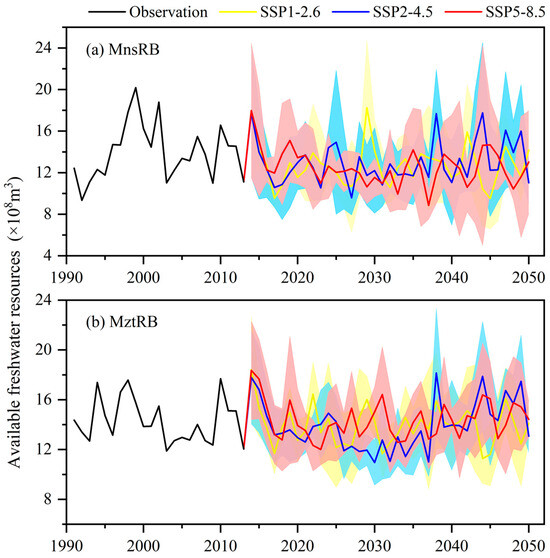
Figure 2.
Interannual variations in available freshwater resources in MnsRB and MztRB under SSP1-2.6, SSP2-4.5, and SSP5-8.5.
The maximum and minimum recorded values were in 1999 and 1992, reaching 20.18 × 10⁸ m3 and 9.33 × 10⁸ m3, respectively. The increase rate of available freshwater resources in the basin is 0.45 × 10⁸ m3/10a. Conversely, the available freshwater resources in the MztRB on the southern slope of the Tianshan Mountains have shown a decreasing trend (Figure 2b), with a rate decline of −0.48 × 10⁸ m3/10a, and its average annual available freshwater resources are 14.27 × 10⁸ m3. The maximum and minimum values occurred in 2010 and 2003, with available freshwater resources of 17.69 × 10⁸ m3 and 11.88 × 10⁸ m3, respectively.
Under the three SSPs, the available freshwater resources in the MnsRB and MztRB are projected to decrease before the middle of the 21st century (Figure 2). From 2014 to 2050, the MnsRB is expected to show a clear downward trend in available freshwater resources. The annual average of these resources in the basin is predicted to range from 12.55 × 10⁸ m3 to 12.98 × 10⁸ m3 (Figure 2a). Regarding interdecadal variations, the available freshwater resources in the MnsRB are expected to peak in the 2010s and reach their lowest point in the 2030s. Compared to the 2010s, the freshwater resources in the basin will decrease by 2.39% under SSP1-2.6 and 10.94% under SSP5-8.5 in the 2040s.
Similarly, the available freshwater resources in the MztRB are projected to decline until 2050 (Figure 2b), with an annual average ranging from 13.92 × 10⁸ m3 to 14.36 × 10⁸ m3. The interdecadal variations in this basin indicate a fluctuating trend. By the 2040s, the available freshwater resources in the MztRB will decrease from levels in the 2010s by 3.84% under SSP1-2.6 and 4.37% under SSP5-8.5.
In summary, while the available freshwater resources in the MnsRB have shown an increasing trend over the past 20 years, those in the MztRB have shown a decreasing trend. Across the different SSPs, the available freshwater resources in both basins are projected to decline by varying percentages until 2050. Given the high glacier coverage in the MnsRB and MztRB, rising temperatures and the continuous retreat of glaciers will likely lead to a decrease in available freshwater resources in these river basins over the coming decades. Additionally, the oasis systems located in the middle and lower reaches of these rivers may face potential risks of water shortages.
3.2. Current Variations in Water Withdrawal
Total water withdrawal (TWW) is composed of agricultural water demand (AWD), industrial water demand (IWD), domestic water demand (DWD), and ecological water demand (EWD). From 1991 to 2020, the TWW in the MnsRB exhibited a distinct upward trend (Figure 3e), with an average value of 15.46 × 10⁸ m3.
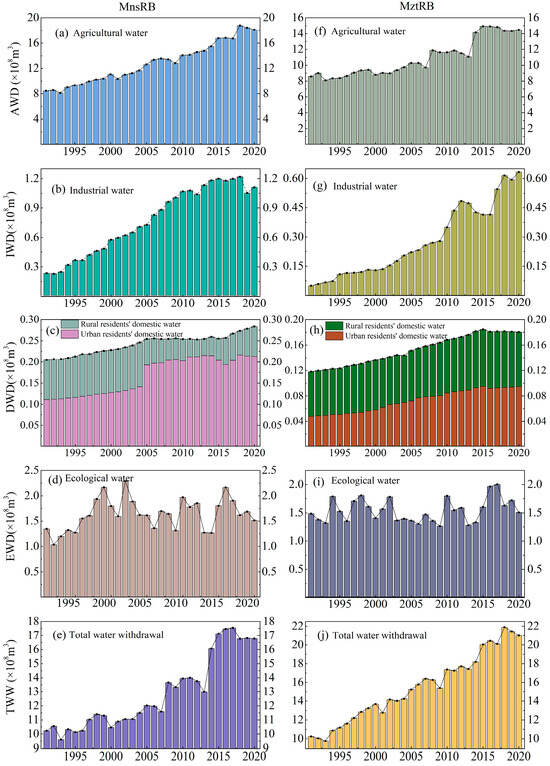
Figure 3.
Current variations in water withdrawal in MnsRB and MztRB from 1991 to 2020.
An analysis of water demand in the basin reveals distinct trends over 30 years. Agricultural water demand (AWD) has a significant upward trend (Figure 3a) accounting for the highest proportion of TWW, increasing from 82.5% in 1991 to 86.1% in 2020, with an average proportion of 82.6%.
Industrial water demand (IWD) gradually increased from 1991 to 1999 (Figure 3b), mainly due to the predominance of agriculture in the region. However, starting in 2000, IWD increased substantially, rising from 0.58 × 10⁸ m3 in 2000 to 1.10 × 10⁸ m3 in 2020, peaking at 1.22 × 10⁸ m3 in 2018. Domestic water demand (DWD) also exhibited an increasing trend, growing from 0.22 × 10⁸ m3 in the 1990s to 0.26 × 10⁸ m3 in the 2010s. This outcome represents an 18.2% increase compared to 1990s levels (Figure 3c). Notably, DWD for urban residents increased more rapidly than that for rural residents, with rises of 41.7% and 75.0% in the 2000s and 2010s, respectively, compared to 1990s levels. This trend can be mainly attributed to a significant increase in the urban population around 2005, which led to a faster rise in domestic water consumption in urban areas. Moreover, from 1991 to 2020, the environmental water demand (EWD) in the MnsRB displayed a fluctuating trend (Figure 3d). EWD ranged from 1.04 × 10⁸ m3 to 2.29 × 10⁸ m3. The EWD for artificial vegetation also increased from 0.11 × 10⁸ m3 to 0.17 × 10⁸ m3.
From 1991 to 2020, the TWW in MztRB exhibited a distinct upward trend (Figure 3j), increasing from 10.23 × 10⁸ m3 in 1991 to 16.78 × 10⁸ m3 in 2020, with an annual average of 12.85 × 10⁸ m3. The proportion of AWD in TWW rose from 83.8% in 1991 to 86.2% in 2020, with an average of 84.5%. IWD increased from 0.05 × 10⁸ m3 in 1991 to 0.63 × 10⁸ m3 in 2020 (Figure 3g). Compared to 1991, IWD rose by 2.5 times in 2000, 7.0 times in 2010, and 12.6 times in 2020. The DWD of the basin increased from 0.12 × 10⁸ m3 in 1991 to 0.18 × 10⁸ m3 in 2020, an increase of 1.5 times (Figure 3h). In particular, the DWD for urban residents showed a significant increase, going from 0.05 × 10⁸ m3 in 1991 to 0.10 × 10⁸ m3 in 2020. Over the past 30 years, the EWD of the basin has ranged from 1.26 × 10⁸ m3 to 2.0 × 10⁸ m3 (Figure 3i). Additionally, the EWD for artificial vegetation has increased substantially, rising from 0.05 × 10⁸ m3 in 1991 to 0.23 × 10⁸ m3 in 2020.
3.3. Future Variations in Water Withdrawal
Over the next 30 years, the TWW in the MnsRB is projected to decline under different scenarios (Figure 4). From 2021 to 2050, the TWW in the basin is expected to decrease by 16.41% under the traditional development mode, 2.08% under the economic growth mode, and 15.76% under the water-saving mode under the SSP1-2.6 scenario (Figure 4a). Under the SSP2-4.5 and SSP5-8.5 scenarios, the TWW in the basin will reduce by 19.23% (SSP2-4.5) and 15.40% (SSP5-8.5) by 2050 in the traditional development mode. The reductions will be 5.01% (SSP2-4.5) and 1.22% (SSP5-8.5) in the economic growth mode and 19.08% (SSP2-4.5) and 14.78% (SSP5-8.5) in the water-saving mode (Figure 4b,c).
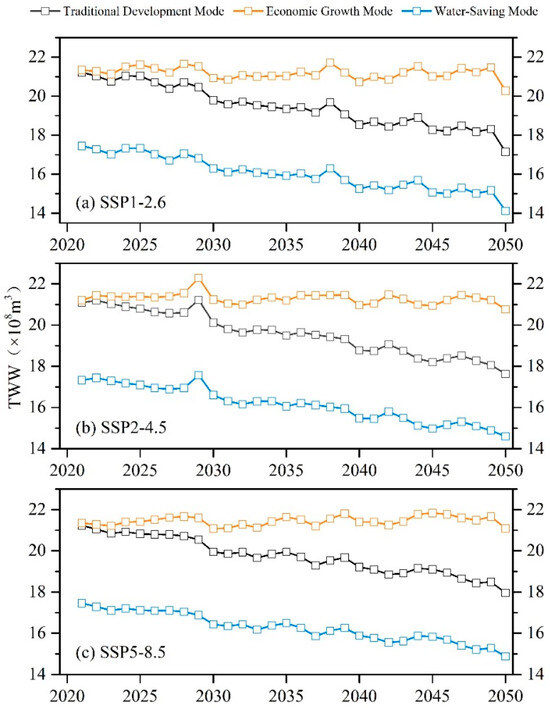
Figure 4.
Variation in TWW in MnsRB from 2021 to 2050.
From 2021 to 2050, the TWW in the MztRB is projected to decline to varying degrees under the three development modes, traditional development, economic growth, and water-saving. Under the SSP1-2.6 scenario, by 2050, the TWW in the basin is projected to decrease by 15.52%, 2.19%, and 19.06% under these three modes, respectively (Figure 5a). Under the SSP2-4.5 scenario, TWW is expected to decrease by 19.55%, 5.53%, and 19.70%, respectively, in the same modes (Figure 5b). Finally, under the SSP5-8.5 scenario, by 2050, the decreases in TWW will be 17.30%, 3.43%, and 17.49%, respectively, across the three modes (Figure 5c).
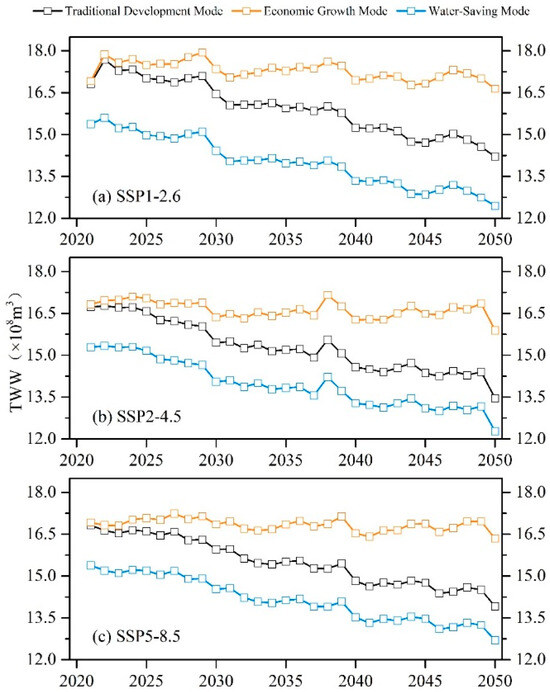
Figure 5.
Variation in TWW in MztRB from 2021 to 2050.
Overall, from 2021 to 2050, the TWW in the two river basins will vary under the different SSPs. The water-saving mode has the lowest water consumption, followed by the traditional development mode. The economic growth mode will have the highest water consumption. Because available freshwater resources remain constant, implementing water conservation practices, restructuring industries, and improving water resource utilization efficiency can effectively mitigate water shortage challenges in these two river basins. However, given that the economic structure of the oases is primarily focused on agriculture, agricultural activities will continue to be the primary consumers of water resources in the river basin regardless of the development mode adopted.
3.4. Variations in Water Stress Levels
3.4.1. Water Stress Levels in the MnsRB
Water stress in the MnsRB has shown a significant increasing trend from 1991 to 2020, with the LWS rising from 0.80 in 1991 to 1.94 in 2020 (Figure 6). Glacier runoff played a significant role in alleviating water stress in this basin, reducing it by an average of 23.08% over the same period. This effect was particularly notable during years of high water consumption; for instance, in 2017 and 2018, the reductions were 37.30% and 35.48%, respectively.
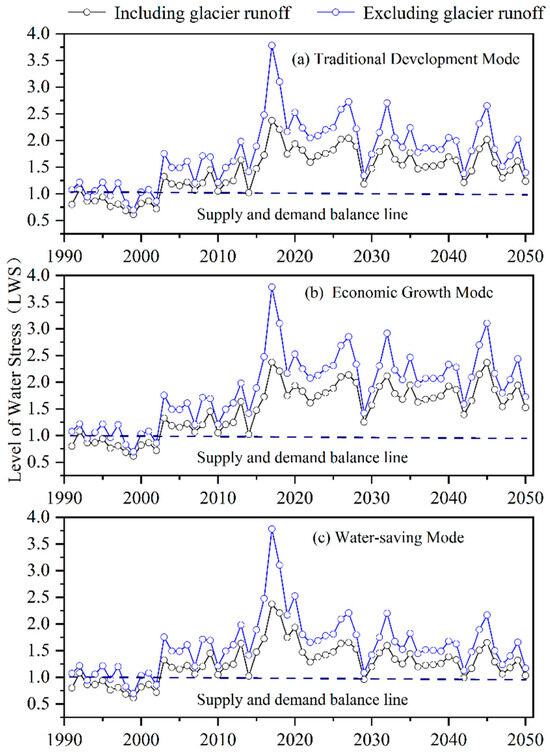
Figure 6.
Variation in LWS in MnsRB from 1991 to 2050 under SSP1-2.6 scenario.
Under the SSP1-2.6 scenario, water stress in the MnsRB is projected to follow a pattern of initial increase followed by a subsequent decrease from 2021 to 2050. This trend occurs across the traditional development, economic growth, and water-saving modes (Figure 6). The LWS values in the basin peak in 2027 reach 2.04, 2.14, and 1.65 for each respective mode. After this peak, the LWS will exhibit a downward trend, decreasing to 1.24, 1.52, and 1.03 by 2050 in the corresponding modes. Notably, under the water-saving mode, the average LWS in the MnsRB is expected to decline considerably over the next three decades, with LWS values averaging 1.40, 1.34, and 1.25 for the 2020s, 2030s, and 2040s, respectively (Figure 6c). The influence of glacial runoff is anticipated to reduce water stress in the basin by 19.16%, 19.62%, and 21.57% in the 2020s, 2030s, and 2040s, respectively, under the traditional development mode. Additionally, under the economic growth and water-saving modes, reductions are projected at 19.37% (19.08%), 19.56% (19.28%), and 17.81% (18.30%) during the respective decades (Figure 6).
Similarly, under the SSP2-4.5 scenario, water stress in the basin will follow an increasing trend followed by a decline (Figure 7). In the economic growth mode, the LWS is expected to rise from 1.63 in 2021 to a peak of 2.38 in 2027, then decline to 1.95 by 2050 (Figure 7b). The mean LWS values for the basin are projected to be 1.83, 1.81, and 1.62 for the 2020s, 2030s, and 2040s, respectively. A peak LWS of 1.84 will be reached in 2027 before declining, leading to mean values of 1.43, 1.33, and 1.12 for the 2020s, 2030s, and 2040s, respectively, under the water-saving mode (Figure 7c). The LWS of the basin under the traditional mode lies between that of the economic growth mode and the water-saving mode. Throughout the 2020s, 2030s, and 2040s, it is projected that water stress in the MnsRB will reduce by 20.63%, 18.00%, and 16.97%, respectively, due to glacial runoff mitigation. In comparison, reductions under the economic growth and water-saving modes are expected to be 20.78% and 20.99%, 18.55% and 18.40%, and 16.92% and 17.04%, respectively (Figure 7).
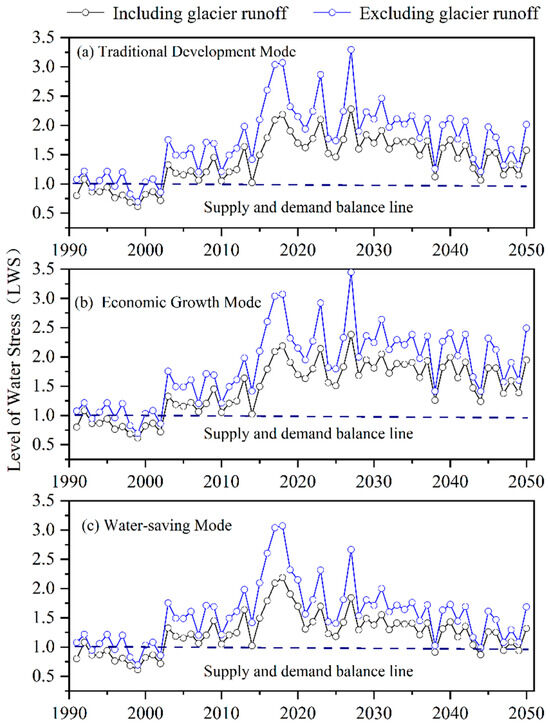
Figure 7.
Variation in LWS in MnsRB from 1991 to 2050 under SSP2-4.5 scenario.
Under the SSP5-8.5 scenario, the LWS shows an increasing trend followed by a decreasing trend (Figure 8), with its peak occurring in 2037. In the traditional development mode, the LWS will rise from 1.31 in 2021 to a maximum of 1.90 in 2037 before declining to 1.16 by 2050. The average LWS values during the 2020s, 2030s, and 2040s are 1.48, 1.43, and 1.30, respectively (Figure 8a). In the economic growth mode, the LWS will increase from 1.64 in 2021 to 2.59 in 2037, then decrease to 1.70 in 2050. The average LWS values for the 2020s, 2030s, and 2040s are 1.89, 1.93, and 1.85, respectively (Figure 8b). In the water-saving mode, the LWS will rise from 1.31 in 2021 to 1.88 in 2037, followed by a decline to 1.12 in 2050. The average LWS values during the 2020s, 2030s, and 2040s are 1.47, 1.42, and 1.28, respectively (Figure 8c). The impact of glacier runoff will significantly reduce water stress in the basin, with decreases of 73.17%, 69.95%, and 73.73% during the 2020s, 2030s, and 2040s, respectively, under the traditional development mode. In contrast, reductions of 21.98%, 20.25%, and 17.41% are expected under the economic growth mode, and reductions of 21.81%, 20.22%, and 17.42% under the water-saving mode (Figure 8).
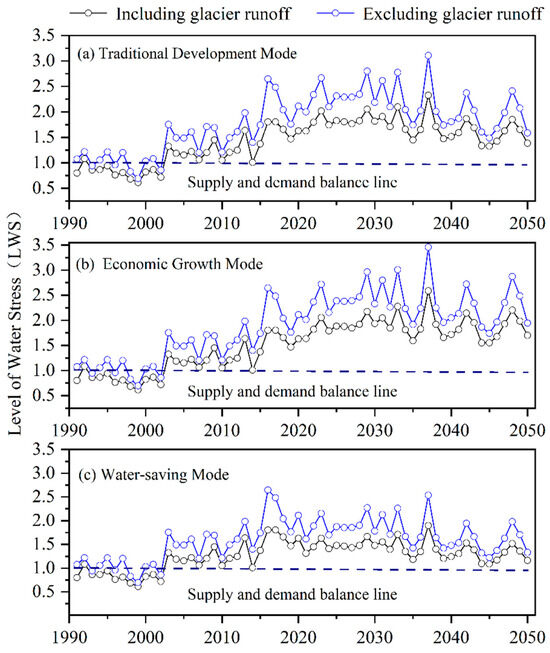
Figure 8.
Variation in LWS in MnsRB from 1991 to 2050 under SSP5-8.5 scenario.
3.4.2. Water Stress Levels in the MztRB
The level of water stress shows an increasing trend from 1991 to 2020, with LWS increasing from 0.68 in 1991 to 1.36 in 2020 (Figure 9). Glacier runoff has significantly mitigated water stress in the MztRB, contributing to an average reduction of 70.63% from 1991 to 2020. This effect is particularly notable during years of intensive water consumption, such as from 2016 to 2018, when water stress reduced by 75.70%, 77.27%, and 77.33%, respectively.
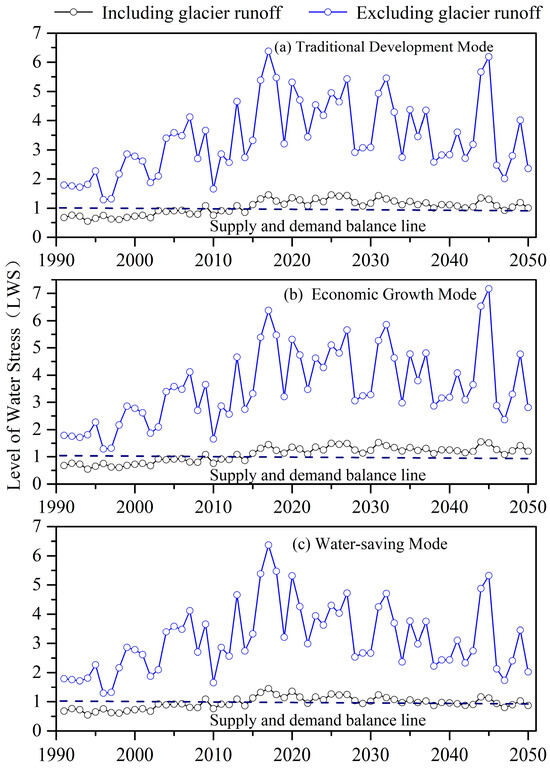
Figure 9.
Variation in LWS in MztRB from 1991 to 2050 under SSP1-2.6 scenario.
The LWS in the MztRB under the SSP1-2.6, SSP2-4.5, and SSP5-8.5 scenarios is illustrated in Figure 9, Figure 10 and Figure 11. Including glacial runoff, the LWS for the basin under the SSP1-2.6 scenario shows an initial increase followed by a decrease from 2021 to 2050 in both traditional development and water-saving modes (Figure 9). The highest water stress occurs in 2027, with LWS values reaching 1.43 and 1.24, respectively. After this peak, the LWS follows a declining trend. By 2050, the LWS will be 1.01, 1.2, and 0.87 under the traditional development, economic growth, and water-saving modes, respectively. Overall, water stress in the basin is expected to decrease over the next 30 years, particularly under the water-saving mode. The average LWS values for the 2020s, 2030s, and 2040s are projected to be 1.10, 1.03, and 0.95, respectively. Due to the effect of glacial runoff, water stress in the basin will reduce by 19.16%, 19.62%, and 21.57% during the 2020s, 2030s, and 2040s, respectively, under the traditional development mode (Figure 9a). In the economic growth mode (water-saving mode), reductions in water stress are expected to be 19.37% (19.08%), 19.56% (19.28%), and 17.81% (18.30%) for the respective decades (Figure 9b,c).
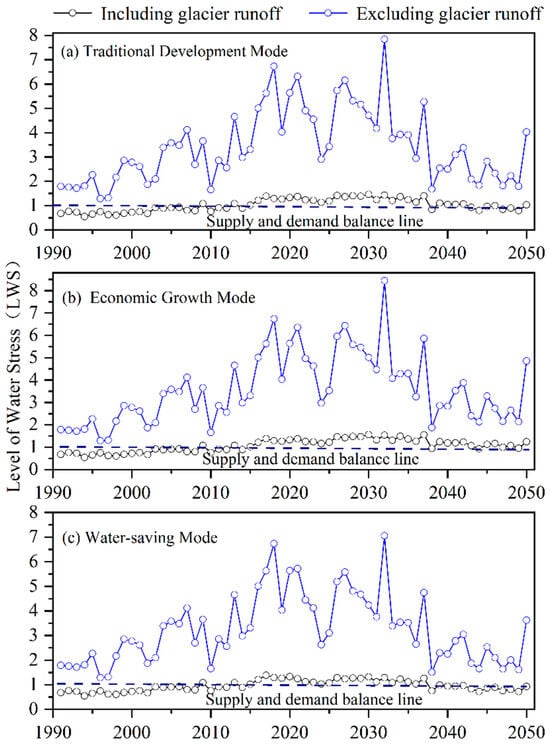
Figure 10.
Variation in LWS in MztRB from 1991 to 2050 under SSP2-4.5 scenario.
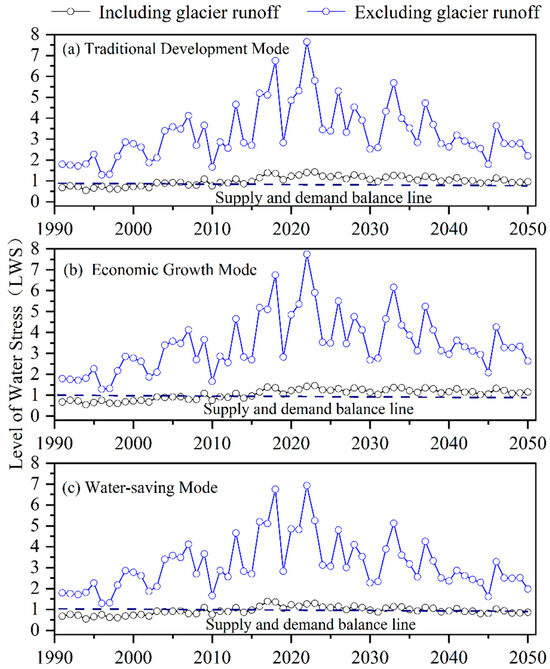
Figure 11.
Variation in LWS in MztRB from 1991 to 2050 under SSP5-8.5 scenario.
Water stress in the basin initially increases and then decreases under the SSP2-4.5 scenario (Figure 10). In the traditional development mode, the LWS rises from 1.37 in 2021 to 1.47 in 2030, after which it will begin to decline, reaching a value of 1.03 by 2050 (Figure 10a). The average LWS values for the 2020s, 2030s, and 2040s are 1.32, 1.20, and 0.94, respectively. In the economic growth mode, the LWS increases from 1.38 in 2021 to 1.56 in 2030, with an LWS of 1.24 in 2050 (Figure 10b). The mean LWS values in this mode for the 2020s, 2030s, and 2040s are 1.37, 1.32, and 1.10, respectively. Under the water-saving mode, the LWS will peak at 1.32 in 2030 (Figure 10c) and then trend downward. The average LWS values in this mode for the 2020s, 2030s, and 2040s are 1.19, 1.08, and 0.85, respectively. Additionally, the influence of glacial runoff significantly reduces water stress in the basin, with decreases of 73.17%, 69.95%, and 73.73% in the 2020s, 2030s, and 2040s, respectively, under the traditional development mode. The reductions for the economic growth mode are 73.08%, 68.79%, and 63.09%. In the water-saving mode, the reductions are 73.26%, 68.88%, and 62.88% (Figure 10).
Water stress in the basin shows an increasing trend, followed by a decrease under the SSP5-8.5 scenario (Figure 11). The highest LWS occurs in 2023. Under the traditional development mode, the LWS rises from 1.28 in 2021 to 1.43 in 2023 and will then decrease to 0.96 by 2050 (Figure 11a). The average LWS values for the 2020s, 2030s, and 2040s are 1.24, 1.12, and 1.00, respectively. In the economic growth mode, the LWS increases from 1.28 in 2021 to 1.45 in 2023 and will decline to 1.15 in 2050 (Figure 11b); the mean LWS values for the 2020s, 2030s, and 2040s are 1.29, 1.23, and 1.16, respectively. In the water-saving mode, the LWS rises from 1.16 in 2021 to 1.29 in 2023 and will decrease to 0.86 in 2050 (Figure 11c); the average LWS values for the 2020s, 2030s, and 2040s are 1.13, 1.01, and 0.90, respectively. In terms of glacier runoff, the reduction in water stress in the basin is as follows: the traditional development mode mitigates water stress by 72.57%, 69.56%, and 59.71% in the 2020s, 2030s, and 2040s, respectively. Under the economic growth mode, water stress is reduced by 72.32%, 69.55%, and 63.64%, respectively, while in the water-saving mode, the reductions are 72.37%, 69.79%, and 63.41%, respectively.
4. Discussion
Over the past two decades, TWW in the Tianshan mountain range has exhibited a significant upward trend on the northern and southern slopes. Specifically, TWW has increased by 150% and 130% in the MnsRB and MztRB, respectively. Further, the growth rate of TWW on the northern slope surpasses that of the southern slope, illustrating a marked regional disparity. Sectoral water usage analysis reveals that AWD, primarily utilized for irrigation, constitutes a substantial portion of TWW. The average share of AWD in the MnsRB on the northern slope is 82.6% compared to 84.5% in the MztRB on the southern slope. Notably, Deng et al. (2010) [52] and Liu et al. (2024) [53] reported average AWD values of 88% and 85%, respectively, for the northern slope of the Tianshan Mountains, indicating a slight decrease over time. Although the predominantly agricultural oasis economic structure in these regions dictates that agriculture remains the primary consumer of water resources [54,55], this underscores the critical need for enhanced agricultural water efficiency. To enhance water conservation in the river basins, various water-saving technologies should be implemented, including mulching to retain soil moisture, efficient irrigation practices, and increased investment in water infrastructure [56,57]. In Xinjiang, approximately half of the croplands have adopted surface mulching and micro-irrigation techniques, reflecting their potential efficiency in conserving water within the region [58]. A detailed assessment is crucial to accurately quantify the collective impact of these technologies in future research, enabling a clearer understanding of their synergistic benefits in sustainable water management strategies.
Given the static nature of available water resources, it is imperative to implement effective water conservation measures, pursue structural adjustments within industries, and enhance the efficiency of water resource management. During the same period, the average share of industrial water demand (IWD) in the MnsRB and MztRB was 4.76% and 1.99%, respectively, highlighting a notable disparity in industrial development. The MnsRB demonstrates a higher level of industrial development than the MztRB, which correlates with the static data showing that the industrial added value in the MnsRB exceeds that of the MztRB.
Our results indicate that from 1991 to 2020, the water stress in the MnsRB has consistently remained high, with an average LWS value of 1.2. This finding suggests that TWW is approaching or exceeding available water resources, leading to low sustainability. In contrast, the MztRB, has an average LWS value of 0.89, indicating a similar proximity to available water resource limits but with slightly higher sustainability. The decline in water resource sustainability in the northern and southern Tianshan Mountains can be primarily attributed to the expansion of cultivated land and a shift from food crops to cash crops [27,59].
Glacial runoff significantly alleviates water stress in both basins. Over the past 30 years, the average reduction in water stress has been 70.6% for the MztRB and 23.1% for the MnsRB. Projections for 2050 suggest reductions of 69.1% and 19.3%, respectively. The differing impacts of glacial runoff in the MztRB and the MnsRB can be attributed to their glacier coverage and contribution rates. In the MztRB, glacier coverage is approximately 48.2%, with contribution rates exceeding 65% [32,36]. In contrast, the MnsRB has a glacier coverage of only 12%, with contribution rates ranging from 23% to 27% according to previous studies [60,61]. However, previous study has projected a significant decline in the hydrological regulatory functions of glaciers in the MztRB and MnsRB by the end of the twenty-first century [36], with reductions estimated at 66.9% and 10.5%, respectively. As glacial meltwater diminishes, the contribution of glacial runoff to alleviating water stress will correspondingly decrease, thereby exacerbating drought risks within the oasis systems of both basins. This trend presents substantial challenges to sustainable development and poses threats to local livelihoods. Accordingly, adaptive measures, such as reservoir regulation management and inter-basin water transfer, are imperative to mitigate the adverse effects of reduced glacial runoff and safeguard the sustainability of regional water resources [62].
This study evaluates the sustainability of water resources in representative watersheds located on the northern and southern slopes of the Tianshan Mountains and quantifies the influence of glaciers on watershed hydrology. However, several limitations remain. First, uncertainties in soil and glacier area parameters within the VIC-CAS model introduce potential inaccuracies in runoff simulation and glacier area estimation. Moreover, the model does not explicitly account for the effects of glacier melting and retreat on parameter dynamics. Additionally, uncertainties inherent in temperature and precipitation inputs derived from GCMs further contribute to variability in runoff projections. Second, due to constraints in data availability, this study was unable to disaggregate water resource stress by specific sectors, such as agriculture, industry, and domestic water use. Addressing these limitations through enhanced data acquisition and model refinement will be a focus of future research efforts.
5. Conclusions
Over the past three decades, the available freshwater resources in the MnsRB have exhibited an increasing trend, with an average annual value of 13.94 × 10⁸ m3. In contrast, the available freshwater resources in the MztRB have decreased during the same period, with a yearly mean value of 14.27 × 10⁸ m3. These resources are projected to decline in both the MnsRB and the MztRB over the next 30 years. Under the SSP1-2.6 scenario, declines of 2.39% and 3.84% are expected, while under the SSP5-8.5 scenario, the decreases will be 10.94% and 4.37%, respectively, in the 2040s.
From 1991 to 2020, TWW in the MnsRB and the MztRB showed a significant increasing trend, with average annual water consumption of 15.42 × 10⁸ m3 and 12.85 × 10⁸ m3, respectively. AWD accounted for the highest proportion of this consumption, averaging 82.6% in the MnsRB and 84.5% in the MztRB. Under the SSP1-2.6, SSP2-4.5, and SSP5-8.5 scenarios, the TWW in these basins is projected to follow an increasing trend, followed by a decrease under the traditional development, economic growth, and water-saving modes. Adopting water-saving practices is an essential strategy for the sustainable utilization of water resources in the northern and southern slopes of the Tianshan Mountains moving forward.
Between 1991 and 2020, water stress in the MnsRB and the MztRB increased by 2.4 and 2.0 times, respectively, with average annual LWS of 1.14 and 0.87, respectively. Under the SSP1-2.6, SSP2-4.5, and SSP5-8.5 scenarios, water stress in these basins is projected to be highest during the 2021–2050 period under the economic growth mode and lowest under the water-saving mode. Glacial runoff significantly alleviates water stress in the MnsRB and MztRB by 21.2% and 69.8%, respectively, from 1991 to 2050. These results emphasize the ongoing challenge of water scarcity driven by increasing crop water requirements. Advancements in water-saving technologies and improved agricultural practices, combined with strong collaboration among government agencies, local communities, researchers, and industry, are critical for developing effective, region-specific water management strategies in glacier-covered arid regions. The implementation of clear policies, regulations, and incentives that prioritize water conservation is essential to successfully address the growing challenge of water scarcity.
Author Contributions
Conceptualization, Q.H. and J.Y.; methodology, Q.H. and Q.Z.; software, H.C.; validation, J.Y. and X.W.; formal analysis, Q.H.; investigation, Q.H.; resources, Q.H.; data curation, H.C. and J.Y.; writing—original draft preparation, Q.H.; writing—review and editing, Q.H. and Y.W.; visualization, H.W.; supervision, J.Y.; project administration, Q.Z.; funding acquisition, Q.Z. All authors have read and agreed to the published version of the manuscript.
Funding
This research was supported by Gansu Province Higher Education Teacher Innovation Fund (no. 2025B-073), Natural Science Foundation of Gansu Province (no. 24JRRA091), China Meteorological Administration Innovation and Development Project (no. CXFZ2024J044), Gansu Province Youth Science and Technology Fund Project (no. 23JRRA900), and Shanxi Province Basic Research Program (Free Exploration Category) Youth Project (no. Z20240096).
Institutional Review Board Statement
Not applicable.
Informed Consent Statement
Not applicable.
Data Availability Statement
The data presented in this study are available on request from the corresponding author.
Conflicts of Interest
The authors declare no conflicts of interest.
Abbreviations
The following abbreviations are used in this manuscript:
| SDGs | Sustainable Development Goals |
| MnsRB | Manas River Basin |
| MztRB | Muzati River Basin |
| LWS | Level of Water Stress |
| VIC-CAS | Variable Infiltration Capacity Chinese Academy of Sciences |
| SSPs | Shared Socioeconomic Pathways |
| GCM | Global Climate Models |
| QDM | Quantile Delta Mapping |
| AWD | Agricultural Water Demand |
| IWD | Industrial Water Demand |
| DWD | Domestic Water Demand |
| EWD | Ecological Water Demand |
| TWW | Total Water Withdrawal |
References
- Bakker, K. Water security: Research challenges and opportunities. Science 2012, 337, 914–915. [Google Scholar] [CrossRef] [PubMed]
- Florke, M.; Schneider, C.; McDonald, R.I. Water Competition between Cities and Agriculture Driven by Climate Change and Urban Growth. Nat. Sustain. 2018, 1, 51–58. [Google Scholar] [CrossRef]
- WWAP/UN-WATER. The United Nations World Water Development Report 2024: Water for Prosperity and Peace; UNESCO: Paris, France, 2024. [Google Scholar]
- Mekonnen, M.M.; Hoekstra, A.Y. Four billion people facing severe water scarcity. Sci. Adv. 2016, 2, e1500323. [Google Scholar] [CrossRef]
- Vörösmarty, C.J.; McIntyre, P.B.; Gessner, M.O.; Dudgeon, D.; Prusevich, A.; Green, P.; Glidden, S.; Bunn, S.E.; Sullivan, C.A.; Liermann, C.R.; et al. Erratum: Global Threats to Human Water Security and River Biodiversity. Nature 2010, 467, 555–561. [Google Scholar] [CrossRef] [PubMed]
- Greve, P.; Kahil, T.; Mochizuki, J.; Schinko, T.; Satoh, Y.; Burek, P.; Fischer, G.; Tramberend, S.; Burtscher, R.; Langan, S.; et al. Global Assessment of Water Challenges under Uncertainty in Water Scarcity Projections. Nat. Sustain. 2018, 1, 486–494. [Google Scholar] [CrossRef]
- Qin, Y.; Abatzoglou, J.T.; Siebert, S.; Huning, L.S.; AghaKouchak, A.; Mankin, J.S.; Hong, C.P.; Tong, D.; Davis, S.J.; Mueller, N.D. Agricultural Risks from Changing Snowmelt. Nat. Clim. Change 2020, 10, 459–465. [Google Scholar] [CrossRef]
- Wu, K.P.; Liu, S.Y.; Jiang, Z.L.; Zhu, Y.; Wei, J.F.; Tahir, A.A. Spatiotemporal Pattern of Glacier Mass Balance in the Tibetan Plateau Interior Area over the Past 40 Years. J. Hydrol. 2024, 635, 131200. [Google Scholar] [CrossRef]
- Mingle, J. IPCC Special Report on the Ocean and Cryosphere in a Changing Climate. New York Rev. Books 2020, 67, 49–51. [Google Scholar]
- Fan, Y.F.; Tong, L.Y.; Ji, Q. Variations in Glacial Area in the Middle Himalayas over the Past 30 Years. Prog. Phys. Geogr.-Earth Environ. 2025, 49, 24–43. [Google Scholar] [CrossRef]
- de Kok, R.J.; Kraaijenbrink, P.D.A.; Tuinenburg, O.A.; Bonekamp, P.N.J.; Immerzeel, W.W. Towards Understanding the Pattern of Glacier Mass Balances in High Mountain Asia Using Regional Climatic Modelling. Cryosphere 2020, 14, 3215–3234. [Google Scholar] [CrossRef]
- Huss, M.; Hock, R. Global-Scale Hydrological Response to Future Glacier Mass Loss. Nat. Clim. Change 2018, 8, 135–140. [Google Scholar] [CrossRef]
- Kaser, G.; Grosshauser, M.; Marzeion, B. Contribution Potential of Glaciers to Water Availability in Different Climate Regimes. Proc. Natl. Acad. Sci. USA 2010, 107, 20223–20227. [Google Scholar] [CrossRef]
- Peng, Y.Z.; Zhang, H.; Zhang, Z.; Tang, B.; Shen, D.D.; Yin, G.; Li, Y.M.; Chen, X.; Hu, Z.Y.; Nazrollozoda, S.H. Future Challenges of Terrestrial Water Storage over the Arid Regions of Central Asia. Int. J. Appl. Earth Obs. Geoinf. 2024, 132, 104026. [Google Scholar] [CrossRef]
- Pritchard, H.D. Asia’s Shrinking Glaciers Protect Large Populations from Drought Stress. Nature 2019, 569, 649–654. [Google Scholar] [CrossRef] [PubMed]
- Gharib, A.A.; Blumberg, J.; Manning, D.T.; Goemans, C.; Arabi, M. Assessment of Vulnerability to Water Shortage in Semi-Arid River Basins: The Value of Demand Reduction and Storage Capacity. Sci. Total Environ. 2023, 871, 161964. [Google Scholar] [CrossRef]
- Wang, S.; Zhao, Q.; Pu, T. Assessment of Water Stress Level about Global Glacier-Covered Arid Areas: A Case Study in the Shule River Basin, Northwestern China. J. Hydrol. Reg. Stud. 2021, 37, 100895. [Google Scholar] [CrossRef]
- Plum, A.; Kaljee, L. Achieving Sustainable, Community-Based Health in Detroit Through Adaptation of the UNSDGs. Ann. Glob. Health 2016, 82, 981–990. [Google Scholar] [CrossRef]
- FAO and UN-Water. 2018 Progress on Level of Water Stress. Global Baseline for SDG 6 Indicator 6.4.2: Level of Water Stress: Freshwater Withdrawal as a Proportion of Available Freshwater Resources. Available online: https://www.unwater.org/sites/default/files/app/uploads/2018/08/642-progress-on-level-of-water-stress-2018.pdf (accessed on 15 June 2022).
- Vanham, D.; Hoekstra, A.Y.; Wada, Y.; Bouraoui, F.; de Roo, A.; Mekonnen, M.M.; van de Bund, W.J.; Batelaan, O.; Pavelic, P.; Bastiaanssen, W.G.M.; et al. Physical Water Scarcity Metrics for Monitoring Progress towards SDG Target 6.4: An Evaluation of Indicator 6.4.2 “Level of Water Stress”. Sci. Total Environ. 2018, 613–614, 218–232. [Google Scholar] [CrossRef]
- Ievoli, R.; Vinciguerra, R.; Bruno, A. Investigating Water Sustainability towards Indicators: An Empirical Illustration Using Country-Level Data. Socioecon. Plann. Sci. 2024, 96, 102102. [Google Scholar] [CrossRef]
- Jia, Y.; Li, Z.; Gao, H.; Wang, S.; Sun, M.; Wang, P. Hydrological Response to Climate Change in a Glacierized Catchment in Eastern Tien Shan, Central Asia. J. Hydrol. Reg. Stud. 2024, 51, 101669. [Google Scholar] [CrossRef]
- Chen, Y.N.; Li, W.H.; Deng, H.J.; Fang, G.H.; Li, Z. Changes in Central Asia’s Water Tower: Past, Present and Future. Sci. Rep. 2016, 6, 39364. [Google Scholar] [CrossRef] [PubMed]
- Sorg, A.; Bolch, T.; Stoffel, M.; Solomina, O.; Beniston, M. Climate Change Impacts on Glaciers and Runoff in Tien Shan (Central Asia). Nat. Clim. Change 2012, 2, 725–731. [Google Scholar] [CrossRef]
- Fang, G.; Chen, Y.; Li, Z. Variation in Agricultural Water Demand and Its Attributions in the Arid Tarim River Basin. J. Agric. Sci. 2018, 156, 301–311. [Google Scholar] [CrossRef]
- Liu, W.; Tian, H.; Xu, X.; Yang, G. Evaluation of Water Supply Function in the Economic Belt of the Northern Slope of the Tianshan Mountains Based on the InVEST Model. Clim. Serv. 2024, 36, 100519. [Google Scholar] [CrossRef]
- Tang, Q.; Liu, X.; Zhou, Y.; Wang, P.; Li, Z.; Hao, Z.; Liu, S.; Zhao, G.; Zhu, B.; He, X.; et al. Climate Change and Water Security in the Northern Slope of the Tianshan Mountains. Geogr. Sustain. 2022, 3, 246–257. [Google Scholar] [CrossRef]
- Zhang, P.; Chen, X.; Bao, A.; Liu, T.; Ndayisaba, F. Assessing Spatio-Temporal Characteristics of Water Storage Changes in the Mountainous Areas of Central Asia Based on GRACE. Chin. Geogr. Sci. 2017, 27, 918–933. [Google Scholar] [CrossRef]
- Yang, P.; Zhang, S.; Xia, J.; Chen, Y.; Zhang, Y.; Cai, W.; Wang, W.; Wang, H.; Luo, X.; Chen, X. Risk Assessment of Water Resource Shortages in the Aksu River Basin of Northwest China under Climate Change. J. Environ. Manag. 2022, 305, 114394. [Google Scholar] [CrossRef]
- Tang, X.L.; Xu, L.P.; Zhang, Z.Y.; Lv, X. Effects of Glacier Melting on Socioeconomic Development in the Manas River Basin, China. Nat. Hazards 2013, 66, 533–544. [Google Scholar] [CrossRef]
- Luo, Y.; Arnold, J.; Allen, P.; Chen, X. Baseflow Simulation Using SWAT Model in an Inland River Basin in Tianshan Mountains, Northwest China. Hydrol. Earth Syst. Sci. 2012, 16, 1259–1267. [Google Scholar] [CrossRef]
- Zhao, Q.; Zhao, C.; Qin, Y. Response of the hydrological processes to climate change in the Muzati River basin with high glacierization, southern slope of the Tianshan Mountains. J. Glaciol. Geocryol. 2020, 42, 1285–1298. (In Chinese) [Google Scholar]
- Jin, Z.Z.; Zhao, Q.D.; Qin, X.; Zhang, J.T.; Zhang, H.; Qin, J.; Qin, Y.; Li, H.Y.; Chen, J.Z.; Liu, Y.S.; et al. Quantifying the Impact of Landscape Changes on Hydrological Variables in the Alpine and Cold Region Using Hydrological Model and Remote Sensing Data. Hydrol. Process 2021, 35, 14392. [Google Scholar] [CrossRef]
- Wang, F.; Tian, D. On Deep Learning-Based Bias Correction and Downscaling of Multiple Climate Models Simulations. Clim. Dyn. 2022, 59, 3451–3468. [Google Scholar] [CrossRef]
- Cannon, A.J.; Sobie, S.R.; Murdock, T.Q. Bias Correction of GCM Precipitation by Quantile Mapping: How Well Do Methods Preserve Changes in Quantiles and Extremes? J. Clim. 2015, 28, 6938–6959. [Google Scholar] [CrossRef]
- He, Q.S.; Yang, J.P.; Zhao, Q.D.; Wang, Y.X.; Chen, H.J.; Ji, Q. Variations of Glacier Hydrological Regulation in the North- and South-Facing Slopes of Tianshan Mountains, China: Past and Future. J. Hydrol.-Reg. Stud. 2022, 43, 101199. [Google Scholar] [CrossRef]
- Ye, Z.X.; Chen, Y.N.; Li, W.H. Ecological Water Rights and Water-Resource Exploitation in the Three Headwaters of the Tarim River. Quat. Int. 2014, 336, 20–25. [Google Scholar] [CrossRef]
- Wang, R.; Lu, X.; Song, Y.; Fan, Z.; Ma, Y. Patterns and Characteristics of Ecological Water Demand in West Arid Zone of China—A Case Study of Green Corridor in the Lower Reaches of Tarim River. Ying Yong Sheng Tai Xue Bao 2003, 14, 520–524. [Google Scholar]
- Yang, Y.N.; Chen, X.F.; Jiang, Y. Estimation and Spatial-Temporal Distribution Characteristics of Ecological Water Demand for Natural Vegetation in Aksu River Irrigation Area, XinJiang, China. Water Resour. 2024, 51, 780–788. [Google Scholar] [CrossRef]
- Wang, G.X.; Cheng, G.D. Ecological water demand and its estimation in arid inland river basins: A case study of the Heihe River Basin. J. Desert Res. 2002, 2, 33–38. (In Chinese) [Google Scholar]
- Shokoohi, A.; Amini, M. Introducing a new method to determine rivers’ ecological water requirement in comparison with hydrological and hydraulic methods. Int. J. Environ. Sci. Technol. 2014, 11, 747–756. [Google Scholar] [CrossRef]
- Amrit, K.; Mishra, S.K.; Pandey, R.P.; Himanshu, S.K.; Singh, S. Standardized precipitation index-based approach to predict environmental flow condition. Ecohydrology 2019, 12, e2127. [Google Scholar] [CrossRef]
- Kormos, P.R.; Luce, C.H.; Wenger, S.J.; Berghuijs, W.R. Trends and Sensitivities of Low Streamflow Extremes to Discharge Timing and Magnitude in Pacific Northwest Mountain Streams. Water Resour. Res. 2016, 52, 4990–5007. [Google Scholar] [CrossRef]
- Hou, S.W. Analysis of ecological base flow in Dawenhe River based on various hydrological methods. Hydrology 2015, 35, 61–66. (In Chinese) [Google Scholar]
- Tian, S.S. Comprehensive Evaluation and Simulation of Water Resources Carrying Capacity in the Tarim Basin. Ph.D. Thesis, East China Normal University, Shanghai, China, 2022. (In Chinese). [Google Scholar]
- O’Neill, B.C.; Kriegler, E.; Riahi, K.; Ebi, K.L.; Hallegatte, S.; Carter, T.R.; Mathur, R.; van Vuuren, D.P. A new scenario framework for climate change research: The concept of shared socioeconomic pathways. Clim. Change 2014, 122, 387–400. [Google Scholar] [CrossRef]
- Riahi, K.; Van Vuuren, D.P.; Kriegler, E.; Edmonds, J.; O’Neill, B.C.; Fujimori, S.; Bauer, N.; Calvin, K.; Dellink, R.; Fricko, O.; et al. The Shared Socioeconomic Pathways and their energy, land use, and greenhouse gas emissions implications: An overview. Glob. Environ. Change 2017, 42, 153–168. [Google Scholar] [CrossRef]
- Chen, Y.; Guo, F.; Wang, J.; Cai, W.; Wang, C.; Wang, K. Provincial and gridded population projection for China under shared socioeconomic pathways from 2010 to 2100. Sci. Data 2020, 7, 83. [Google Scholar] [CrossRef]
- Dai, K.; Shen, S.; Cheng, C. Evaluation and analysis of the projected population of China. Sci. Rep. 2022, 12, 3644. [Google Scholar] [CrossRef]
- Huang, J.; Qin, D.; Jiang, T.; Wang, Y.; Feng, Z.; Zhai, J.; Cao, L.; Chao, Q.; Xu, X.; Wang, G.; et al. Effect of Fertility Policy Changes on the Population Structure and Economy of China: From the Perspective of the Shared Socioeconomic Pathways. Earth’s Feature 2019, 7, 250–265. [Google Scholar] [CrossRef]
- Jing, C.; Tao, H.; Jiang, T.; Wang, Y.; Zhai, J.; Cao, L.; Su, B. Population, urbanization and economic scenarios over the Belt and Road region under the Shared Socioeconomic Pathways. J. Geogr. Sci. 2020, 30, 68–84. [Google Scholar] [CrossRef]
- Deng, M.J.; Zhang, Y.; Li, X.Q. Development trend of water supply and water demand in the North of the Tianshan Mountains, Xinjiang. Arid. Land. Geogr. 2010, 33, 315–324. (In Chinese) [Google Scholar]
- Liu, X.; Tang, Q.; Zhao, Y.; Wang, P. Persistent Water Scarcity Due To High Irrigation Demand in Arid China: A Case Study in the North Slope of the Tianshan Mountains. Earths Future 2024, 12, e2024EF005070. [Google Scholar] [CrossRef]
- Liu, X.; Shen, Y.; Guo, Y.; Li, S.; Guo, B. Modeling Demand/Supply of Water Resources in the Arid Region of Northwestern China during the Late 1980s to 2010. J. Geogr. Sci. 2015, 25, 573–591. [Google Scholar] [CrossRef]
- Shen, Y.; Li, S.; Chen, Y.; Qi, Y.; Zhang, S. Estimation of Regional Irrigation Water Requirement and Water Supply Risk in the Arid Region of Northwestern China 1989-2010. Agric. Water Manag. 2013, 128, 55–64. [Google Scholar] [CrossRef]
- Zhang, L.; Ma, Q.; Zhao, Y.; Chen, H.; Hu, Y.; Ma, H. China’s strictest water policy: Reversing water use trends and alleviating waterstress. J. Environ. Manag. 2023, 345, 118867. [Google Scholar] [CrossRef] [PubMed]
- Cai, W.; Gu, X.; Du, Y.; Chang, T.; Lu, S.; Zheng, X.; Bai, D.; Song, H.; Sun, S.; Cai, H. Effects of mulching on water saving, yield increase and emission reduction for maize in China. Agric. Water Manag. 2022, 274, 107954. [Google Scholar] [CrossRef]
- Chen, Q.; Liu, X. Plastic film mulch use efficiency in agricultural production: A regional analysis in China. Environ. Dev. Sustain. 2024. [Google Scholar] [CrossRef]
- Fang, C.; Gao, Q.; Zhang, X.; Cheng, W. Spatiotemporal Characteristics of the Expansion of an Urban Agglomeration and Its Effect on the Eco-Environment: Case Study on the Northern Slope of the Tianshan Mountains. Sci. China Earth Sci. 2019, 62, 1461–1472. [Google Scholar] [CrossRef]
- Wang, X.; Yang, T.; Xu, C.-Y.; Yong, B.; Shi, P. Understanding the Discharge Regime of a Glacierized Alpine Catchment in the Tianshan Mountains Using an Improved HBV-D Hydrological Model. Glob. Planet. Change 2019, 172, 211–222. [Google Scholar] [CrossRef]
- Luo, Y.; Arnold, J.; Liu, S.; Wang, X.; Chen, X. Inclusion of Glacier Processes for Distributed Hydrological Modeling at Basin Scale with Application to a Watershed in Tianshan Mountains, Northwest China. J. Hydrol. 2013, 477, 72–85. [Google Scholar] [CrossRef]
- Sun, S.; Zhou, X.; Liu, H.; Jiang, Y.; Zhou, H.; Zhang, C.; Fu, G. Unraveling the effect of inter-basin water transfer on reducing water scarcity and its inequality in China. Water Res. 2021, 194, 116931. [Google Scholar] [CrossRef]
Disclaimer/Publisher’s Note: The statements, opinions and data contained in all publications are solely those of the individual author(s) and contributor(s) and not of MDPI and/or the editor(s). MDPI and/or the editor(s) disclaim responsibility for any injury to people or property resulting from any ideas, methods, instructions or products referred to in the content. |
© 2025 by the authors. Licensee MDPI, Basel, Switzerland. This article is an open access article distributed under the terms and conditions of the Creative Commons Attribution (CC BY) license (https://creativecommons.org/licenses/by/4.0/).