Article

Does Education Make a Difference in Combating Climate Change? Analyzing Its Impact on CO2 Emissions in the South-East European, Nordic, and Baltic Regions

by
Adela Bâra
,
Irina Alexandra Georgescu
and
Simona-Vasilica Oprea
*
Department of Economic Informatics and Cybernetics, Bucharest University of Economic Studies, 010552 Bucharest, Romania
*
Author to whom correspondence should be addressed.
Sustainability 2025, 17(11), 4789; https://doi.org/10.3390/su17114789
Submission received: 17 April 2025 / Revised: 10 May 2025 / Accepted: 20 May 2025 / Published: 23 May 2025

Abstract

:
In this paper, we compare the determinants of CO2 emissions: GDP per capita, energy production from renewable sources (EPREN), secondary school enrollment (SI) and urbanization (URB) for three groups of countries: SEE (South-Eastern European), Nordic, and Baltic countries during 1990–2022 by means of panel ARDL. The long-term analysis indicates that in SEE countries, URB significantly reduces CO2 emissions (4.54%). In contrast, GDP (0.46%) and SI (0.54%) slightly increase CO2 emissions. In the case of Baltic countries, GDP positively correlates with CO2 (1.65%), while URB (29.27%), EPREN (0.03%), and SI (6.22%) negatively correlate with CO2. In the case of Nordic countries, GDP (0.59%), EPREN (0.14%), and URB (18.02%) negatively impact CO2 emissions. Regarding the Error Correction Term (ECT) dimension, the Nordic countries exhibit the fastest adjustment to shocks (−0.67), succeeded by the SEE countries (−0.44), while the Baltic countries display the slowest response (−0.27). This sequence indicates varying degrees of efficiency and speed at which each region can address fluctuations impacting CO2 emissions. These differences may reflect variations in policy execution, infrastructure adaptability, and the general development of environmental governance across the three regions. Our research contributes by offering a comparative, region-specific econometric analysis of the long-run and short-run dynamics of CO2 emissions in European subregions, revealing the nuanced roles of education, urbanization, and RES in shaping environmental outcomes and providing empirical evidence to inform targeted climate and development policies.

1. Introduction

When discussing CO2 emissions in the three groups of countries—SEE (South-East Europe), Nordic, and Baltic—several general factors and regional characteristics influence their emission profiles. These include economic structure, energy sources, industrial activities, and environmental policies [1]. The SEE region, comprising countries from Southeastern Europe (Romania, Hungary, Bulgaria, Greece), often experiences varied CO2 emissions patterns influenced by economic restructuring and energy sector reforms. Historically, these countries have relied heavily on coal and other fossil fuels for energy production, contributing to higher emissions levels. However, there is a growing shift towards Renewable Energy Sources (RES) as part of the EU’s broader environmental targets. Economic challenges and the pace of infrastructural modernization also impact how quickly these nations can reduce their emissions.
Nordic countries (Sweden, Denmark, Norway, and Finland) are known for their strong commitment to sustainability and environmental protection. These nations have some of the most ambitious climate policies in the world, aiming for carbon neutrality within the next few decades. Their CO2 emissions are relatively well-managed due to significant investments in RES such as hydroelectric, wind, and biomass. Despite their industrialized economies, the Nordics demonstrate that high economic output can coexist with low emissions levels due to advanced technology and a societal commitment to sustainability [2].
The Baltic states (comprising Estonia, Latvia, and Lithuania) have been transitioning from their Soviet-era industrial and energy infrastructure to more modern and efficient systems. Historically reliant on oil shale (particularly in Estonia), the Baltics have relatively high CO2 emissions per capita but have made considerable progress in recent years [3,4]. This progress is due in part to EU membership pushing environmental reforms and the adoption of RES. The ongoing modernization of their economies and energy sectors continues to gradually decrease their CO2 emissions. The pace and impact of transitioning to RES vary across these groups.
The Nordic countries lead with well-established renewable technologies and systems, while the SEE and Baltic countries are in different stages of transitioning from older, more polluting energy sources. The Nordic countries benefit from strong regulatory frameworks for environmental protection, which drive their low emissions [5]. In contrast, SEE and Baltic countries are working under transitional regulatory frameworks that are still evolving to support stringent environmental standards. Adoption of new technologies plays a significant role. The Nordic countries are at the forefront of adopting technologies that reduce emissions and increase energy efficiency. Meanwhile, SEE and Baltic countries are catching up, driven by EU directives and the availability of funding for green technologies. Economic wealth also correlates with the ability to invest in clean energy and sustainable practices [6]. The Nordics, with their higher GDP per capita, invest more in these areas compared to the generally less affluent SEE and Baltic states.
The motivation to analyze the SEE, Nordic, and Baltic countries stems from their distinct socioeconomic, energy, and environmental profiles, which offer valuable comparative insights into the determinants of CO2 emissions. These three regions represent varying stages of economic development, environmental governance, and energy transitions within Europe. The SEE countries are typically characterized by transitioning economies, higher fossil fuel dependency, and evolving regulatory frameworks. In contrast, the Nordic countries are global leaders in environmental sustainability, having established advanced RES systems and stringent climate policies. The Baltic states occupy a middle ground, undergoing significant transformation from carbon-intensive Soviet-era energy infrastructures to EU-aligned, cleaner energy systems. Studying these three groups allows us to capture a broad spectrum of approaches to carbon mitigation, reflecting differences in institutional capacity, policy implementation, technological adoption, and public awareness.
Analyzing the relationship between CO2 emissions and several independent variables-generation from RES-EPREN, urbanization (URB), education level (SI), and GDP-across three distinct groups of countries (SEE, Nordic, and Baltic) provides critical insights into the interplay between economic activities, societal development and environmental impact. Carbon dioxide (CO2) emissions are recognized as the primary driver of anthropogenic climate change. As a greenhouse gas (GHG), CO2 emissions lead to global warming and a cascade of environmental impacts such as rising sea levels, extreme weather events, biodiversity loss, and shifts in agricultural productivity. The significance of studying CO2 emissions lies not only in their environmental consequences but also in their deep interlinkages with economic development, energy use, urbanization, and policy effectiveness. Moreover, high CO2 emissions often correlate with air pollution and poor public health outcomes, especially in urban and industrial areas. Furthermore, climate change driven by emissions disproportionately affects low-income and vulnerable populations, making CO2 reduction not only an environmental priority but also a social justice issue.
The primary goal of this paper is to understand how different factors increase pollution in various European regions, with a focus on (a) generation from RES, evaluating the impact of renewable energy adoption on reducing CO2 emissions; (b) urbanization, understanding how urban development influences emissions, considering that urban areas often have higher energy consumption; (c) education, assessing if higher education levels correlate with environmental awareness and lower emissions; and (d) GDP, investigating the relationship between economic output and emissions, which can indicate how economic growth affects environmental sustainability.
The following hypotheses are tested. H1: Higher generation from RES leads to lower CO2 emissions, reflecting effective use of clean energy. H2: Higher urbanization rates are correlated with higher pollution due to increased energy demands and transportation. H3: Higher education levels correlate with lower emissions, possibly due to greater environmental awareness and sustainable practices. H4: Higher GDP is correlated with higher emissions. The analysis could provide valuable insights for policymakers, suggesting the following points. (a) Investing in education and RES: enhancing educational programs to increase environmental awareness and expanding renewable energy infrastructure can significantly reduce emissions. (b) Urban planning: developing sustainable urban areas with efficient public transport and green spaces could mitigate the negative impacts of urbanization. (c) Economic policies: encouraging industries that are less carbon-intensive and more energy-efficient can decouple economic growth from increased emissions.
The remaining part of this paper is structured in several sections. In the next section, a brief literature review on previous research papers is presented, comparing the objectives, applied methods, variables, and results in a tabular format. Section 3 is dedicated to methodology, whereas in Section 4, the results are discussed. In Section 5, the discussions are presented, and in Section 6, the main conclusions of the current research are drawn from simulations. Section 7 contains limitations and future research directions.

2. Literature Review

Factors behind the increase in greenhouse gas emissions, particularly CO2, to mitigate the adverse effects on environmental sustainability and human life were investigated [4]. The research focused on identifying sectors contributing most to CO2 emissions that also dampen economic growth globally. The study examined the relationship between economic growth and CO2 emissions in Estonia, Latvia, and Lithuania, approaching the Environmental Kuznets Curve (EKC). The econometric analysis did not support the inverted U-shaped EKC hypothesis for the Baltic countries but did confirm the pollution haven hypothesis. Higher energy consumption was shown to worsen environmental outcomes, and financial development explained variations in pollution levels. Causality tests confirmed bidirectional causality between economic growth and CO2 emissions, between energy use and CO2 emissions, as well as between CO2 emissions and financial development.
Public perceptions regarding institutional responsibilities in climate change adaptation and mitigation in Baltic and Nordic countries were analyzed, drawing from the Special Eurobarometer (459) survey conducted in 2017 [7]. The study assessed concerns about climate change and the perceived roles of national governments, the European Union, businesses, and local and regional authorities. It found that climate change is seen as a major global issue in these countries, with increasing concern over time. Significant variations in the perception of institutional responsibilities were noted, with most EU citizens viewing national governments as bearing the highest responsibility. The study highlighted the importance of understanding public perceptions to better tailor climate change policies in the Baltic and Nordic regions.
This research identified and described the administrative procedures for implementing (RES) projects in the Baltic and Nordic countries [8]. It assessed the administrative processes involved in setting up PV and wind power systems. The study developed a methodology that allowed for a quantitative evaluation of these procedures, which could be integrated into complex energy simulation models. The findings suggested potential process optimizations, such as adopting a single point of contact as in Norway, consolidating environmental impact assessments with spatial planning in Finland, and simplifying permitting processes for microgeneration in Lithuania.
Despite numerous studies on the basic determinants of CO2 emissions, the impact of higher education has often been overlooked [9]. This research aimed to explore the potential mechanisms linking higher education with CO2 emissions, expanding the environmental economics literature. Using an autoregressive distributed lag (ARDL) model for data from 1983 to 2017 in Turkey, the study tested the trade-off between higher education and CO2 emissions. The results indicated that cointegration exists, with an increase in higher education negatively affecting pollution. The paper suggested that higher education could be a significant tool in addressing environmental problems.
The effects of education, energy consumption, and economic growth on CO2 emissions in Saudi Arabia during 1971–2014 were investigated [10]. This research found that primary education had no effect on CO2 emissions, but secondary education had a negative impact, while energy consumption increased emissions. An inverted U-shaped relationship was observed between pollution and economic growth, indicating that the Kingdom is at the first stage of economic growth, which contributes to environmental degradation. It recommended enhancing secondary education to improve environmental conditions and adopting cleaner energy sources to mitigate the negative environmental consequences of economic growth.
Another research investigated the influence of financial inclusion and education on CO2 emissions in China, which is the world’s second-largest economy and the largest emitter of CO2 after the USA [11]. Using the ARDL technique, five proxies for financial inclusion were analyzed, four of which confirmed its favorable impact on environmental quality. Education was also found to beneficially reduce CO2 emissions. Among the control variables, GDP and population negatively impacted CO2 emissions, whereas R&D activities contributed to increased emissions. This study suggested that enhancing financial inclusion and education are vital for combating global warming. It recommended allocating funds to entities involved in eco-innovations and enhancing public awareness and education on environmental impacts to foster energy-efficient technological advancements.
The dynamic interactions between education, unemployment, and CO2 emissions in China from 1991 to 2020 using an ARDL model were explored [12]. This research revealed that higher literacy rates and more years of schooling significantly reduced CO2 emissions over the long term. Conversely, the findings indicated that unemployment is associated with increased pollution in the long run. Short-term analysis showed that education and unemployment have similar effects on CO2 emissions. These insights underscored the necessity for a comprehensive set of economic policies that harness the potential of education and address unemployment to sustain environmental quality. The interplay between pollution, economic activities, RES-based consumption, green financing, and foreign direct investment in the BRICS countries during 2000–2019, particularly focusing on the role of higher education, was examined [13]. Using ADF-Fisher, Levin, Lin and Chin and Im, as well as Pesaran and Shin tests to check data stationarity, the study applied a panel autoregressive distributed lag model to identify the long and short-run dynamics. The findings demonstrated that in the long run, RES, economic growth, green finance, and foreign direct investment significantly influence pollution level, with higher education also playing a crucial role. In contrast, in the short run, only economic growth, RES, and higher education were significant. The study recommended that BRICS countries enhance investments in higher education and renewable energy to achieve sustainable growth while improving environmental quality. The impact of higher education on CO2 emissions within the BRICS economies from 1998 to 2020, employing the ARDL bound testing approach, was assessed [14]. The results showed that higher education significantly reduces CO2 emissions in China, supporting the education–CO2-led hypothesis in the long term. However, in Russia, India, and South Africa, higher education appears to increase CO2 emissions, contradicting the hypothesis. Furthermore, financial inclusion generally decreased CO2 emissions in China, Russia, and South Africa, but increased them in India. These findings suggested that policy interventions should not only promote higher education but also integrate financial inclusion strategies to effectively mitigate pollution in these economies. Another research investigated the impact of human capital on CO2 emissions across the BRICS nations (Brazil, Russia, India, China, and South Africa) from 1991 to 2019, using a nonlinear panel autoregressive distributed lag model [15]. The results showed that an improvement in education consistently reduces CO2 emissions, while a decline in educational standards tends to increase emissions over the long term. Specifically, a positive change in education led to reduced emissions in Russia, China, and South Africa, whereas a regression in educational levels causes increased emissions in Brazil and China. These findings underscored the importance of robust educational infrastructures as a means to mitigate environmental impact. Policymakers were encouraged to invest in educational advancements to support environmental sustainability efforts.
In response to the objectives set by the COP27 conference aligned with the Paris Agreement goals, this research examined the effects of education on CO2 emissions, economic dynamics, renewable energy usage, green investments, and foreign direct investment in the E-7 countries from 2000 to 2021 [16]. Utilizing the CADF and CIPS tests to assess data stationarity and the momentum quantile regression for long-run coefficients, the study found that these variables are cointegrated. The analysis revealed that education, alongside foreign direct investment, economic growth, and green investments, significantly lowers CO2 emissions over time. This emphasized the critical role of education in driving environmental policy and suggested that E-7 countries prioritize renewable energy and educational investment to achieve sustainable development goals.
The dynamic relationships between financial development, economic growth, ICT, education, and pollution in the UK from 1990 to 2019 were explored [17]. Using the Breitung and Candelon (2006) causality test and wavelet coherence, the study assessed the interconnections and the leading indicators among these variables. Findings revealed a negative coherence between CO2 emissions and GDP, with GDP leading the changes. Similarly, financial development and ICT showed negative and positive co-movements with CO2 emissions, respectively, indicating their leading roles. Education also exhibited a negative co-movement with emissions, highlighting its preventive role against CO2 emissions. The study recommended that policymakers focus on leveraging financial and ICT developments alongside educational enhancements to support green energy policies and ensure long-term productivity amid increasing pollution levels.
In recent studies, the focus has been primarily on financial development and public finance, yet remittances have been somewhat overlooked despite being a significant source of resource inflow that could help reduce environmental degradation [18]. This research examined the effects of remittances, export diversification, and education on CO2 emissions, considering renewable energy and economic growth across 22 top remittance-receiving countries from 1986 to 2017. Utilizing second-generation unit root techniques and the Westerlund and Edgerton cointegration approach with structural breaks, along with Cup-FM and CUP-BC long-run estimation methods, the study found that remittances and export diversification both reduce CO2 emissions. Conversely, economic growth exacerbated environmental degradation. This study underscored the complex interplay between these variables and suggested policy adjustments to harness the positive impacts of remittances and education on environmental quality.
Another study analyzed the relationship between higher education and environmental sustainability across 30 Chinese provinces from 2000 to 2018, using cross-sectional dependency tests, panel unit-root tests, Kao cointegration tests, and dynamic econometric methods [19]. The findings indicated that higher education and foreign direct investment significantly reduced CO2 emissions, supporting both the education-CO2 reduction hypothesis and the pollution halo hypothesis. However, increases in electricity consumption, population and GDP were associated with higher CO2 emissions. The results suggested that policymakers should focus on enhancing educational frameworks and regulating industrial growth to mitigate environmental impact.
The influence of renewable energy, education, GDP, natural resources, and foreign direct investment on CO2 emissions in G11 countries from 1990 to 2019 was explored [20]. The study showed that renewable energy and education contributed to a decrease in CO2 emissions by 0.49% and 0.11%, respectively, while foreign direct investment and natural resources had a detrimental effect, increasing emissions by 0.15% and 0.09%. The findings advocated policy frameworks that focus on enhancing renewable energy and educational investments to foster sustainable development and reduce CO2 emissions effectively.
Another study examines the role of education in energy consumption in Indonesia from 1972 to 2016, applying the EKC hypothesis and utilizing the ARDL Bound Test approach to analyze co-integration among variables [21]. The results confirmed that education initially increases CO2 emissions but later reduces them in the short run, although this reduction does not persist in the long run. Additionally, the study supports the inverted U-shaped EKC hypothesis, linking GDP per capita with environmental degradation. The findings underscore the complex relationship between education and environmental sustainability, suggesting targeted educational policies could eventually contribute to environmental improvements.
The multifaceted impact of natural resources and education on CO2 emissions in Latin American countries from 1990 to 2020 was addressed [22], exploring both linear and nonlinear effects and considering the roles of green energy and foreign remittances. The study revealed that while lower levels of natural resource usage benefit environmental quality, higher usage intensifies CO2 emissions, forming a U-shaped relationship. Education was found to exacerbate CO2 emissions in some cases, suggesting the need for more focused educational programs on sustainable practices. The study advocated for policies that balance natural resource exploitation with investments in green energy and educational reforms to enhance environmental sustainability.
Another investigation approached the impact of green innovation, clean energy investment, and education on environmental sustainability in major polluted Asian economies from 1991 to 2019 [23]. Employing the ARDL model, the study found that green innovation significantly reduces CO2 emissions, particularly in China, India, and Japan, while clean energy investment and education also contributed to emissions reduction in Russia and Japan. These findings suggested that intensifying efforts in green innovation, alongside increased clean energy investment and education, could significantly improve environmental sustainability in these regions. The effects of financial efficiency, education, and digitization on renewable energy consumption in China from 1994 to 2020 were further assessed [24], using the Quantile Autoregressive Distributed Lag (QARDL) approach. It found that information and communication technology (ICT), financial market development, education, GDP and CO2 emissions enhanced renewable energy consumption in both the short and long term. The research highlighted the need for policies that integrate digitalization, financial efficiency, and educational improvements to boost renewable energy consumption, aligning with sustainable development goals.
Linking prior research to regional context in terms of education and CO2 emissions, a growing body of literature has explored the role of education in shaping environmental outcomes, particularly CO2 emissions. Many studies found that higher levels of education, especially secondary and tertiary, are associated with lower emissions, as education enhances environmental awareness, promotes sustainable consumption behavior, and fosters innovation in green technologies. Educated populations are also more likely to support and comply with environmental regulations and adopt energy-efficient technologies.
However, this relationship varies by country or region, depending on socioeconomic development, institutional quality and the structure of the education system. In developed countries, education often translates directly into environmentally responsible behavior and technological advancement. In developing or transition economies, the effect may be weaker or even positive (i.e., more education equals more emissions), especially if increased education leads to higher income, greater consumption, and industrial growth without parallel environmental safeguards. This comparative analysis highlights that the impact of education on emissions is not universal but rather context-dependent, shaped by the stage of development, energy mix, policy environment, and cultural values around sustainability.

3. Methodology

The following analyses are performed in the current research aiming to reveal the relationship between CO2 emissions in metric tons per capita and their determinants (as in Figure 1).
Figure 1 presents the geographical locations of the three regions, outlines the input data used, and highlights the main econometric methods applied in the analysis. The statistical analysis was conducted using EViews 12. Manual data handling and visualization are time-consuming and may introduce inconsistencies or errors when dealing with large, multi-country datasets. Even if EViews provides robust econometric functionality, it lacks advanced automation and reproducibility features compared to more flexible programming environments. Future research could benefit from integrating tools such as R or Python for enhanced automation, reproducibility, and transparency. These platforms offer superior capabilities for dynamic visualization, custom modeling and integration with machine learning techniques, which could enrich both the descriptive and inferential aspects of the analysis.

3.1. Cross-Sectional Dependence

Cross-sectional dependence (CD) refers to a scenario in econometrics and statistics where individual units in a panel data set exhibit interdependencies, meaning that the values in one unit can be correlated with the values in other units. This is an important aspect to consider in data analysis because ignoring CD can lead to biased and inefficient estimators and may result in misleading inference. Several tests can be used to detect the presence of CD in panel data, including the Breusch and Pagan Lagrange Multiplier (LM) test [25,26], scaled LM test, and the Pesaran CD test. Originally developed for testing heteroskedasticity, the Breusch and Pagan LM test has been adapted to check for CD in panel data. Pesaran’s CD test calculates pairwise correlation coefficients between the units in the panel and determines if the average correlation is significantly different from zero. The Pesaran (2004) [26] scaled LM test, formally known as the scaled LM test for error cross-sectional dependence in panel models, is a widely used statistical test designed to detect CD in large panel data sets. This test is particularly relevant in scenarios where the number of cross-sections (N) is large and possibly greater than the number of periods (T), which is common in economic and financial applications. Ignoring the CD when it is present can have several implications. Estimators might be biased if the model incorrectly assumes independence across cross-sections. The efficiency of estimators might be compromised, leading to poor model performance and erroneous conclusions.
Data stationarity is tested by means of two generations of Panel Unit Root Tests (PURT). The first generation of these tests assumes that there is no CD between the units (e.g., different countries, companies, etc.) in the panel. This implies that each unit is affected independently by its unique shock or characteristic, without any spillover effects from other units. Prominent tests in this category include the Im, Pesaran, and Shin (IPS) test [27], the ADF–Fisher Chi-square (ADF) test [28], and the Levin, Lin and Chu (LLC) test [29]. Second generation PURT are developed in response to the recognition that the assumption of independence among cross-sectional units is often unrealistic, particularly in economic and financial data. These tests account for possible cross-sectional dependencies, meaning that shocks affecting one unit can also impact others. This is particularly important in the context of globalization and economic integration where economic or policy changes in one country can affect others. Notable tests in this category include the cross-sectionally augmented IPS (CIPS) test [30], which is an extension of the IPS test, designed to handle CD by incorporating common factor structures in the error terms.
The results of the cross-sectional dependence tests, consistently reject the null hypothesis of no cross-sectional dependence at the 1% significance level for all three regional groups. This empirical evidence supports the necessity of employing second-generation panel unit root tests and econometric techniques that explicitly account for cross-sectional dependence. Accordingly, the subsequent methodology adopts such approaches to ensure the validity of inference across the SEE, Baltic, and Nordic country panels.

3.2. First-Generation PURT

Next, we briefly explore the theoretical foundations of the three first-generation PURT used in our data analysis.

3.2.1. LLC Panel Unit Root Test

The LLC test aggregates individual time series to improve the test power compared to separate unit root tests on each series. It takes into account cross-sectional dependencies and time dynamics, making it suitable for data sets where the cross-sectional units are believed to share similar stochastic trends. The authors of [29] introduced a panel unit root test derived from an ADF model, based on the following basic model:
X i t = α i + β i X i t 1 + δ i t + j = 1 k γ i j X i t 1 + ε t ,
where Δ is the first difference operator, X i t is the dependent variable i at time t, and ε t is the error term. In Equation (1), β i and the lag order γ i j can differ among sections. The null hypothesis is H0: β 1 = β 2 = = β = 0 , and the alternative hypothesis is H1: β 1 = β 2 = = β < 0 .
The test statistic is t β i = β ^ i σ ( β ^ i ) , where β ^ i is the Ordinary Least Squares estimate of β i and σ ( β ^ i ) is the standard error.

3.2.2. IPS Panel Unit Root Test

Unlike the LLC test, which assumes a common autoregressive parameter across all units in the panel, the IPS test allows for heterogeneity in the autoregressive coefficients across different cross-sections. The IPS test is based on averaging individual Dickey–Fuller (or augmented Dickey–Fuller) test statistics from each series in the panel Equation (1). Time series can have a unique autoregressive process, making the IPS test more flexible when the assumption of homogeneity in the LLC test is too restrictive. This feature is particularly advantageous in panels where individual units might experience different shocks or have different dynamics, and these individual characteristics need to be accounted for. The hypothesis tested in the IPS test is similar to that in standard unit root tests: it tests the null hypothesis of non-stationarity against the alternative of stationarity. However, the alternative hypothesis is that at least one cross-sectional unit in the panel is stationary, which differs from the LLC’s collective stationarity hypothesis. Therefore, it is assumed that H0: β 1 = β 2 = = β N = 0 , and H1: some but not necessarily all β i < 0 . As previously noted, the IPS test calculates the average of the individual t-statistics. The t-bar statistic used to examine the order of integration under the null hypothesis ( β i = 0 ) is defined as follows:
t ¯ = i = 1 N t β i N .
In Equation (2), the t statistic is obtained from the panel cross-sections, while N is the sample size. t   ¯ follows a normal distribution. Consequently, t   ¯   will be converted into a standardized normal z-bar statistic, z ¯   , which is expressed as follows:
z ¯ = N t ¯ E t ¯ β i = 0 V a r t ¯ β i = 0 .
In Equation (3), E t ¯ β i = 0 and V a r t ¯ β i = 0 are the mean and variance of t β i . They are computed by Monte Carlo methods [28].

3.2.3. Fisher-Type PURT

The Fisher-type PURT tests are used to determine whether a unit root exists in a panel data set. These tests were developed by Dickey and Fuller [31] and later adapted by Maddala and Wu (1999) [28] and Choi [32] for use in panel data scenarios. The Fisher-type tests combine p-values from individual unit root tests across different cross-sectional units (like countries) into a single test statistic. These tests enhance the reliability of inferences drawn from the panel data by accommodating diverse dynamics and integrating information from multiple sources. They are especially useful because they allow for heterogeneity in the individual series within the panel, acknowledging that different units may have different stochastic properties.

3.3. Second-Generation PURT

The CIPS test introduced by Pesaran in 2007 is a method for detecting unit roots within panel data that exhibit CD [30]. The test statistic for the CIPS test is defined as follows:
C I P S N , T = N 1 i = 1 N t i ( N , T ) ,
where t i ( N , T ) represents the ADF statistic for the cross-section i.
As reported in the results section, the CIPS test results confirm that all variables are integrated of order one, I(1), after first differencing. This consistency across all country groups validates the decision to apply the panel ARDL framework in the next stage of analysis. The joint use of both first- and second-generation PURT ensures robustness in handling heterogeneity and interdependence among panel members.

3.4. Panel ARDL

The panel ARDL (Autoregressive Distributed Lag) model is a statistical approach used for analyzing the dynamic relationship between variables over time across different entities, such as countries, regions or companies. This model is particularly useful when dealing with panel data, which includes observations over multiple time periods for several cross-sectional units. The main advantage of a Panel ARDL model lies in its ability to accommodate variables integrated of different orders (I(0), I(1), etc.), which means it can handle both stationary and non-stationary data. Another feature of this model is the Error Correction Term (ECT), derived from the long-term relationship, which indicates how quickly variables return to equilibrium after a change.
According to [33], the ARDL(p,q) model is given by
Y i t = j = 1 p φ i j Y i t j + j = 0 q δ i j X i t j + ϑ i + ϵ i t .
In Equation (5), i = 1 ,     ,     N is the cross-section index, t = 1 ,     ,     T is the time index, X i t represents the independent variables, ε i t is the error term, ϑ i is the fixed effect, and p and q are lag numbers. The Error Correction Model is.
Y i t = Φ i Y i t 1 + θ i X i t + j = 1 p 1 φ i j Δ Y i t j + j = 0 q 1 δ i j Δ X i t j + ν i + ϵ i t .
In Equation (6), Φ is ECT, θ i describes the long-run equilibrium between Y i t and X i t , φ i j , and δ i j are short-run coefficients. Y i t and X i t are cointegrated if ECT is between −1 and 0 and statistically significant.

3.5. Dumitrescu–Hurlin Panel Causality Test
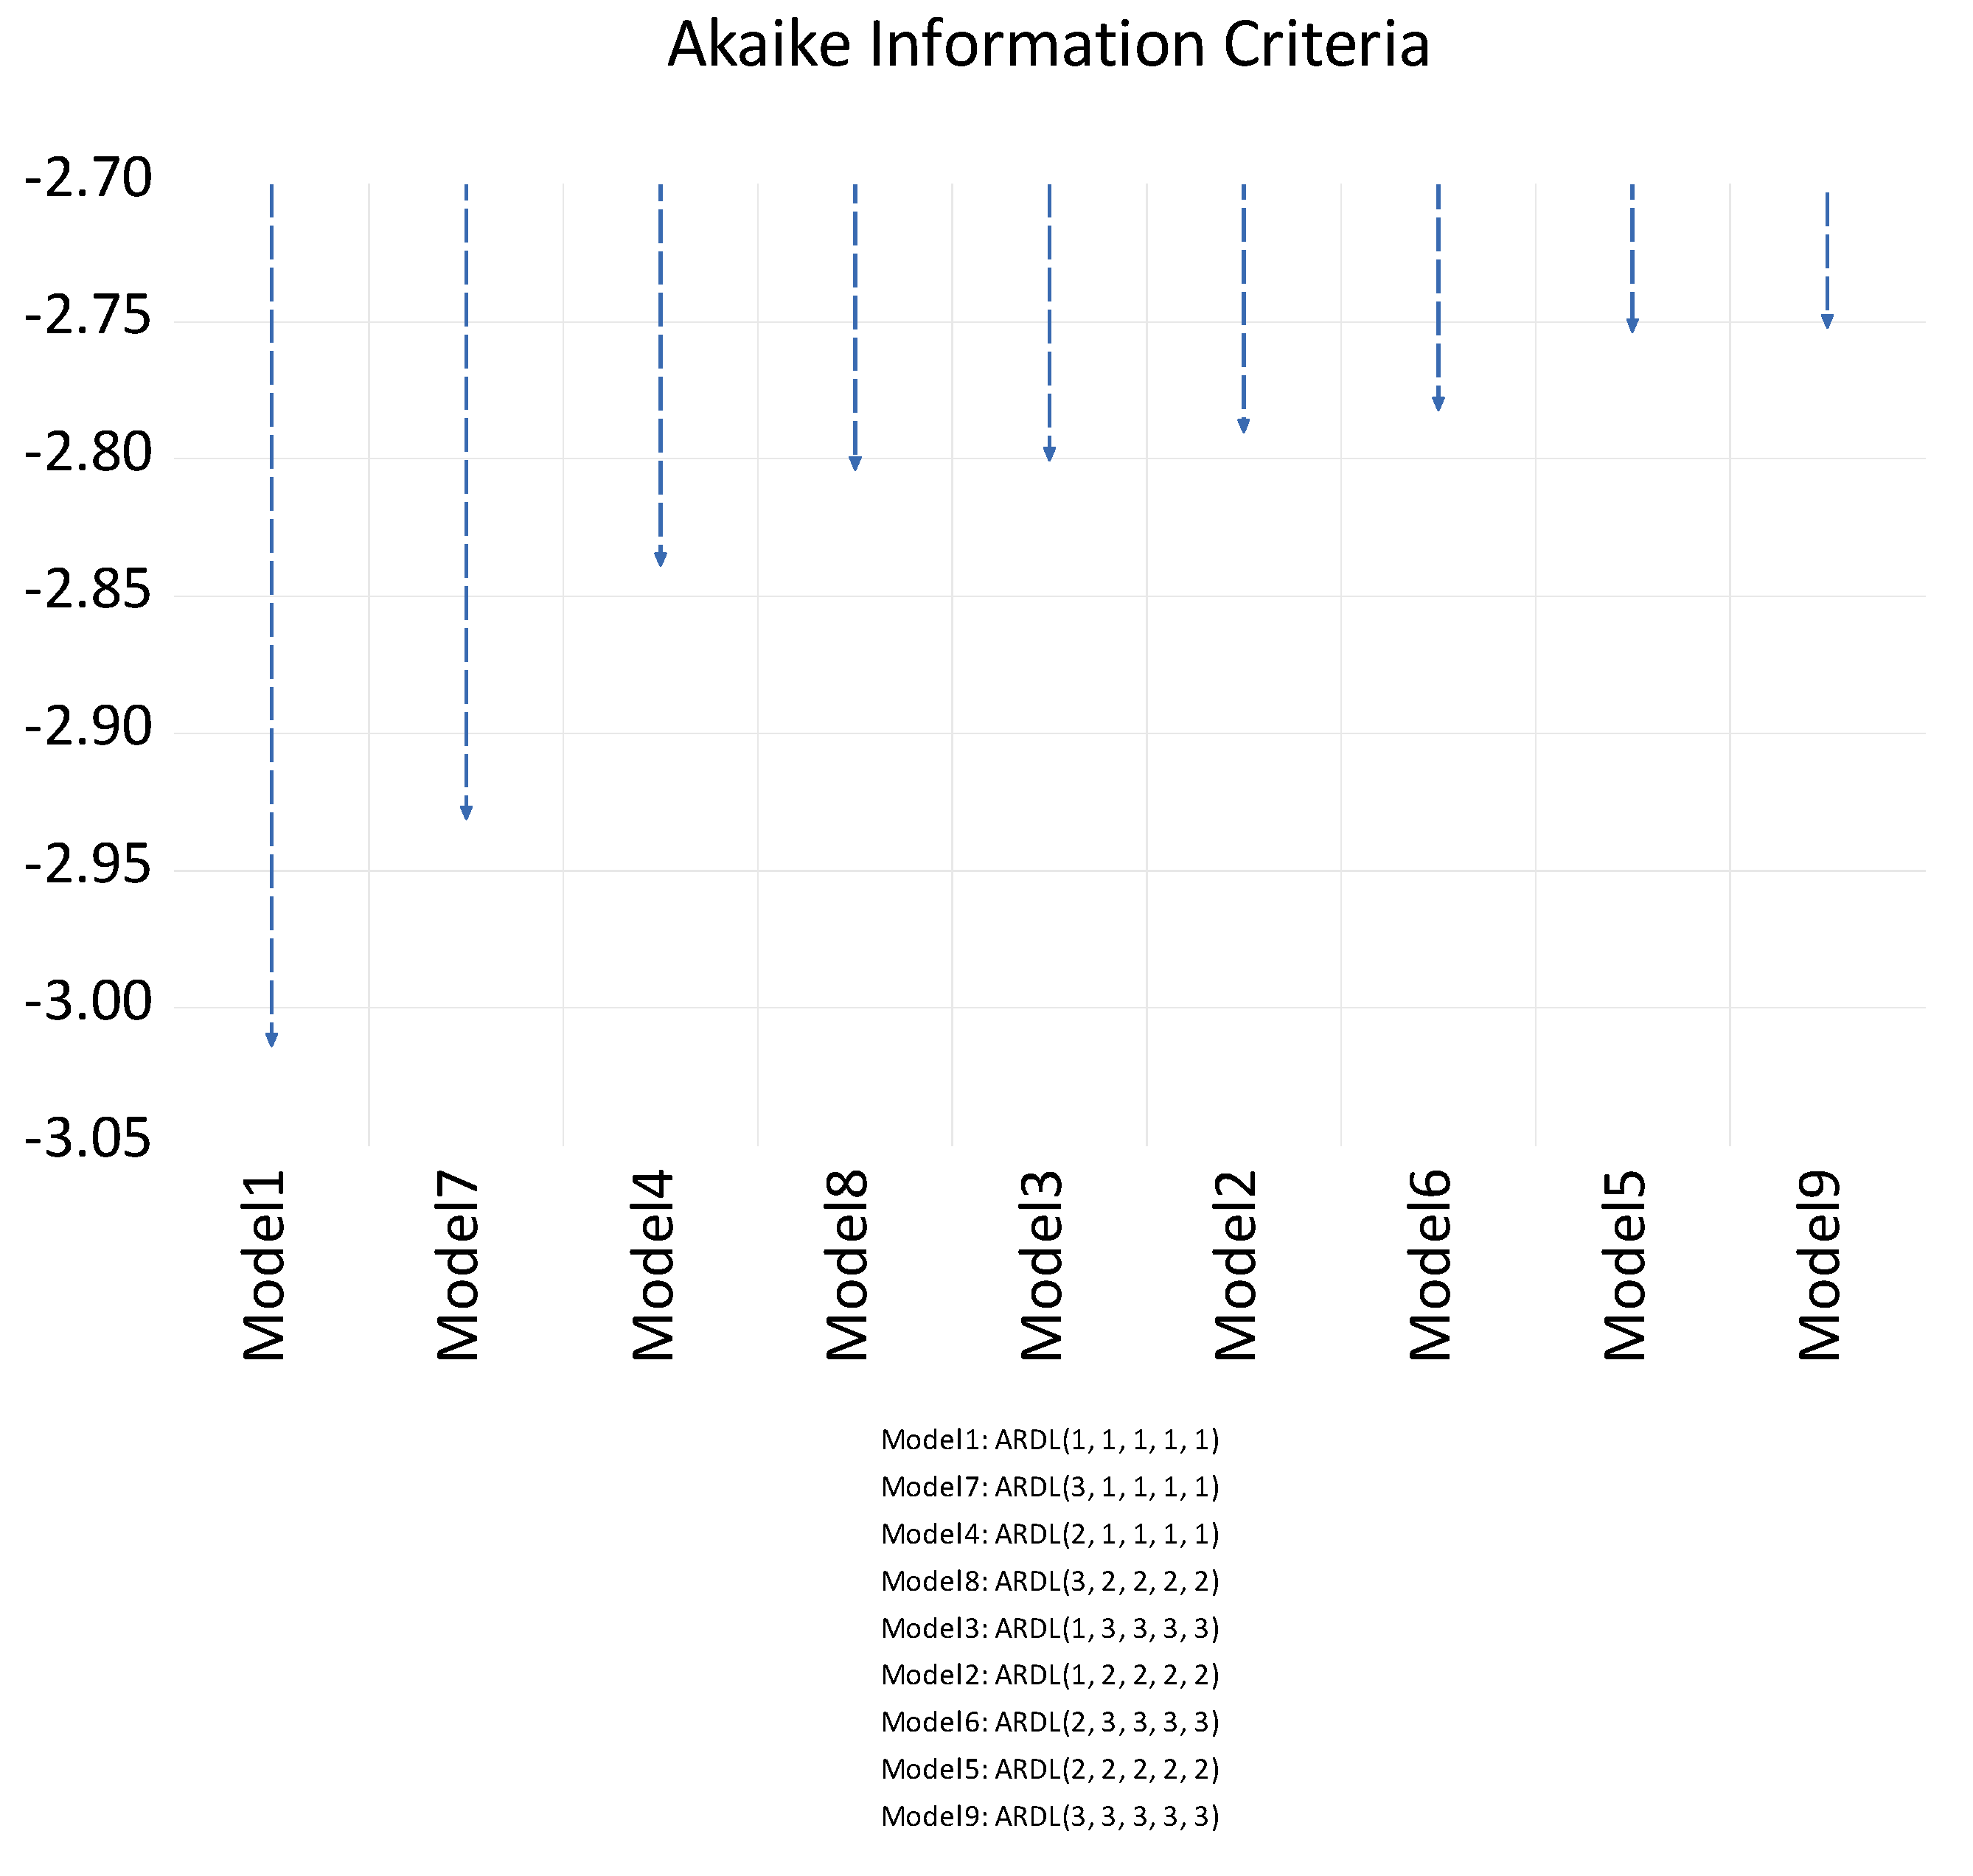
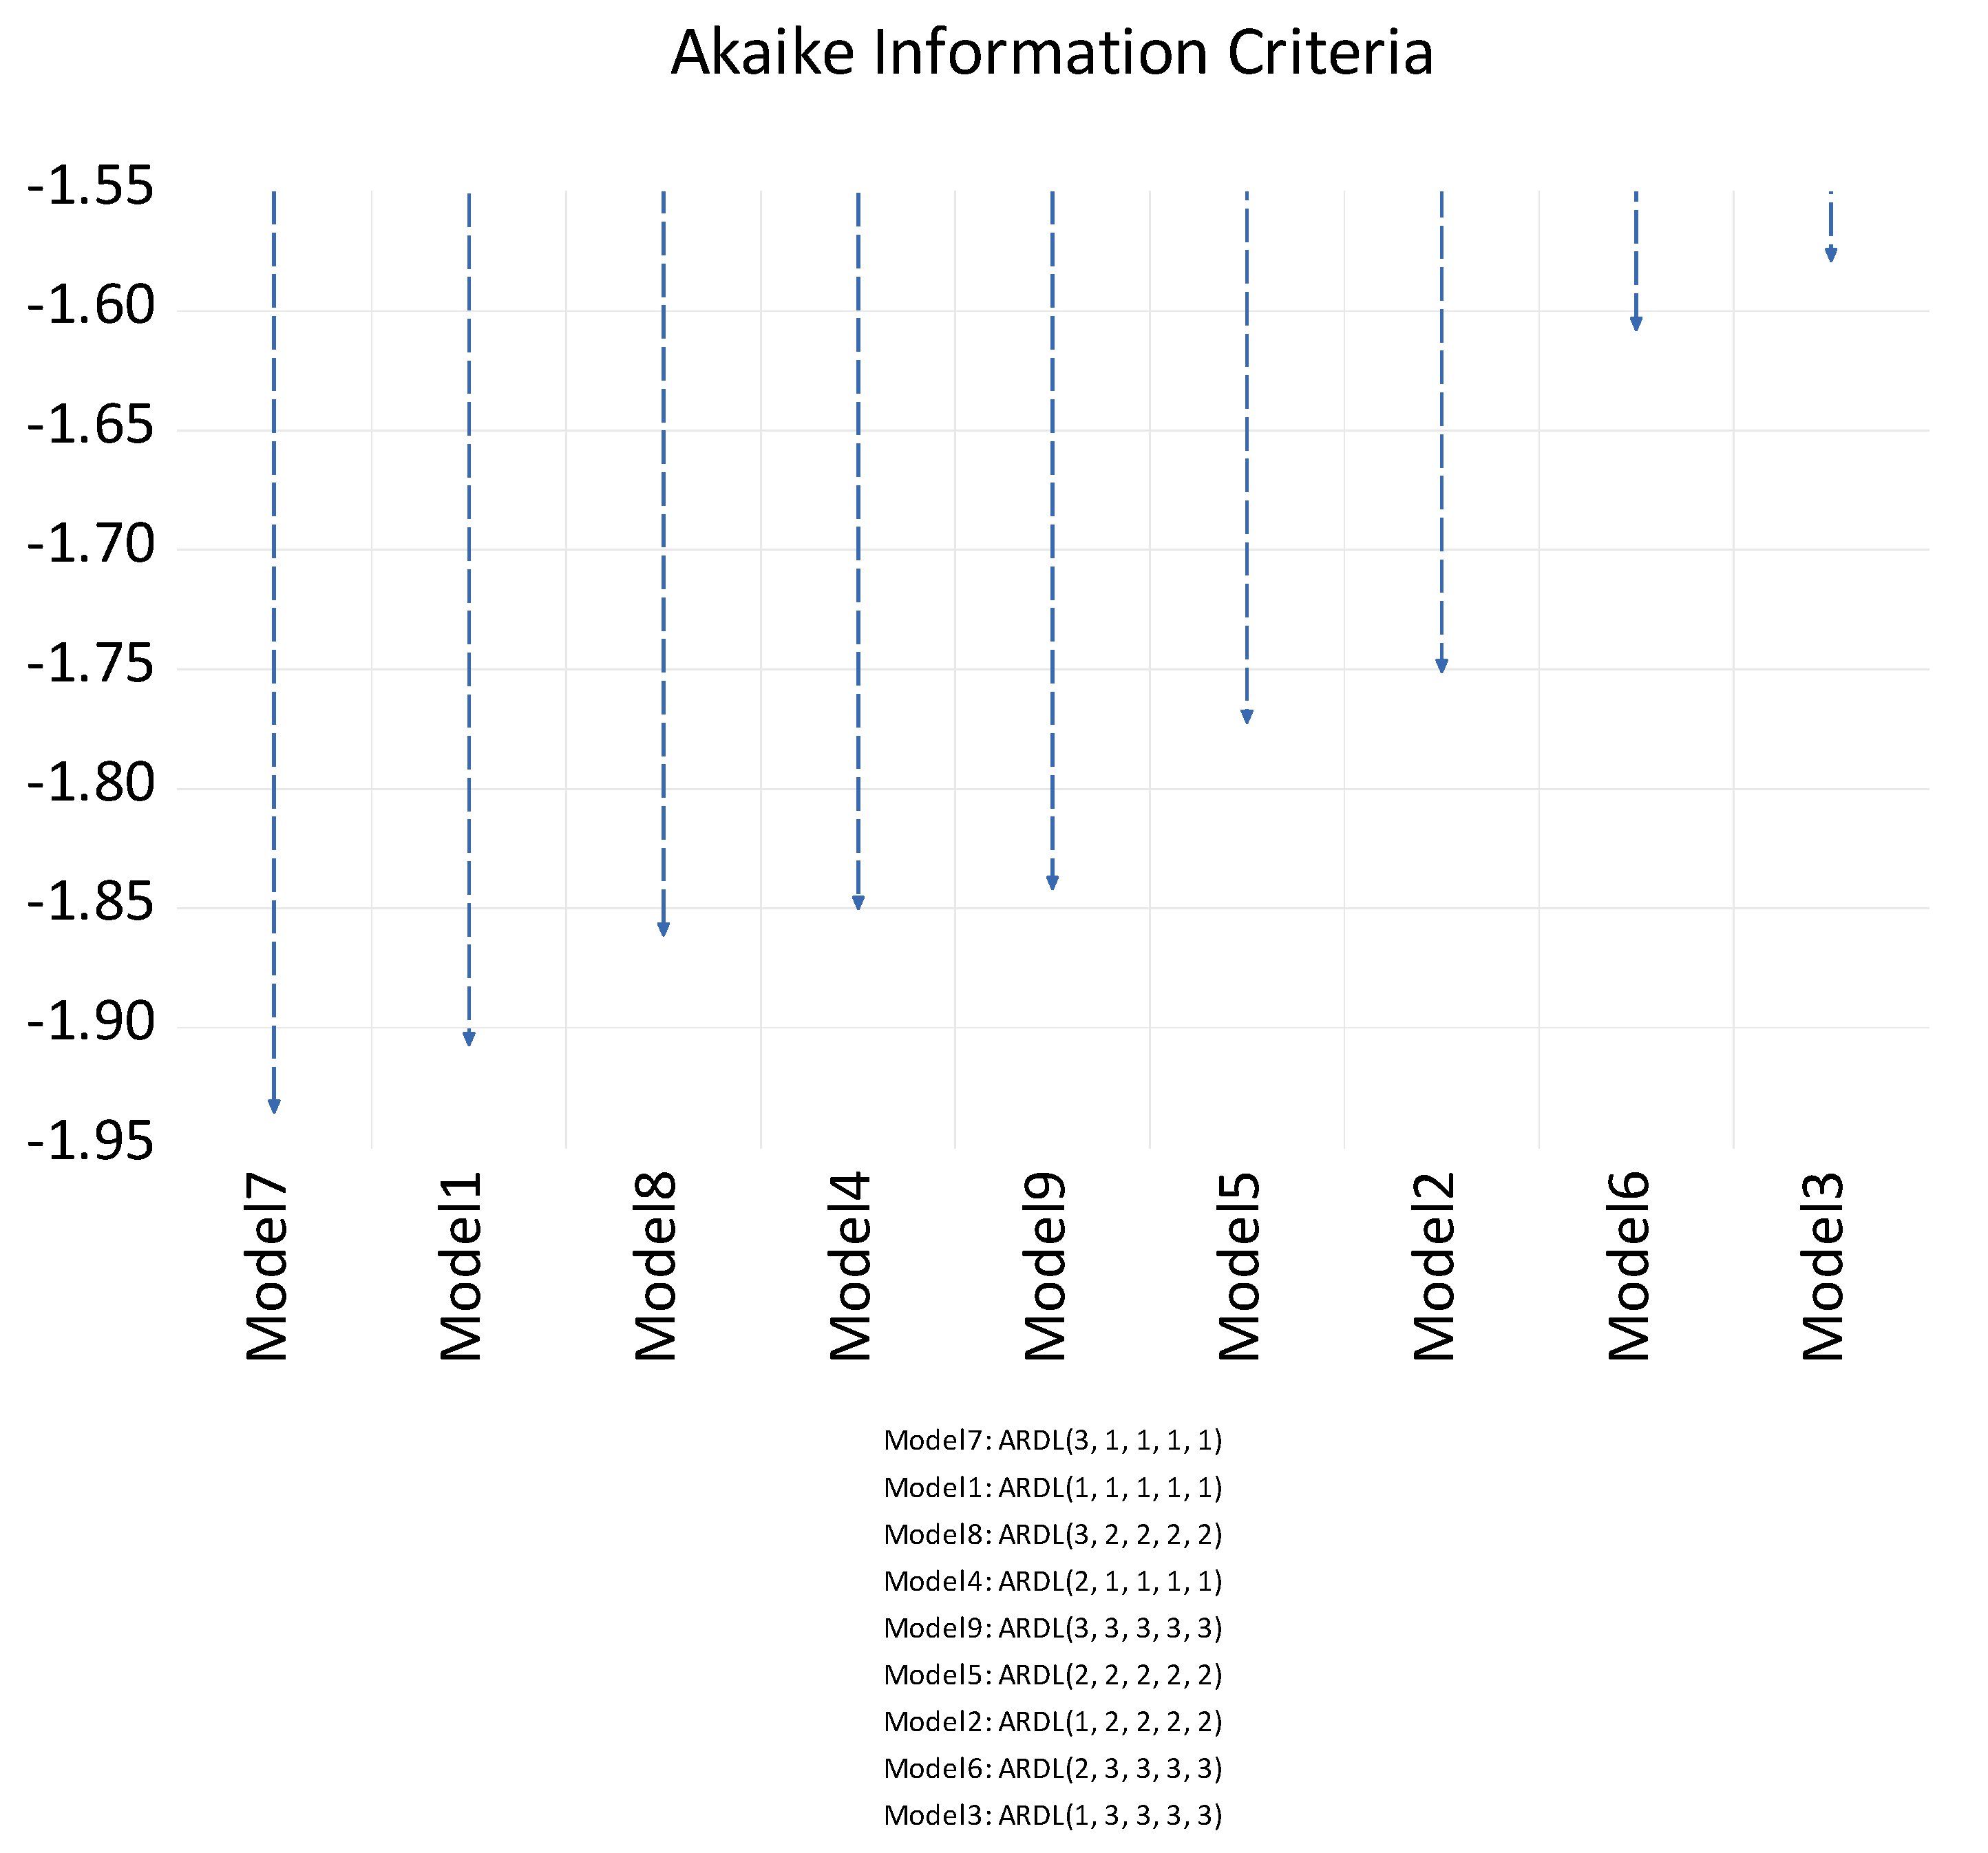
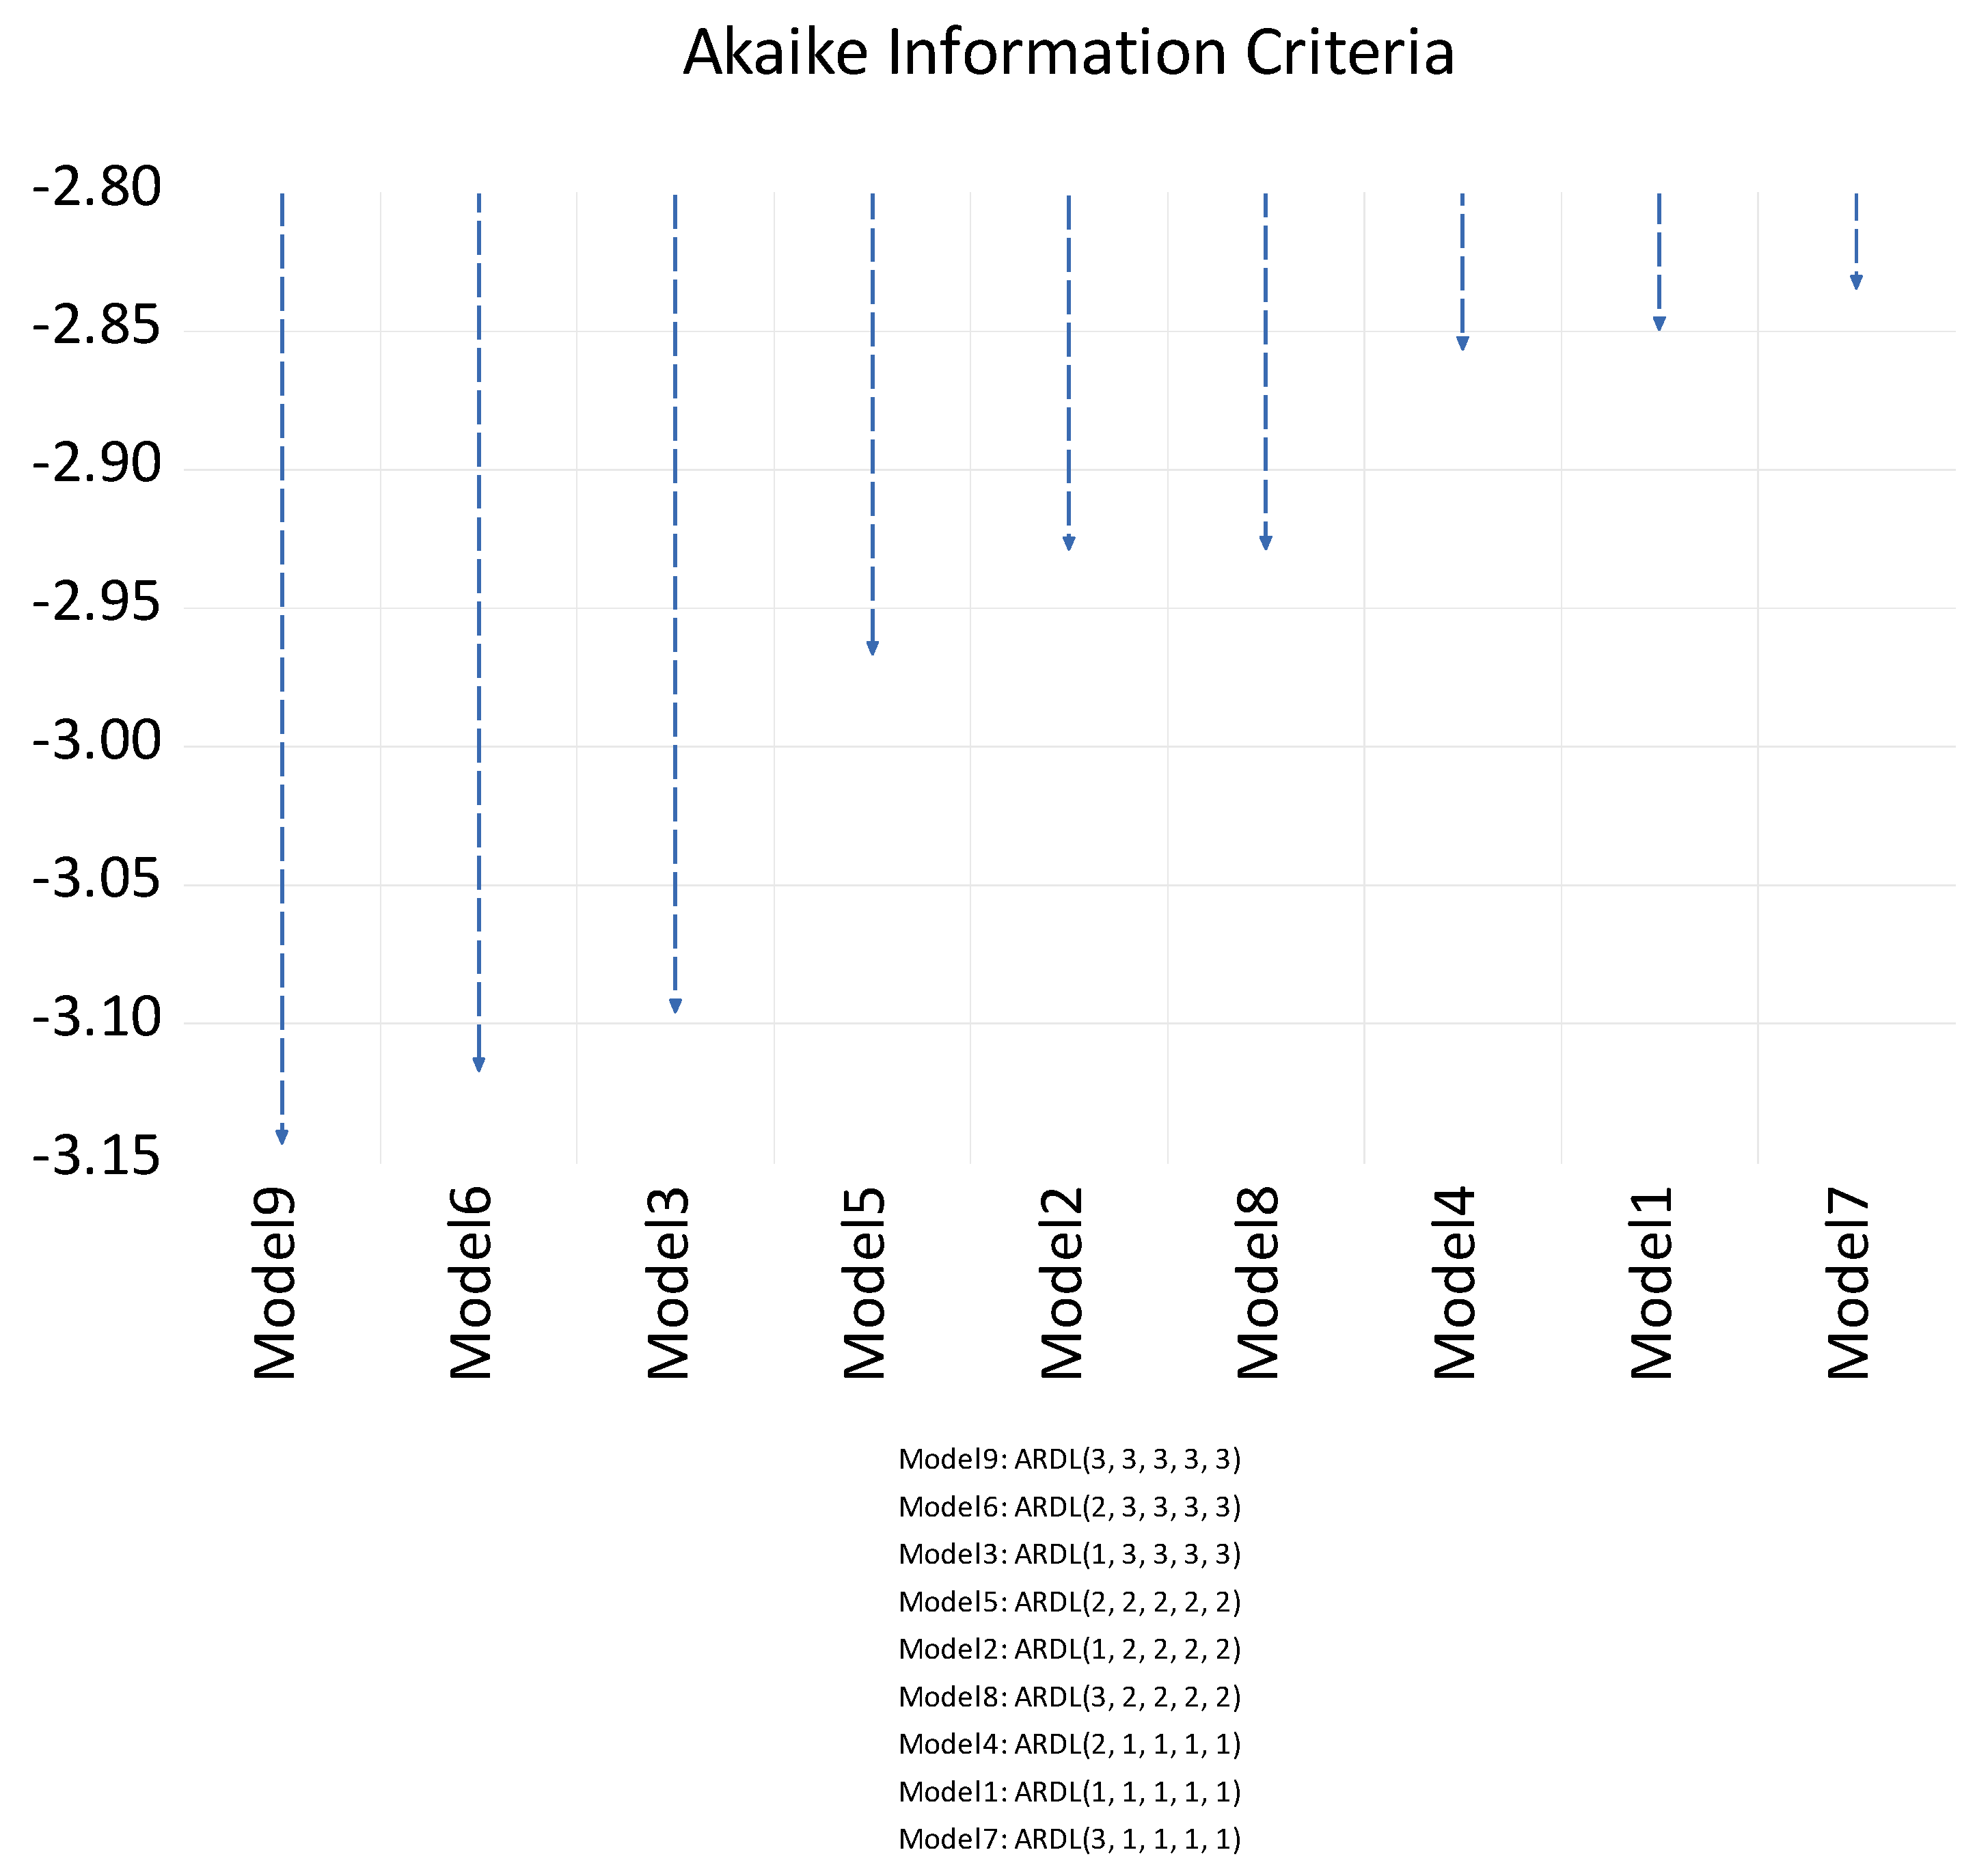
Dumitrescu and Hurlin test is particularly useful in settings where the cross-sectional units are not cross-sectionally correlated.
Y i , t = α i + k = 1 K γ i ( k ) Y i , t k + k = 1 K β i ( k ) X i , t k + ε i , t .
where i = 1 ,     , N , β i = ( β i 1 ,     , β i ( K ) ) , α i is the constant, γ i ( k ) are autoregressive parameters, and β i ( k ) are the regression coefficient slopes. The lag order K remains consistent across all cross-sections and N represents the total number of cross-sections within the panel.
The test evaluates the null hypothesis of non-causality for all cross-sectional units. This means it tests whether changes in one variable do not systematically precede changes in another across all entities in the panel.
H 0 :   β i = 0 , i = 1 , , N
is against the alternative hypothesis H1:
H 1 :   β i = 0 , i = 1 ,     , N 1 β i 0 , i = N 1 + 1 ,     , N .
The test uses a Wald statistic to examine the average of individual Wald statistics of Granger non-causality tests for each cross-sectional unit in the panel. It aggregates unit-specific tests to determine if there is an overall causal relationship within the panel. The average Wald statistic is
W a l d N , T = 1 N i = 1 N W a l d i , T ,
where W a l d i , T is the Wald statistic for the cross-section i.

4. Results

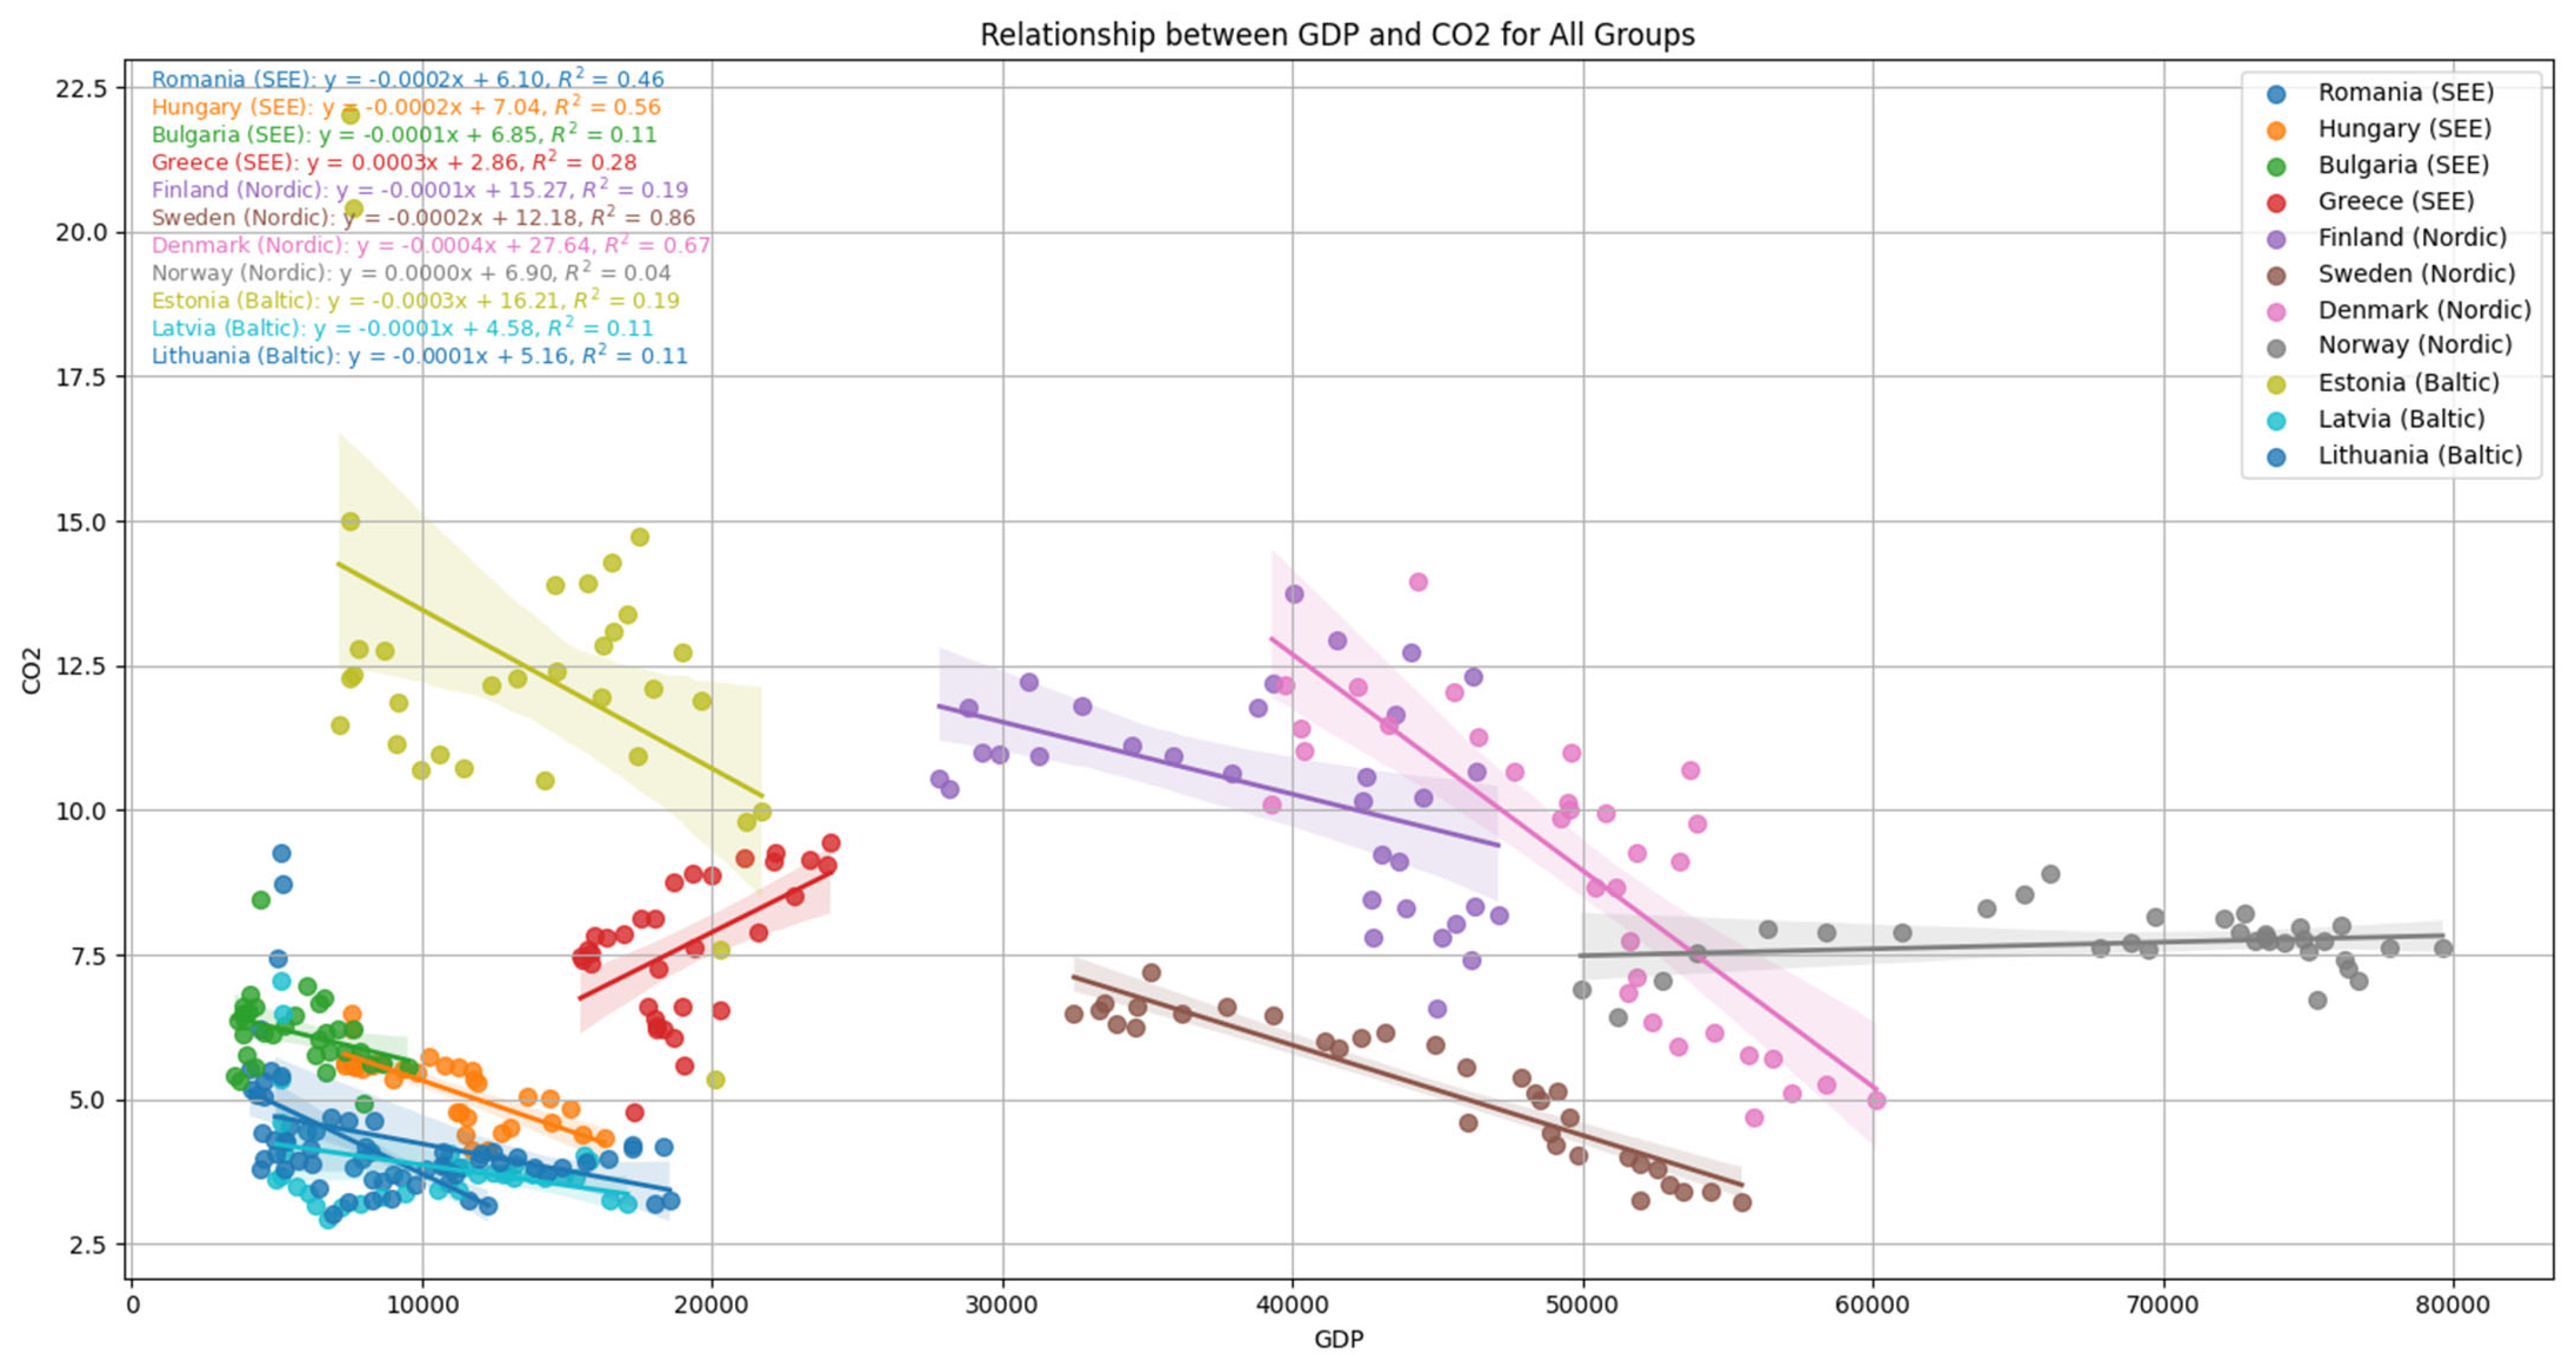
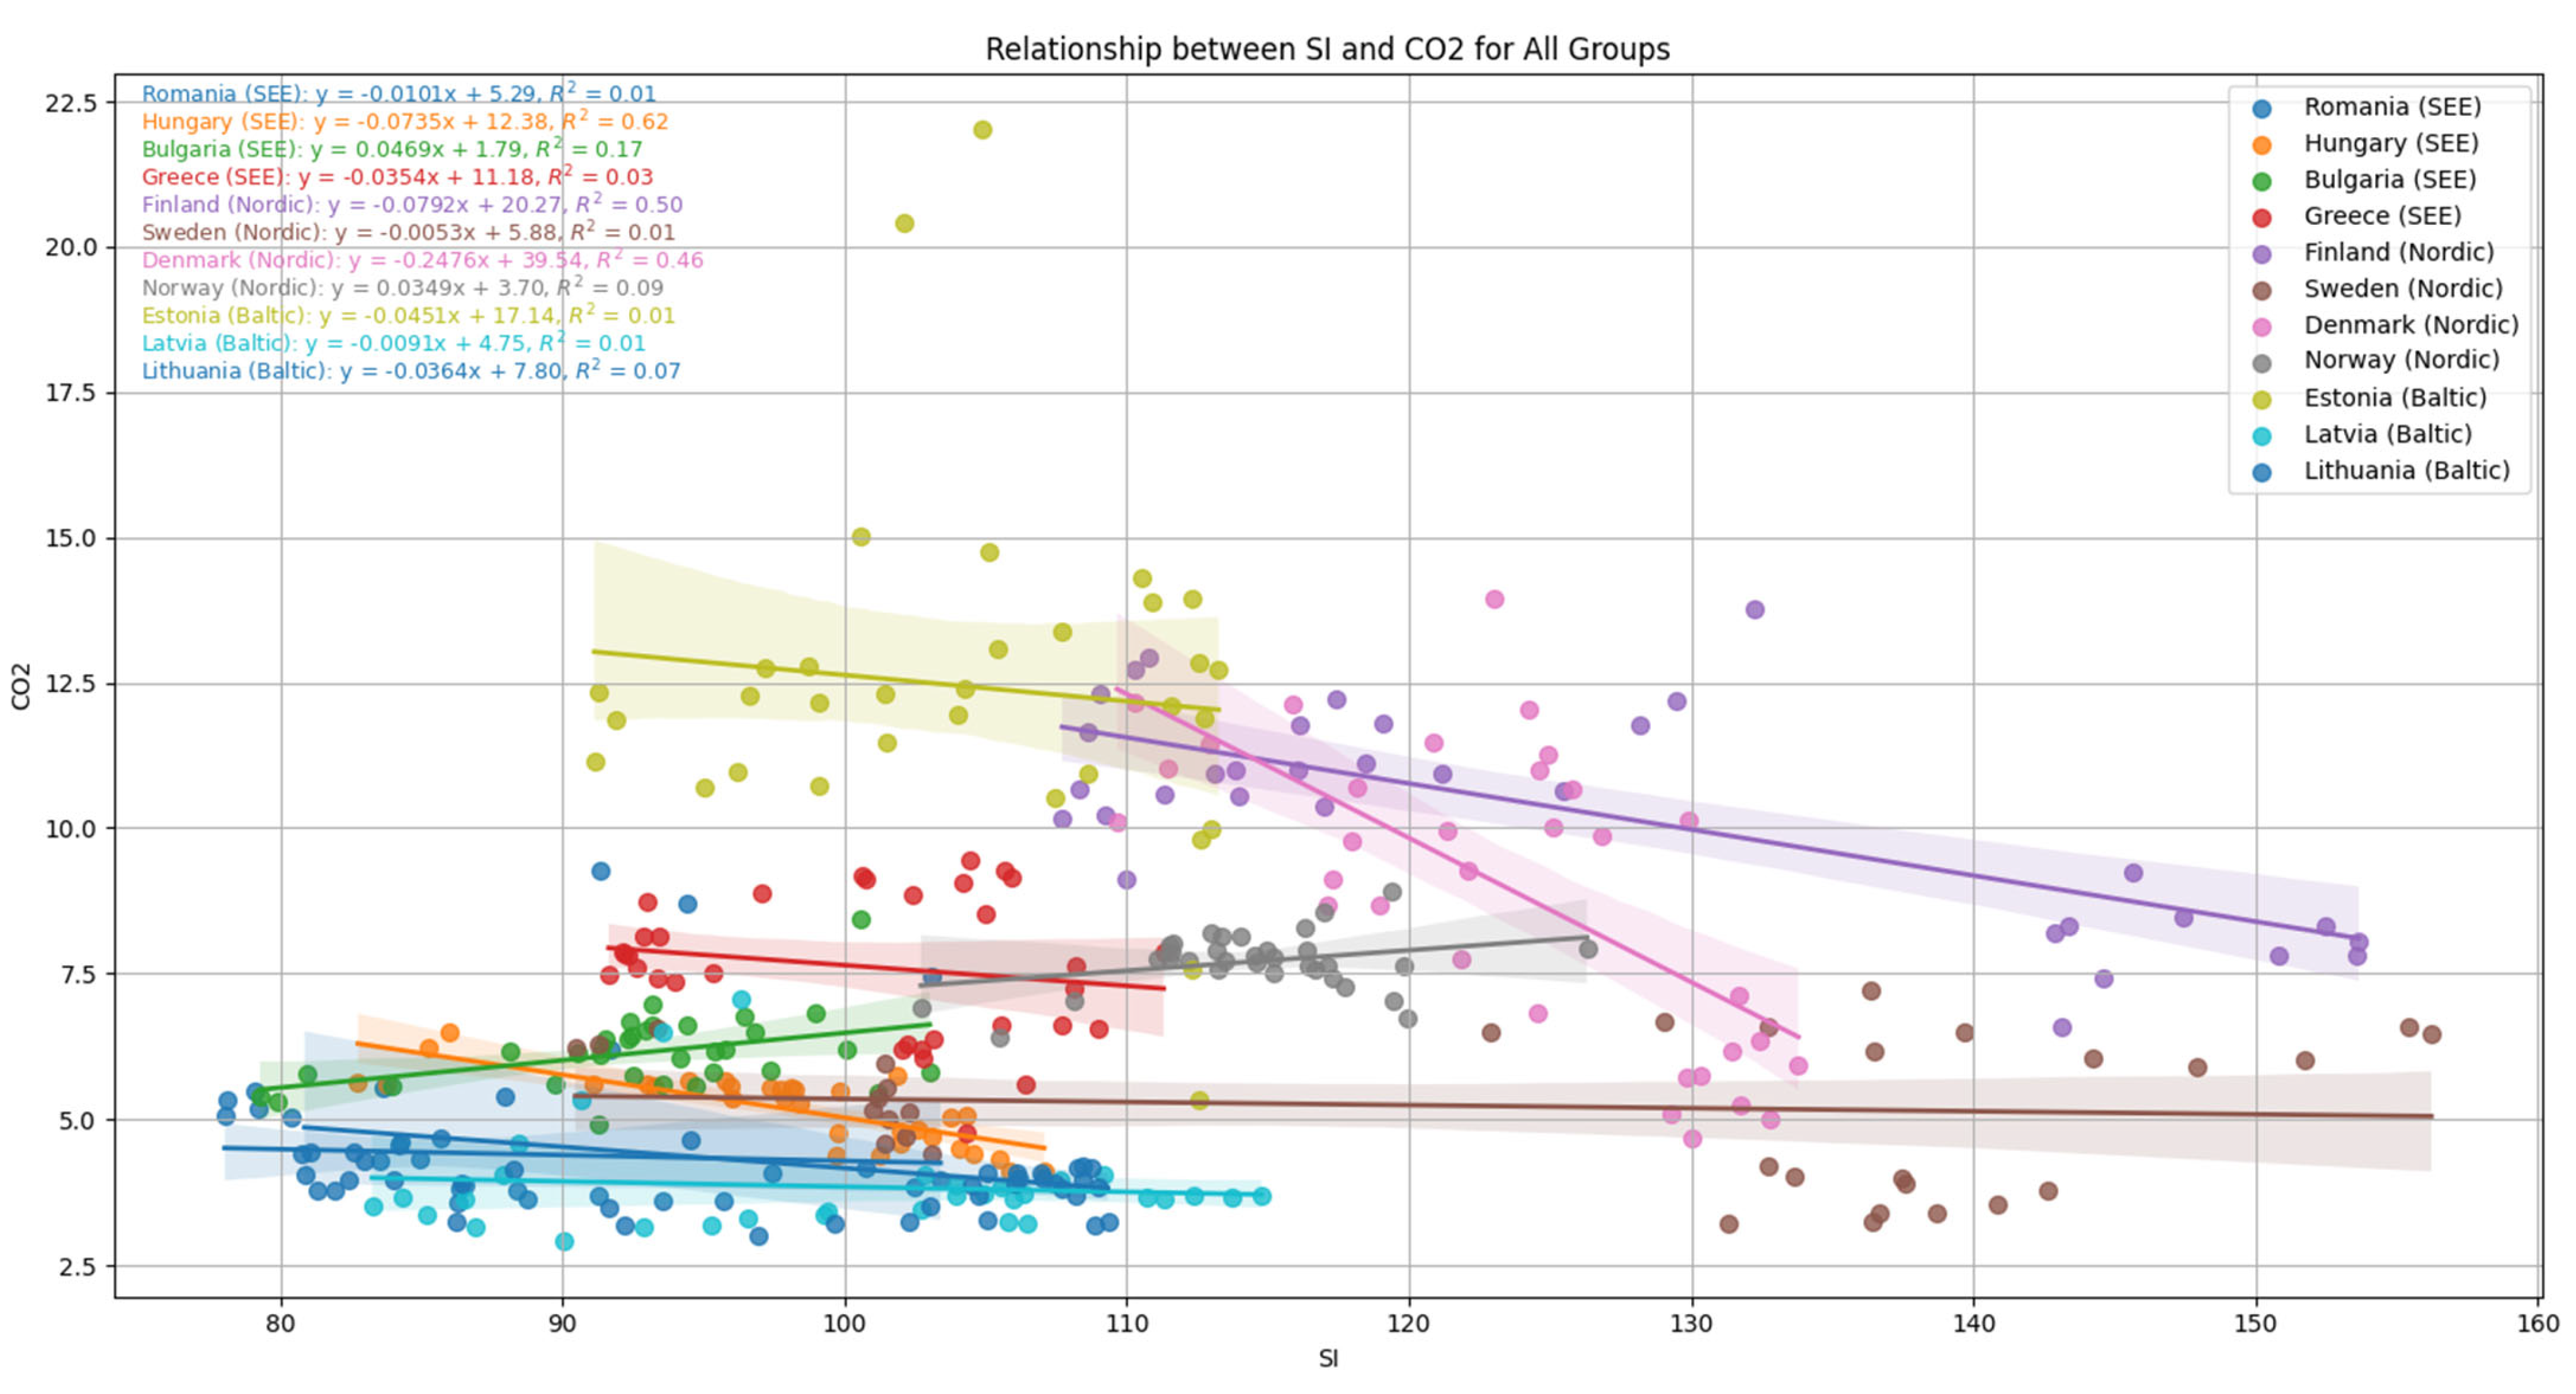
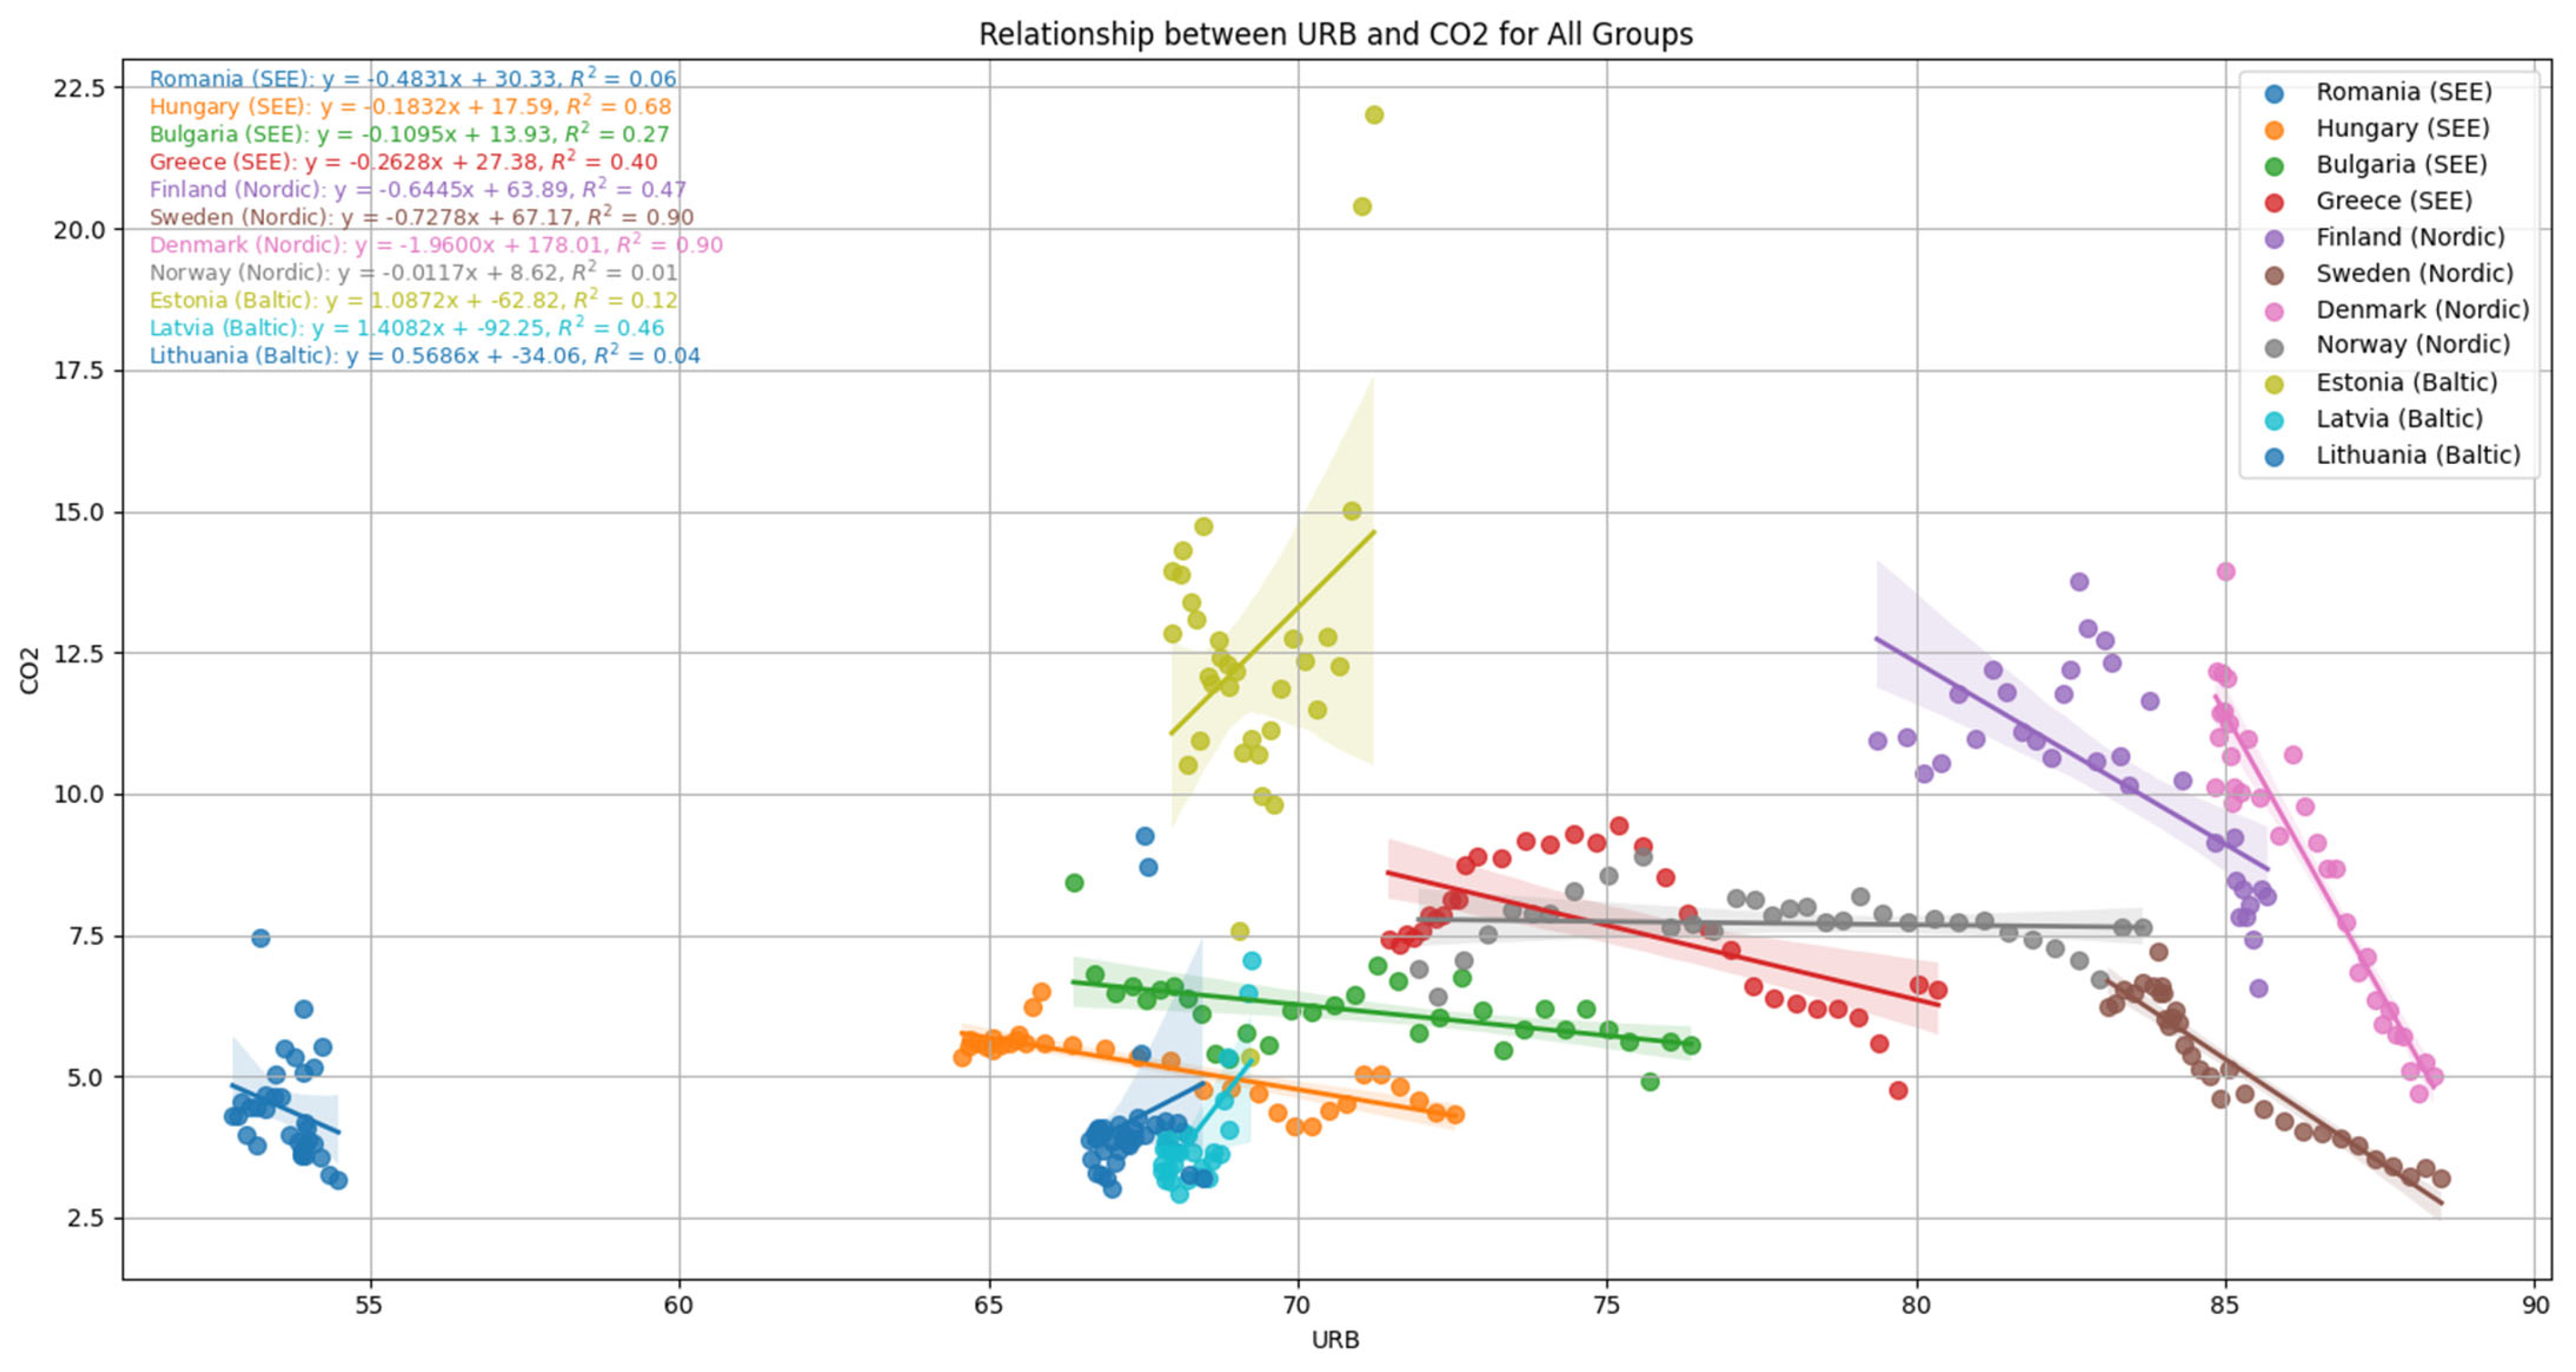
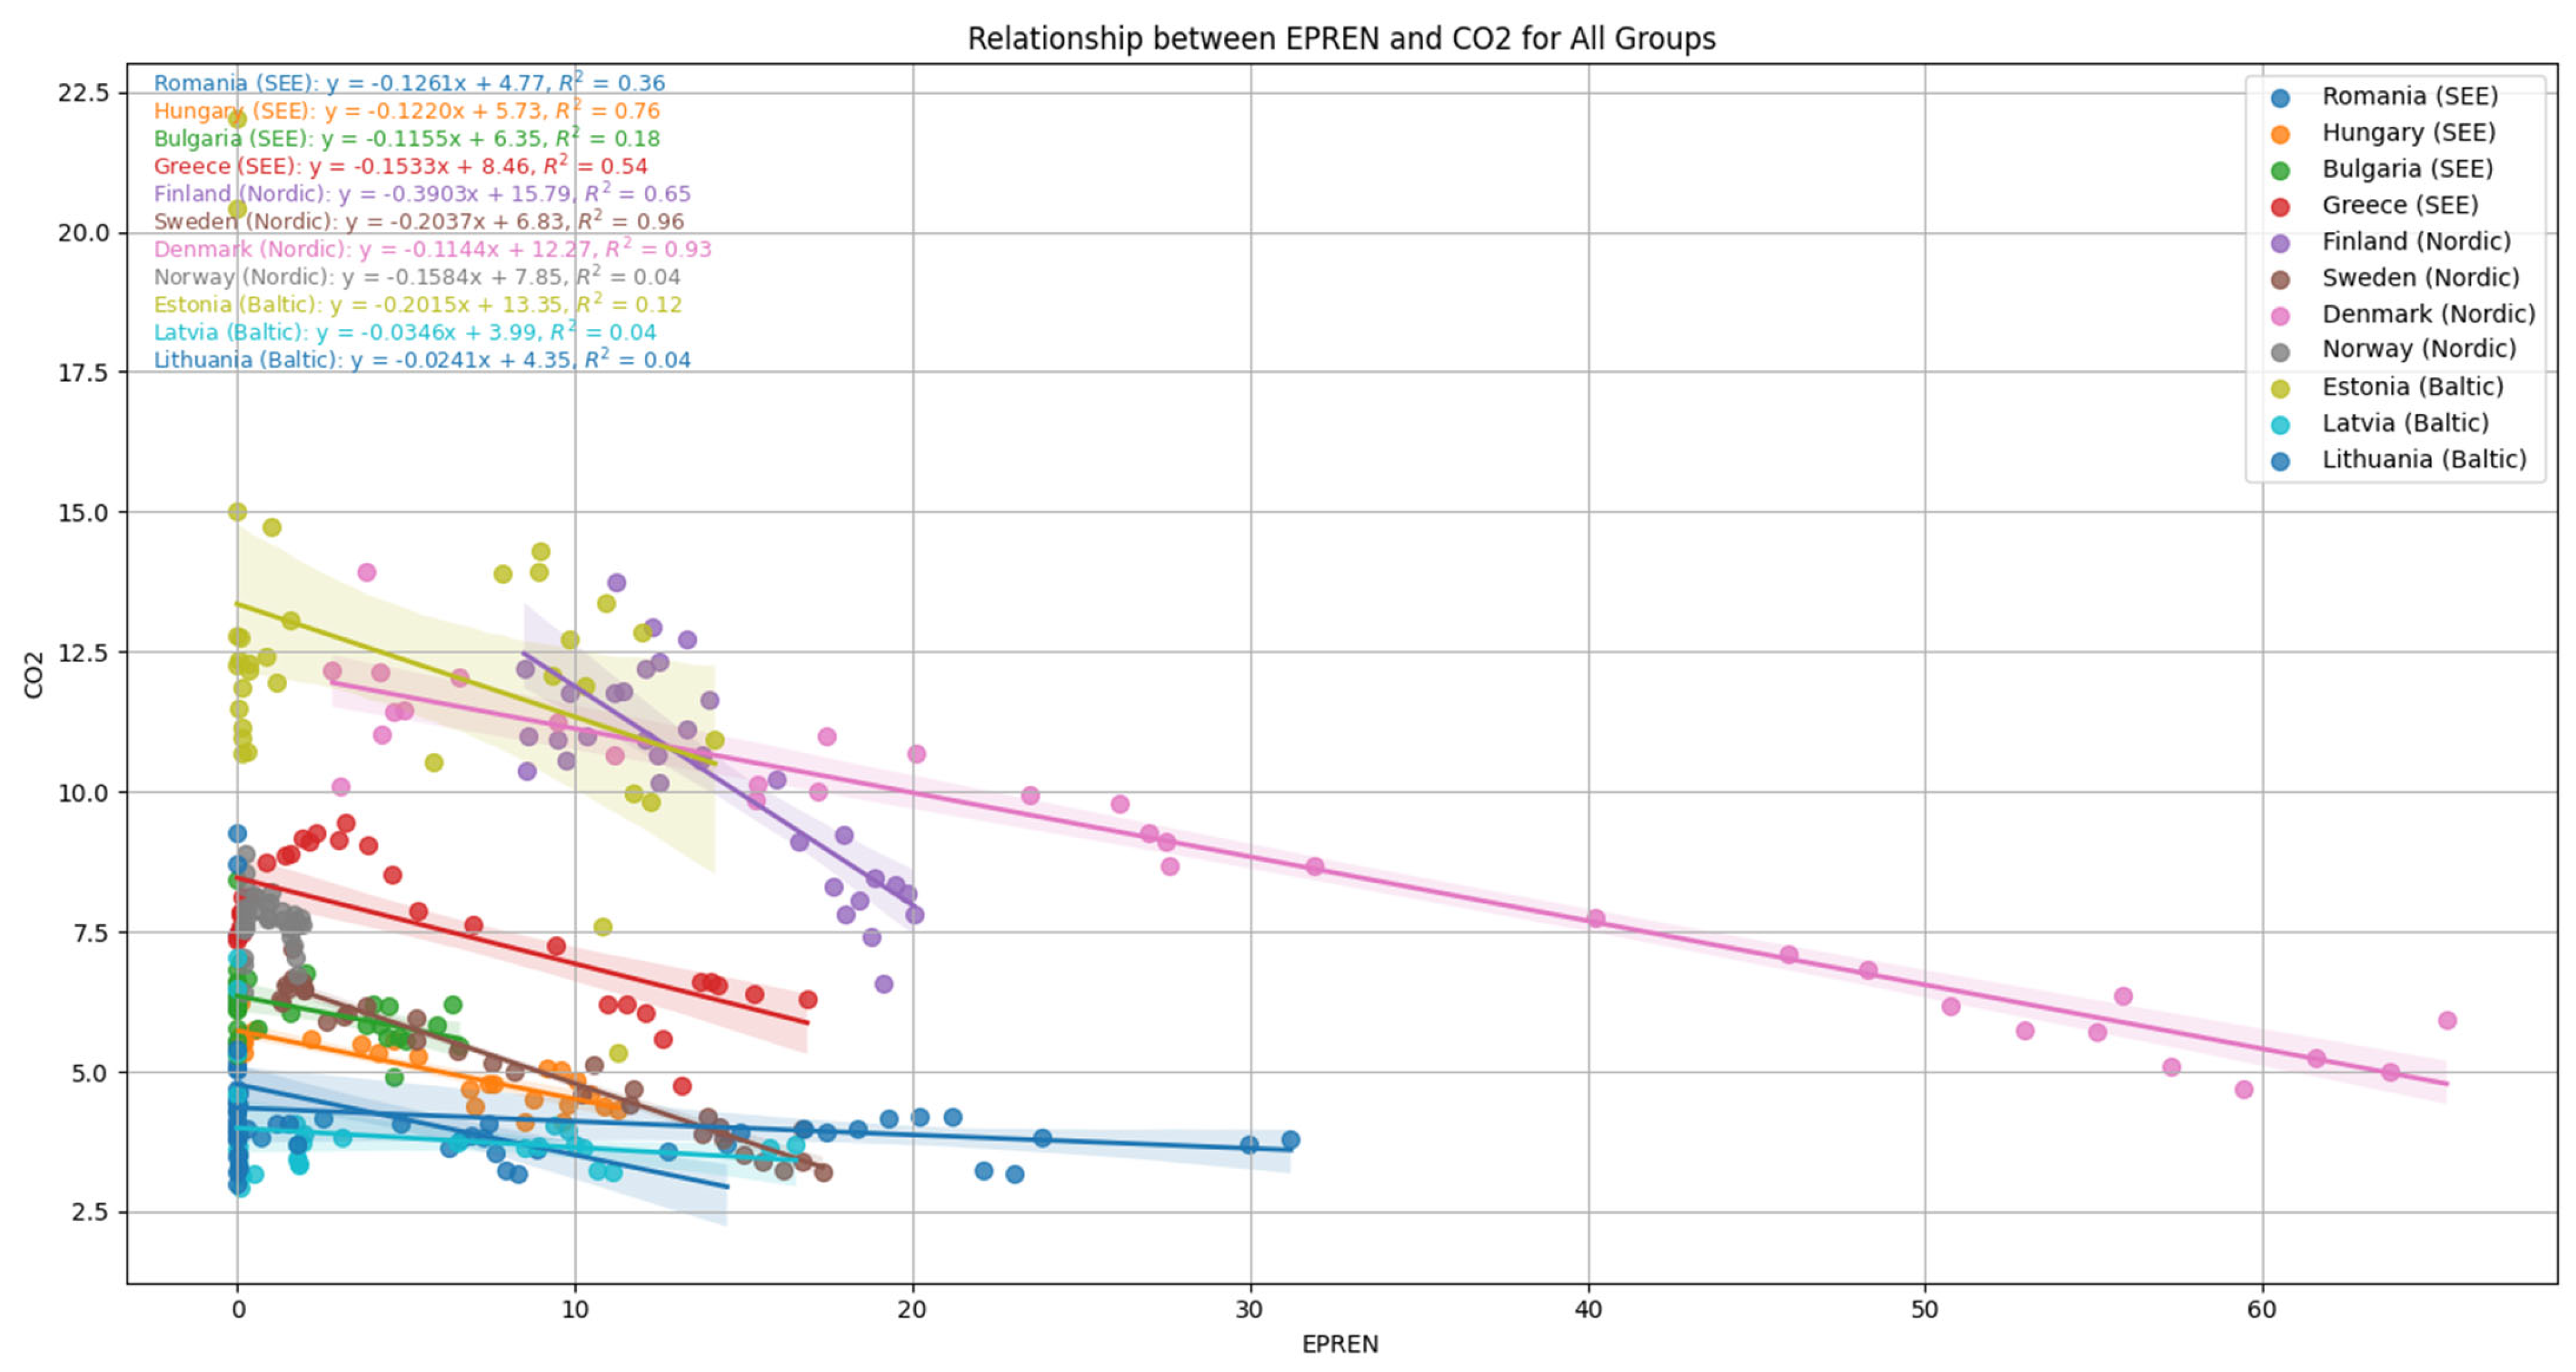
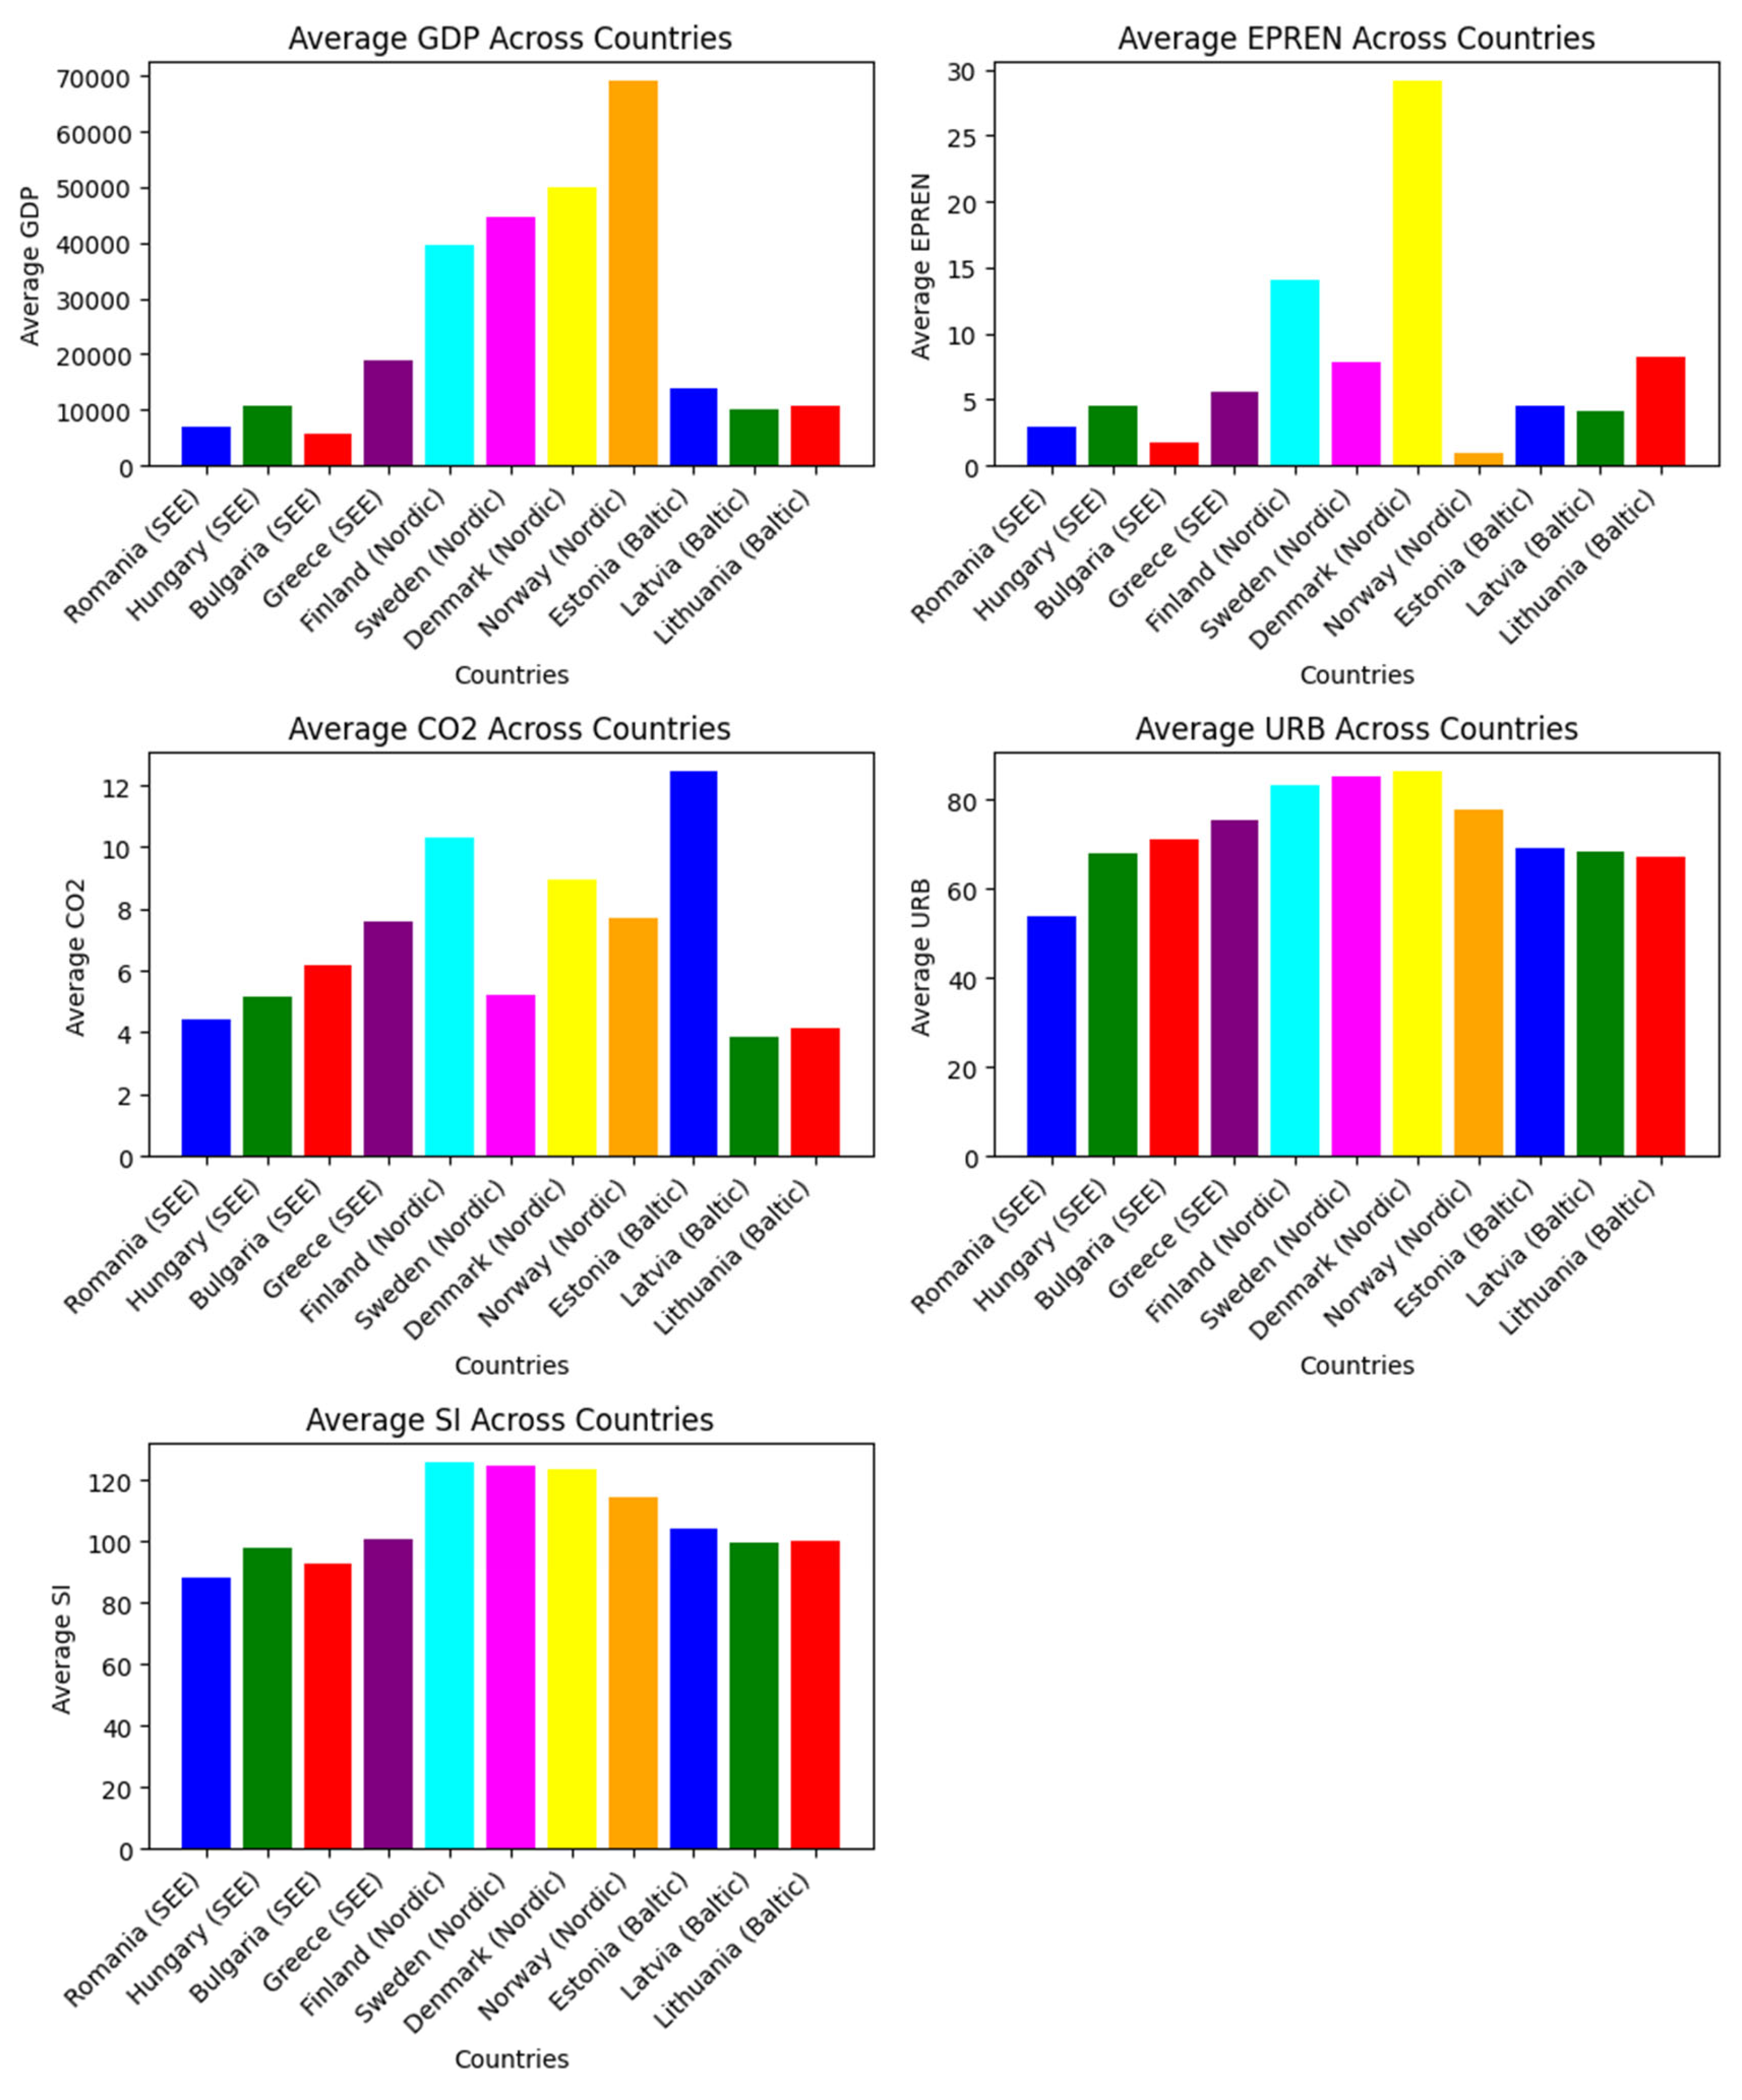
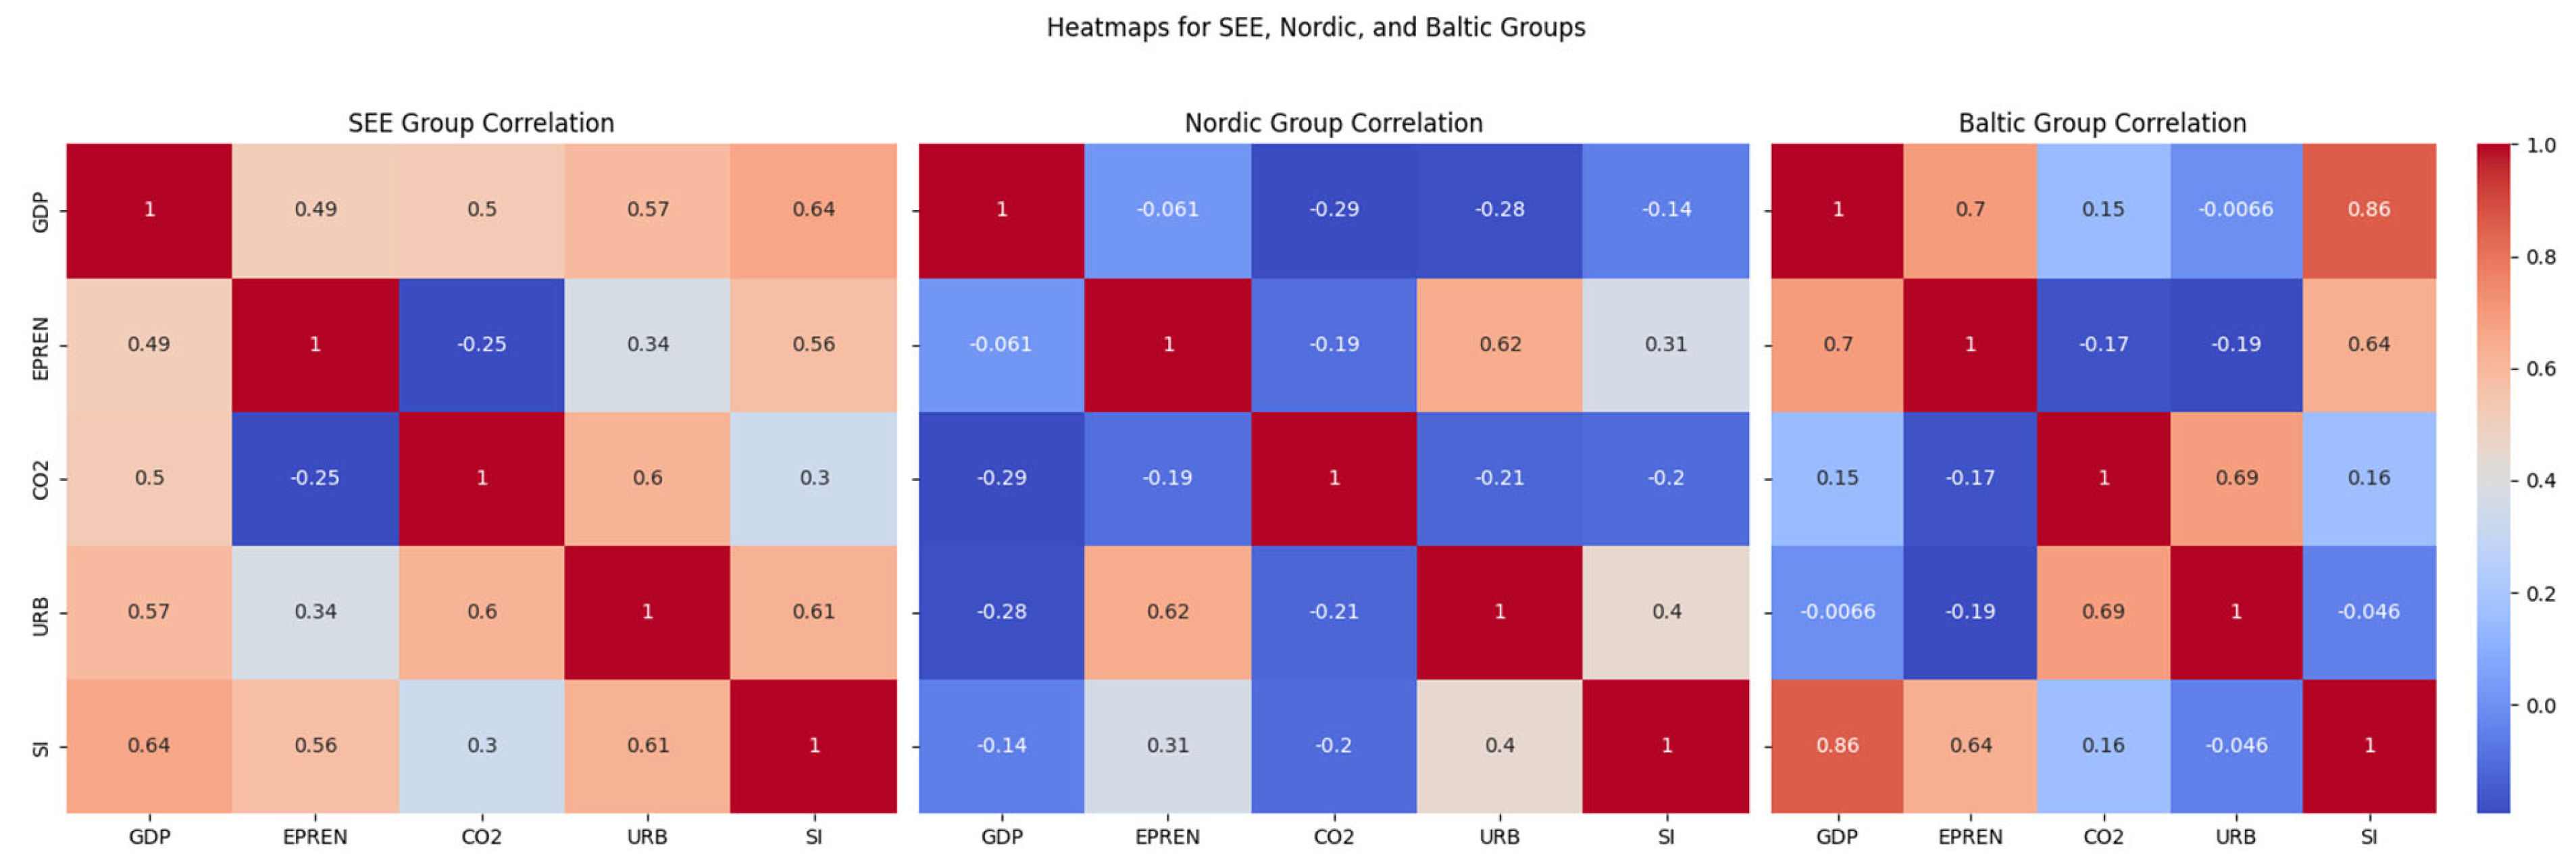
4.1. Input Data Analysis

In this paper, we process the input data from the World Bank. The scatter plots with trend lines (GDP vs. CO2 emissions) show the relationship between GDP and CO2 emissions for each country within the SEE, Nordic, and Baltic groups (as in Figure 2). Each country’s economic output (GDP) is plotted against its CO2 emissions, with a regression line to show the trend. Higher GDP correlates with higher CO2 emissions. Generally, countries with higher economic output tend to emit more CO2, indicating a strong relationship between economic activities and environmental impact. Countries like Sweden and Norway (Nordic group) show a flatter slope, suggesting higher GDP with relatively lower increments in CO2 emissions, indicating better environmental efficiency. Conversely, countries in the SEE group, like Bulgaria and Romania, show steeper slopes, indicating a stronger link between economic growth and increased CO2 emissions.
Other scatter plots with trend lines visualize the relationship between education and CO2 emissions for all countries within the SEE, Nordic, and Baltic groups (Figure 3). This analysis helps us understand how education level correlates with environmental impact across these countries. The trend lines for most countries indicate that higher education level values do not necessarily correlate with lower CO2 emissions uniformly across the board. This suggests a complex relationship where higher education level values might coexist with higher emissions, due to greater industrial and economic activities that come with advanced societal states. The Nordic countries generally exhibit a positive correlation between education and CO2, implying that as social conditions improve, CO2 emissions also increase. This could reflect the balanced approach of these countries in managing economic growth with environmental impact. Some of SEE and Baltic countries show a flatter or less steep trend, suggesting less variation in CO2 emissions relative to changes in the education level. This could indicate a different developmental stage or economic structure that does not link societal gains to increased emissions as strongly as in the Nordic countries.
Scatter plots with trend lines to analyze the relationship between URB and CO2 emissions for all countries within the SEE, Nordic, and Baltic groups are depicted in Figure 4. This helps us understand how the level of urbanization affects CO2 emissions across these regions. There is a general trend of increasing CO2 emissions with urbanization, especially evident in countries like Sweden and Norway. This correlation suggests that urban development, often accompanied by increased industrial activity, transportation needs, and energy consumption, contributes to higher CO2 emissions. Countries like Romania and Bulgaria show a varied relationship with some displaying a flatter trend, indicating that increases in urbanization do not necessarily correspond with significant changes in CO2 emissions. This may reflect a combination of urban planning policies, the economic structure, and the type of industries prevalent in these urban areas. The trend lines for Estonia, Latvia, and Lithuania show a moderate increase in CO2 emissions with urbanization, suggesting an intermediate impact compared to the other groups. This might indicate more efficient urban infrastructure or smaller scale of urbanization processes compared to the larger economies in the Nordic group.
Scatter plots with trend lines to examine the relationship between EPREN (Generation from RES) and CO2 emissions in metric tons per capita for all countries within the SEE, Nordic and Baltic groups are depicted in Figure 5. This analysis provides insights into how RES production impacts CO2 emissions across these countries. In the Nordic countries, there is a noticeable trend where increased generation from renewables correlates with lower CO2 emissions. Countries like Sweden and Norway show this trend clearly, suggesting that higher investments in renewable energy are effectively reducing CO2 emissions. This aligns with their environmental policies aimed at sustainability. The relationship in countries like Romania and Bulgaria is less clear, with some data points suggesting that increases in renewable energy generation do not always correspond to significant reductions in CO2 emissions. This may reflect challenges such as energy infrastructure or the continued use of carbon-intensive energy sources alongside renewables. Estonia, Latvia, and Lithuania show a moderate correlation between increased renewable generation and reduced CO2 emissions, although the trend is not as strong as in the Nordic countries. This indicates ongoing efforts and potential room for improvement in RES adoption. These plots underscore the varying impacts of renewable energy on carbon emissions across different regions.
Figure 6 provides a comparative view of the average values of GDP, EPREN, CO2, URB and SI for each country within the regional groups over the available years. Observations include the following points. (a) Economic disparities (GDP): the Nordic countries typically have higher average GDPs compared to SEE and Baltic countries, reflecting stronger economies. (b) Environmental parameters (EPREN and CO2): the Nordic countries generally have higher EPREN values, which might indicate higher renewable energy production or better energy efficiency. CO2 averages are also informative; despite higher GDPs, the Nordic countries manage to maintain competitive CO2 levels, showing investment in greener technologies. (c) Urbanization and education level: urbanization rates are higher in the Nordic countries, which correlates with their development level. The education level also tends to be higher in these countries.
The 3D plot in Figure 7 visualizing RES generation (EPREN), CO2 emissions, and GDP for the SEE, Nordic, and Baltic groups offers several insights into how these variables interact across different European regions. Regarding Nordic group (green triangles), the plot shows high EPREN and GDP with relatively low CO2 emissions. The Nordic countries often appear higher in the plot along the GDP and EPREN axes but lower along the CO2 axis compared to other groups. This suggests that these countries have successfully developed their economies and increased their generation from RES, which has contributed to relatively lower CO2 emissions. In the SEE group (red circles), the plot shows varied EPREN and CO2 levels with moderate GDP. Countries in the SEE group show a more varied range of EPREN and CO2 emissions, often with moderate GDP levels. The scatter in this group suggests that there is no consistent trend among these countries, indicating diverse stages of development and different approaches to integrating RES and managing CO2 emissions. Some countries in this group might still be in transition phases, moving towards more sustainable practices. Related to Baltic Group (blue squares), the plot shows moderate EPREN and GDP with diverse CO2 Emissions. The Baltic countries generally show moderate values of GDP and EPREN. Their CO2 emissions vary, indicating different levels of success in linking renewable energy production to CO2 reduction. These countries might be facing challenges in fully integrating renewable energy into their national grids or in achieving significant reductions in CO2 emissions relative to their economic output.
There is a visible trend where higher investment in RES generation (higher EPREN values) often correlates with lower CO2 emissions, particularly in the Nordic countries. This suggests that effective investment in RES plays a significant role in reducing carbon footprints. The plot in Figure 7 also shows that higher GDP does not necessarily equate to higher CO2 emissions, especially evident in the Nordic group. This underscores the potential for economic growth to be decoupled from environmental degradation, provided that sustainable practices are integrated into economic planning.
In the SEE group correlation heatmap in Figure 8, a positive correlation (0.49) indicates that increases in RES generation coincide with increases in CO2 emissions. This could be due to ongoing infrastructure developments that simultaneously increase energy production capacity, including non-RES. GDP and SI correlation is quite strong at 0.64, suggesting that higher GDP is associated with higher education levels. This indicates that more economically prosperous areas have better educational attainment or that higher education levels boost economic productivity. A significant correlation between CO2 and URB of 0.6 suggests that as urbanization increases, CO2 emissions also tend to increase, due to higher energy consumption and vehicle emissions in urban areas. The correlation between EPREN and CO2 is −0.25. This negative value implies that regions with higher RES production or efficient energy use have lower CO2 emissions.
In the Nordic group, a correlation between URB and EPREN (0.62) is one of the stronger positive values in this group, indicating a close relationship between urbanization and RES. The negative correlation between GDP and CO2 of −0.29 suggests that higher GDP in the Nordic countries does not necessarily lead to higher CO2 emissions, reflecting efficient energy use and a strong emphasis on sustainability.
In the Baltic group, the correlation between GDP and SI of 0.86 is high, suggesting a very strong link between economic output and education levels in the Baltic region. This indicates that economic growth is heavily supported by or results in enhanced educational attainment. With a correlation between CO2 and URB of 0.69, urbanization is closely linked with increased CO2 emissions, due to factors such as higher density of population and industry leading to more pollution. The negative correlation between EPREN and CO2 of −0.17 is less strong than in the SEE group but still indicates that increased RES production correlates with lower emissions. These values help us understand the dynamics of how economic, environmental, and social factors interplay differently across these regional groups, reflecting their development pathways.

4.2. Empirical Results

The dependence relation in our analysis is
C O 2 = f ( G D P , E P R E N , S I ,   U R B ) .
Throughout the paper, we work with the natural logarithm of the variables. The statistical analyses and graphics have been carried out by means of EViews 12.
C O 2 i t = α + β 1 G D P i t + β 2 E P R E N i t + β 3 S I i t + β 4 U R B i t + ε i t .
In the following simulations, we check the long-term and short-term effects of GDP, EPREN, SI and URB on CO2 emissions for all three groups of countries. Results presented in Table 1, Table 2 and Table 3 indicate that the hypothesis of “no CD” is rejected with a significance level of 1%. Consequently, it is necessary to utilize tests and estimation methods that assume CD.
The data stationarity is tested by applying the first-generation PURT: LLC, IPS, and ADF, as seen in Table 4, Table 5 and Table 6.
From Table 7, Table 8 and Table 9, one can see that all variables are integrated I(1) after applying the second-generation PURT CIPS.
Taking into account the first- and the second-generation PURTs, it follows that all the variables become stationary after differencing once. Next, we apply panel ARDL for the three regions.
The optimal lag structure for the panel ARDL models was determined based on the Akaike Information Criterion (AIC), computed using EViews 12 for each country group. We tested several lag structures ranging from 1 to 3 lags, and the lag configuration that minimized the chosen information criterion was selected. For SEE countries, the ARDL (1,1,1,1,1) was optimal, ensuring parsimony, as shown in Figure A1 in Appendix A. For the Baltic countries, the optimal model is ARDL (3,1,1,1,1,), as shown in Figure A2 in Appendix A. In contrast, for the Nordic group, ARDL (3,3,3,3,3) provided a better fit, reflecting more complex short-run dynamics, as shown in Figure A3 in Appendix A. The different lag choices across regions are thus empirically grounded and reflect the unique adjustment mechanisms within each group.
Table 10, Table 11 and Table 12 contain the long and short-run ARDL regressions for each group of countries.
As seen in Table 10, for SEE, in the long run, a 1% increase in GDP exerts a 0.46% increase in CO2, validating hypothesis H4. The elasticity of 0.46 indicates that CO2 emissions are less responsive to changes in GDP compared to a one-to-one relationship. This suggests that while economic growth in SEE does lead to increases in CO2 emissions, the rate of emission growth is less than the rate of GDP growth. Improved technology and efficiency in production processes can lead to more output with less energy consumption. A shift towards more RES and away from fossil fuels in the energy mix takes place.
In the long run, a 1% increase in SI leads to a 0.54% increase in CO2, contradicting hypothesis H3. This relationship suggests that as more individuals in SEE countries achieve higher levels of education, there may be subsequent increases in economic activity and energy consumption that are not yet fully sustainable or reliant on green technologies. The increase in CO2 emissions could be driven by several factors. Higher educational attainment often leads to more industrial and economic development. If this development relies on fossil fuels or other high-emission energy sources, CO2 emissions can increase correspondingly. With more education, there tends to be greater urban migration and increased demand for personal and commercial vehicles, both of which can contribute to higher CO2 emissions if sustainable practices and technologies are not adequately implemented. Education often correlates with higher standards of living, which typically require more energy consumption, further increasing CO2 emissions if the energy sourced is not from renewable or clean energy sources.
In the long run, a 1% increase in URB leads to a 4.54% decrease in CO2, contradicting hypothesis H2. The value of −4.54% indicates a relatively strong negative elasticity, meaning urbanization significantly contributes to reducing CO2 emissions. Urban areas often have more efficient energy use compared to rural areas, primarily due to better infrastructure, higher-density living and more accessible public transportation systems. Urban centers typically offer more robust public transportation options (buses, subways), which are more efficient per capita than individual automobile use common in less urbanized regions. Services and utilities in densely populated areas can operate at larger scales, which often leads to lower per capita energy consumption. Urban areas are often hubs for innovation, including green technologies and RES, which can contribute to lower CO2 emissions. People in urban areas might adopt lifestyles that contribute less to CO2 emissions, such as reduced dependency on cars, higher rates of recycling and smaller living spaces that require less energy for heating and cooling. This relation may guide policy decisions aimed at leveraging urbanization to combat climate change.
One remarks that EPREN is not a significant explainer of CO2 in the long run. This could signal a need for more aggressive policies promoting RES, more substantial investment in technologies that increase the scalability and reliability of RES or broader systemic changes in how energy is produced and consumed. If RES-based generation still constitutes a small fraction of the total energy mix, its impact on overall CO2 emissions might be minimal. The dominance of fossil fuels in energy production can overshadow the effects of RES. In rapidly developing economies, the overall demand for energy might be growing at such a rate that increases in RES-based production are essentially canceled out by increases in fossil fuel use. Even if RES-based production is increasing, difficulties in integrating RES into the power grid (due to intermittency issues, lack of storage solutions, etc.) might limit its effectiveness in replacing fossil fuel-based power.
The ECT is −0.44, belonging to [−1, 0] and statistically significant. This range is significant because it ensures model stability and that the adjustments toward equilibrium are realistic (i.e., adjustments do not oscillate or diverge). For the SEE economies, this finding is particularly relevant. This region is relatively quick in adjusting towards the equilibrium after any shocks or deviations, at a substantial annual rate of 44%. For policymakers and strategists, the significance and value of the ECT indicate that efforts to modify any of the independent variables (like boosting RES or enhancing educational outcomes) could predictably alter CO2 emissions over time.
As seen in Table 11, a 1% surge in GDP leads to a 1.65% long-term increase in CO2 emissions for the Baltic economies, validating hypothesis H4. These economies have undergone significant transformations since the early 1990s, transitioning from centrally planned to market-oriented economies and joining the EU in 2004. Economic growth in developing or transitioning economies often involves substantial increases in industrial production, which is energy-intensive and frequently reliant on fossil fuels. Growth in GDP usually corresponds with increased energy consumption across all sectors (industrial, residential, commercial and transport). If the energy is predominantly sourced from fossil fuels, CO2 emissions will increase accordingly. Economic expansion often requires extensive construction and infrastructure development, processes which are both directly and indirectly linked to higher CO2 emissions. Given their recent history and rapid development post-transition, the Baltic states have likely experienced substantial industrial growth and urbanization, contributing to increased energy demands predominantly met by fossil fuels. Although these countries have made significant strides in integrating RES, the pace and scale of economic growth might outstrip the green energy integration.
A 1% rise in EPREN leads to a 0.03% long-run reduction in CO2 emissions, validating hypothesis H1. This relatively small effect size might be due to several factors. Renewable energy still constitutes a relatively small portion of the overall energy mix; even a significant percentage increase in RES might translate into a minor absolute increase in terms of total energy production. This could limit its immediate impact on overall CO2 emissions. Rising energy demands can dilute the impact of RES. If total energy consumption increases, gains from RES might be offset by higher emissions elsewhere. Intermittency and the challenge of integrating RES into the power grid reliably can also moderate the effectiveness of RES in displacing fossil fuel-based energy. The efficiency of energy production and use, and technological advancements in RES, also play significant roles in determining how much an increase in RES-based production can decrease CO2 emissions. For the Baltic countries, it indicates ongoing efforts need to bolster not just the quantity but also the efficiency and integration of RES technologies. Policymakers may also need to consider additional measures such as carbon pricing, stricter emissions regulations and incentives for low-carbon technologies and practices.
A 1% rise in SI leads to a 6.22% long-run reduction in CO2 emissions, validating hypothesis H3. Education, particularly secondary education, plays an important role in raising awareness about environmental issues. It equips students with knowledge about the causes, effects and mitigations of environmental problems, including climate change. A higher level of education generally leads to better critical thinking and problem-solving skills. These skills can empower individuals to make more informed decisions that consider environmental impacts, such as energy consumption habits and the use of resources. More educated populations tend to have a higher technological adaptability rate. They are more likely to work in industries that are less dependent on heavy manufacturing and more service-oriented, which generally produce fewer CO2 emissions. Educated individuals are more likely to support and develop new technologies that reduce carbon footprints, including RES technologies, efficient building techniques and waste reduction practices. Education influences personal lifestyle choices that impact the environment. This includes preferences for energy-saving appliances, reduced reliance on fossil-fuel-based transportation and increased recycling and conservation efforts. Educated citizens are more likely to understand and support policies that lead to sustainability. This includes voting behaviors favoring political leaders and policies that aim to reduce carbon emissions. The Baltic countries are part of the European Union, where educational standards are high, and environmental awareness is strongly promoted both at the policy level and within educational curricula. Policymakers might consider integrating more environmental science into curricula, promoting sustainability practices in schools and encouraging lifelong learning in environmental subjects. Furthermore, ref. [34] highlighted the complex relationship between education and climate change risks. Education has proven to be a key element in addressing and mitigating the factors that adversely affect environmental quality in other studies by [35] for 25 African economies during 1990–2014. The same negative relation between SI and CO2 is found in the study by [9] which revealed that an increase in higher education levels has a negative impact on CO2 emissions for Turkey during 1983–2017. A similar result is proved by [36] for MENA countries for the period 2000–2018.
A 1% rise in URB leads to a 29.27% long-run reduction in CO2 emissions, invalidating hypothesis H2. Urban areas, due to their density, often offer more energy-efficient living arrangements. High-density living reduces the energy needed for heating, cooling and lighting per capita compared to more dispersed rural dwellings. Urban living typically reduces the need for long-distance commuting and encourages the use of public transportation, biking and walking-all of which contribute to lower per capita CO2 emissions compared to car-dependent rural areas. Cities often lead in the adoption of newer, more efficient technologies, including RES-based technologies and smart grid applications that can reduce overall emissions. Urban areas may more cost-effectively implement large-scale recycling programs, waste management systems and RES projects due to economies of scale. There has been considerable investment in modernizing urban infrastructure in the Baltic states, enhancing energy efficiency and reducing emissions in urban settings.
ECT is −0.27, in the interval of [−1, 0], and statistically significant. It indicates that the Baltic region has a relatively moderate speed of adjustment to equilibrium after any shocks or changes in the independent factors. The smaller magnitude of the ECT compared to more reactive systems (such as −0.44 as discussed earlier for the SEE economies) implies that the adjustments in the Baltic economies are somewhat slower. This can be due to various factors, such as the nature of economic activities, policy responses, and the existing infrastructure for managing CO2 emissions. Knowing that approximately 27% of disequilibrium is corrected annually provides policymakers with a timeline and expectation of how quickly the impact of their policies (related to GDP growth, RES initiatives, educational programs, or urban development) will manifest in changes to CO2 emissions.
As seen in Table 12, a 1% surge in GDP leads to a 0.59% long-term decrease in CO2 emissions for the Nordic economies, invalidating hypothesis H4. This relationship highlights a different scenario in the Nordic countries, suggesting a more sustainable growth pattern that effectively decouples economic gains from carbon emissions. The Nordic countries are known for their high levels of energy efficiency and for integrating advanced technologies in manufacturing, transportation, and energy sectors that reduce the carbon intensity of economic activities. These economies have a significant share of their GDP coming from the service sector, which typically has a lower carbon footprint compared to industrial sectors.
There is a strong public awareness and cultural emphasis on sustainability and environmental responsibility in the Nordic countries. Consumer behavior often favors green products and technologies, influencing businesses and the economy at large. The Nordic countries are also known for innovation in environmental technology, including Carbon Capture and Storage (CCS), electric vehicles, and smart energy systems, which help mitigate the impact of economic activities on the environment. The Nordic model serves as an example for other regions aiming to grow their economies while addressing environmental challenges. Strategies employed by the Nordic countries provide valuable lessons in how to structure policies and investments. The authors of [37] find that productivity negatively impacts CO2 emissions for Finland over the period 2000–2020. This suggests that the economic growth driven by higher productivity could be attained through cleaner, low-carbon production methods.
A 1% surge in EPREN leads to a 0.14% long-term decrease in CO2 emissions, validating hypothesis H1 RES typically produce little to no direct CO2 emissions when generating electricity, unlike fossil fuels that release significant amounts of CO2 and other greenhouse gases. Therefore, increasing the proportion of energy derived from RES directly contributes to reducing overall CO2 emissions. The Nordic countries already have a high baseline of RES usage, especially from hydroelectric power. Additional increments in RES, while beneficial, might contribute incrementally to smaller reductions in emissions because of the diminishing returns when transitioning from an already clean energy mix. Integrating RES into the national grid can pose challenges, especially at higher penetration levels. Issues like variability and intermittency of sources like solar and wind require backup systems, which could occasionally involve non-RES.
One remarks that SI is not a significant explainer of CO2 in the long run. The Nordic countries are known for their high standards of education and almost universal secondary education completion rates. Since educational attainment is uniformly high, its variability is low, which might make it a less significant variable in explaining differences in CO2 emissions within these countries. Environmental awareness and sustainable living practices are deeply ingrained in Nordic societies and are promoted from early childhood through various means beyond formal secondary education. Public campaigns, media, non-formal education programs, and community initiatives also contribute significantly to public knowledge and behavior regarding sustainability.
A 1% surge in URB leads to an 18.02% long-term decrease in CO2 emissions, invalidating hypothesis H2. The surprisingly large reduction in CO2 emissions (18.02%) associated with a relatively small increase in urbanization (1%) suggests that urban areas in the Nordic countries are highly efficient in terms of energy use. Urban areas generally have higher population densities, which can make public transit systems more feasible and effective. More people using public transit means fewer emissions from private vehicles. Cities in the Nordic countries have modern, energy-efficient buildings and infrastructure. This includes widespread use of heating systems powered by RES, advanced insulation techniques and smart energy management systems that reduce overall energy consumption.
In the case of the Nordic countries, the empirical results, especially the long-term negative elasticity of CO2 emissions with respect to GDP (−0.59%), EPREN (−0.14%), and URB (−18.02%), highlight a successful decoupling of economic growth from environmental degradation. These outcomes align closely with the region’s long-standing and well-coordinated climate policies and energy transition strategies. For instance, since the 1990s, Nordic countries have pioneered renewable energy integration, particularly through hydropower, wind, and district heating systems. Ambitious policy instruments such as carbon taxes (Sweden, since 1991), green public procurement and energy-efficiency targets have driven reductions in fossil fuel dependence. Additionally, the widespread deployment of smart grids, electric vehicles and carbon capture technologies reflects proactive innovation ecosystems supported by public investment.
Environmental education policies have also played a pivotal role. Sustainability and climate literacy are embedded across all levels of the Nordic education systems, complemented by informal education channels and public awareness campaigns. This widespread environmental consciousness likely contributes to behavioral patterns that reduce CO2 emissions, such as the preference for low-carbon lifestyles, efficient public transport and support for clean technologies. However, the statistical insignificance of secondary school enrolment (SI) in the Nordic context suggests that the marginal effect of increasing education may be limited due to already high baseline educational attainment and societal environmental awareness. Thus, linking these results to the Nordic policy framework reinforces the notion that coherent governance, early policy adoption and a culture of environmental responsibility can meaningfully shape emissions trajectories even in advanced economies.
ECT is −0.67, in the interval of [−1, 0], and statistically significant. This is a relatively high correction rate, indicating a strong tendency toward returning to equilibrium quickly. The relatively quick adjustment back to equilibrium (67% annually) suggests efficient policy mechanisms and a responsive economic and environmental system. This high rate of adjustment is reflective of well-established environmental policies, a strong regulatory framework and societal commitment to sustainability. The significant and sizable ECT means that policy changes or economic shifts that influence GDP, RES, education, or urban development are likely to see their effects on CO2 emissions corrected fairly rapidly.
The next step involves conducting a causality test, as outlined by [38], to identify the direction of causality. The Dumitrescu–Hurlin causality test helps ascertain whether changes in one variable are responsible for changes in another, if the influence is reciprocal, or if there exists a bidirectional relationship. Understanding the causal links is vital for determining which variables act as drivers of change and which are impacted by different variables (as in Table 13, Table 14 and Table 15).
The Dumitrescu–Hurlin causality results (Table 13, Table 14 and Table 15) reveal main drivers of CO2 in each group. In SEE, EPREN, URB and SI show strong bidirectional causality, with EPREN and URB driving CO2 reductions. In the Baltics, causal links are weaker; CO2 causes SI, while GDP drives EPREN and URB and EPREN influences SI. In the Nordics, EPREN, GDP and URB all cause CO2, confirming them as main drivers. EPREN↔URB and URB↔SI reflect tight feedbacks between infrastructure, energy, and education. URB consistently acts as a structural driver across all regions, especially in the Nordic countries.

5. Discussion

Even if education is widely considered a long-term driver of environmental awareness and sustainability, the relationship between higher education and CO2 emissions is not uniformly negative across regions or stages of development. In the SEE countries, the panel ARDL results indicate a positive long-run elasticity between SI and CO2 emissions (0.54%). In this context, more education correlates with more pollution. This finding aligns with the broader literature that recognizes education’s dual role in shaping environmental outcomes depending on the developmental stage and economic structure of a country.
For instance, ref. [39] found that all levels of education in China initially increase CO2 emissions and only after reaching a certain threshold, when education expands in depth and quality, do these emissions decline. This inverted-U behavior resembles an education-augmented EKC, where the early gains from education lead to higher energy demand due to growing industrialization, urban migration and lifestyle changes. The authors of [40] showed that in Australia, it was only in the most recent decades that education contributed meaningfully to reducing emissions, after decades of expansion had first intensified environmental pressures.
Education contributes to economic growth and as [12,41] noted, this growth often comes with increased energy consumption and industrial output, especially in middle-income regions. In SEE countries, rising education levels may fuel labor market activation and higher-income consumption patterns, such as increased vehicle use, housing demand and reliance on carbon-intensive goods and services, all of which heighten emissions in the absence of green infrastructure or regulatory frameworks.
Moreover, ref. [36] pointed out that education in developing or transitioning economies may contribute to globalization-driven expansion before sustainability mechanisms are in place. Also, ref. [21] found that in Indonesia, education raises CO2 emissions in the long run, unless paired with aggressive environmental policy and awareness campaigns.
Thus, in regions like SEE, the positive link between education and emissions may reflect an ongoing structural transition. The beneficial effects of education on environmental quality are not automatic but instead depend on whether green technologies, regulations and environmental curricula are concurrently developed.
The empirical finding that urbanization reduces CO2 emissions in the SEE and Baltic countries warrants a broader socio-economic and policy-based interpretation. In high-income and transitioning economies, urbanization does not necessarily translate into higher emissions. As shown by [42], in OECD countries, a one-percentage-point increase in urbanization was associated with marginal decreases in CO2 emissions per capita. This outcome suggests a decoupling between urbanization and carbon emissions, largely due to improvements in energy efficiency, structural changes in the economy, and more sustainable energy consumption patterns. Urbanization may induce agglomeration effects that contribute to lower per capita emissions by concentrating economic activities in areas with better infrastructure and access to clean technologies [42].
Additionally, ref. [43] argue that government effectiveness plays a transformative role in converting the typically positive relationship between urbanization and emissions into a negative one. In countries where governance quality is high, urban development is often accompanied by stringent environmental regulation, integrated urban planning and green public infrastructure, all of which mitigate emissions. This aligns with trends observed in the Baltic countries, where urban growth has been paralleled by EU-driven reforms, enhanced environmental governance and investment in sustainable urban infrastructure.
From a sectoral perspective, urbanization can also influence CO2 emissions through shifts in household energy consumption. As shown by [44], households in more urbanized settings often rely on cleaner energy sources due to better access to modern energy infrastructure, as opposed to traditional biomass or coal used in rural areas. This shift helps reduce residential emissions. Also, ref. [45] highlight that urbanization, when accompanied by improvements in transportation infrastructure and ICT development, supports more sustainable mobility and reduced reliance on private, high-emission vehicles.

6. Conclusions

This study analyzed the effects of GDP, EPREN, SI and URB on CO2 across SEE, Baltic and Nordic groups from 1990 to 2022 using panel ARDL models. After confirming CD and I(1) integration via first- and second-generation PURT, both short- and long-run dynamics were estimated. The method allows for heterogeneity and accounts for structural differences across panels, providing robust regional insights.
To enhance the alignment between the study’s objectives and its empirical findings, the hypotheses formulated in the introduction are revisited. H1 is confirmed in the Baltic and Nordic countries, where an increase in EPREN correlates with a reduction in CO2 emissions. H2 is rejected across all regions, as URB shows a negative relationship with emissions, suggesting more efficient energy use in urban settings. H3 is partially validated; education reduces emissions in the Baltic region but is either insignificant (Nordic) or positively related to emissions (SEE), likely due to transitional dynamics. H4 is validated in SEE and Baltic regions, where higher GDP is associated with increased CO2 emissions. However, it is rejected in the Nordic region, which proves a decoupling of economic growth from emissions.
A comparative analysis of the long-run effects across the SEE, Baltic, and Nordic regions reveals notable heterogeneity in the determinants of CO2 emissions. As summarized in Table 16, GDP is positively associated with emissions in SEE (+0.46%) and Baltic countries (+1.65%), highlighting that economic growth in these regions is still carbon intensive. In contrast, GDP in the Nordic region is associated with a reduction in emissions (−0.59%), indicating successful decoupling of economic expansion from environmental degradation through advanced technology and energy efficiency.
EPREN significantly reduces emissions in the Nordic (−0.14%) and Baltic (−0.03%) regions but shows no significant effect in SEE due to lower RES penetration or integration challenges. SI increases emissions in SEE (+0.54%), reflecting the growth-related impacts of a more skilled workforce. It reduces emissions substantially in the Baltics (−6.22%), suggesting greater environmental awareness and behavioral shifts. In the Nordic countries, the effect of education is statistically insignificant, due to uniformly high educational attainment and pre-existing environmental consciousness.
URB emerges as a strong emissions-reducing factor across all regions but is particularly potent in the Baltics (−29.27%) and Nordics (−18.02%), with a smaller but still significant effect in SEE (−4.54%). These results challenge conventional assumptions and suggest that urban development, when well-managed, can support climate goals, especially through efficient public infrastructure and reduced per capita energy use.
ECT values show the speed of adjustment to long-run equilibrium after a shock, with the Nordic region exhibiting the fastest correction (−0.67), followed by SEE (−0.44) and then the Baltics (−0.27). This gradient reflects varying degrees of institutional and infrastructural responsiveness, underscoring the importance of region-specific policy design for sustainable transitions.
Discussing Dumitrescu–Hurlin causality, both SEE and Baltic countries highlight the role of EPREN in education, with SEE showing a bidirectional interaction (suggesting a mature RES sector influencing and being influenced by education), whereas in the Baltic, it is more a case of the energy sector influencing education, reflecting different stages of RES integration into society and education. The role of urbanization in education shows varied dynamics. In SEE, education drives urbanization, indicating a more educational push towards urban development. In contrast, the Nordic countries show mutual dependency, suggesting a more mature interplay between urban growth and educational structures. Only explicitly mentioned in the Baltic context, GDP→SI indicates a more direct linkage between economic conditions and educational enrollment compared to other regions.
These results support the targeted strategies, including promoting EPREN, integrating URB planning, and leveraging SI to mitigate CO2. By identifying variable-specific effects across regional contexts, our research informs differentiated policy responses aligned with development levels, helping to advance low-carbon transitions in Europe.

7. Limitations and Future Research Directions

This study is subject to several limitations that also offer opportunities for future research. First, while the panel ARDL model captures short- and long-run relationships, it assumes linearity and symmetry. These assumptions may oversimplify the complex dynamics between variables such as education, economic growth, urbanization, and CO2 emissions. Future studies will adopt nonlinear or asymmetric models, such as NARDL or threshold regressions, to explore context-dependent or regime-specific effects.
Second, the use of secondary school enrollment as a proxy for environmental awareness may not fully capture the educational dimension of sustainability. Future research could benefit from similar indicators, including tertiary education rates, environmental literacy scores, and participation in green training programs. Additionally, including other variables could enhance the explanatory power and policy relevance of future analyses. Extending the analysis to additional regions would help assess the long-term effectiveness and adaptability of national climate strategies.

Author Contributions

Conceptualization, A.B. and S.-V.O.; methodology, I.A.G. and S.-V.O.; software, S.-V.O.; validation, A.B. and S.-V.O.; formal analysis, A.B. and S.-V.O.; investigation, A.B. and S.-V.O.; resources, A.B. and S.-V.O.; data curation, A.B. and S.-V.O.; writing—original draft preparation, A.B., I.A.G. and S.-V.O.; writing—review and editing, A.B., I.A.G. and S.-V.O.; visualization A.B. and S.-V.O.; supervision, A.B. and S.-V.O.; project administration, A.B. and S.-V.O.; funding acquisition, A.B. and S.-V.O. All authors have read and agreed to the published version of the manuscript.

Funding

This work was supported by a grant of the Ministry of Research, Innovation and Digitization, CNCS/CCCDI—UEFISCDI, project number COFUND-DUT-OPEN4CEC-1, within PNCDI IV.

Institutional Review Board Statement

Not applicable.

Informed Consent Statement

Not applicable.

Data Availability Statement

The data are available by reasonable request from the corresponding author.

Acknowledgments

This work was supported by a grant from the Ministry of Research, Innovation and Digitization.

Conflicts of Interest

The authors declare no conflicts of interest.

Abbreviations

AbbreviationDescription
AICAkaike Information Criterion
ARDLAutoregressive distributed lag
BRICSBrazil, Russia, India, China, South Africa
CADFCross-section Augmented Dickey–Fuller
CCSCarbon capture and storage
CDCross-sectional dependence
CIPSCross-sectionally augmented Im-Pesaran-Shin
CO2Carbon dioxide
d.n.h.cdoes not homogeneously cause
ECTError Correction Term
EKCEnvironmental Kuznets Curve
EPRENEnergy production from renewable sources
EUEuropean Union
GHGGreenhouse gas
GDPGross Domestic Product per capita
ICTInformation and Communication Technology
LLCLevin, Lin, and Chu
LMLagrange Multiplier
NARDLNonlinear Autoregressive Distributed Lag
PURTPanel Unit Root Test
PVPhotovoltaics
QARDLQuantile Autoregressive Distributed Lag
R&DResearch and development
RESRenewable Energy Sources
SEESouth-Eastern European countries
SISecondary school enrolment
UKUnited Kingdom
URBUrbanization
USAUnited States of America

Appendix A

Figure A1, Figure A2 and Figure A3 display the Akaike Information Criterion (AIC)-based lag selection results used to determine the optimal lag structure for the panel ARDL models for SEE, Baltic, and Nordic regions, respectively.
Figure A1. Akaike Information Criteria for the panel ARDL model for SEE countries.
Sustainability 17 04789 g0a1
Figure A2. Akaike Information Criteria for the panel ARDL model for Baltic countries.
Sustainability 17 04789 g0a2
Figure A3. Akaike Information Criteria for the panel ARDL model for Nordic countries.
Sustainability 17 04789 g0a3

References

  1. Shahnazi, R.; Dehghan Shabani, Z. The Effects of Renewable Energy, Spatial Spillover of CO2 Emissions and Economic Freedom on CO2 Emissions in the EU. Renew. Energy 2021, 169, 293–307. [Google Scholar] [CrossRef]
  2. Sharif, A.; Kartal, M.T.; Bekun, F.V.; Pata, U.K.; Foon, C.L.; Kılıç Depren, S. Role of Green Technology, Environmental Taxes, and Green Energy towards Sustainable Environment: Insights from Sovereign Nordic Countries by CS-ARDL Approach. Gondwana Res. 2023, 117, 194–206. [Google Scholar] [CrossRef]
  3. Dritsaki, M.; Dritsaki, C. Trade Openness and Economic Growth: A Panel Data Analysis of Baltic Countries. Asian Econ. Financ. Rev. 2020, 10, 313–324. [Google Scholar] [CrossRef]
  4. Kar, A.K. Environmental Kuznets Curve for CO2 Emissions in Baltic Countries: An Empirical Investigation. Environ. Sci. Pollut. Res. 2022, 29, 47189–47208. [Google Scholar] [CrossRef]
  5. Grodzicki, T.; Jankiewicz, M. The Impact of Renewable Energy and Urbanization on CO2 Emissions in Europe—Spatio-Temporal Approach. Environ. Dev. 2022, 44, 100755. [Google Scholar] [CrossRef]
  6. Breyer, C.; Bogdanov, D.; Ram, M.; Khalili, S.; Vartiainen, E.; Moser, D.; Román Medina, E.; Masson, G.; Aghahosseini, A.; Mensah, T.N.O.; et al. Reflecting the Energy Transition from a European Perspective and in the Global Context—Relevance of Solar Photovoltaics Benchmarking Two Ambitious Scenarios. Prog. Photovoltaics Res. Appl. 2023, 31, 1369–1395. [Google Scholar] [CrossRef]
  7. Budžytė, A.; Balžekienė, A. Public Perceptions of Institutional Responsibility in Climate Change Risk in Baltic Nordic Countries. J. Secur. Sustain. Issues 2018, 7, 675–684. [Google Scholar] [CrossRef]
  8. Laktuka, K.; Pakere, I.; Kalnbalkite, A.; Zlaugotne, B.; Blumberga, D. Renewable Energy Project Implementation: Will the Baltic States Catch up with the Nordic Countries? Util. Policy 2023, 82, 101577. [Google Scholar] [CrossRef]
  9. Eyuboglu, K.; Uzar, U. A New Perspective to Environmental Degradation: The Linkages between Higher Education and CO2 Emissions. Environ. Sci. Pollut. Res. 2021, 28, 482–493. [Google Scholar] [CrossRef]
  10. Alkhateeb, T.T.Y.; Mahmood, H.; Altamimi, N.N.; Furqan, M. Role of Education and Economic Growth on the CO2 Emissions in Saudi Arabia. Entrep. Sustain. Issues 2020, 8, 195–209. [Google Scholar] [CrossRef]
  11. Liu, N.; Hong, C.; Sohail, M.T. Does Financial Inclusion and Education Limit CO2 Emissions in China? A New Perspective. Environ. Sci. Pollut. Res. 2022, 29, 18452–18459. [Google Scholar] [CrossRef] [PubMed]
  12. Xin, Y.; Yang, S.; Rasheed, M.F. Exploring the Impacts of Education and Unemployment on CO2 Emissions. Econ. Res. Istraživanja 2023, 36, 2110139. [Google Scholar] [CrossRef]
  13. Ping, S.; Shah, S.A.A. Green Finance, Renewable Energy, Financial Development, FDI, and CO2 Nexus under the Impact of Higher Education. Environ. Sci. Pollut. Res. 2023, 30, 33524–33541. [Google Scholar] [CrossRef] [PubMed]
  14. Zhu, Y.; Zafar, S.M.; Salahodjaev, R. Mitigations Pathways towards Sustainable Development: Assessing the Influence of Higher Education on Environmental Quality in BRICS Economies. Environ. Sci. Pollut. Res. 2022, 29, 86851–86858. [Google Scholar] [CrossRef]
  15. Li, X.; Ullah, S. Caring for the Environment: How CO2 Emissions Respond to Human Capital in BRICS Economies? Environ. Sci. Pollut. Res. 2022, 29, 18036–18046. [Google Scholar] [CrossRef]
  16. Xu, P.; Zhang, J.; Mehmood, U. How Do Green Investments, Foreign Direct Investment, and Renewable Energy Impact CO2 Emissions? Measuring the Role of Education in E-7 Nations. Sustainability 2023, 15, 14052. [Google Scholar] [CrossRef]
  17. Irfan, M.; Chen, Z.; Adebayo, T.S.; Al-Faryan, M.A.S. Socio-Economic and Technological Drivers of Sustainability and Resources Management: Demonstrating the Role of Information and Communications Technology and Financial Development Using Advanced Wavelet Coherence Approach. Resour. Policy 2022, 79, 103038. [Google Scholar] [CrossRef]
  18. Zafar, M.W.; Saleem, M.M.; Destek, M.A.; Caglar, A.E. The Dynamic Linkage between Remittances, Export Diversification, Education, Renewable Energy Consumption, Economic Growth, and CO2 Emissions in Top Remittance-Receiving Countries. Sustain. Dev. 2022, 30, 165–175. [Google Scholar] [CrossRef]
  19. Li, H.; Khattak, S.I.; Ahmad, M. Measuring the Impact of Higher Education on Environmental Pollution: New Evidence from Thirty Provinces in China. Environ. Ecol. Stat. 2021, 28, 187–217. [Google Scholar] [CrossRef]
  20. Mehmood, U. Contribution of Renewable Energy towards Environmental Quality: The Role of Education to Achieve Sustainable Development Goals in G11 Countries. Renew. Energy 2021, 178, 600–607. [Google Scholar] [CrossRef]
  21. Umaroh, R. Does Education Reduce CO2 Emmisions? Empirical Evidence of The Environmental Kuznets Curve in Indonesia. J. Rev. Glob. Econ. 2019, 8, 662–671. [Google Scholar] [CrossRef]
  22. Liu, H.; Alharthi, M.; Atil, A.; Zafar, M.W.; Khan, I. A Non-Linear Analysis of the Impacts of Natural Resources and Education on Environmental Quality: Green Energy and Its Role in the Future. Resour. Policy 2022, 79, 102940. [Google Scholar] [CrossRef]
  23. Li, L.; Li, G.; Ozturk, I.; Ullah, S. Green Innovation and Environmental Sustainability: Do Clean Energy Investment and Education Matter? Energy Environ. 2023, 34, 2705–2720. [Google Scholar] [CrossRef]
  24. Xu, L.; Ullah, S. Evaluating the Impacts of Digitalization, Financial Efficiency, and Education on Renewable Energy Consumption: New Evidence from China. Environ. Sci. Pollut. Res. 2023, 30, 53538–53547. [Google Scholar] [CrossRef]
  25. Breusch, T.S.; Pagan, A.R. The Lagrange Multiplier Test and Its Applications to Model Specification in Econometrics. Rev. Econ. Stud. 1980, 47, 239. [Google Scholar] [CrossRef]
  26. Pesaran, M.H. General Diagnostic Tests for Cross Section Dependence in Panels General Diagnostic Tests for Cross Section Dependence in Panels; University of Cambridge: Cambridge, UK, 2004. [Google Scholar]
  27. Im, K.S.; Pesaran, M.H.; Shin, Y. Testing for Unit Roots in Heterogeneous Panels. J. Econom. 2003, 115, 53–74. [Google Scholar] [CrossRef]
  28. Maddala, G.S.; Wu, S. A Comparative Study of Unit Root Tests with Panel Data and a New Simple Test. Oxf. Bull. Econ. Stat. 1999, 61, 631–652. [Google Scholar] [CrossRef]
  29. Levin, A.; Lin, C.-F.; James Chu, C.-S. Unit Root Tests in Panel Data: Asymptotic and Finite-Sample Properties. J. Econom. 2002, 108, 1–24. [Google Scholar] [CrossRef]
  30. Pesaran, M.H. A Simple Panel Unit Root Test in the Presence of Cross-Section Dependence. J. Appl. Econom. 2007, 22, 265–312. [Google Scholar] [CrossRef]
  31. Dickey, D.A.; Fuller, W.A. Distribution of the Estimators for Autoregressive Time Series With a Unit Root. J. Am. Stat. Assoc. 1979, 74, 427. [Google Scholar] [CrossRef]
  32. Choi, I. Unit Root Tests for Panel Data. J. Int. Money Financ. 2001, 20, 249–272. [Google Scholar] [CrossRef]
  33. Pesaran, M.H.; Shin, Y. Cointegration and Speed of Convergence to Equilibrium. J. Econom. 1996, 71, 117–143. [Google Scholar] [CrossRef]
  34. O’Neill, B.C.; Jiang, L.; KC, S.; Fuchs, R.; Pachauri, S.; Laidlaw, E.K.; Zhang, T.; Zhou, W.; Ren, X. The Effect of Education on Determinants of Climate Change Risks. Nat. Sustain. 2020, 3, 520–528. [Google Scholar] [CrossRef]
  35. Tiba, S.; Belaid, F. Modeling the Nexus Between Sustainable Development and Renewable Energy: The African Perspectives. J. Econ. Surv. 2021, 35, 307–329. [Google Scholar] [CrossRef]
  36. Zouine, M.; EL Adnani, M.J.; Salhi, S.E. Higher Education’s Impact on CO2 Mitigation: MENA Insights with Consideration for Unemployment, Economic Growth, and Globalization. Front. Environ. Sci. 2024, 12, 1325598. [Google Scholar] [CrossRef]
  37. Georgescu, I.; Kinnunen, J. The Role of Foreign Direct Investments, Urbanization, Productivity, and Energy Consumption in Finland’s Carbon Emissions: An ARDL Approach. Environ. Sci. Pollut. Res. 2023, 30, 87685–87694. [Google Scholar] [CrossRef]
  38. Granger, C.W.J. Investigating Causal Relations by Econometric Models and Cross-Spectral Methods. Econometrica 1969, 37, 424. [Google Scholar] [CrossRef]
  39. Cui, Y.; Wei, Z.; Xue, Q.; Sohail, S. Educational Attainment and Environmental Kuznets Curve in China: An Aggregate and Disaggregate Analysis. Environ. Sci. Pollut. Res. 2022, 29, 45612–45622. [Google Scholar] [CrossRef]
  40. Balaguer, J.; Cantavella, M. The Role of Education in the Environmental Kuznets Curve. Evidence from Australian Data. Energy Econ. 2018, 70, 289–296. [Google Scholar] [CrossRef]
  41. Lee, H.; Park, C.; Jung, H. The Role of Tertiary Education on CO2 Emissions: Evidence from 151 Countries. Environ. Dev. Sustain. 2024, 26, 32081–32103. [Google Scholar] [CrossRef]
  42. Wang, W.-Z.; Liu, L.-C.; Liao, H.; Wei, Y.-M. Impacts of Urbanization on Carbon Emissions: An Empirical Analysis from OECD Countries. Energy Policy 2021, 151, 112171. [Google Scholar] [CrossRef]
  43. Chen, F.; Liu, A.; Lu, X.; Zhe, R.; Tong, J.; Akram, R. Evaluation of the Effects of Urbanization on Carbon Emissions: The Transformative Role of Government Effectiveness. Front. Energy Res. 2022, 10, 848800. [Google Scholar] [CrossRef]
  44. Cao, Z.; Meng, Q.; Gao, B. The Consumption Patterns and Determining Factors of Rural Household Energy: A Case Study of Henan Province in China. Renew. Sustain. Energy Rev. 2021, 146, 111142. [Google Scholar] [CrossRef]
  45. Pradhan, R.P.; Arvin, M.B.; Nair, M. Urbanization, Transportation Infrastructure, ICT, and Economic Growth: A Temporal Causal Analysis. Cities 2021, 115, 103213. [Google Scholar] [CrossRef]
Figure 1. Brief methodology.
Sustainability 17 04789 g001
Figure 2. Scatter plots with trend lines (GDP vs. CO2 emissions in metric tons per capita) for each country.
Sustainability 17 04789 g002
Figure 3. Scatter plots with trend lines (Education-SI vs. CO2 emissions in metric tons per capita) for each country.
Sustainability 17 04789 g003
Figure 4. Scatter plots with trend lines (URB vs. CO2 emissions in metric tons per capita) for each country.
Sustainability 17 04789 g004
Figure 5. Scatter plots with trend lines (EPREN vs. CO2 emissions metric in tons per capita) for each country.
Sustainability 17 04789 g005
Figure 6. Average values of GDP, EPREN, CO2 in metric tons per capita, URB, and SI for each country.
Sustainability 17 04789 g006
Figure 7. Three-dimensional plot of EPREN, CO2 emissions in metric tons per capita, and GDP for the SEE, Nordic, and Baltic groups.
Sustainability 17 04789 g007
Figure 8. Variables correlations for the SEE, Nordic and Baltic groups.
Sustainability 17 04789 g008
Table 1. CD test results for SEE.
TestsStatisticp-Value
Breusch–Pagan LM32.240.000 ***
Pesaran-scaled LM7.570.000 ***
Pesaran CD2.510.011 **
*, **, *** significant at 10%, 5%, and 1% levels.
Table 2. CD test results for Baltic countries.
TestsStatisticp-Value
Breusch–Pagan LM85.550.000 ***
Pesaran-scaled LM22.960.000 ***
Pesaran CD8.140.000 ***
*, **, *** significant at 10%, 5%, and 1% levels.
Table 3. CD test results for Nordic countries.
TestsStatisticp-Value
Breusch–Pagan LM52.710.000 ***
Pesaran-scaled LM20.290.000 ***
Pesaran CD7.230.000 ***
*, **, *** significant at 10%, 5%, and 1% levels.
Table 4. First-generation PURT for SEE.
At Levels
CO2GDPEPRENSIURB
Unit root (Common Unit Root Process)
LLC−0.52
(0.300)
1.41
(0.921)
−1.84
(0.032) **
−0.73
(0.232)
1.25
(0.895)
Unit root (Individual Unit Root Process)
IPS−0.45
(0.323)
2.86
(0.997)
0.25
(0.599)
−0.62
(0.266)
2.30
(0.989)
ADF-Fisher Chi-square8.79
(0.360)
1.88
(0.984)
9.00
(0.341)
8.88
(0.352)
2.69
(0.952)
At first difference
Unit root (Common Unit Root Process)
LLC−6.20
(0.000) ***
−3.80
(0.000) ***
−4.99
(0.000) ***
−2.09
(0.017) **
−1.39
(0.081) *
Unit root (Individual Unit Root Process)
IPS6.12
(0.000) ***
−3.73
(0.000) ***
−5.32
(0.000) ***
−5.04
(0.000) ***
−1.98
(0.023) **
ADF-Fisher Chi-square50.52
(0.000) ***
29.63
(0.000) ***
43.02
(0.000) ***
40.08
(0.000) ***
16.65
(0.033) **
*, **, *** significant at 10%, 5%, and 1% levels.
Table 5. First-generation PURT for Baltic countries.
At Levels
CO2GDPEPRENSIURB
Unit root (Common Unit Root Process)
LLC−2.09
(0.017) **
−0.86
(0.193)
−0.22
(0.410)
−0.35
(0.362)
−0.88
(0.188)
Unit root (Individual Unit Root Process)
IPS−5.04
(0.000) ***
1.29
(0.901)
0.32
(0.626)
0.86
(0.806)
−0.38
(0.350)
ADF-Fisher Chi-square40.08
(0.000) ***
1.39
(0.966)
3.69
(0.717)
2.57
(0.860)
7.31
(0.292)
At first difference
Unit root (Common Unit Root Process)
LLC−6.89
(0.000) ***
−5.54
(0.000) ***
−2.46
(0.006) ***
−1.52
(0.063) *
−2.06
(0.019) **
Unit root (Individual Unit Root Process)
IPS−7.00
(0.000) ***
−4.69
(0.000) ***
−4.29
(0.000) ***
−3.39
(0.000) ***
−3.33
(0.000) ***
ADF-Fisher Chi-square51.18
(0.000) ***
32.37
(0.000) ***
29.39
(0.000) ***
23.08
(0.000) ***
22.34
(0.001) ***
*, **, *** significant at 10%, 5%, and 1% levels.
Table 6. First-generation PURT for Nordic countries.
At Levels
CO2GDPEPRENSIURB
Unit root (Common Unit Root Process)
LLC−2.36
(0.008) ***
−0.29
(0.423)
1.10
(0.866)
−0.85
(0.195)
−0.68
(0.248)
Unit root (Individual Unit Root Process)
IPS−1.84
(0.032) **
1.33
(0.908)
0.75
(0.775)
−1.15
(0.123)
−2.36
(0.009) ***
ADF-Fisher Chi-square14.73
(0.064) *
2.75
(0.948)
8.49
(0.386)
12.67
(0.123)
21.34
(0.006) ***
At first difference
Unit root (Common Unit Root Process)
LLC−7.93
(0.000) ***
−3.60
(0.000) ***
−11.10
(0.000) ***
−4.35
(0.000) ***
−1.61
(0.052) *
Unit root (Individual Unit Root Process)
IPS−10.10
(0.000) ***
−4.63
(0.000) ***
−11.63
(0.000) ***
−4.91
(0.000) ***
−2.08
(0.018) **
ADF-Fisher Chi-square80.86
(0.000) ***
33.72
(0.000) ***
95.23
(0.000) ***
38.76
(0.000) ***
17.67
(0.023) **
*, **, *** significant at 10%, 5%, and 1% levels.
Table 7. Second-generation PURT CIPS for SEE.
At Levels
CO2GDPEPRENSIURB
CIPS−2.04 (>0.10)−1.88 (>0.10)−1.32 (>0.10)−2.91 (<0.01)−0.51 (>0.10)
At first difference
CIPS−5.31 (<0.01)−3.92 (<0.01)−3.05 (<0.01)−4.41 (<0.01)−4.93 (<0.01)
Table 8. Second-generation PURT CIPS for Baltic countries.
At Levels
CO2GDPEPRENSIURB
CIPS−1.99 (>0.10)−2.31 (<0.10)−0.80 (>0.10)−3.58 (<0.01)−1.1 (>0.10)
At first difference
CIPS−6.43 (<0.01)−8.74 (<0.01)−3.50 (<0.01)−5.36 (<0.01)−4.43 (<0.01)
Table 9. Second-generation PURT CIPS for Nordic countries.
At Levels
CO2GDPEPRENSIURB
CIPS−1.88 (>0.10)−2.19 (>0.10)−2.61 (<0.01)−2.11 (>0.10)−2.06 (>0.10)
At first difference
CIPS−6.52 (<0.01)−2.95 (<0.01)−5.80 (<0.01)−4.63 (<0.01)−1.86 (<0.05)
Table 10. Panel ARDL(1,1,1,1,1) for SEE.
IndicatorCoefficientStd. Errort-StatisticProb. *
Long-Run Equation
GDP0.460.076.710.000 ***
EPREN−0.0010.008−0.170.862
SI0.540.173.120.002 ***
URB−4.540.51−8.790.000 ***
Short-Run Equation
COINTEQ01−0.440.22−1.980.050 **
D(GDP)0.670.144.640.000 ***
D(EPREN)0.0090.0042.090.038 **
D(SI)−0.180.07−2.360.020 **
D(URB)2.385.050.470.638
C6.483.331.940.054 *
*, **, *** significant at 10%, 5%, and 1% levels.
Table 11. Panel ARDL(3,1,1,1,1) for Baltic countries.
IndicatorCoefficientStd. Errort-StatisticProb. *
Long-Run Equation
GDP1.650.562.950.004 ***
EPREN−0.030.01−1.930.056 *
SI−6.221.88−3.290.001 ***
URB−29.278.33−3.510.000 ***
Short-Run Equation
COINTEQ01−0.270.16−1.700.092 *
D(CO2(-1))−0.040.08−0.590.590
D(CO2(-2))−0.170.25−0.680.494
D(GDP)0.020.400.040.950
D(EPREN)−0.010.008−2.080.840
D(SI)0.590.481.230.219
D(URB)−8.7810.19−0.860.391
C38.5922.581.700.091 *
*, **, *** significant at 10%, 5%, and 1% levels.
Table 12. Panel ARDL(3,3,3,3,3) for Nordic countries.
IndicatorCoefficientStd. Errort-StatisticProb. *
Long-Run Equation
GDP−0.590.11−5.060.000 ***
EPREN−0.140.04−3.190.002 ***
SI−0.0020.02−0.040.926
URB−18.021.42−12.650.000 ***
Short-Run Equation
COINTEQ01−0.670.39−1.690.095 *
D(CO2(-1))−0.030.16−0.230.814
D(CO2(-2))−0.170.30−0.570.565
D(GDP)1.470.324.490.000 ***
D(GDP(-1))−0.500.66−0.760.448
D(GDP(-2))0.320.201.600.114
D(EPREN)−0.120.13−0.970.331
D(EPREN(-1))−0.050.03−1.390.167
D(EPREN(-2))−0.220.10−2.170.033 **
D(SI)−0.120.18−0.680.496
D(SI(-1))−0.090.15−0.610.540
D(SI(-2))−0.100.33−0.320.749
D(URB)−20.4916.45−1.240.217
D(URB(-1))51.0217.202.960.004 ***
D(URB(-2))−20.0410.84−1.840.069 *
C59.1934.941.690.095 *
*, **, *** significant at 10%, 5%, and 1% levels.
Table 13. Dumitrescu–Hurlin Panel Causality test for SEE.
Null Hypothesis (H0)W-Stat.Zbar-Stat.Prob. Conclusion
CO2 d.n.h.c EPREN0.43091−1.473850.1405
EPREN d.n.h.c CO25.164242.545260.0109 **EPREN→CO2
GDP d.n.h.c EPREN6.123593.359850.0008 ***GDP→EPREN
EPREN d.n.h.c GDP0.80766−1.153940.2485
URB d.n.h.c EPREN12.63268.886740 ***URB→EPREN
EPREN d.n.h.c URB10.45577.03832.00 × 10−12 ***EPREN→URB
SI d.n.h.c EPREN5.606752.9210.0035 ***SI→EPREN
EPREN d.n.h.c SI5.894733.165530.0015 ***EPREN→SI
GDP d.n.h.c CO23.743831.339180.1805
CO2 d.n.h.c GDP5.467152.802470.0051 ***CO2→GDP
URB d.n.h.c CO25.354842.70710.0068 ***URB→CO2
CO2 d.n.h.c URB7.791544.776122.00 × 10−6 ***CO2→URB
SI d.n.h.c CO22.400770.198780.8424
CO2 d.n.h.c SI2.474690.261540.7937
URB d.n.h.c GDP4.479471.963820.0496 **URB→GDP
GDP d.n.h.c URB22.116.92560 ***GDP→URB
SI d.n.h.c GDP3.954991.518480.1289
GDP d.n.h.c SI4.073791.619350.1054
SI d.n.h.c URB7.992554.94688.00 × 10−7 ***SI→URB
URB d.n.h.c SI2.709940.46130.6446
*, **, *** significant at 10%, 5%, and 1% levels. d.n.h.c stands for “does not homogeneously cause”.
Table 14. Dumitrescu–Hurlin Panel Causality test for Baltic countries.
Null Hypothesis (H0)W-Stat.Zbar-Stat.Prob. Conclusion
EPREN d.n.h.c CO22.14182−0.018270.9854
CO2 d.n.h.c EPREN2.12324−0.031930.9745
GDP d.n.h.c CO21.9811−0.136460.8915
CO2 d.n.h.c GDP4.338311.596920.1103
SI d.n.h.c CO22.988710.604490.5455
CO2 d.n.h.c SI8.68934.796412.00 × 10−6 ***CO2→SI
URB d.n.h.c CO23.902431.276390.2018
CO2 d.n.h.c URB1.48908−0.498260.6183
GDP d.n.h.c EPREN5.024592.101570.0356 **GDP→EPREN
EPREN d.n.h.c GDP1.98644−0.132530.8946
SI d.n.h.c EPREN4.315391.580060.1141
EPREN d.n.h.c SI6.65273.29880.001 ***EPREN→SI
URB d.n.h.c EPREN3.894121.270280.204
EPREN d.n.h.c URB6.045932.852610.0043 ***EPREN→URB
SI d.n.h.c GDP1.69077−0.349950.7264
GDP d.n.h.c SI6.607463.265530.0011 ***GDP→SI
URB d.n.h.c GDP3.259850.803870.4215
GDP d.n.h.c URB5.482882.438570.0147 **GDP→URB
URB d.n.h.c SI7.874954.197583.00 × 10−5 ***URB→SI
SI d.n.h.c URB3.170290.738010.4605
*, **, *** significant at 10%, 5%, and 1% levels. d.n.h.c stands for “does not homogeneously cause”.
Table 15. Dumitrescu–Hurlin Panel Causality test for Nordic countries.
Null Hypothesis:W-Stat.Zbar-Stat.Prob. Conclusion
EPREN d.n.h.c CO24.819342.25240.0243 **EPREN→ CO2
CO2 d.n.h.c EPREN2.256330.076130.9393
GDP d.n.h.c CO25.948373.211080.0013 ***GDP→ CO2
CO2 d.n.h.c GDP1.83682−0.280070.7794
SI d.n.h.c CO20.94086−1.040850.2979
CO2 d.n.h.c SI4.296961.808850.0705 *CO2 →SI
URB d.n.h.c CO26.526053.701580.0002 ***URB→ CO2
CO2 d.n.h.c URB4.280091.794530.0727*CO2→URB
GDP d.n.h.c EPREN3.951641.515630.1296
EPREN d.n.h.c GDP2.15258−0.011960.9905
SI d.n.h.c EPREN1.09059−0.913710.3609
EPREN d.n.h.c SI1.79916−0.312050.755
URB d.n.h.c EPREN8.030864.979336.00 × 10−7 ***URB→EPREN
EPREN d.n.h.c URB5.995483.251070.0011 ***EPREN→URB
SI d.n.h.c GDP3.869351.445760.1482
GDP d.n.h.c SI1.174−0.842880.3993
URB d.n.h.c GDP2.599140.367220.7135
GDP d.n.h.c URB3.600641.21760.2234
URB d.n.h.c SI6.328753.534050.0004 ***URB→SI
SI d.n.h.c URB6.740433.883620.0001 ***SI→URB
*, **, *** significant at 10%, 5%, and 1% levels. d.n.h.c stands for “does not homogeneously cause”.
Table 16. Comparison of long-run effects by region.
VariableSEEBalticNordic
GDP+0.46 ***+1.65 ***−0.59 ***
EPRENns−0.03 *−0.14 ***
SI+0.54 ***−6.22 ***ns
URB−4.54 ***−29.27 ***−18.02 ***
ECT−0.44 **−0.27 *−0.67 *
*, **, *** significant at 10%, 5%, and 1% levels; “ns” stands for not significant.
Disclaimer/Publisher’s Note: The statements, opinions and data contained in all publications are solely those of the individual author(s) and contributor(s) and not of MDPI and/or the editor(s). MDPI and/or the editor(s) disclaim responsibility for any injury to people or property resulting from any ideas, methods, instructions or products referred to in the content.

