Article

Climate Change Management and Firm Value: Insights from Southeast Asia Markets (A Survey of Public Companies in Indonesia, Malaysia and Thailand for the 2022–2023 Period)

1
Department of Accounting, Faculty of Economics and Business, Universitas Padjadjaran, Sumedang 45363, Indonesia
2
Faculty of Accountancy, Universiti Teknologi MARA Cawangan Selangor, Puncak Alam 42300, Malaysia
*
Author to whom correspondence should be addressed.
Sustainability 2025, 17(11), 4767; https://doi.org/10.3390/su17114767
Submission received: 22 April 2025 / Revised: 16 May 2025 / Accepted: 16 May 2025 / Published: 22 May 2025
(This article belongs to the Section Economic and Business Aspects of Sustainability)

Abstract

:
Climate change is a critical sustainability issue that influences investors’ decisions. Numerous organizations have implemented climate-related policies and established governance structures to address this challenge. This study examines the extent to which climate change management performance affects firm value. This research utilizes 13 climate change management performance indicators from the Refinitiv Eikon Database. Firm value was measured using the price-to-book value (PBV) ratio, with firm size, profitability, and cost of debt included as control variables. This study examines 531 public companies in three Southeast Asian countries. Quantitative data were analyzed using descriptive statistics, ANOVA, and path analysis. The results indicate that robust climate change management performance positively affects firm value. However, significant variations exist across countries and industries regarding climate change management practices. These findings highlight the necessity for organizations to strengthen their climate change management efforts by preparing comprehensive performance disclosures. Enhanced transparency can provide clearer insights for environmentally conscious investors, potentially fostering positive market reactions toward the company.

1. Introduction

Climate change has become a paramount concern for businesses worldwide, necessitating strategic responses and adaptive measures. Contemporary organizations are increasingly recognizing the imperative to integrate climate change considerations into their operational frameworks and long-term strategies [1]. This shift is driven by a multitude of factors, including regulatory pressures, stakeholder expectations, and the tangible impact of climate change on business operations [2]. Companies are implementing diverse approaches, such as adopting sustainable practices, investing in renewable energy sources, and developing innovative technologies to mitigate their carbon footprint [3]. The urgency of addressing climate change has never been more critical, as the consequences of inaction have become increasingly apparent. The interconnected nature of global economies means that climate-related risks and opportunities have far-reaching implications for supply chains, market dynamics, and overall business resilience [4]. Furthermore, growing awareness among consumers and investors regarding environmental sustainability is reshaping market preferences and investment decisions, making climate change management a key determinant of long-term business viability and competitiveness [5].
Effective climate change management by organizations necessitates a comprehensive approach that integrates environmental considerations into corporate governance structures and translates them into concrete actions [6]. At the governance level, boards of directors should establish dedicated committees focused on sustainability and climate-related issues to ensure oversight and strategic direction [7]. These committees should collaborate closely with management to develop and implement climate-related policies, establish targets for emission reduction, and monitor progress. Organizations should also incorporate climate-related risks and opportunities into their risk management frameworks and financial planning processes [8]. Organizations should implement a comprehensive range of measures to address climate change [9]. This encompasses conducting thorough assessments of their carbon footprint across the entire value chain and establishing science-based targets for emission reduction [10]. Organizations should also prioritize innovation in developing low-carbon products and services, thereby creating new business opportunities while contributing to climate change solutions [6]. Transparency and accountability are essential, with regular reporting on climate-related metrics and progress toward targets through established frameworks [11]. Moreover, organizations should engage with stakeholders, including employees, customers, and investors, to communicate their climate strategies and solicit input [12].
Climate change management has emerged as a significant focus in accounting research, reflecting the increasing importance of environmental sustainability in corporate governance and financial reporting [13]. This study examines how organizations integrate climate-related risks and opportunities into their financial planning, risk management, and decision-making processes. Accounting scholars are investigating methodologies for measuring, reporting, and verifying greenhouse gas emissions as well as developing frameworks for disclosing climate-related financial information [14]. The Task Force on Climate-Related Financial Disclosures (TCFD) recommendations have been a particular area of scholarly interest, as they provide a structured approach for organizations to report on climate-related risks and opportunities [15].
Effective climate change management can significantly enhance a company’s value through various mechanisms. First, it can lead to improved operational efficiency and cost savings through the implementation of energy-efficient technologies and sustainable practices [16]. Second, proactive climate management can facilitate the identification and capitalization of new business opportunities in a low-carbon economy, potentially leading to increased revenue and market share [17]. Third, robust climate change management practices can enhance a company’s reputation and attract environmentally conscious consumers and investors, which can positively impact stock prices and access to capital [18]. Finally, by effectively managing climate-related risks, companies can mitigate their exposure to potential regulatory penalties, litigation, and physical risks associated with climate change, thereby safeguarding their long-term shareholder value [19].
This study contributes to the discourse on whether climate change management disclosures can influence firm value by examining the relationship between disclosure practices and company value. The study analyzes how comprehensive climate-related disclosures correlate with company value. By comparing firms with robust climate management disclosures to those with limited or no disclosures, this study identifies the potential differences in financial outcomes. Furthermore, it investigates how the quality and specificity of climate-related information impact investor perceptions and decision-making. This analysis provides insights into whether transparent and detailed climate disclosures lead to improved stakeholder trust, reduced information asymmetry, and, ultimately, enhanced firm value. The study also explores the potential benefits of climate management disclosures in terms of risk mitigation, operational efficiency, and competitive advantage, all of which could contribute to long-term value creation. By addressing these aspects, this study contributes valuable empirical evidence to the ongoing debate on the financial implications of climate-related disclosures and their potential to influence firm value.
The novelty of this study lies in its comprehensive approach to measuring climate change management using 13 indicators provided by the Refinitiv Eikon Database. The Refinitiv Eikon, a globally recognized financial and sustainability information platform widely used by institutional investors and researchers. Refinitiv provides standardized environmental, social, and governance (ESG) indicators across thousands of companies worldwide, including climate-related disclosures that align with global frameworks such as the TCFD. The platform is subscription-based and maintained by London Stock Exchange Group (LSEG), offering comprehensive, audited ESG metrics for publicly listed companies. This multifaceted assessment offers a more nuanced and holistic view of corporate climate-related practices than previous studies, which may have relied on fewer or less diverse metrics [20]. By incorporating a wide range of indicators, this study captures various aspects of climate change management, potentially including emission reduction targets, energy efficiency initiatives, climate risk assessments, and sustainability reporting practices. This comprehensive measurement approach allows for a more accurate and detailed evaluation of companies’ climate-related efforts, providing stakeholders with a clearer picture of corporate environmental performance and commitment. The utilization of standardized data from a reputable source such as Refinitiv Eikon enhances the reliability and comparability of the findings across different companies and sectors, contributing to the robustness of the study’s conclusions and its potential impact on understanding the relationship between climate change management and corporate performance.
Climate change management and its impact on firm value in Southeast Asia are an emerging area of research with significant implications for businesses and policymakers in the region. Studies indicate that green supply chain management (GSCM) practices are gaining popularity among organizations in Southeast Asia as a way to demonstrate commitment to sustainability [21]. Green supply chain management (GSCM) is an approach that integrates environmental considerations into supply chain processes to reduce the ecological impact of business operations while addressing climate change concerns. GSCM practices, such as sustainable sourcing, eco-friendly production, and green logistics, can help companies mitigate their carbon footprints and contribute to climate change management efforts. This suggests that adopting climate-friendly practices can potentially enhance the firm value in the region. Interestingly, while many large corporations in Southeast Asia have started encouraging and even funding their suppliers to adopt green practices, the extent of supply chain greening varies across countries [22]. This highlights the need for further research to understand the factors influencing the adoption of climate change management practices and their impact on company value across Southeast Asian nations.
The remainder of this paper is structured as follows: Section 2 presents a concise review of the literature and delineates the research hypotheses; Section 3 elucidates the research methodology; Section 4 expounds upon the research findings and their implications and provides a discussion thereof; and Section 5 concludes the article.

2. Literature Review and Hypothesis Development

2.1. Stakeholder Theory

Stakeholder theory plays a crucial role in shaping corporate responses to climate change, which in turn can significantly impact company value and reputation. Companies that proactively engage with stakeholders and address their concerns regarding climate change are more likely to enhance their reputations and long-term values [23,24]. Research indicates that firms with a higher stakeholder orientation and environmental proactivity tend to experience improved profitability, suggesting a positive link between stakeholder management, climate action, and financial performance [25]. Interestingly, the relationship between stakeholder pressure and corporate climate strategy is not always straightforward. Some studies have found that organizations’ response strategies to greenhouse gas reduction pressures are not directly related to individual stakeholder groups, but rather to the company’s level of pollution, as measured by its GHG intensity [26]. This highlights the complexity of the factors that influence corporate climate change management.
Effective climate change management, guided by stakeholder theory, can positively impact a company’s value and reputation. Companies that integrate climate change issues into their governance structures, adopt eco-innovative technologies, and engage with institutional investors in climate-related disclosures are more likely to demonstrate a strong commitment to climate change [17,23]. This commitment, in turn, can lead to improved stakeholder relationships, an enhanced reputation, and potentially better financial performance. However, the relationship between stakeholder pressure and climate strategies is complex and may be influenced by various contextual factors, emphasizing the need for a nuanced approach to climate change management [27].

2.2. Agency Theory

Agency theory plays a significant role in understanding the relationship between climate change management and a company’s value or reputation. According to [28], corporate responses to climate change are influenced by the nature of a firm’s corporate governance, with institutional ownership and board entrenchment significantly impacting climate change and environmental mitigation policies. This aligns with the agency theory, which suggests that managers may not always act in the best interests of shareholders, particularly when it comes to long-term environmental issues. Interestingly, the authors of [29] offer both confirmatory and contradictory results regarding board independence in relation to climate change disclosures. Their study found that increasing the proportion of independent non-executives on the board and separating the CEO–board chair role can directly increase climate change disclosure in sustainability reports. This suggests that stronger governance mechanisms can lead to better climate change management practices. The impact of climate change management on company value and reputation is evident in several studies. The authors of [30] demonstrated that the adoption of climate change management practices, such as establishing carbon targets and using renewable energy, can enhance corporate reputation. Similarly, [18] revealed that firms with higher climate risk exposure face more stringent loan terms, but those that implement climate risk management measures can mitigate these negative impacts. This indicates that effective climate change management can positively influence a company’s financial performance and reputation, ultimately affecting its value [17,18].

2.3. Legitimacy Theory

Legitimacy theory provides a framework for understanding how companies manage their reputation and value in relation to societal expectations, particularly those concerning climate change. As societal concerns about climate change grow, firms that address these issues can enhance their reputation and legitimacy, while those lagging behind may face reputational risks and the loss of organizational legitimacy [31]. Corporate responses to climate change are influenced by managers’ awareness and perceptions of climate risk, with risk tolerance moderating the relationship between perceived risk exposure and climate action [5]. Environmental management practices such as environmental innovation and cleaner production positively impact corporate reputation by improving legitimacy and stakeholders’ perceptions of a firm’s commitment to environmental sustainability [32]. Interestingly, the relationship between corporate social responsibility (CSR) activities, which often include climate change initiatives, and firm performance is U-shaped, with this relationship strengthening during crises such as the COVID-19 pandemic [33]. This suggests that while initial CSR efforts may not immediately translate into improved performance, continued commitment can lead to significant benefits. Additionally, climate change sentiment has been shown to negatively affect firm value, particularly growth option value and Tobin’s Q, but strong environmental, social, and governance (ESG) practices can moderate this effect, enhancing firms’ resilience to climate risk [34].
Legitimacy theory underscores the importance of aligning corporate practices with societal expectations of climate change. Companies that proactively manage climate-related risks and integrate robust ESG strategies, including eco-innovation and climate governance, are better positioned to maintain legitimacy, enhance their reputation, and sustain firm value in the face of growing climate change concerns [17]. As the relationship between business and society evolves, companies must adapt their ethical, social, and environmental practices to navigate the increasingly dynamic and diverse societal expectations surrounding climate change [35].

2.4. Climate Change and Company Policy

Climate change management, disclosure, and governance are interconnected aspects of corporate sustainability. Research indicates that effective climate change management is often reflected in the quality and extent of climate change disclosure [36]. Companies with more capable managers tend to make more comprehensive climate change disclosures, suggesting a link between management quality and transparency [37]. Corporate governance plays a crucial role in this relationship, and board effectiveness is positively associated with both the decision to disclose climate-related information and the quality of such disclosures [11]. Interestingly, regulatory policies have mixed effects on climate change disclosure practices. While mandatory reporting schemes such as Australia’s NGERS can increase voluntary climate change-related disclosures [19], the implementation of contentious policies, such as a Carbon Tax, may lead to reduced disclosures as companies attempt to avoid drawing attention to sensitive issues. This highlights the complex interplay among policy, governance, and disclosure practices. In conclusion, effective climate change management, robust governance structures, and supportive policies are the key drivers of comprehensive climate change disclosure. However, this relationship is not always straightforward because political and economic factors can influence corporate strategies regarding climate-related transparency. As stakeholder pressure increases, particularly from institutional investors [23,38], companies are likely to face growing demands for improved climate change management and disclosure practices, emphasizing the need for integrated approaches to climate governance and policy.
This research used 13 indicators of climate change management policy as stated in the Refinitiv Database. The 13 indicators are directly aligned with the recommendations set forth by the Task Force on Climate-Related Financial Disclosures (TCFD) [39]. The TCFD framework encourages organizations to disclose climate-related information under four key thematic pillars: governance, strategy, risk management, and metrics and targets [40]. Each of the 13 indicators corresponds to one or more of these pillars and reflects corporate practices in managing and disclosing climate-related risks and opportunities. For example, indicators such as “climate policy statement”, “climate commitment”, and “board oversight of climate risks” are consistent with the governance pillar, highlighting the extent to which climate issues are integrated into corporate oversight structures. Indicators like “climate scenario analysis”, “climate change risk and opportunities strategy”, and “integration into risk management” relate to the strategy and risk management pillars, capturing how firms assess and respond to physical and transitional climate risks. Meanwhile, disclosures such as “remuneration arrangements linked to climate performance”, “climate-related risk assessment process”, and “business impact of scenario analysis” reflect progress under the metrics and targets category, indicating the firm’s capacity to quantify, evaluate, and act on climate-related goals.
While objective and quantifiable indicators such as carbon emission reduction and the proportion of renewable energy use may provide deeper insight into actual environmental performance, their inclusion in the current study would introduce significant challenges related to data completeness, standardization, and comparability [41]. First, climate-related outcome data—particularly Scope 1, 2, and 3 carbon emissions—are still inconsistently disclosed by firms in Indonesia, Malaysia, and Thailand. A large portion of listed companies do not report emissions at all, or only disclose selected scopes, making it difficult to construct a balanced and representative sample [42,43]. Similarly, data on renewable energy use are often qualitative, fragmented, or limited to high-profile firms, especially in the energy or utility sectors. Second, even when emissions or renewable energy data are available, there exists considerable variability in measurement approaches, reporting standards, and target baselines across companies [44]. Some firms follow the GHG Protocol, while others use national guidelines or voluntary schemes. This inconsistency introduces substantial measurement error and complicates direct comparisons across firms and countries. Moreover, differing levels of technological maturity and sector-specific constraints can affect emissions intensity and renewable adoption, potentially biasing the results in favor of larger or more visible companies, rather than reflecting true climate management capability [45].

2.5. Firm Value

In the sustainable and climate change era, firm value is increasingly tied to a firm’s ability to address environmental challenges and demonstrate a commitment to climate action. Research indicates that corporate eco-innovation and climate governance are positively associated with commitment to climate change mitigation [17]. Companies that adopt innovative approaches to efficiently control pollution, reduce resource use, and minimize environmental impacts are more likely to commit to climate change mitigation. Furthermore, integrating climate change issues into governance structures can help address climate-related risks and opportunities, and enhance a company’s value proposition [17,46]. Interestingly, despite the growing importance of environmental issues, some research suggests that the environmental focus in the corporate sustainability literature has waned, highlighting a potential disconnect between academic research and pressing environmental challenges [47]. This contradiction underscores the need for businesses to reassess their problem focus and recalibrate theoretical foundations to better address environmental challenges, such as climate change.
Firm value in the sustainable and climate change era is increasingly determined by a firm’s ability to innovate, adapt, and integrate climate considerations into its core business strategies [48]. Corporate social responsibility initiatives can act as strategic buffers, enhancing corporate sustainability and resilience in the face of climate-related challenges [49]. To maximize value creation, companies should focus on developing dynamic capabilities that support environmental and economic sustainability, while aligning with Sustainable Development Goals [50].
While Tobin’s Q is widely used as a proxy for firm value in many studies, its application in this research context may not be suitable due to several reasons. First, Tobin’s Q requires a reliable and up-to-date market valuation of a firm’s total assets, which is often difficult to obtain or inconsistently reported in emerging markets such as Indonesia, Malaysia, and Thailand [51]. The market value of assets is especially challenging to estimate for firms in these regions due to less transparent disclosures, diverse accounting practices, and limited analyst coverage. Second, Tobin’s Q is sensitive to fluctuations in market perceptions and external shocks, which may not accurately reflect a firm’s internal performance or long-term value creation related to climate change management [52,53]. In contrast, the price-to-book value (PBV) ratio, while not without limitations, is more straightforward, widely available, and better aligned with financial reporting structures in Southeast Asia. Therefore, the PBV ratio was selected as a more practical and consistently available proxy for firm value in this study.

2.6. Hypothesis Development

Research suggests that companies’ responses to climate change can significantly affect their value. Companies that actively engage in climate change mitigation and disclosure tend to be viewed more favorably by investors, potentially leading to higher valuations. For instance, voluntary climate change disclosures have been found to positively influence corporate financing decisions [20]. This improved transparency can lead to a lower cost of debt as investors reward corporate climate efforts with lower-cost funds [54]. Interestingly, the relationship between environmental performance and voluntary climate change disclosure is positive [55], indicating that companies with better environmental records are more likely to disclose their climate-related activities. This increased transparency can enhance a company’s reputation and, potentially, its market value. However, it is worth noting that the impact of climate change actions on company value may vary across industries and regions, with some studies focusing on developed markets and others examining emerging economies [20,54].
While the direct relationship between climate change actions and P/B ratios is not explicitly addressed in the provided studies, evidence suggests that proactive climate change strategies and disclosures can positively influence a company’s financial performance and investor perceptions. In turn, this can lead to improved market valuations and potentially higher P/B ratios. Although previous research has suggested that the relationship between climate change management performance and firm value may operate through intermediary mechanisms, such as corporate innovation capability, stakeholder perception, or brand reputation [56,57], this study did not incorporate such mediating or moderating variables. The primary reason for this decision is the lack of consistent, observable, and quantifiable measures for these constructs, particularly in the context of Southeast Asian markets. Many of the proposed intervening factors are either intangible (e.g., brand image), firm-specific (e.g., innovation strategy disclosure), or not systematically available in widely-used databases such as Refinitiv Eikon, making reliable cross-firm or cross-country comparisons difficult [58,59]. Furthermore, the academic literature is still evolving in terms of developing robust, standardized indicators and validated measurement models for these constructs, especially when applied to emerging markets. As such, introducing these elements prematurely could compromise model validity and introduce measurement bias. Therefore, we propose the following hypothesis:
H1. 
Climate change policy management has a positive and significant impact on firm value, as measured by the price-to-book value (PBV) ratio.
In addition to this primary hypothesis, the model includes three control variables: firm size, profitability, and cost of debt. These variables are included based on theoretical and empirical evidence suggesting that they may also influence firm value. Firm size is commonly associated with organizational capacity and access to resources. Larger firms often possess more capital, managerial expertise, and technological infrastructure to invest in sustainability initiatives and comply with environmental regulations [60]. This can lead to improved ESG performance and potentially higher firm value. However, larger firms may also suffer from bureaucratic inertia or face greater public scrutiny, which can reduce operational efficiency or raise reputational risks if ESG expectations are not met [61]. Profitable firms are more likely to allocate resources to sustainability programs, ESG reporting, and climate-related investments [34]. They are also more resilient to external shocks, such as regulatory changes or environmental liabilities [62]. In turn, profitability is positively correlated with investor confidence and firm valuation. Cost of debt, such as interest expense relative to liabilities, reflects how creditors perceive the firm’s risk profile. In the ESG context, firms with poor environmental or governance practices may face higher borrowing costs due to increased exposure to litigation, regulatory penalties, or reputational damage [63]. Conversely, firms with strong ESG credentials may benefit from preferential financing (e.g., green bonds or sustainability-linked loans), thereby lowering their cost of capital. Thus, cost of debt acts as both a financial and ESG-relevant variable that signals market perceptions of corporate sustainability and risk management [64]. While no formal hypotheses are stated for the control variables, their statistical effects are analyzed and interpreted to provide a more complete understanding of the factors influencing firm value.

3. Methods

This research was quantitative with a causal approach. This study used data on public companies in Indonesia, Malaysia, and Thailand. Data collection in these three countries was based on two arguments: (1) they are located in the Southeast Asian region, which has a tropical climate, and (2) the availability of complete data in the Refinitiv Eikon Database compared to other Asian countries. These countries are part of the Southeast Asian region, characterized by tropical climates and high exposure to climate change-related risks. Their environmental vulnerability makes them an appropriate context for examining the strategic role of climate change management at the corporate level. Although Singapore is a key economy in Southeast Asia, it was intentionally excluded from this study due to the structural composition of its capital market, which is heavily concentrated in banking and financial services. In contrast, Indonesia, Malaysia, and Thailand have a more diverse industrial base, including significant extractive and environmentally sensitive sectors, such as energy, manufacturing, and agriculture, that are more directly impacted by climate change. Including Singapore would have introduced structural bias and limited comparability in assessing corporate responses to environmental risks. Moreover, among Southeast Asian nations, Indonesia, Malaysia, and Thailand offer the most comprehensive and consistent climate-related disclosure data available through the Refinitiv Eikon Database. In contrast, other countries in the region—such as Vietnam and the Philippines—have limited coverage, while nations like Laos, Cambodia, and Myanmar are not represented at all in the database. To ensure data quality and comparability, only countries with reliable ESG disclosure records were included in the analysis.
Two years, 2022 and 2023, were selected as the research years. However, 2024 was not included because of the unavailability of data at the beginning of 2025, when the research began. Additionally, data prior to 2021 were limited in both volume and quality, making them unsuitable for robust analysis. The final sample comprised 2628 companies, consisting of 531 companies with details: 61 Indonesian companies, 304 Malaysian companies, and 166 Thai companies. In terms of industry classification, the companies span across 10 sectors based on Refinitiv’s GCIS sectoral categorization, including financials, industrials, energy, utilities, consumer staples, information technology, and others. The largest representation comes from the financial and industrial sectors, which reflects the market composition of listed companies in Southeast Asia.
This study examined one independent variable and one dependent variable. The independent variable was climate change policy management. This variable was measured through the approach of disclosures related to climate change management obtained from the company’s annual report, which was extracted from the Refinitiv Eikon Database. The data used in this study were extracted from the Refinitiv Eikon ESG database during January–February 2025. The selection was limited to publicly listed companies in Indonesia, Malaysia, and Thailand, with available climate-related disclosure data for the years 2022 and 2023. A total of companies were retained after applying the following screening criteria: (1) the availability of at least one climate policy disclosure indicator among the 13 Refinitiv ESG items related to climate change management; (2) the availability of firm value data measured by the price-to-book value (PBV) ratio; and (3) complete financial data for the control variables—firm size, profitability, and cost of debt. Data cleaning procedures included the removal of duplicate listings, companies with incomplete financial disclosures, and firms operating in non-commercial sectors. All variable definitions and scores were used as provided by Refinitiv’s standardized ESG scoring methodology. The author confirms that institutional access to the Refinitiv Eikon platform was granted through an academic license provided by Universitas Padjadjaran, Indonesia, ensuring the legitimate use of the database for research purposes.
Table 1 shows the 13 indicators used as the basis for calculating the value of climate change policy management. Each indicator measures the presence or absence of items related to climate change policy management. The dependent variable is the value of the company as measured using the value of price-to-book value (PBV). The PBV was chosen because it represents the reaction of investors to the information in the company’s report. Although simple, the PBV is stronger than Tobin’s Q in determining the value of a company because Tobin’s Q has many biased assumptions in determining the market value of assets that can cause the company’s value to be imprecise. As there is a time lag between information disclosure and investor reaction, the PBV taken was the PBV position at the end of the first quarter (31 March) on each of the selected countries’ stock exchanges. This study used three control variables: (1) company size, which reflects the company’s economic resources, where greater economic resources certainly indicate a company that is well established in business, so it is of greater value than companies with small assets; (2) profitability, the company’s main financial performance, which means that companies with high profitability will be the target of investors, so that the company’s value will increase; and (3) cost of debt, where the high cost of debt will be an obstacle to obtaining funding and reducing the company’s credibility in the eyes of investors, so that a company with good value has a low cost of debt.
Data were analyzed quantitatively using the following statistical tools:
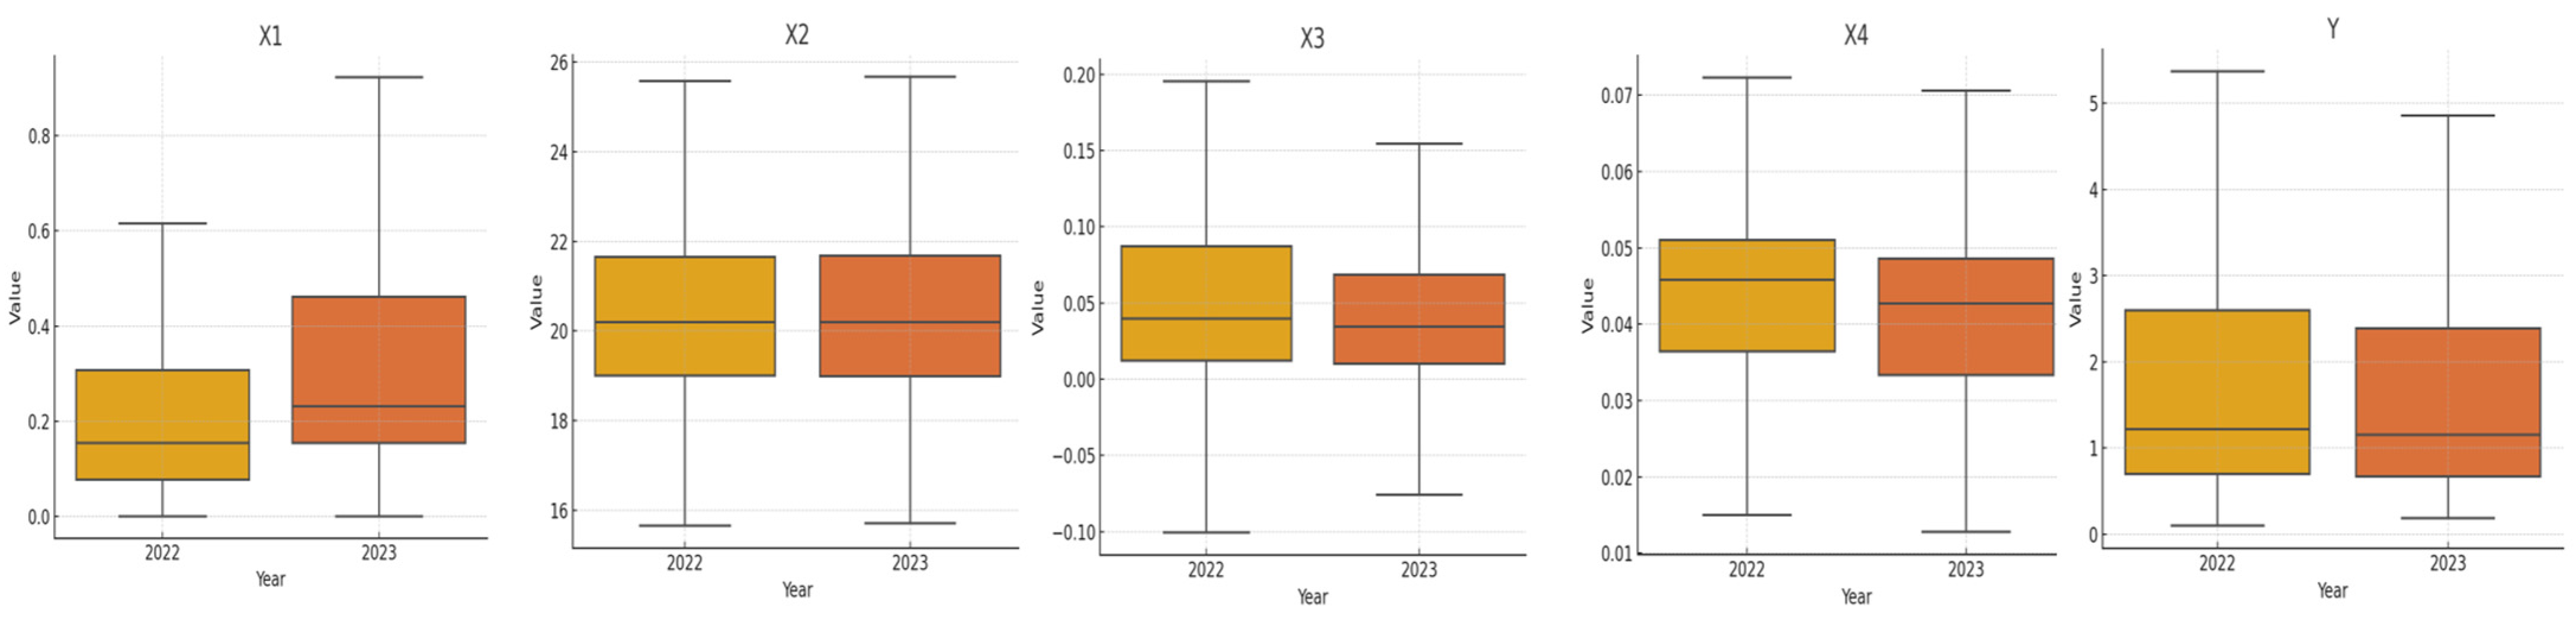
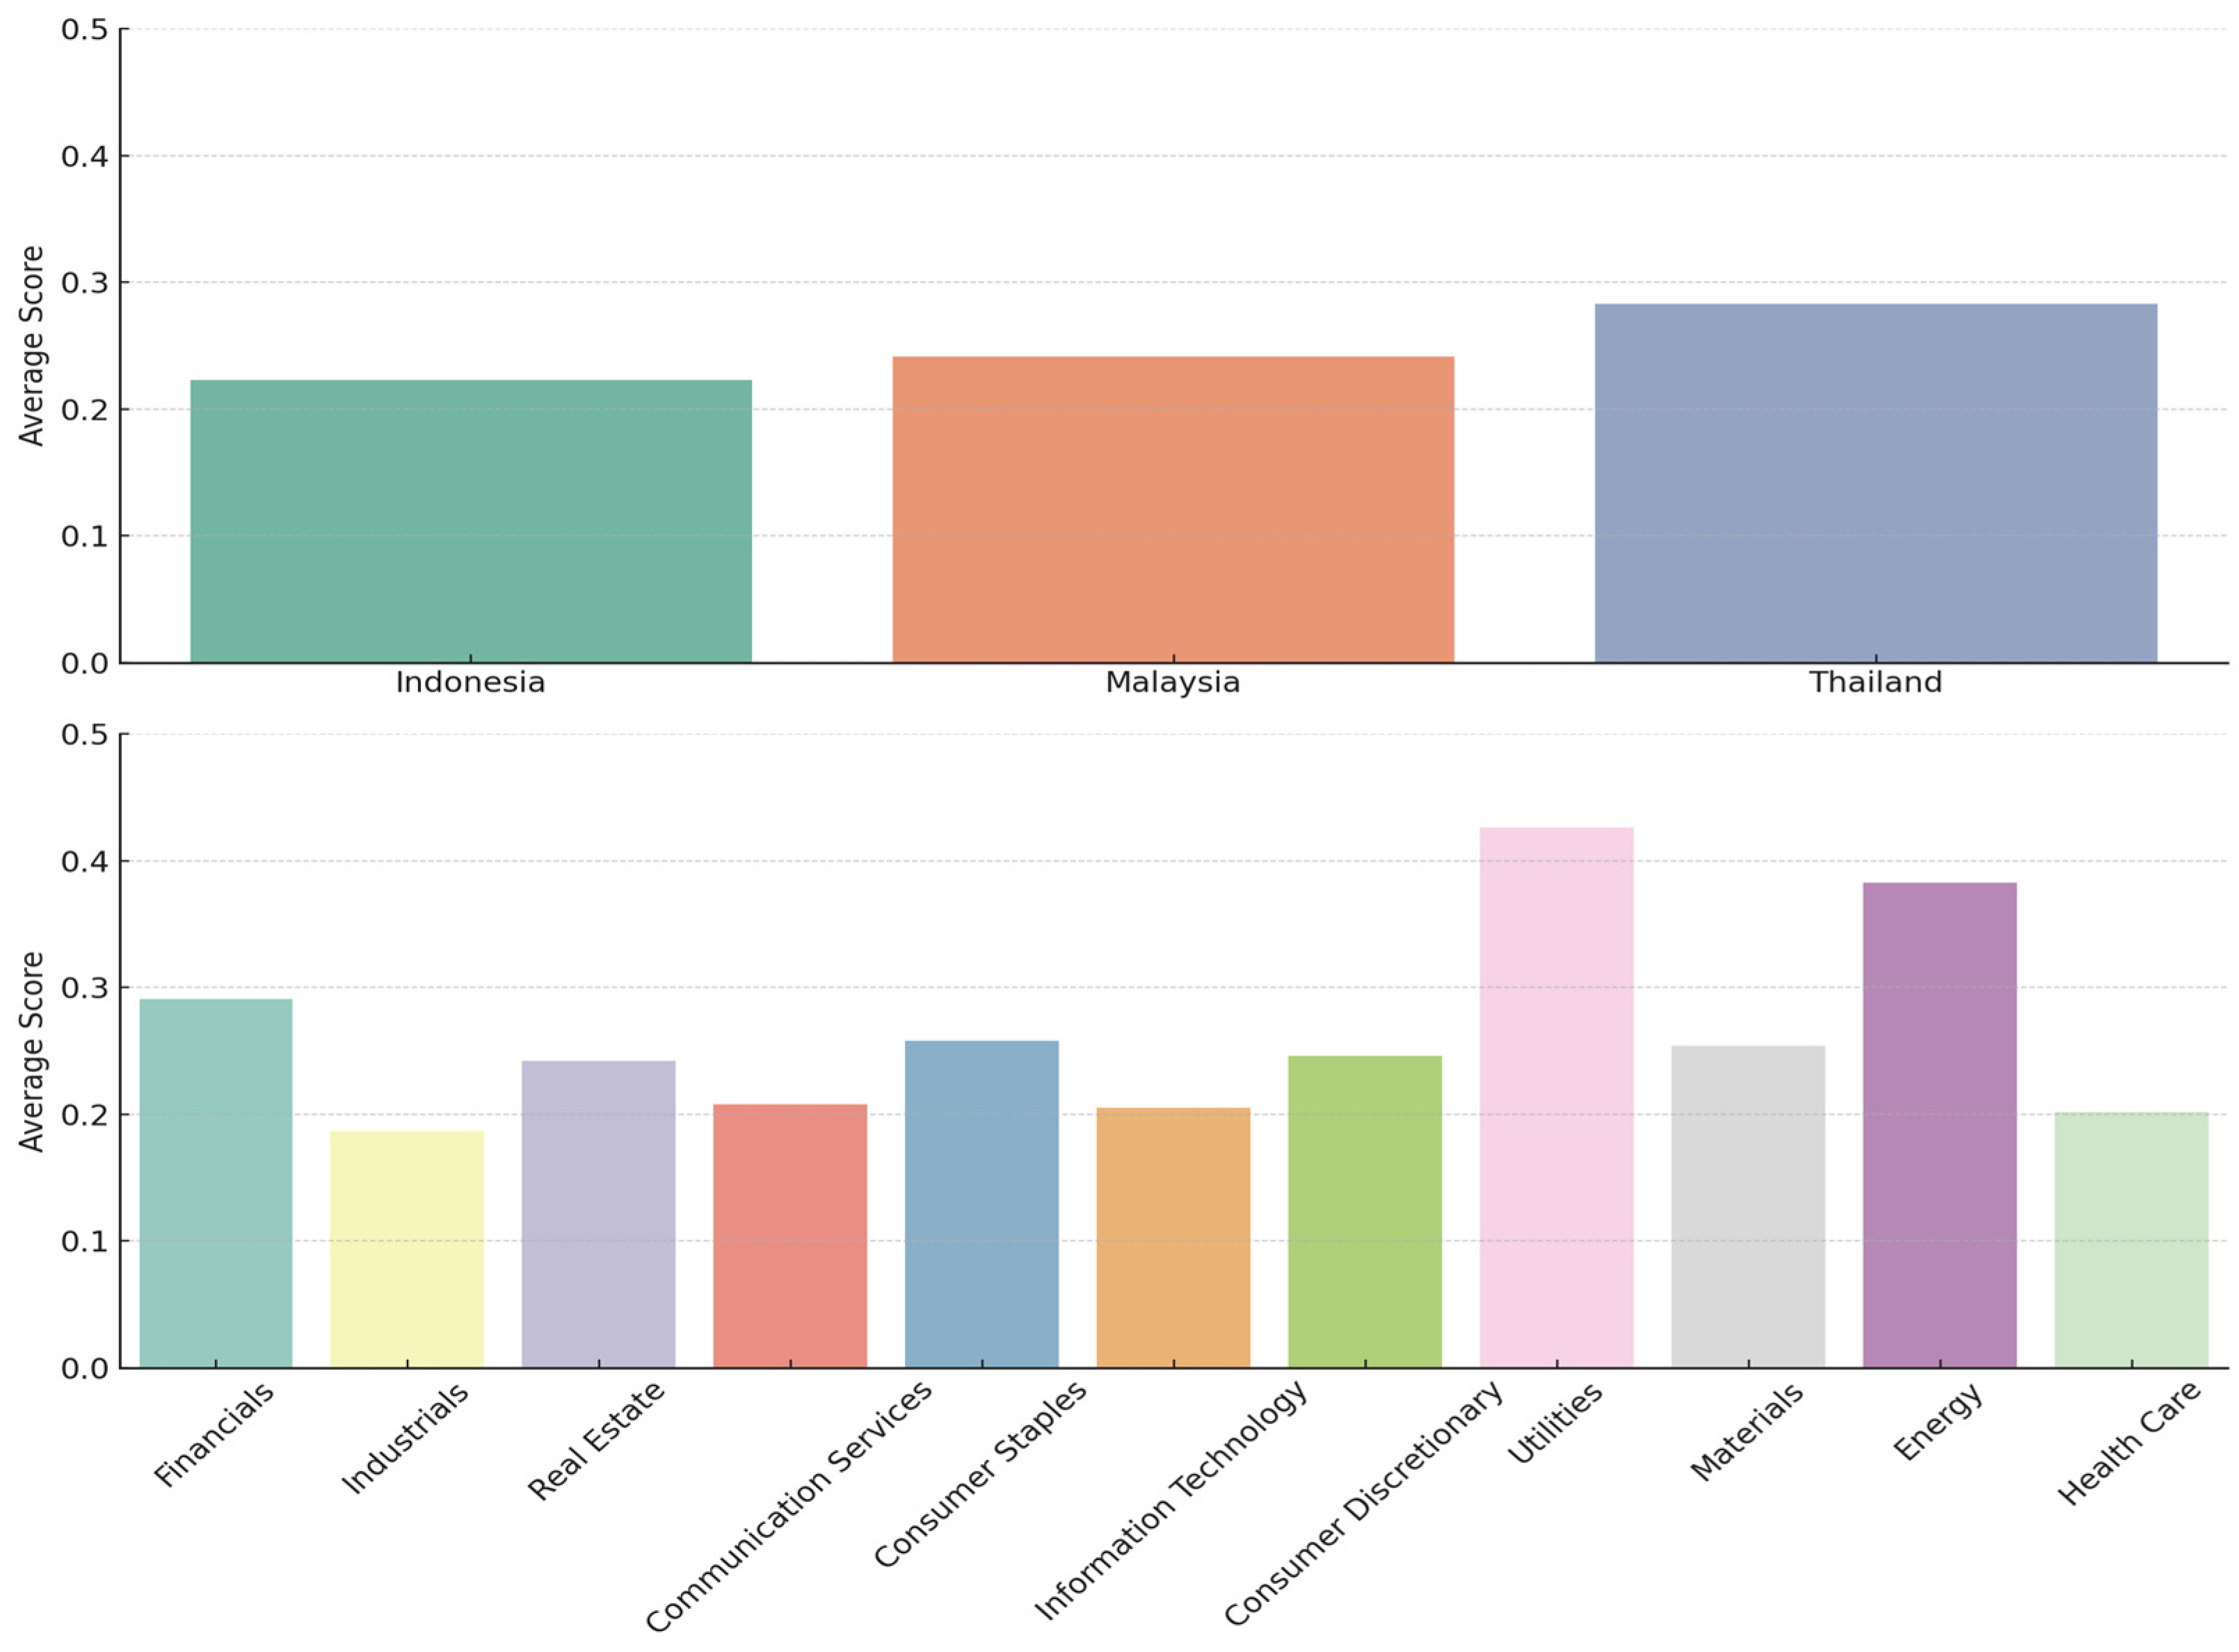
  • For descriptive analysis of the data, statistical measures, such as means, standard deviations, and maximum and minimum values, were computed. Additional descriptive examinations were conducted by comparing averages across three categories: (a) yearly, to observe annual fluctuations in variable components; (b) by country, to assess potentially significant disparities in climate change management policy between nations; and (c) by industry, to evaluate potentially significant variations in the same climate change management policy aspects across different sectors. The industry categorization employed follows the Global Industry Classification Standard (GICS), a system that groups companies based on their primary business activities. The GICS comprises 11 sectors: (i) energy, (ii) materials, (iii) industrial, (iv) consumer discretionary, (v) consumer staples, (vi) health care, (vii) financials, (viii) information technology (IT), (ix) communication services, (x) utilities, and (xi) real estate. More detailed data can be found in Appendix A below.
  • To determine whether the observed differences between years were statistically significant, this study utilized the paired sample t-test for year-on-year comparisons, while the ANOVA test was applied to examine differences among countries and industries.
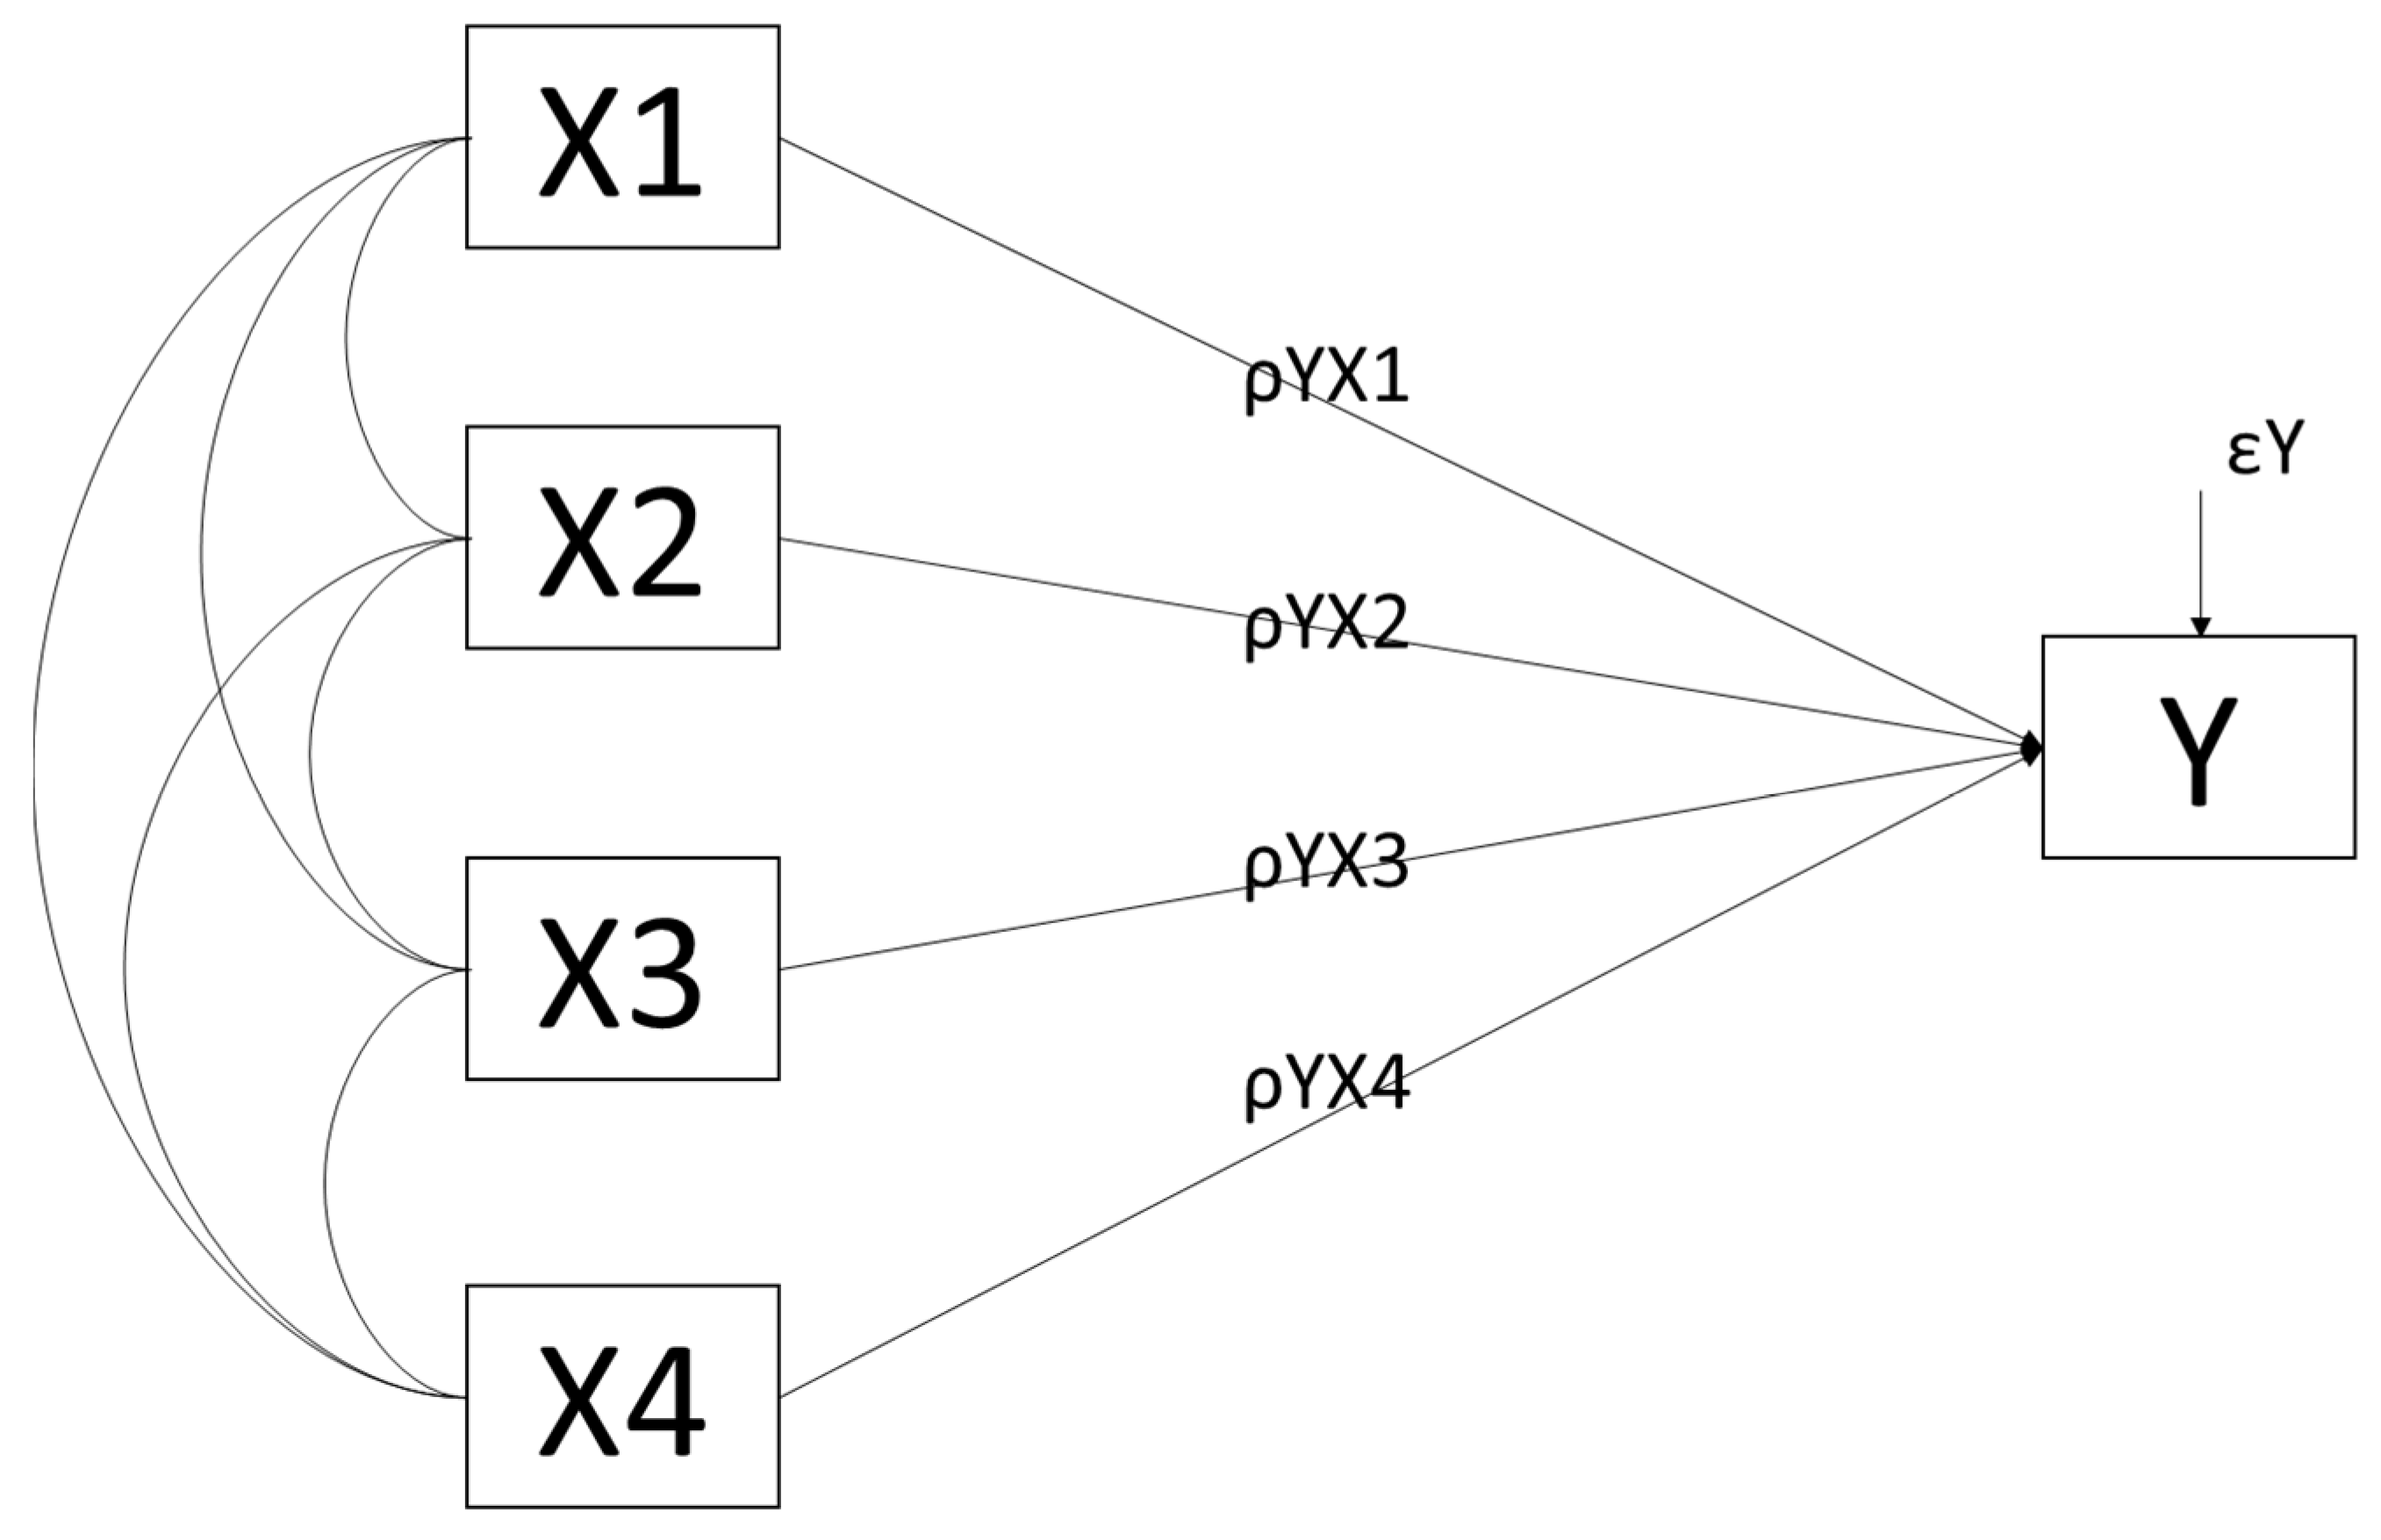
  • A path analysis tool was used to test this hypothesis. Path analysis was used because the control variables in the model were theoretically related to each other. To test this hypothesis, path analysis was conducted to assess the direct effect of climate policy management (X1) on firm value (Y) while controlling for firm size (X2), profitability (X3), and cost of debt (X4). Firm size is related to profitability because it may result from the use of firm assets. Large company assets can generate high profits. Company assets are also a significant guarantee of debt; therefore, company size is related to the cost of debt. Company profitability can also reduce the cost of debt because of the high level of investor confidence in companies with high profitability, which indicates low financial risk. Path analysis was performed using the ordinary least squares (OLS) approach, so classical assumption testing was required in the form of normality, multicollinearity, heteroscedasticity, and autocorrelation tests to ensure that the model would be sufficiently good for testing. The path diagram for this study is presented in Figure 1. The path equation is as follows:
The following is a structural equation for the path equation:
Y = ρ Y X 1 X 1 + ρ Y X 2 X 2 + ρ Y X 3 X 3 + ρ Y X 4 X 4 + ε Y
where
ρ = standardized path coefficient;
Y = price-to-book value;
X1 = climate change policy management;
X2 = company size;
X3 = profitability;
X4 = cost of debt;
ρYX1 = standardized path coefficient from X1 to Y;
ρYX2 = standardized path coefficient from X2 to Y;
ρYX3 = standardized path coefficient from X3 to Y;
ρYX4 = standardized path coefficient from X4 to Y;
εY = residual error of the dependent variable Y.

4. Results and Discussion

4.1. Results

4.1.1. General Descriptives

Table 2 presents the findings pertaining to the descriptions of the research variables. For X1, over the two-year research period, the average value of climate disclosure was 20%. This outcome indicates that companies must enhance the quality of their climate change policy management. The descriptive statistics further reveal a standard deviation close to the mean, suggesting a wide distribution in the quality of climate change policy management, ranging from companies with no policy to those with robust climate change management policies. The descriptive statistics also demonstrate a broad range in the quality of climate change management policies, with a minimum of 0.00 and a maximum between 0.85 and 0.92, for 2022 and 2023, respectively. A detailed analysis of the results for X1 is presented in the subsequent subsection.
Regarding X2, the average company size increased from 2022 to 2023. The standard deviation remained relatively consistent between these years, whereas the minimum and maximum figures for both years also showed an increase. This indicates that the growth of corporate assets was evenly distributed across countries and industry sectors during 2022 and 2023. For X3, average profitability decreased from 7% to 3%. However, the standard deviation decreased by 2023 compared with 2022, and the minimum and maximum values exhibited high volatility. Specifically, the minimum value in 2023 was higher than that in 2022, whereas the maximum value in 2023 was lower than that in 2022. This volatility is attributed to numerous profit spikes, particularly in 2022, primarily due to a surge in other income sources following the recovery from the COVID-19 pandemic [65]. The variable X4 did not exhibit significant changes, as evidenced by the consistent average value between 2022 and 2023. The standard deviation and maximum and minimum values remained unchanged between the years. This suggests that the company’s condition was generally perceived as favorable by investors in 2022 and 2023, resulting in the company’s cost of debt remaining stable.
Variable Y exhibited a pattern similar to that of X2, where the average value decreased from 2022 to 2023, while the standard deviation increased over the same period, consistently exceeding the average value. The minimum and maximum values also displayed significant volatility in 2022 and 2023. This statistical condition is also attributed to the recovery following the COVID-19 pandemic, during which many companies experienced substantial recovery in 2022 and 2023. However, recovery was not uniform across all industrial sectors. This study encompassed various industrial sectors, which may explain the decline in average company value, as it is influenced by diverse levels of recovery across different sectors [66].
In addition to numerical summaries, this study incorporated boxplot visualizations (see Figure 2) to provide a clearer understanding of the distribution and variation across observations. The boxplots highlight the variability and spread in the data, particularly for climate policy management (X1) and firm value (Y), which show wide distributions with several outliers, indicating uneven performance and disclosure levels among firms. In contrast, company size (X2) and cost of debt (X4) display more stable, symmetric distributions with fewer extreme values. Profitability (X3) reveals moderate dispersion and some year-to-year fluctuation, reflecting post-pandemic financial volatility. These visual patterns complement the descriptive statistics and underscore heterogeneity in corporate responses and outcomes across years.

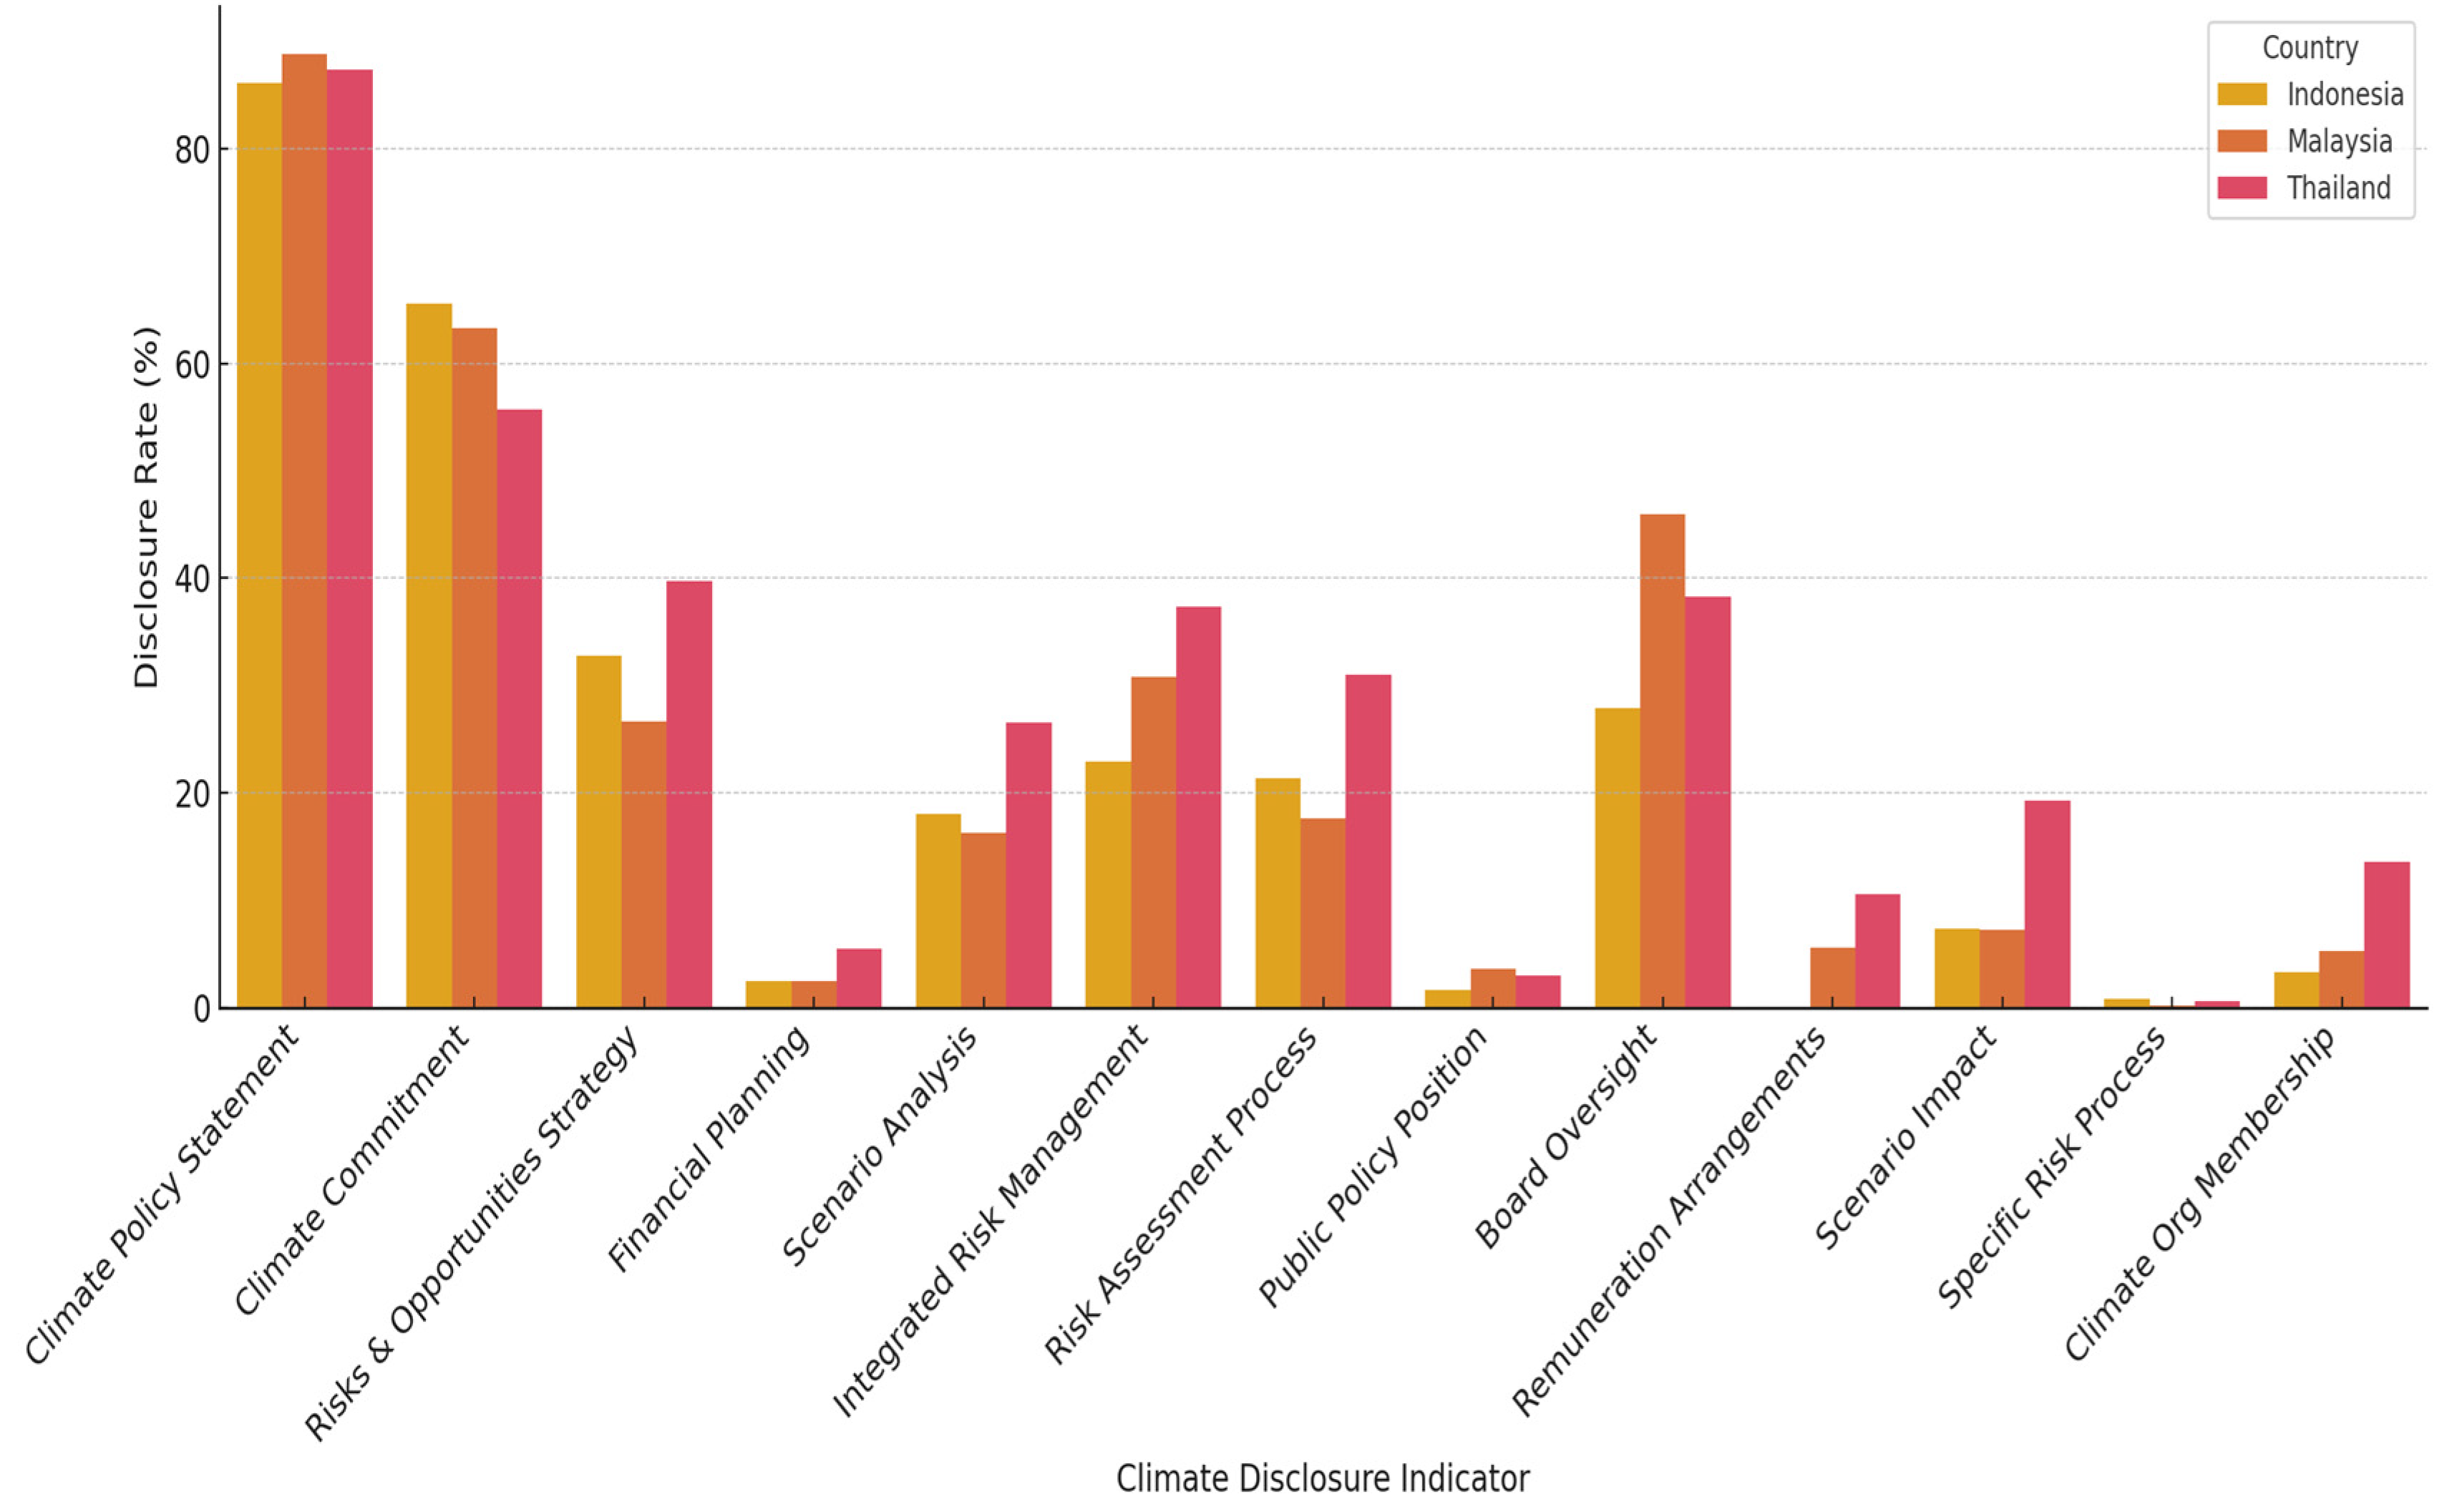
4.1.2. Climate Change Management Policy Descriptives

This section examines companies’ suboptimal performance in managing climate change policies. As illustrated in Table 3, the low scores in climate change policy management were not uniformly distributed across the 13 indicators. Notably, only two of these indicators achieved scores exceeding 50%, while the remaining components exhibited scores ranging from 0.19% to 48.62%. Furthermore, it is evident that all 13 indicators showed improvement in scores from 2022 to 2023.
As illustrated in Table 2, the majority of companies have established both climate policy statements and climate commitments. However, there was a significant disparity, as only approximately 50% of companies with climate policy statements also exhibited climate commitment. The pursuit of climate commitment presents a formidable challenge, given that corporate net-zero targets are frequently political and unrealistic. Previous research has indicated that the attainment of net-zero targets necessitates the support of macro policies that facilitate the transition to a low-carbon economy [67]. This transition was not observed in the three countries under study, which may account for the lower levels of corporate climate commitment compared to climate policy statements.
Governance, strategy, and risk management concerning climate change have been implemented by approximately 20–40% of companies. The descriptive results reveal that some companies have integrated climate risks into their strategy, risk management, and governance, with oversight functions provided by the board of commissioners. Nonetheless, the reduction in the number of companies with governance, strategy, and risk management indicates that many companies merely declare intentions related to climate management without incorporating them into their business processes [68]. This issue warrants attention as it may suggest that companies engage in greenwashing. Greenwashing occurs when companies disclose intentions and visions without adequately implementing them [69].
Scenario analysis was employed by only 22% of the companies, while business impact analysis based on scenario analysis was conducted by only 12%. Scenario analysis serves as a climate resilience strategy that requires various assumptions and integration with business processes [70]. It also necessitates diverse data to develop climate change impact scenarios and analyze the monetary impact on a company’s asset and expense accounts [71].
Several components of climate change management policies remain underutilized, with values below 10%. Climate change risks and opportunities in financial planning were implemented by only 2–4% of the sampled companies. This indicates a lack of substantial effort to evaluate the potential positive and negative impacts of climate change on corporate finances, particularly concerning assets, revenues, and expenses [72]. Furthermore, only 2–4% of the sampled companies established a company position on climate-related public policy. This can be attributed to the uneven distribution of climate-related public policies, many of which lack rigorous legal enforcement and remain largely voluntary [73]. Additionally, less than 1% of the sample companies disclosed a specific climate-related risk management process. Companies predominantly focus on general sustainability-related risk management rather than on developing a targeted risk-management process [74]. Membership in organizations dedicated to climate-related issues was also low, ranging from 5 to 10%. This is partly due to the perceived low benefits of such memberships in enhancing climate change management compared to the costs involved, and the absence of a universally recognized international organization to regulate corporate management policies related to climate change [40].
Figure 3 illustrates the cross-country comparison of climate disclosure indicators for Indonesia, Malaysia, and Thailand in 2022 and 2023. The chart reveals that while basic disclosures such as “climate policy statement” and “climate commitment” have relatively high adoption rates, more advanced aspects like “financial planning”, “remuneration arrangements”, and “specific risk process” remain minimally disclosed across all countries. Thailand generally had higher disclosure rates across multiple indicators in 2023, followed by Malaysia and Indonesia. The overall upward trend from 2022 to 2023 suggests incremental progress in climate policy transparency, although disparities remain both across countries and between different dimensions of climate-related governance.

4.1.3. ANOVA

The results of the ANOVA t-tests are presented in Table 4. ANOVA analysis was conducted on two categories: (1) country and (2) industry sector. In the ANOVA results for the intercountry category, only variables X1, X2, and X4 exhibited significant differences in mean values between countries, whereas variables X3 and Y showed no significant differences. The findings for variables X3 and Y align with the discussion in the preceding section that high earnings volatility leads to financial performance anomalies in each sample country. Regarding the climate change policy management variable, companies in Thailand demonstrated a higher average value compared to other countries, while companies in Indonesia exhibited the lowest average.
The ANOVA test results for industry sector categories reveal significant outcomes for all variables, except X3. For X1, companies in the utilities and energy sectors displayed a higher disclosure of climate change policy management than other sectors. This is plausible given that the utility and energy sectors are closely associated with energy sources, which are sensitive and constitute a significant environmental concern for investors [75]. However, when examining the company value variable, the PBVs of utility and energy companies remained inferior to those in the consumer staples and information technology industries. This may suggest that investors in the three sample countries continue to prioritize investments in sectors aligned with current global trends, such as digitalization (information technology) and consumer goods [65]. As the three sampled countries are developing nations, investors may not be overly concerned with sustainability or climate change, resulting in limited investor reactions to sustainability information, which remains primarily focused on financial information [76,77].
To provide a clearer comparison of climate change management progress, Figure 4 presents the average scores of X1 across countries and industry sectors. The top panel of the figure shows that Thailand leads in climate policy management on average, followed by Malaysia and Indonesia, indicating varying levels of national commitment and regulatory influence. Meanwhile, the bottom panel highlights significant disparity across industry sectors, with utilities and energy showing the highest average scores, suggesting greater pressure or need for climate policy integration in high-impact sectors. Conversely, sectors such as industrials and health care showed relatively lower averages, pointing to potential gaps in climate governance practices. Together, these visualizations reinforce the heterogeneity of climate management performance and underscore the need for both country-level and industry-specific strategies to enhance climate disclosure and accountability.
These results reveal statistically significant differences in climate policy management (X1) across industry sectors. Notably, the utilities and energy sectors recorded the highest average X1 scores, suggesting that firms operating in carbon-intensive or environmentally regulated industries may face greater pressure from regulators, investors, and the public to develop and disclose robust climate strategies [78]. These sectors are typically more exposed to transition risks, such as carbon pricing and stricter environmental standards, which may explain their more proactive climate governance practices [79]. In contrast, sectors such as industrials and real estate reported lower average X1 scores, indicating potential gaps in policy development or disclosure. This may reflect either a lower perceived exposure to climate risks or a lack of institutional incentives to prioritize climate policy integration [80]. Interestingly, consumer-facing sectors such as consumer staples and information technology showed moderate levels of climate management performance, possibly influenced by international supply chain expectations and reputational considerations [81].
The results in Table 4 also highlight significant differences in climate policy management (X1) across countries, with the ANOVA test confirming that these differences were statistically meaningful. Among the three countries studied, Thailand reported the highest average score for X1, followed by Malaysia, with Indonesia trailing behind. This finding suggests that firms in Thailand and Malaysia may be more responsive to evolving climate disclosure norms, regulatory initiatives, or investor pressure, possibly due to more advanced ESG frameworks or stronger institutional mandates [82,83]. In contrast, Indonesia’s lower average X1 score indicates a relative lag in adopting structured climate policy disclosures, which may stem from limited regulatory enforcement, lower ESG awareness, or capacity constraints among firms [84].
Several contextual factors may explain these disparities. Regulatorily, both Malaysia and Thailand have implemented more formal ESG reporting requirements. Bursa Malaysia, for example, mandates sustainability disclosures aligned with GRI and TCFD [85], while Thailand’s SEC integrates ESG reporting into its capital market strategy [62]. Indonesia’s approach, by contrast, remains largely voluntary and fragmented, resulting in uneven disclosure practices [69]. From an economic and market development standpoint, Malaysia and Thailand benefit from more mature capital markets, higher institutional investor participation, and broader access to green finance mechanisms [86]. These conditions create stronger external incentives for firms to adopt robust ESG frameworks. Lastly, corporate governance culture plays a role. In Indonesia, ownership is often concentrated in families or closely held groups, which may deprioritize transparency and long-term sustainability planning [87]. Meanwhile, Malaysia and Thailand have experienced growing institutional investor activism and civil society engagement, reinforcing a cultural shift toward greater ESG accountability [88].

4.1.4. Path Analysis

Prior to conducting the path analysis, classical assumption testing was performed, as the path analysis employed still relied on ordinary least squares (OLS) assumptions. The results of the classical assumption tests are presented in Table 5. All classical assumption tests were satisfied except for the normality test. Nevertheless, the study opted to disregard non-normality in the data, as various references suggest that when observations are conducted on a large sample (exceeding 200), OLS results remain robust despite the presence of non-normality. Consequently, it was determined that the classical assumptions were met, allowing the data analysis to proceed.
The results of the path analysis are presented in Table 6. The probability values for all variables were below the threshold of α = 5%, indicating that all independent variables exerted an influence on the dependent variable. The adjusted R2 value was 3%, and the F-test results also indicated that the model was suitable for further analysis. For the X1 variable, the path coefficient was positive, and the probability value was below 5%, thereby supporting the acceptance of the research hypothesis. This finding is also visually represented in Figure 5, which shows the direction and strength of each path coefficient from X1 to X4 toward Y, further illustrating the relative influence of each independent variable on firm value.
The X2, X3, and X4 variables were also statistically significant. X2 exhibited a negative path coefficient, suggesting that an increase in company size corresponded to a decrease in company value. This phenomenon is attributed to the quality of assets in the sample companies, which predominantly comprise substandard assets. Previous research indicates that numerous companies in Southeast Asia record receivable and contract assets to enhance asset value. However, investors also perceive that large assets entail substantial risk, resulting in a negative correlation [54]. X3 had a positive path coefficient, aligning with the theory that companies with high profitability levels have high company values. Similarly, X4 had a negative path coefficient, consistent with the theory that companies can readily obtain capital from debt if the cost of debt capital is low, thereby improving company performance.

4.1.5. Robustness Test

To examine the robustness of the path analysis results, subsample analyses were conducted based on country and year. The results can be seen in Table 7 below. By isolating the effects within individual countries (Indonesia, Malaysia, and Thailand), the analysis accounted for differences in regulatory environments, institutional maturity, and market dynamics that may influence climate-related disclosure and investor response. Similarly, conducting year-by-year regressions (2022 and 2023) enabled the evaluation of how temporal factors, such as post-pandemic recovery and evolving ESG expectations, affect the observed relationships.
The results show that while the core relationship between X1 and Y remained generally consistent in direction, the magnitude and significance of the effects varied across subsamples. Notably, the effect of X1 was stronger and statistically significant in Malaysia and Thailand but less so in Indonesia. This result is consistent with the descriptive findings presented in Table 3, which show that Indonesia lagged behind the other two countries in terms of the breadth and depth of climate-related disclosures. Several key indicators—such as climate scenario analysis, board oversight, and integration of climate risks into corporate strategy—were disclosed less frequently by Indonesian firms, indicating a lower level of institutionalization of climate policy management. Furthermore, the year-on-year progress in Indonesia appeared limited compared to the significant improvements observed in Malaysia and Thailand between 2022 and 2023. This relatively slow advancement may weaken the visibility and credibility of climate strategies among investors in Indonesia, resulting in a weaker or insignificant association between X1 and firm value. In contrast, stronger disclosure practices and more consistent improvements in Malaysia and Thailand may contribute to a more favorable investor response and thus a more robust relationship between climate policy management and firm performance. In terms of time, the influence of X1 appeared more prominent in 2022, with diminished significance in 2023—potentially reflecting changes in investor priorities or increased variability in climate disclosure practices. This pattern also aligns with the descriptive results in Table 2, which show a decline in the average value of Y (firm value) from 2022 to 2023 across the sample. While 2022 reflected a period of post-pandemic recovery with stronger market optimism and improved performance in many sectors, the drop in firm value in 2023 suggests a potential shift in investor sentiment. This may indicate rising investment risks or growing concerns over macroeconomic uncertainty, which could weaken the responsiveness of firm value to climate-related governance signals. Thus, even though some firms may have maintained or improved their climate disclosure practices in 2023, the diminished effect of X1 on Y likely reflects a broader decline in market valuation sensitivity, influenced by external economic pressures beyond ESG considerations.

4.2. Discussion

This study revealed several noteworthy findings. First, it found that the disclosure of climate change policy management is low in Southeast Asian countries, and where disclosure does exist, it is limited to statements of commitment and the establishment of governance related to climate achievement, rather than action items such as corporate climate change planning, strategy, management, and measurement. Previous research attributes this to a lack of regulation and a culture of low social accountability among companies [89]. Without strong regulatory frameworks, companies may not feel compelled to disclose information, especially in areas where it is most important. The institutional environment significantly impacts corporate social responsibility (CSR) reporting practices, particularly in emerging countries. Corporate governance mechanisms at the institutional, group, and firm levels are determinant factors of CSR reporting practices in BRICS countries [90]. This finding indicates that a lack of robust institutional frameworks can lead to lower levels of disclosure. Effective transparency programs require increasing the benefit-to-cost ratios for both information users and disclosers, and recognizing the importance of third-party intermediaries [91]. Additionally, the involvement of public actors and civil society-led governance can positively influence information disclosure in transnational sustainability governance [92]. Several studies suggest that improvements in corporate governance, regulatory frameworks, and stakeholder engagement could potentially enhance the quality and extent of climate change disclosure in the region [37,93].
Second, this study proved that disclosure of a company’s climate change policy management affects the company’s value. It revealed that investors react to information related to climate change and invest significantly in companies that care about climate change. Institutional investors play a crucial role in encouraging companies to address climate change risks and opportunities through their influence as shareholders and by integrating climate change factors into investment analyses [92]. This integration has become more systematic with the introduction of hard policy measures, suggesting that investors value climate-related information in their decision-making process. Environmental shareholder activism, particularly when initiated by long-term institutional investors, increases the voluntary disclosure of climate change risks. Companies that voluntarily disclose such risks following shareholder activism achieve higher post-disclosure valuations, indicating that investors value transparency regarding firms’ exposure to climate change risks [38]. This is in line with a study of Global 500 companies that reveals economic pressure and social factors significantly influence the decision to disclose carbon-related information. Companies facing direct economic consequences and those in greenhouse-gas-intensive sectors are more likely to disclose this information, suggesting that investors consider this information valuable [94]. Higher environmental performers prefer actual climate change disclosures, providing a plausible signal to investors [36]. A comparative analysis of data from developed countries demonstrates that carbon abatement investment (CAI) enhances firm value in jurisdictions with stringent climate change policies. Investors also consider the characteristics of CAI and the extent of voluntary CAI disclosures when evaluating firm value [95].
Third, ANOVA test results underscore the importance of industry-specific dynamics in shaping corporate climate responses. They also suggest that a “one-size-fits-all” approach to ESG regulation may not be effective and that tailored disclosure frameworks and support mechanisms may be needed to accelerate climate policy development across sectors with weaker performance. This aligns with findings from multiple studies that emphasize the need for tailored ESG strategies and disclosure frameworks across different sectors. Research shows distinct differences in ESG scores among subsectors of the energy industry, with environmental and social practices often reinforcing each other, while governance showed a weaker influence [96]. ESG practices have varying effects on return on assets (ROAs) across resource-intensive, consumer-facing, and service sectors, suggesting that the impact of ESG practices differs across industries [97]. The ANOVA test results also show that cross-country differences underscore the role of national policy environments, market expectations, and institutional readiness in shaping how firms approach climate governance. They also suggest that policy interventions and capacity-building efforts may be especially needed in markets like Indonesia to encourage wider and deeper adoption of climate-related policies and disclosures. Cross-country differences in corporate governance and climate-related policies are indeed significant, as highlighted by several papers in the context. For instance, [98] suggests that country-level corporate governance reforms affect firms’ cross-listing activities, with a stronger effect in countries with weaker investor protection and less developed stock markets. This underscores the importance of national policy environments in shaping corporate behavior. An interesting observation is that firms in the utilities and energy sectors disclosed more comprehensive climate change policy information, yet their average firm values were relatively lower compared to sectors like consumer staples or technology. This can be understood through industry characteristics. These sectors are highly regulated and carbon-intensive, making them subject to stricter reporting requirements and investor scrutiny [99]. While they adopt formal climate disclosure practices, these firms face higher transition and operational risks as they shift toward cleaner energy or sustainable infrastructure [100]. These risks increase costs, reduce short-term profitability, and dampen investor expectations [101]. The capital intensity of utilities and energy companies implies higher compliance costs, often funded through debt or government support [102]. Despite climate governance alignment, these firms may show lower market valuations due to constrained financial flexibility and slower growth prospects [103]. This demonstrates the need to interpret climate disclosure scores within each industry’s context. These insights indicate that industry-specific ESG integration pathways matter and that policymakers should consider sectoral dynamics when evaluating ESG performance.
Fourth, although the control variables in this study had a significant effect on firm value, firm size had a negative effect on firm value, offering a new perspective on how firm size interacts with firm value and climate change policy. The relationship between firm size and value in the context of corporate climate change policy presents an interesting perspective, particularly in Southeast Asia. While traditional views often suggest a positive correlation between firm size and value, recent research indicates a potentially negative effect, especially when considering environmental factors. In Southeast Asia, larger firms may face greater challenges in adapting to climate change policies and implementing green initiatives, which can negatively affect their value. This is supported by the findings of [104], who show that the environmental dimension of corporate social responsibility (CSR) only affects firm value at the later stages of a company’s life cycle. This suggests that larger, more established firms may struggle to effectively integrate environmental concerns into their operations, potentially leading to a decrease in firm value. Interestingly, the authors of [105] provide evidence that green accounting practices, particularly water consumption, have a significant negative effect on economic value added (EVA) for companies in the Asia Sustainability Reporting List Awards. This finding contradicts conventional wisdom that sustainability practices always enhance firm value, especially for larger firms that are more likely to engage in such reporting. The negative relationship between firm size and value in the context of climate change policy can be attributed to several factors specific to Southeast Asia. Southeast Asian countries are among the most heavily affected by climate change, with increasing extreme weather events causing severe social and economic damage [106]. Larger firms may be more exposed to these risks and face higher costs in adapting to their operations, potentially reducing their value. In conclusion, emerging evidence suggests that firm size may have a negative effect on firm value when considering corporate climate change policies, particularly in Southeast Asia. This phenomenon challenges traditional perspectives and underscores the need for companies of all sizes to carefully consider their approaches to environmental issues and climate change adaptation strategies in the region.
Fifth, these findings highlight the urgent need for targeted policy interventions in Southeast Asia. As shown in Table 3, climate-related disclosures remain symbolic, focused on high-level policy commitments rather than operational actions like scenario analysis, climate risk integration into planning, or performance-linked incentives. This signals a regulatory gap that governments should address through mandatory reporting standards aligned with frameworks like TCFD, which provide guidance on integrating climate issues into governance, strategy, risk management, and metrics [13,107]. The cross-country differences in Table 4 demonstrate that regulatory maturity influences corporate climate behavior. Countries like Thailand and Malaysia, where climate policy disclosures are more advanced, can serve as benchmarks for markets like Indonesia. Policymakers may consider strengthening ESG listing rules, developing sector-specific templates, and offering incentives for climate-related investments. Capacity-building programs can help harmonize national ESG policies with international standards [108]. At the industry level, sectoral disparities in the ANOVA results underscore the need for tailored climate disclosure frameworks. Industries like energy and utilities, which involve stronger disclosure practices, face more direct environmental scrutiny. Lagging sectors like industrials and real estate may benefit from industry-specific roadmaps and guidance in translating climate risk into business indicators. Supporting industry associations to develop disclosure guidelines may encourage voluntary compliance [109]. In addition to investor behavior, these findings carry important implications for both policymakers and business leaders.
Based on these findings, we propose a multi-level policy approach: (1) strengthening national climate disclosure mandates, (2) developing sector-specific guidelines, (3) incentivizing firms to move beyond commitment-level reporting to actionable strategies, and (4) encouraging investor engagement through clearer climate-related financial disclosures. These recommendations respond to the structural gaps identified in Southeast Asia, providing a pathway for governments and companies to enhance climate change governance and accountability. Firms are encouraged to view climate disclosure not only as a compliance requirement but as a strategic tool to manage long-term risks, enhance resilience, and create value, particularly when disclosures are aligned with credible implementation

5. Conclusions

This study provides empirical support for the hypothesis that stronger climate policy management is associated with higher firm value among listed firms in Southeast Asia. The results from path analysis show that companies with stronger climate policy disclosures tend to be valued more highly by investors, indicating that climate governance is increasingly viewed as a source of strategic advantage. These findings are consistent with previous studies, which suggest that investors respond positively to climate-related transparency and risk mitigation efforts. Our results also align with research on institutional investor behavior, which indicates growing market pressure for firms to disclose ESG-related information and integrate sustainability into strategic decision-making. This study highlights several key findings on corporate climate change policy management and its impact on firm value in Southeast Asia. First, the disclosure of climate change policy management in the region is generally low and often limited to statements of commitment rather than concrete action plans. This is attributed to the lack of robust regulatory frameworks and a culture of low social accountability. Second, this study demonstrates that the disclosure of a company’s climate change policy management positively affects its firm value, indicating that investors react favorably to climate-related information and are more likely to invest in companies that prioritize climate change issues. Finally, an intriguing finding emerges regarding firm size and value in the context of climate change policies. Contrary to traditional perspectives, larger firms in Southeast Asia may face greater challenges in adapting to climate change policies and implementing green initiatives, potentially negatively impacting their value. This phenomenon underscores the need for companies of all sizes to carefully consider their approaches to environmental issues and climate change adaptation strategies in the region.
This study is subject to several limitations that should be acknowledged. First, the analysis is limited to publicly listed companies in Indonesia, Malaysia, and Thailand due to the availability of reliable and consistent climate-related data in the Refinitiv Eikon Database. Other Southeast Asian countries, such as Vietnam and the Philippines, were excluded because of limited data coverage, while countries like Laos, Cambodia, and Myanmar are not covered by the database at all. Second, Singapore was also not included, as its market is predominantly composed of banking and financial services firms, which differ structurally from the industrial and extractive sectors that dominate the other three countries. Including Singapore would have introduced sectoral bias and compromised comparability. Third, the study focused only on the 2021–2023 period because Refinitiv’s climate disclosure indicators were not sufficiently available in earlier years, and full-year data for 2024 had not yet been released at the time of research. These limitations may affect the generalizability of the findings to the broader Southeast Asian context. Future research may expand the country coverage and time horizon as ESG reporting practices and data availability improve across the region. Fourth, this study is positioned as a preliminary investigation that seeks to establish a foundational empirical association between climate change policy management and firm value. By focusing on direct effects using well-defined disclosure indicators, the study provides a clear and methodologically sound baseline. We suggest that future research, once more mature and stable metrics for mediating constructs are available, can replicate and expand this framework using multi-layered models, such as structural equation modeling (SEM) or moderated mediation analysis, to uncover the underlying mechanisms more comprehensively.
While this study adopts a quantitative approach to examine the relationship between climate change management and firm value across multiple Southeast Asian countries, future research could benefit from incorporating qualitative methods to deepen contextual understanding. In particular, case studies and semi-structured interviews with corporate decision-makers, sustainability officers, or policy advisors could provide valuable insights into how climate change strategies are developed, the barriers firms encounter, and the internal processes that influence disclosure decisions. Such qualitative inquiry would complement the present study by offering a more nuanced, multidimensional view of climate governance at the firm level. Given the complexity and resource intensity of conducting in-depth qualitative research across multiple countries, we suggest that future studies focus on a single country or industry sector, allowing for a more detailed exploration of institutional dynamics, regulatory pressures, and stakeholder expectations. This would not only enrich the interpretation of firm behavior but also strengthen the practical relevance of research findings for local policymakers and industry leaders. These limitations do not diminish the significance of the findings but rather highlight the need for continued research as data availability and methodological approaches evolve.
Future research could investigate the specific barriers that larger firms face in implementing climate change policies in Southeast Asia, explore solutions to overcome challenges in corporate sustainability practices, conduct comparative analyses of climate change management approaches across different Southeast Asian countries, examine industry-specific factors shaping sustainability strategies, assess the impact of international climate agreements on business practices, analyze the effectiveness of incentive structures in promoting environmental responsibility, investigate the relationship between sustainability practices and financial performance in emerging markets, explore stakeholder engagement’s role in driving climate initiatives, evaluate the long-term effects of current regulatory frameworks on sustainability outcomes, and examine the potential for innovative approaches to corporate environmental management in the region.

Author Contributions

Conceptualization, A.P. and N.N.A.; methodology, A.P.; software, A.P.; validation, A.P. and R.F.I.; formal analysis, A.P.; investigation, A.P.; resources, A.P. and N.N.A.; data curation, A.P. and R.F.I.; writing—original draft preparation, A.P.; writing—review and editing, A.P. and R.F.I.; visualization, A.P.; supervision, N.N.A.; project administration, A.P., N.N.A., and R.F.I.; funding acquisition, N.N.A. All authors have read and agreed to the published version of the manuscript.

Funding

This research was funded by Universitas Padjadjaran, Academic Leadership Grant 2025, grant number 7895/UN6.B/HK.07.00/2025.

Institutional Review Board Statement

Not applicable.

Informed Consent Statement

Not applicable.

Data Availability Statement

Data can be obtained by request from the corresponding author.

Conflicts of Interest

The authors declare no conflicts of interest.

Abbreviations

AbbreviationFull Term
CSRCorporate social responsibility
GSCMGreen supply chain management
OLSOrdinary least squares
PBVPrice-to-book value

Appendix A. Country and Industry Distribution of Sample Companies

Table A1. Company distribution.
Country/SectorNumber of CompaniesPercentage
Per Country
Indonesia6111.5%
Malaysia30457.3%
Thailand16631.3%
Per Industry Sector
Financials5911.1%
Industrials10018.8%
Real Estate509.4%
Communication Services326.0%
Consumer Staples6913.0%
Information Technology397.3%
Consumer Discretionary5510.4%
Utilities285.3%
Materials519.6%
Energy295.5%
Health Care193.6%

References

  1. Hsueh, L. Opening up the firm: What explains participation and effort in voluntary carbon disclosure by global businesses? An analysis of internal firm factors and dynamics. Bus. Strategy Environ. 2019, 28, 1302–1322. [Google Scholar] [CrossRef]
  2. Akpuokwe, C.; Eneh, N.; Bakare, S.; Adeniyi, A. Legislative Responses to Climate Change: A Global Review of Policies and Their Effectiveness. Int. J. Appl. Res. Soc. Sci. 2024, 6, 225–239. [Google Scholar] [CrossRef]
  3. Digitemie, W.; Ekemezie, I. Assessing the role of carbon pricing in global climate change mitigation strategies. Magna Sci. Adv. Res. Rev. 2024, 10, 22–31. [Google Scholar] [CrossRef]
  4. Amran, A.; Wong, C.Y.; Hashim, F.; Ooi, S.K. Business Strategy for Climate Change: An ASEAN Perspective. Corp. Soc. Responsib. Environ. Manag. 2015, 23, 213–227. [Google Scholar] [CrossRef]
  5. Todaro, N.M.; Testa, F.; Daddi, T.; Iraldo, F. The influence of managers’ awareness of climate change, perceived climate risk exposure and risk tolerance on the adoption of corporate responses to climate change. Bus. Strategy Environ. 2020, 30, 1232–1248. [Google Scholar] [CrossRef]
  6. Damert, M.; Feng, Y.; Zhu, Q.; Baumgartner, R.J. Motivating low-carbon initiatives among suppliers: The role of risk and opportunity perception. Resour. Conserv. Recycl. 2018, 136, 276–286. [Google Scholar] [CrossRef]
  7. Cosma, S.; Principale, S.; Venturelli, A. Sustainable governance and climate-change disclosure in European banking: The role of the corporate social responsibility committee. Corp. Gov. Int. J. Bus. Soc. 2022, 22, 1345–1369. [Google Scholar] [CrossRef]
  8. Goldstein, A.; Gladstone, J.; Turner, W.R.; Hole, D.G. The private sector’s climate change risk and adaptation blind spots. Nat. Clim. Change 2018, 9, 18–25. [Google Scholar] [CrossRef]
  9. Dietz, S.; Fruitiere, C.; Irwin, W.; Rauis, B.; Sullivan, R.; Garcia-Manas, C. An assessment of climate action by high-carbon global corporations. Nat. Clim. Change 2018, 8, 1072–1075. [Google Scholar] [CrossRef]
  10. Olekanma, O.; Rodrigo, L.S.; Gahir, B.; Adu, D.A. Small- and medium-sized enterprises’ carbon footprint reduction initiatives as a catalyst for green jobs: A systematic review and comprehensive business strategy agenda. Bus. Strategy Environ. 2024, 33, 6911–6939. [Google Scholar] [CrossRef]
  11. Ben-Amar, W.; Mcilkenny, P.; Chang, M. Board Gender Diversity and Corporate Response to Sustainability Initiatives: Evidence from the Carbon Disclosure Project. J. Bus. Ethics 2015, 142, 369–383. [Google Scholar] [CrossRef]
  12. Pricopoaia, O.; Mihai, I.O.; Lupașc, A. Implications of Innovative Strategies for Sustainable Entrepreneurship—Solutions to Combat Climate Change. Sustainability 2024, 16, 9742. [Google Scholar] [CrossRef]
  13. Abhayawansa, S.; Adams, C. Towards a conceptual framework for non-financial reporting inclusive of pandemic and climate risk reporting. Meditari Account. Res. 2021, 30, 710–738. [Google Scholar] [CrossRef]
  14. Abubaker, N. The Role of Environmental Accounting in Mitigating Environmental Pollution Risk and its Disclosure. Int. J. Innov. Sci. Res. Technol. IJISRT 2024, 9, 96–102. [Google Scholar] [CrossRef]
  15. O’Dwyer, B.; Unerman, J. Shifting the focus of sustainability accounting from impacts to risks and dependencies: Researching the transformative potential of TCFD reporting. Account. Audit. Account. J. 2020, 33, 1113–1141. [Google Scholar] [CrossRef]
  16. Bhattacharjee, A.; Jahanshahi, A.A.; Chakraborty, S. Unlocking the link between low emission supply chains, blockchain adoption, and financial success: The payoff of socially responsible practices in supply chains. Bus. Strategy Dev. 2024, 7, e341. [Google Scholar] [CrossRef]
  17. Albitar, K.; Al-Shaer, H.; Liu, Y.S. Corporate commitment to climate change: The effect of eco-innovation and climate governance. Res. Policy 2022, 52, 104697. [Google Scholar] [CrossRef]
  18. Huang, H.H.; Wang, C.; Kerstein, J.; Wu, F. Firm climate risk, risk management, and bank loan financing. Strateg. Manag. J. 2022, 43, 2849–2880. [Google Scholar] [CrossRef]
  19. Liu, Z.; Perera, L.; Abhayawansa, S.; Jubb, C. Regulatory impact on voluntary climate change–related reporting by Australian government-owned corporations. Financ. Account. Manag. 2017, 33, 264–283. [Google Scholar] [CrossRef]
  20. Gahramanova, G.; Kutlu Furtuna, Ö. Corporate climate change disclosures and capital structure strategies: Evidence from Türkiye. J. Cap. Mark. Stud. 2023, 7, 140–155. [Google Scholar] [CrossRef]
  21. Rao, P.; Holt, D. Do green supply chains lead to competitiveness and economic performance? Int. J. Oper. Prod. Manag. 2005, 25, 898–916. [Google Scholar] [CrossRef]
  22. Rao, P. Greening the supply chain: A new initiative in South East Asia. Int. J. Oper. Prod. Manag. 2002, 22, 632–655. [Google Scholar] [CrossRef]
  23. Cotter, J.; Najah, M.M. Institutional investor influence on global climate change disclosure practices. Aust. J. Manag. 2012, 37, 169–187. [Google Scholar] [CrossRef]
  24. Herold, D.M. Demystifying the link between institutional theory and stakeholder theory in sustainability reporting. Econ. Manag. Sustain. 2018, 3, 6–19. [Google Scholar] [CrossRef]
  25. Brulhart, F.; Gherra, S.; Quelin, B.V. Do Stakeholder Orientation and Environmental Proactivity Impact Firm Profitability? J. Bus. Ethics 2017, 158, 25–46. [Google Scholar] [CrossRef]
  26. Sprengel, D.C.; Busch, T. Stakeholder engagement and environmental strategy—The case of climate change. Bus. Strategy Environ. 2011, 20, 351–364. [Google Scholar] [CrossRef]
  27. Kolk, A.; Pinkse, J. Towards strategic stakeholder management? Integrating perspectives on sustainability challenges such as corporate responses to climate change. Corp. Gov. Int. J. Bus. Soc. 2007, 7, 370–378. [Google Scholar] [CrossRef]
  28. Aggarwal, R.; Dow, S. Corporate governance and business strategies for climate change and environmental mitigation. Eur. J. Financ. 2012, 18, 311–331. [Google Scholar] [CrossRef]
  29. Amran, A.; Zulkafli, A.H.; Periasamy, V. Determinants of Climate Change Disclosure by Developed and Emerging Countries in Asia Pacific. Sustain. Dev. 2011, 22, 188–204. [Google Scholar] [CrossRef]
  30. Khalid, F.; Guo, J.; Srivastava, M.; Sun, J. Green corporate image: Assessing the effects of climate change management practices on corporate reputation. Corp. Soc. Responsib. Environ. Manag. 2023, 31, 1786–1801. [Google Scholar] [CrossRef]
  31. Zyglidopoulos, S.C. The Issue Life-Cycle: Implications for Reputation for Social Performance and Organizational Legitimacy. Corp. Reput. Rev. 2003, 6, 70–81. [Google Scholar] [CrossRef]
  32. Quintana-García, C.; Benavides-Chicón, C.G.; Marchante-Lara, M. Towards sustainable development: Environmental innovation, cleaner production performance, and reputation. Corp. Soc. Responsib. Environ. Manag. 2022, 29, 1330–1340. [Google Scholar] [CrossRef]
  33. Yadav, S.; Srivastava, J. CSR, monitoring cost and firm performance during COVID-19: Balancing organizational legitimacy and agency cost. Account. Res. J. 2023, 36, 183–200. [Google Scholar] [CrossRef]
  34. Bagh, T.; Khan, M.A.; Bouri, E. Climate change sentiment, ESG practices and firm value: International insights. China Financ. Rev. Int. 2024. ahead-of-print. [Google Scholar] [CrossRef]
  35. Rendtorff, J.D. The Concept of Business Legitimacy: Corporate Social Responsibility. In Corporate Citizenship, Corporate Governance as Essential Elements of Ethical Business Legitimacy; Springer: Singapore, 2018; pp. 45–60. [Google Scholar] [CrossRef]
  36. Giannarakis, G.; Zafeiriou, E.; Sariannidis, N. The Impact of Carbon Performance on Climate Change Disclosure. Bus. Strategy Environ. 2017, 26, 1078–1094. [Google Scholar] [CrossRef]
  37. Daradkeh, H.; Bose, S.; Shams, S.; Gunasekarage, A. Does managerial ability matter for corporate climate change disclosures? Corp. Gov. Int. Rev. 2022, 31, 83–104. [Google Scholar] [CrossRef]
  38. Flammer, C.; Toffel, M.W.; Viswanathan, K. Shareholder activism and firms’ voluntary disclosure of climate change risks. Strateg. Manag. J. 2021, 42, 1850–1879. [Google Scholar] [CrossRef]
  39. Rizzato, F.; Fiandrino, S.; Devalle, A.; Tonelli, A. Analysing SDG disclosure and its impact on integrated thinking and reporting. Meditari Account. Res. 2023, 32, 803–831. [Google Scholar] [CrossRef]
  40. Principale, S.; Pizzi, S. The Determinants of TCFD Reporting: A Focus on the Italian Context. Adm. Sci. 2023, 13, 61. [Google Scholar] [CrossRef]
  41. Yang, Y.; Yan, F.; Yang, Y.; Chen, Y. Evaluating provincial carbon emission characteristics under China’s carbon peaking and carbon neutrality goals. Ecol. Indic. 2023, 156, 111146. [Google Scholar] [CrossRef]
  42. Abdul Majid, J.; Che Adam, N.; Ab Rahim, N.; Razak, R. CEO power, regulatory pressures, and carbon emissions: An emerging market perspective. Cogent Bus. Manag. 2023, 10, 2276555. [Google Scholar] [CrossRef]
  43. Yuliana, Y.; Wedari, L.K. Carbon Performance, Green Strategy, Financial Performance Effect on Carbon Emissions Disclosure: Evidence from High Polluting Industry in Indonesia. Int. J. Sustain. Dev. Plan. 2023, 18, 1581–1588. [Google Scholar] [CrossRef]
  44. Gohar, R.; Uche, E.; Kalra, A.; Chang, B.H.; Uddin, M.A. Nexus between energy consumption, climate risk development finance and GHG emissions. Int. J. Financ. Eng. 2023, 10, 2350025. [Google Scholar] [CrossRef]
  45. González-Sánchez, M.; Martín-Ortega, J.L. Greenhouse Gas Emissions Growth in Europe: A Comparative Analysis of Determinants. Sustainability 2020, 12, 1012. [Google Scholar] [CrossRef]
  46. Minhas, A.S.; Maqsood, N.; Rehman, A.U.; Shahid, T.A. Investment Performance in Green Finance: Assessing the Impact of Environmental Social and Governance Integration. IRASD J. Econ. 2024, 6, 27–44. [Google Scholar] [CrossRef]
  47. Burbano, V.C.; Delmas, M.A.; Cobo, M.J. The Past and Future of Corporate Sustainability Research. Organ. Environ. 2023, 37, 133–158. [Google Scholar] [CrossRef]
  48. Putri, N.A.; Pratama, A. Quality of financial disclosures related to environmental, social, and governance matters, and firm characteristics and firm value: A comparative study across four ASEAN countries. Int. J. Manag. Sustain. 2023, 12, 404–418. [Google Scholar] [CrossRef]
  49. Mohy-Ud-Din, K.; Du, A.M.; Shahbaz, M. Corporate social responsibility and climate change mitigation: Discovering the interaction role of green audit and sustainability committee. Corp. Soc. Responsib. Environ. Manag. 2024, 32, 1198–1212. [Google Scholar] [CrossRef]
  50. de Almeida Barbosa Franco, J.; Bezerra, B.S.; Franco, A., Jr.; Battistelle, R.A.G. Dynamic Capabilities: Unveiling Key Resources for Environmental Sustainability and Economic Sustainability, and Corporate Social Responsibility towards Sustainable Development Goals. Resources 2024, 13, 22. [Google Scholar] [CrossRef]
  51. Elbannan, M.A. Accounting and stock market effects of international accounting standards adoption in an emerging economy. Rev. Quant. Financ. Account. 2010, 36, 207–245. [Google Scholar] [CrossRef]
  52. Lang, M.; Maffett, M.; Lins, K.V. Transparency, Liquidity, and Valuation: International Evidence on When Transparency Matters Most. J. Account. Res. 2012, 50, 729–774. [Google Scholar] [CrossRef]
  53. Vestrelli, R.; Fronzetti Colladon, A.; Pisello, A.L. When attention to climate change matters: The impact of climate risk disclosure on firm market value. Energy Policy 2023, 185, 113938. [Google Scholar] [CrossRef]
  54. Ali, K.; Nadeem, M.; Bhabra, G.S.; Pandey, R. Do capital markets reward corporate climate change actions? Evidence from the cost of debt. Bus. Strategy Environ. 2022, 32, 3417–3431. [Google Scholar] [CrossRef]
  55. Dawkins, C.; Fraas, J.W. Coming Clean: The Impact of Environmental Performance and Visibility on Corporate Climate Change Disclosure. J. Bus. Ethics 2010, 100, 303–322. [Google Scholar] [CrossRef]
  56. Tian, H.; Tian, J. The Mediating Role of Responsible Innovation in the Relationship between Stakeholder Pressure and Corporate Sustainability Performance in Times of Crisis: Evidence from Selected Regions in China. Int. J. Environ. Res. Public Health 2021, 18, 7277. [Google Scholar] [CrossRef]
  57. Ullah, F.; Jiang, P.; Elamer, A.A.; Owusu, A. Environmental performance and corporate innovation in China: The moderating impact of firm ownership. Technol. Forecast. Soc. Change 2022, 184, 121990. [Google Scholar] [CrossRef]
  58. García-Zamora, E.; González-Benito, Ó.; Muñoz-Gallego, P.A. Organizational and environmental factors as moderators of the relationship between multidimensional innovation and performance. Innovation 2013, 15, 224–244. [Google Scholar] [CrossRef]
  59. Asni, N.; Agustia, D. The mediating role of financial performance in the relationship between green innovation and firm value: Evidence from ASEAN countries. Eur. J. Innov. Manag. 2021, 25, 1328–1347. [Google Scholar] [CrossRef]
  60. Al-Hiyari, A.; Ismail, A.I.; Kolsi, M.C.; Kehinde, O.H. Environmental, social and governance performance (ESG) and firm investment efficiency in emerging markets: The interaction effect of board cultural diversity. Corp. Gov. Int. J. Bus. Soc. 2022, 23, 650–673. [Google Scholar] [CrossRef]
  61. Bahadori, N.; Kaymak, T.; Seraj, M. Environmental, social, and governance factors in emerging markets: The impact on firm performance. Bus. Strategy Dev. 2021, 4, 411–422. [Google Scholar] [CrossRef]
  62. Treepongkaruna, S.; Suttipun, M. The impact of environmental, social and governance (ESG) reporting on corporate profitability: Evidence from Thailand. J. Financ. Report. Account. 2024. ahead-of-print. [Google Scholar] [CrossRef]
  63. Moussa, A.S.; Elmarzouky, M. Beyond Compliance: How ESG Reporting Influences the Cost of Capital in UK Firms. J. Risk Financ. Manag. 2024, 17, 326. [Google Scholar] [CrossRef]
  64. Zhao, Y.; Gao, Y.; Hong, D. Sustainable Innovation and Economic Resilience: Deciphering ESG Ratings’ Role in Lowering Debt Financing Costs. J. Knowl. Econ. 2024, 16, 4309–4343. [Google Scholar] [CrossRef]
  65. Ghosh, I.; Chaudhuri, T.D. FEB-Stacking and FEB-DNN Models for Stock Trend Prediction: A Performance Analysis for Pre and Post COVID-19 Periods. Decis. Mak. Appl. Manag. Eng. 2021, 4, 51–86. [Google Scholar] [CrossRef]
  66. Defung, F.; Yudaruddin, R.; Hadjaat, M. COVID-19 pandemic and firm performance in leisure, arts, and hospitality industries: International evidence. Invest. Manag. Financ. Innov. 2023, 20, 112–126. [Google Scholar] [CrossRef]
  67. Ren, Q.; Pei, J. Do green financial and non-financial policies achieve the carbon neutrality target? Environ. Sci. Pollut. Res. Int. 2023, 30, 97965–97976. [Google Scholar] [CrossRef]
  68. Singh, S.; Manoharan, S. Effects of Corporate Greenwashing on Society; Corporate Greenwashing and Sustainability. Shanlax Int. J. Arts Sci. Humanit. 2024, 11, 63–69. [Google Scholar] [CrossRef]
  69. Pratama, A.; Yusoff, H.; Yadiati, W.; Jaenudin, E. Sustainability-related corporate governance and greenwashing practices: Preliminary evidence from southeast Asian companies. Meditari Account. Res. 2025. ahead-of-print. [Google Scholar] [CrossRef]
  70. Huiskamp, U.; Ten Brinke, B.; Kramer, G.J. The climate resilience cycle: Using scenario analysis to inform climate-resilient business strategies. Bus. Strategy Environ. 2022, 31, 1763–1775. [Google Scholar] [CrossRef]
  71. Sarker, N.I.; Yang, B.; Lv, Y.; Enamul, M.M.; Huq, E.; Kamruzzaman, M.M. Climate Change Adaptation and Resilience through Big Data. Int. J. Adv. Comput. Sci. Appl. 2020, 11, 533–539. [Google Scholar] [CrossRef]
  72. Dietz, S.; Gradwell, P.; Bowen, A.; Dixon, C. ‘Climate value at risk’ of global financial assets. Nat. Clim. Change 2016, 6, 676–679. [Google Scholar] [CrossRef]
  73. Zhu, N.; Wang, L.; Zhang, X.; Ren, X. The Response of Corporate Innovation to Climate Policy Uncertainty: Evidence from China. J. Environ. Assess. Policy Manag. 2023, 25, 2350008. [Google Scholar] [CrossRef]
  74. Bingler, J.A.; Kraus, M.; Leippold, M.; Webersinke, N. Cheap talk and cherry-picking: What ClimateBert has to say on corporate climate risk disclosures. Financ. Res. Lett. 2022, 47, 102776. [Google Scholar] [CrossRef]
  75. Kumar, K.; Kumar, R.; Kumari, R. The state of corporate sustainability reporting in India: Evidence from environmentally sensitive industries. Bus. Soc. Rev. 2021, 126, 513–538. [Google Scholar] [CrossRef]
  76. Tripathi, V.; Kaur, A. Does Socially Responsible Investing Pay in Developing Countries? A Comparative Study Across Select Developed and Developing Markets. FIIB Bus. Rev. 2021, 11, 189–205. [Google Scholar] [CrossRef]
  77. Bodhanwala, S.; Bodhanwala, R. Relationship between sustainable and responsible investing and returns: A global evidence. Soc. Responsib. J. 2019, 16, 579–594. [Google Scholar] [CrossRef]
  78. Renukappa, S.; Akintoye, A.; Goulding, J.; Egbu, C. Carbon emission reduction strategies in the UK industrial sectors: An empirical study. Int. J. Clim. Change Strateg. Manag. 2013, 5, 304–323. [Google Scholar] [CrossRef]
  79. Cenci, S.; Tang, S. Addressing companies’ low-carbon transition challenges requires diversified investments in environmental initiatives. Clim. Change 2024, 177, 161. [Google Scholar] [CrossRef]
  80. Nyoni, V.; Broberg Piller, W.; Vigren, O. Sustainability action in the real estate sector—An organizational and institutional perspective. Clean. Prod. Lett. 2023, 5, 100049. [Google Scholar] [CrossRef]
  81. Nweje, U.; Taiwo, M. Supply chain management: Balancing efficiency and environmental responsibility. World J. Adv. Res. Rev. 2025, 25, 1547–1564. [Google Scholar] [CrossRef]
  82. Singhania, M.; Saini, N. Institutional framework of ESG disclosures: Comparative analysis of developed and developing countries. J. Sustain. Financ. Invest. 2021, 13, 516–559. [Google Scholar] [CrossRef]
  83. Ab Aziz, N.H.; Osman, M.N.H.; Azmi, N.A.; Alshdaifat, S.M.; Abdul Latiff, A.R. ESG Disclosure and Firm Performance: Evidence after the Revision of Malaysian Code of Corporate Governance. Int. J. Acad. Res. Bus. Soc. Sci. 2023, 13, 2919–2938. [Google Scholar] [CrossRef] [PubMed]
  84. Shaikh, I. Environmental, Social, and Governance (ESG) Practice and Firm Performance: An International Evidence. J. Bus. Econ. Manag. 2022, 23, 218–237. [Google Scholar] [CrossRef]
  85. Kamaludin, K.; Ibrahim, I.; Faizal, O.; Sundarasen, S. ESG in the boardroom: Evidence from the Malaysian market. Int. J. Corp. Soc. Responsib. 2022, 7, 4. [Google Scholar] [CrossRef]
  86. Phan, T.C. Impact of green investments, green economic growth and renewable energy consumption on environmental, social, and governance practices to achieve the sustainable development goals: A sectoral analysis in the ASEAN economies. Int. J. Eng. Bus. Manag. 2024, 16, 18479790241231725. [Google Scholar] [CrossRef]
  87. Fuadah, L.L.; Arisman, A.; Andriana, I.; Mukhtaruddin, M. The Ownership Structure, and the Environmental, Social, and Governance (ESG) Disclosure, Firm Value and Firm Performance: The Audit Committee as Moderating Variable. Economies 2022, 10, 314. [Google Scholar] [CrossRef]
  88. Raja Ahmad, R.A.; Azmi, N.A.; Samsuddin, M.E.; Abdullah, N. Is Environmental, Social and Governance (ESG) Disclosure Value Enhancing? Evidence from Top 100 Companies. Asia-Pac. Manag. Account. J. 2023, 18, 143–164. [Google Scholar] [CrossRef]
  89. Nurunnabi, M. Who cares about climate change reporting in developing countries? The market response to, and corporate accountability for, climate change in Bangladesh. Environ. Dev. Sustain. 2015, 18, 157–186. [Google Scholar] [CrossRef]
  90. Miras-Rodríguez, M.D.M.; Martínez-Martínez, D.; Escobar-Pérez, B. Which Corporate Governance Mechanisms Drive CSR Disclosure Practices in Emerging Countries? Sustainability 2018, 11, 61. [Google Scholar] [CrossRef]
  91. Hess, D. Social Reporting and New Governance Regulation: The Prospects of Achieving Corporate Accountability Through Transparency. Bus. Ethics Q. 2007, 17, 453–476. [Google Scholar] [CrossRef]
  92. Pfeifer, S.; Sullivan, R. Public policy, institutional investors and climate change: A UK case-study. Clim. Change 2008, 89, 245–262. [Google Scholar] [CrossRef]
  93. Adu, D.A.; Roni, N.N. Bank climate change initiatives, ownership structures, and corporate governance mechanisms: Evidence from emerging economies. Bus. Strategy Environ. 2023, 33, 3039–3077. [Google Scholar] [CrossRef]
  94. Luo, L.; Tang, Q.; Lan, Y. Corporate Incentives to Disclose Carbon Information: Evidence from the CDP Global 500 Report. J. Int. Financ. Manag. Account. 2012, 23, 93–120. [Google Scholar] [CrossRef]
  95. He, R.; Luo, L.; Shamsuddin, A.; Tang, Q. The Value Relevance of Corporate Investment in Carbon Abatement: The Influence of National Climate Policy. Eur. Account. Rev. 2021, 31, 1233–1261. [Google Scholar] [CrossRef]
  96. Yucel, M.; Yucel, S. Environmental, Social, and Governance (ESG) Dynamics in the Energy Sector: Strategic Approaches for Sustainable Development. Energies 2024, 17, 6291. [Google Scholar] [CrossRef]
  97. Paridhi, P.; Ritika, R. Impact of ESG Disclosures on Corporate Financial Performance: An Industry-Specific Analysis of Indian Firms. Bus. Strategy Dev. 2025, 8, e70055. [Google Scholar] [CrossRef]
  98. Liao, C.; Tsang, A.; Zhu, N.Z.; Wang, K.T. Corporate Governance Reforms and Cross-Listings: International Evidence. Contemp. Account. Res. 2021, 39, 537–576. [Google Scholar] [CrossRef]
  99. Bose, S.; Shams, S.; Lim, E.K.; Minnick, K. Do foreign institutional investors influence corporate climate change disclosure quality? International evidence. Corp. Gov. Int. Rev. 2023, 32, 322–347. [Google Scholar] [CrossRef]
  100. Tyagi, S. What comes next: Responding to recommendations from the task force on climate-related financial disclosures (TCFD). APPEA J. 2018, 58, 633. [Google Scholar] [CrossRef]
  101. Saha, A.K.; Khan, I. Regulatory influence, board characteristics and climate change disclosures: Evidence from environmentally sensitive firms in developing economy context. Corp. Gov. Int. J. Bus. Soc. 2024, 24, 1442–1471. [Google Scholar] [CrossRef]
  102. Duparc-Portier, G.; Figus, G. How should governments respond to energy price crises? A horse-race between fiscal policies. Energy Econ. 2024, 130, 107284. [Google Scholar] [CrossRef]
  103. Kempa, K.; Schenker, O.; Moslener, U. The cost of debt of renewable and non-renewable energy firms. Nat. Energy 2021, 6, 135–142. [Google Scholar] [CrossRef]
  104. Hendratama, T.D.; Huang, Y.-C. Corporate social responsibility, firm value and life cycle: Evidence from Southeast Asian countries. J. Appl. Account. Res. 2021, 22, 577–597. [Google Scholar] [CrossRef]
  105. Sukmadilaga, C.; Lestari, T.U.; Yudianto, I.; Winarningsih, S.; Ghani, E.K. Does Green Accounting Affect Firm Value? Evidence from ASEAN Countries. Int. J. Energy Econ. Policy 2023, 13, 509–515. [Google Scholar] [CrossRef]
  106. Beirne, J.; Renzhi, N.; Volz, U. Bracing for the Typhoon: Climate change and sovereign risk in Southeast Asia. Sustain. Dev. 2021, 29, 537–551. [Google Scholar] [CrossRef]
  107. David, B.; Giordano-Spring, S. Climate Reporting Related to the TCFD Framework: An Exploration of the Air Transport Sector. Soc. Environ. Account. J. 2021, 42, 18–37. [Google Scholar] [CrossRef]
  108. Adewumi, A.S.; Dangana, Z.; Opoku, A. Sustainability assessment frameworks for delivering Environmental, Social, and Governance (ESG) targets: A case of Building Research Establishment Environmental Assessment Method (BREEAM) UK New Construction. Corp. Soc. Responsib. Environ. Manag. 2024, 31, 3779–3791. [Google Scholar] [CrossRef]
  109. Zaid, M.A.A.; Issa, A. A roadmap for triggering the convergence of global ESG disclosure standards: Lessons from the IFRS foundation and stakeholder engagement. Corp. Gov. Int. J. Bus. Soc. 2023, 23, 1648–1669. [Google Scholar] [CrossRef]
Figure 1. Path diagram—conceptual model.
Sustainability 17 04767 g001
Figure 2. Variables’ boxplot.
Sustainability 17 04767 g002
Figure 3. Climate change management policy bar chart.
Sustainability 17 04767 g003
Figure 4. Climate change management policy comparisons.
Sustainability 17 04767 g004
Figure 5. Path diagram—result.
Sustainability 17 04767 g005
Table 1. Variable operationalization.
VariableExplanation
Climate Change Policy Management (X1)Calculated based on the presence of 13 elements presented according to the Refinitiv Eikon Database as follows:
  • Climate Policy Statement
  • Climate Commitment
  • Climate Change Risks and Opportunities Strategy
  • Climate Change Risks and Opportunities in Financial Planning
  • Climate-Related Scenario Analysis
  • Climate-Related Risks Integrated into Risk Management
  • Climate-Related Risks Assessment Process
  • Company Position Climate-Related Public Policy
  • Board Oversight of Climate Change Risks
  • Remuneration Arrangements Incorporate Climate Change
  • Business Impact of Climate Scenario Analysis
  • Specific Climate-Related Risk Management Process
  • Membership in any Organizations Dedicated to Climate-Related Issues.
The 13 items were counted individually, with 0 (if not disclosed) and 1 (if disclosed). The 13 items were then summed and divided by 13. The result was the climate change policy management variable score.
Company Size (X2)Company size was calculated based on the natural logarithm (Ln) of the total asset value. The company size value was taken from the Total Asset—Reported from the Refinitiv Eikon Database.
Profitability (X3)Profitability was calculated from the return-on-asset (ROA) value which is the division between the value of net income divided by the value of total assets. The net income value was taken from Refinitiv Eikon, in the Net Income After Taxes—Reported classification, and the asset value was taken from the Total Asset—Reported classification.
Cost of Debt (X4)The cost of debt was calculated from the weighted average cost of capital (WACC) debt taken from Refinitiv Eikon.
Refinitiv determines the cost of debt using the following:
Interest expense/average total debt → effective interest rate approach;
Yield-to-maturity (YTM) of corporate bonds (if available);
Credit spreads and risk-free rate adjustments (based on a company’s credit rating);
Industry benchmarks for companies with similar debt structures.
The WACC Debt equation used by Refinitiv Eikon is as follows:
W A C C = E V × R e + D V × R d × 1 T c
WACC = weighted average cost of capital;
E = market value of equity;
D = market value of debt;
V = total capital = E + D;
Re = cost of equity;
Rd = cost of debt;
Tc = corporate tax rate.
Price-to-Book Value (Y)The PBV equation used by Refinitiv Eikon is as follows:
PBV = P BVPS
PBV = price-to-book value ratio;
P = market price per share;
BVPS = book value per share =
total shareholders’ equity/total outstanding shares.
Table 1 also describes the operationalization of the variables in this study.
Table 2. Descriptive statistics.
VariableX1X2X3X4Y
Year2022202320222023202220232022202320222023
Mean0.2190.28520.39020.4090.0750.0390.0430.0432.3742.148
Std. Dev0.1990.2121.9031.9080.5930.1160.0140.0194.5454.128
Min0.0000.00014.77015.710−0.540−1.6700.0000.0000.1000.180
Max0.8500.92026.10026.13013.5700.8900.0900.19059.83063.100
Table 3. Climate change management policy descriptives.
Variable/ExplanationYearIndonesiaMalaysiaThailandOverall
% of Companies That Disclosed
Climate Policy Statement202354281162497
88.52%92.43%97.59%93.60%
202251259128438
83.61%85.20%77.11%82.49%
Climate Commitment202344209102355
72.13%68.75%61.45%66.85%
20223617683295
59.02%57.89%50.00%55.56%
Climate Change Risks and Opportunities Strategy2023219181193
34.43%29.93%48.80%36.35%
2022197151141
31.15%23.36%30.72%26.55%
Climate Change Risks and Opportunities in Financial Planning2023291122
3.28%2.96%6.63%4.14%
202216714
1.64%1.97%4.22%2.64%
Climate-Related Scenario Analysis2023165747120
26.23%18.75%28.31%22.60%
20226424189
9.84%13.82%24.70%16.76%
Climate-Related Risks Integrated into Risk Management20231910873200
31.15%35.53%43.98%37.66%
202297951139
14.75%25.99%30.72%26.18%
Climate-Related Risks Assessment Process2023166461141
26.23%21.05%36.75%26.55%
202210434295
16.39%14.14%25.30%17.89%
Company Position Climate-Related Public Policy2023112619
1.64%3.95%3.61%3.58%
2022110415
1.64%3.29%2.41%2.82%
Board Oversight of Climate Change Risks20232015580255
32.79%50.99%48.19%48.02%
20221412447185
22.95%40.79%28.31%34.84%
Remuneration Arrangements Incorporate Climate Change20230202343
0.00%6.58%13.86%8.10%
20220141226
0.00%4.61%7.23%4.90%
Business Impact of Climate Scenario Analysis20237253567
11.48%8.22%21.08%12.62%
20222192950
3.28%6.25%17.47%9.42%
Specific Climate-Related Risk Management Process20231113
1.64%0.33%0.60%0.56%
20220011
0.00%0.00%0.60%0.19%
Membership in any Organizations Dedicated to Climate-Related Issues.20233183253
4.92%5.92%19.28%9.98%
20221141328
1.64%4.61%7.83%5.27%
Table 4. ANOVA test results.
Variable/Explanation2-Year Average Score
X1X2X3X4Y
Per Country
Indonesia0.22321.6680.0370.0372.672
Malaysia0.24119.8120.0620.0622.223
Thailand0.28321.0090.0540.0542.180
Overall0.25220.3990.0570.0572.261
ANOVA test-score5.85084.5190.19810.8360.626
Sig0.0030.0000.8210.0000.535
Per Industry
Financials0.29122.4650.0180.0442.625
Industrials0.18719.5520.0990.0452.085
Real Estate0.24220.7570.0280.0450.873
Communication Services0.20820.9810.0520.0492.720
Consumer Staples0.25820.0510.0710.0393.342
Information Technology0.20518.9860.0540.0423.016
Consumer Discretionary0.24619.8750.0430.0412.411
Utilities0.42621.5490.0370.0501.467
Materials0.25420.0730.0430.0421.648
Energy0.38321.3860.0690.0441.650
Health Care0.20219.8830.0810.0392.783
Overall0.25220.3990.0570.0432.261
ANOVA Test Score10.31238.6970.4013.5982.926
Sig0.0000.0000.9470.0000.001
Table 5. Classical assumption test results.
Classical Assumption TestScoreCriteria for Good FitResults
Normality test (Kolmogorov–Smirnov test)0.000sig > 0.05Not passed
Multicollinearity test (variance inflation factor)1.016–1.422VIF < 10Passed
Heteroscedasticity test (White test)0.691sig > 0.05Passed
Autocorrelation test (serial correlation LM test)0.808sig > 0.05Passed
Table 6. Path analysis results.
VariablePath Coefficientt-StatisticProb.
X10.113.5420.000
X2−0.15−4.4170.000
X30.113.1510.002
X4−0.06−2.4510.014
Adjusted R-squared0.030
F-statistic9.329
Prob(F-statistic)0.000
Table 7. Robustness test results (subsample analysis).
SubsampleX1X2X3X4Adj R2Prob (F-Statistic)
CoefProb.CoefProb.CoefProb.CoefProb.
Per Country
Thailand0.2260.001−0.1710.0130.20.000−0.0820.1360.0730.000
Malaysia0.1320.006−0.180.0000.1070.008−0.0360.3850.0330.000
Indonesia0.0220.836−0.250.0190.2120.020−0.1640.0690.090.005
Per Year
20230.090.084−0.1580.0030.1360.002−0.0150.7410.0310.000
20220.1410.005−0.1440.0040.1170.007−0.0910.0390.0380.000
Disclaimer/Publisher’s Note: The statements, opinions and data contained in all publications are solely those of the individual author(s) and contributor(s) and not of MDPI and/or the editor(s). MDPI and/or the editor(s) disclaim responsibility for any injury to people or property resulting from any ideas, methods, instructions or products referred to in the content.

