Abstract
As a cornerstone of China’s climate governance framework, the carbon trading pilot policy provides critical insights into achieving Sustainable Development Goals (SDGs), particularly SDG 13 (Climate Action) which emphasizes carbon emission reduction. This paper used provincial panel data from 2002 to 2021 in China, it specifies a multi-period Difference-in-Differences (DID) model to evaluate the effects of carbon trading policies on carbon reduction. The results indicate the following: First, carbon trading policies generally have significant effects on carbon emission reductions in pilot regions compared to non-pilot regions. Second, from the perspective of operation mechanisms, carbon trading policy realizes emission reductions mainly through market-oriented incentives and the optimization of energy consumption structures, while the effects of cost pressures and technological innovation are not significant. Third, under the synergistic mechanism, the greater the market-oriented effects and cost pressure generated by carbon trading, the better the effect of optimizing the energy consumption on reducing carbon emissions. Fourth, the regional heterogeneity test shows that the differences in regional green development attention and green financial development level also make the effects of carbon trading policies heterogeneous, where the emission reduction effect is better in regions with higher attention to green development and green financial development levels. The primary contributions of this study lie in its systematic examination of the synergistic effects among market-oriented incentives, technological innovation dynamics, cost pressures, and energy structure optimization.
1. Introduction
With the escalation of global warming and the deterioration of the environment, green and low-carbon development has emerged as a pivotal strategy for countries worldwide to address climate change and achieve sustainable development. As the largest developing country and leading emitter of carbon dioxide, China has consistently prioritized climate change and implemented various measures to promote energy conservation, reduce emissions, and facilitate low-carbon transitions. Compared to traditional carbon reduction tools—such as carbon taxes and fiscal subsidies—the emissions trading system (ETS), as a market-oriented policy instrument, exhibits unique advantages with respect to cost-effectiveness, dynamic incentives, and guiding technological innovation. Carbon taxes impose fixed pricing to directly increase corporate emission costs, which may lead to excessive corporate burdens or insufficient mitigation incentives due to the setting of rigid tax rates. Fiscal subsidies, which are reliant on government budgets, risk triggering moral hazards and long-term fiscal pressures. In contrast, ETS employs a cap-and-trade mechanism that flexibly regulates abatement costs through market-driven pricing while incentivizing enterprises to autonomously optimize emission reduction pathways via quota scarcity, thereby aligning better with China’s market-oriented economic transition needs.
The concept of ecological civilization has garnered increasing attention since the 18th National Congress of the Communist Party of China (CPC). The introduction of the targets of “carbon peaking and carbon neutrality” in 2020 as principal objectives has marked a significant strategic decision in global governance to combat climate change. The 20th National Congress of the CPC has elaborated a roadmap to achieve the goals of carbon peaking and carbon neutrality. In 2011, China formally proposed the phased establishment of a carbon market in the 12th Five-Year Plan. The Department of Climate Change of the National Development and Reform Commission (NDRC) subsequently issued the “Notice on Carbon Emission Trading Pilot Work”, initiating carbon trading pilot projects in eight provinces and municipalities: Beijing, Tianjin, Shanghai, Chongqing, Guangdong, Hubei, Shenzhen, and Fujian. These pilot projects marked the beginning of China’s exploration of carbon market construction. Since the launch of the carbon trading pilot program in 2013, the market in the pilot regions has grown in scale, with increasing volumes and turnovers. This system not only aligns with international mainstream frameworks, such as the EU ETS, but also fosters enterprises’ long-term low-carbon transition expectations through a “Learning by Doing” mechanism, thereby mitigating the short-term economic impacts inherent to carbon taxes.
With further refinement of China’s policy framework, carbon trading has transitioned to a stage of comprehensive development, necessitating a continual enhancement of its emissions reduction impact. However, significant disparities exist in economic development, resource availability, and market maturity across regions. The growing contradiction between China’s economic growth and the upgrading of its industrial structure has resulted in increased energy consumption and higher total carbon emissions. This dynamic poses challenges to the establishment of the carbon trading market and the effectiveness of carbon emission reduction policies.
The establishment of a carbon emissions trading market represents a crucial institutional innovation with respect to controlling greenhouse gas emissions and advancing green and low-carbon development [1]. In 2021, the Ministry of Ecology and Environment issued three successive documents to enhance the operational regulations of the carbon market. In addition, the government’s working report explicitly stated its intention: that it would systematically advance the objectives of carbon peaking and carbon neutrality and promote the development of the carbon emissions trading market in an organized manner.
With further refinement of China’s policy framework, carbon trading has transitioned to a stage of comprehensive development, necessitating continual enhancement of its impact on emission reductions. However, significant disparities exist relative to economic development, resource availability, and market maturity across regions. The growing contradiction between China’s economic growth and the upgrading of its industrial structure has resulted in increased energy consumption and higher total carbon emissions. This dynamic poses challenges to the establishment of the carbon trading market and the effectiveness of carbon–reduction policies. Notably, the regional adaptability embedded in carbon trading systems is particularly critical: unlike the one-size-fits-all approach of carbon taxes or subsidies, carbon trading allows local governments to adjust a policy’s intensity through quota allocation and trading rules—such as alleviating transition pressures via cross-regional collaboration mechanisms—thereby offering a novel institutional pathway to address China’s inter-regional economic disparities during low-carbon transitions.
Therefore, this theoretical proposition requires substantial empirical support. Simultaneously, the effectiveness of carbon trading policy in mitigating emissions and the pace of regional carbon reduction rely heavily on the efficiency of the transmission channel for the emission reduction effect. This efficiency is a crucial indicator for assessing the impact of such policy and its ability to achieve the carbon peaking and neutrality milestones. Against the backdrop of China’s robust promotion of the ecological civilization concept and the comprehensive development of carbon trading, studying the emission reduction effect and mechanisms of China’s carbon trading policy holds significant theoretical and practical value.
Literature review on international carbon trading systems: Bolat C K et al. [2] have investigated the macroeconomic carbon rebound effects of the EU Emissions Trading System (EU ETS) using panel data from 26 European countries spanning the 2005–2019 period. The results confirmed the presence of such rebound effects, revealing that energy intensities significantly amplify emissions (both directly and indirectly) through macroeconomic channels, potentially undermining climate mitigation objectives. Scotti et al. [3] explored policy synergies by combining demand-pull mechanisms (EU ETS) with technology-push instruments (Structural and Cohesion Funds, Horizon 2020). Their panel analysis demonstrated that EU ETS participation, coupled with fiscal support, stimulated environmental patent applications in light industries (2013–2020) and facilitated a 2.2% reduction in energy sector emissions, aligning with the EU’s climate targets. Borghesi et al. [4] systematically evaluated the design and efficacy of the EU ETS Market Stability Reserve (MSR), observing that while MSR mitigated carbon price volatility and enhanced resilience to external shocks, its operational complexity and regulatory uncertainty weakened market predictability. The study advocated for optimizing MSR rules in order to improve market stability. Zaklan et al. [5] employed cost–benefit modeling and scenario analysis to assess EU ETS allowance adjustment strategies under the Paris Agreement’s 1.5 °C target. The findings underscored the necessity of accelerating annual targets. Shen, Bo, et al. [6] compared its design with Chinese regional pilot policies, highlighting similarities in legal frameworks and market structures despite differing national contexts. However, excessive free allowances initially led to corporate quota hoarding (3.21 billion allowances by 2023), necessitating allowance retirement mechanisms. Lessmann and Kramer [7] employed synthetic control methods to evaluate sectoral impacts: while electricity sector emissions fell by 48%, industrial emissions rose by 6% compared to counterfactuals, underscoring the need for policy mix optimization.
With regard to in-China studies, previous studies have investigated the impacts of carbon trading policy from three perspectives: the impact of carbon trading policies, the research methodologies employed, and the evaluation of carbon trading policy systems. Scholars have primarily focused on studying the impacts of carbon trading policies from various perspectives—such as governmental support [8], cost-saving effects [8], environmental effects [9], market-guiding effects [10], economic growth effects [11], the incentive effects of technological innovation [12], and synergistic development effects [13].
In recent years, several studies have examined the impacts of carbon trading policies on carbon emissions, particularly considering China’s substantial potential for reducing carbon emissions [10]. These studies have highlighted that the implementation of carbon trading policies has significant direct and indirect effects on reducing carbon emissions [14]. The construction of the carbon trading market has a spatial dimension, resulting in a spillover effect on emission reductions. This effect results in carbon emission reductions in neighboring regions and promotes the development of a collaborative and low-carbon model for inter-regional cooperation [15].
Researchers have employed three main methods to study carbon trading policies: the double-difference method, the synthetic control method, and simulation and modeling. The double-difference method requires consistency in the trend of carbon emissions between experimental and control groups. However, regions often differ significantly in terms of carbon emissions and convergence rates, complicating the usage of the double-difference method to effectively separate policy effects from other influencing factors. To address this issue, Heckman [16] extended the traditional difference-in-difference (DID) method to PSM-DID. Despite its widespread usage, PSM-DID tends to perform more accurately with large-scale samples. Given that the pilot carbon trading policies involve only eight provinces and cities—which falls short of the criteria for large samples—using PSM-DID to analyze all pilot provinces as a single entity may overlook important factors such as differences in policy timing, supporting measures, implementation efficiency, and local implementation effects [11]. In addition, scholars have employed the synthetic control method to analyze the effects of pilot carbon trading projects [17]; regional CGE simulation to study the emission reduction effects of carbon trading policies [18]; and difference models to quantitatively assess the employment effects of carbon trading policies [19]. However, these simulation and modeling approaches face challenges in their design and are limited in terms of their applicability to real-world scenarios. Therefore, the scientific selection of evaluation methods for carbon trading policies has become a crucial issue in relevant fields of research.
The existing literature on carbon trading policy system designs—through comprehensive analyses of carbon trading pilot policy implementation, sectoral coverage, and system characteristics in various pilot regions—has identified a lack of synergy between carbon trading policies and energy and climate policies [20]. Moreover, the literature highlights legal and regulatory loopholes in carbon trading system designs, resulting in lax penalties for violations, as well as insufficient policy innovation during implementation [21]. Furthermore, regional differences in economic development, ecological environment, resource endowment, industrial structure, technological progress, and energy consumption contribute to varying effects of carbon trading policy implementation across regions [1,11,14]. Due to the evident regional heterogeneity in the implementation effects of carbon trading policies, future policy formulation should focus on improving coordination and synergy with respect to energy conservation policies, such as implementing total energy control targets and renewable energy subsidies [22]. This improvement requires the steady promotion of the carbon market and market space, further necessitating strengthened legislation and high-level designs. Furthermore, policymakers should consider the differences in carbon emissions across regions, paying attention to the linkage mechanisms of carbon emission trading systems between regions to promote regional green development.
Despite their valuable findings, the previous studies have many shortcomings. First, most mediation effect tests focus on governmental support, R&D inputs, green technological innovations, total energy consumption, and economic growth as influencing mechanisms, lacking integration and analyses of the interactions and synergies among these mechanisms. Second, the traditional DID model, as a commonly used research methodology, often fails to fully consider the time differences and stage characteristics relating to the implementation of carbon trading policies in pilot provinces and cities. Third, heterogeneity analyses considering the differences in the emission reduction effects of carbon trading policies have mainly focused on the division of eastern, central, and western regions, overlooking heterogeneity at the level of regional green financial development. To fill in this research gap, studies should consider the role of green finance in promoting carbon trading policies and realizing emission reduction effects by guiding resource allocation processes.
This research study provides major contributions. First, in terms of the impact mechanism, this study integrates existing research to construct a theoretical mechanism framework of carbon trading policies for carbon emission reduction based on four dimensions: market-oriented incentive effects, cost pressure effects, technological innovation power effects, and the optimization of energy consumption structures. Moreover, we test the synergies between (1) market-oriented incentive effects and energy consumption structure optimization; (2) technological innovation momentum and energy consumption structure optimization; and (3) cost pressure and energy consumption structure optimization.
Second, the multi-period DID model is implemented to empirically demonstrate the carbon emission reduction effect of carbon trading policies. The PSM-DID model is used to assess the temporal inconsistency regarding the implementation of pilot carbon trading policies. These methods allow us to collectively analyze the successive implementation of carbon trading policies in eight provinces and cities in China as a quasi-natural experiment, using panel data for 30 provinces in China (excluding Tibet, Hong Kong, Macao, and Taiwan) from 2002 to 2021.
Third, in the analysis of heterogeneity, this study considers two dimensions: green finance and green development. It considers the differences in the level of green financial development, revealing the heterogeneous effects of carbon trading policies on carbon emission reductions. Moreover, the analysis reflects the synergistic effects of carbon emission trading and green financial development. The research on carbon trading policies has implications for expanding green financial support relative to low-carbon development.
2. Material and Method
2.1. Impact of Carbon Trading Policies on Carbon Emissions
Carbon trading policy serves as a top–down signal, thereby incentivizing the widespread adoption of low-carbon development concepts. Consequently, this has resulted in positive expectations regarding green enterprises and industries, garnering increased market attention and support and intensifying their focus on technological research and development. China has conducted pilot carbon trading projects in several provinces and cities since 2011, and carbon emissions in the pilot areas have significantly declined. With the expansion of the scope of the pilot policies and the gradual inclusion of industries, carbon trading policies are set to play a more significant role in controlling carbon emissions nationwide. Carbon trading policy confers a commodity attribute status to carbon dioxide via market means, aiming to incentivize enterprises to reduce their greenhouse gas emissions. Enterprises can make decisions regarding whether to reduce their emissions or purchase emission rights based on their emission reduction costs and the market price of carbon, thus optimizing the allocation of resources. This mechanism helps to minimize the total cost of emission reduction on a society-wide basis, and assists in achieving the overall emission reduction target. In addition, carbon trading policies internalize the cost of carbon emissions, increasing the production costs of high-emission enterprises and thus incentivizing these enterprises to adopt more environmentally friendly production methods and technological improvements. In recent years, the Chinese Government has continued to improve the policy support system for carbon trading markets, including regulations for quota allocation, monitoring and verification, and trading rules. These measures have helped to improve the transparency and fairness of the carbon market and safeguard the healthy operation of the market, thereby promoting emission reductions more efficiently. Based on the above analysis, Hypothesis 1 is proposed:
Hypothesis 1.
Carbon trading policy can reduce carbon emissions.
2.2. Mechanistic Analysis of the Impact of Carbon Trading Policies on Carbon Emissions
In the realm of green finance, carbon trading policy endows carbon dioxide emission rights with a commodity attribute, thus allowing carbon emissions to be addressed through market mechanisms. The policy is implemented based on the initial allocation of carbon emission rights, allowing these rights to be traded in the carbon trading market. This process promotes the effective coordination and rational allocation of carbon emission rights among enterprises [23]. Figure 1 illustrates the carbon emission reduction mechanism of carbon emission trading. According to Figure 1, this study analyzes the influence mechanism of carbon trading policy on emission reductions through four aspects: market-oriented incentive effects, cost pressure effects, technological innovation power effects, and the optimization of energy consumption structures. We also discuss the synergistic structural effects of these four aspects.
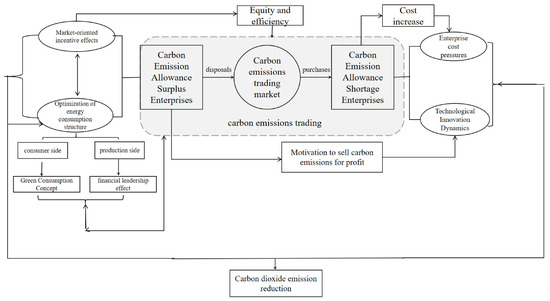
Figure 1.
Carbon emission reduction mechanism of carbon emission trading.
First, the market-oriented incentive effect of the carbon trading policy is highlighted. This policy establishes a market mechanism centered on carbon emission trading, leveraging the market’s decisive role in facilitating the allocation of carbon emissions. Yang et al. (2020) [24] have demonstrated that, from a market-oriented perspective, carbon emission trading policies can effectively reduce carbon emissions in China’s pilot areas. The market-oriented carbon trading policy injects new energy and vitality into enterprises, thereby resulting in a significant reduction in their carbon emission intensity [25,26]. Polluting enterprises can purchase excess carbon emission quotas sold through the carbon market when they emit carbon dioxide levels exceeding their allocated quotas. This mechanism enables the market-oriented control of carbon emission levels for polluting enterprises [27]. Based on the above analysis, Hypothesis 2a is proposed:
Hypothesis 2a.
Carbon trading policy promotes carbon emission reduction through market-oriented incentive effects.
Second, the cost pressure effect is significant. The carbon market internalizes environmental externalities, imposing compliance costs on enterprises. High-carbon enterprises seeking to expand production should purchase additional emission rights from the carbon trading market if their CO2 emissions exceed their quota [8]. Confronted with these costly emissions, high-carbon enterprises should carefully weigh their options in light of increased costs and implement effective measures to reduce carbon emissions [28]. Based on the above analysis, Hypothesis 2b is proposed:
Hypothesis 2b.
Carbon trading policy promotes carbon emission reduction through cost pressure effect.
Third, the effect of technological innovation power is notable. Carbon trading policies significantly enhance technological and green technology innovation levels in pilot cities [29]. The profit-inducing effect incentivizes low-carbon-emitting enterprises to adopt advanced production technologies and cleaner processes, further reducing carbon emissions [8]. Enterprises can earn additional revenue by selling carbon emission rights, encouraging them to prioritize resource allocation for the development of low-carbon technologies [30]. This mechanism promotes green development through the adoption of emission reduction technologies [31]. Based on the above analysis, Hypothesis 2c is proposed:
Hypothesis 2c.
Carbon trading policy promotes carbon emission reduction through technological innovation power effect.
Fourth, optimizing the energy consumption structure is crucial for effectively reducing carbon emissions [32]. On the consumption side, the implementation of carbon trading policy guides the adoption of green consumption concepts. Enterprises tend to use non-fossil and low-carbon energy sources [32], thereby promoting a clean and low-carbon energy consumption structure and reducing carbon emissions. On the production side, the carbon trading market has a crowding-out effect on high-carbon industries, incentivizing enterprises to expedite the upgrading of carbon-emitting equipment and technology. This leads to an improvement in the energy consumption structure and reduced carbon emissions [33]. Moreover, pilot carbon trading market policies serve as a financial guide, directing funds toward green and low-carbon industries. This increases clean energy production, optimizes the energy consumption structure, and realizes carbon emission reductions [34]. Based on the above analysis, Hypothesis 2d is proposed:
Hypothesis 2d.
Carbon trading policy promotes carbon emission reduction by optimizing the energy consumption structure.
Fifth, synergistic mechanisms are observed between the market-oriented incentive, technological innovation motivation, and cost pressure effects and the optimization of energy consumption structures. Optimizing energy consumption structures can effectively reduce carbon emissions, synergistically influencing the other three aspects [35]. Regarding the synergies between market-oriented incentive effects and the optimization of energy consumption structures, under the carbon trading market-oriented effects, high-carbon enterprises are incentivized to optimize their energy consumption structure in order to control carbon emissions [33]. This optimization may stem from the desire to reduce costs by purchasing fewer carbon allowances or to generate profits by selling excess carbon allowances. Regarding the synergy between the cost pressure effect and optimization of energy consumption structure, the high cost pressure generated by carbon trading drives high-carbon enterprises to optimize their energy consumption structure, thus reducing their carbon emissions [36]. This optimization helps to reduce expenditures on purchasing carbon quotas and environmental protection taxes. Regarding the synergy between technological innovation motivation and energy consumption structure, the intrinsic motivation generated by carbon trading drives enterprises to innovate technologically [37]. This innovation, in turn, motivates enterprises to optimize their energy consumption structure, resulting in reduced carbon emissions. Based on the above analysis, Hypotheses 3a–c are proposed:
Hypothesis 3a.
Carbon trading policy promotes carbon emission reduction by the synergistic mechanism optimizing of the energy consumption structure and market-oriented incentives.
Hypothesis 3b.
Carbon trading policy promotes carbon emission reduction by the synergistic mechanism of optimizing the energy consumption structure and technological innovation incentives.
Hypothesis 3c.
Carbon trading policy promotes carbon emission reduction by the synergistic mechanism of optimizing the energy consumption structure and cost pressures.
2.3. Heterogeneity Analysis of Carbon Emission Reduction Effects of Carbon Trading Policies
Local government decision-makers play a crucial role in promoting green development. Under the assumption of limited rationality, the government’s attention is a limited and scarce resource, and variations in focus affect its decision-making behavior. The government’s attention to green development refers to its focus on areas related to green development, such as green production, green ecology, and green institutions, as reflected in government work reports. Government work reports (GWRs), characterized by standardized language and rigorously formulated measures, undergo multiple authoritative stages prior to their official release—including drafting, public consultation, and legislative review—ensuring high credibility and authoritativeness. By extracting keywords from GWRs and conducting in-depth qualitative and quantitative analyses, we can unveil the evolving green development prioritization levels across different governance phases at the local government level.
The measurement of attention to green development was based on the method of Niuqin et al. [38] and Wen Hong et al. [39], who performed textual analysis to extract keywords related to “green development” from the government work reports of each province. Keywords were selected based on national policy documents, including Opinions of the Central Committee of the Communist Party of China and the State Council on Accelerating the Construction of Ecological Civilization and the “14th Five-Year Plan for Ecological Environmental Protection”, revolving around the following five core thematic areas: “green development philosophy, green production, green lifestyles, green ecology, and institutional development”. The total statistical keyword word frequency indicators are as follows: development concept—low-carbon economy, circular economy, green economy, ecological civilization demonstration zone, and eco-city; green production—high energy consumption, energy conservation and emission reduction, water-saving irrigation, industrial water conservation, green manufacturing, consumption reduction, and agricultural surface pollution; green life—domestic waste, green consumption, green travel, and toilet revolution; green ecology—mountain and forest restoration, tree planting and afforestation, water conservation, and green water and green mountains; system construction—joint prevention and control, local legislation, public participation, environmental regulatory mechanism, and green governance. Attention levels are measured using the ratio of a keyword’s frequency to the total number of keywords, indicating how local government attention is allocated to green development.
At present, Chinese local governments present different levels of attention to green development, which directly affects policy design and decision-making. A higher green development attention level contributes to the effective implementation of carbon trading policies and promotes carbon emission reductions. However, in provinces with a higher attention level, the government’s focus may result in a crowding-out effect, weakening the marketization effect and substituting for the effect of carbon trading policy. This variation in attention affects the implementation strength and effects of carbon trading policy, resulting in differing carbon emission reduction levels across regions. Based on the above analysis, Hypothesis 4a is proposed:
Hypothesis 4a.
The impact of carbon trading policies on carbon emission reduction is heterogeneous due to the differences in the attention to green development of each local government.
Green finance, characterized by financial innovation and environmental regulation, optimizes the allocation of financial resources by directing funds to green and low-carbon areas. This regulation promotes resource efficiency, supports green development, and facilitates low-carbon industrial transformation, thus balancing economic growth with environmental protection. The level of green financial development was measured following the methods of Chen et al. [40] and Liu et al. [41], who employed the entropy value method to calculate the green financial index. The entropy weight method demonstrates strong objectivity, as the weighting scheme is determined by the inherent dispersion characteristics of the dataset itself, thereby avoiding subjective weighting biases. This approach enables the simultaneous processing of multiple heterogeneous indicators, rendering it particularly suitable for constructing composite indices in green finance—a multidimensional field encompassing credit, securities, and other financial domains. The comprehensive evaluation system encompasses green credit, securities, insurance, and investment. Green finance utilizes tools such as green credit and bonds to guide funds within the financial system toward realizing green and low-carbon industries. This approach attracts social capital to green sectors, ensuring their continuous development and growth. Additionally, green finance is applied to monitor fund utilization and regulate the production processes of enterprises and industries. This form of supervision strengthens the oversight of fund users to ensure that environmental responsibilities are met, as well as enhancing the environmental responsibility of financial institutions and further improving emission reduction efforts [42]. At present, green finance development levels vary across regions in China, resulting in heterogeneity in the effectiveness of carbon trading policies in reducing emissions. Based on the above analysis, Hypothesis 4b is proposed:
Hypothesis 4b.
Due to the differences in the level of green finance development in each region, the impact of carbon trading policies on carbon emission reduction is heterogeneous.
2.4. Sample Selection and Data Sources
This study empirically examines the carbon emission reduction effect of carbon trading policy implementation using panel data from 30 provinces in China (excluding Hong Kong, Macao, Taiwan, and the Tibet Autonomous Region) as samples. Due to the unavailability of carbon dioxide emission data beyond 2021, panel data from 2002 to 2021 were selected to ensure their completeness. Different sources were used to obtain the data. The database of CSMAR provided information on the following: carbon dioxide emission sources; gross regional product (GDP); secondary industry; tertiary industry, total imports; total exports; total foreign investment; carbon trading volume; and completed investment in industrial pollution control. The China Statistical Yearbook provided information on GDP, the total population at the end of the year, the area of the province, and per capita education expenditure. The Wind and China Tax Yearbook was used for the following: data on sewage charges among mediating variables. The data on green development prioritization were sourced from provincial and municipal government work reports (GWRs). Green finance data were sourced from authoritative platforms, including the National Bureau of Statistics (NBS); provincial and municipal statistical yearbooks; environmental bulletins; specialized statistical publications (e.g., China Statistical Yearbook on Science and Technology, China Financial Yearbook, China Industrial Statistical Yearbook, China Energy Statistical Yearbook); and official websites of institutions such as the People’s Bank of China (PBoC). This research study uses linear interpolation to match the data with individual missing data points, obtaining 600 annual observations.
2.5. Model and Variable Setting
2.5.1. Model Building
This study adopts the multi-period DID methodology to assess the carbon emission reduction effects in the pilot carbon emission trading policy regions, which compares the changes in emissions before and after policy implementation between treated and control groups over multiple years. According to the NDRC Notice on Carbon Emission Trading Pilot Work, China started to implement the pilot carbon emission trading policy in five cities—including Shanghai, Shenzhen, Beijing, Tianjin, and Guangdong—in 2013. Then, Hubei and Chongqing began implementing the policy in 2014, and Fujian followed in 2017. Given that all pilot jurisdictions (except Shenzhen) constitute provincial-level administrations (including municipalities directly under the central government) and considering Shenzhen’s administrative subordination to Guangdong Province, we integrated Shenzhen into Guangdong’s provincial framework to ensure methodological consistency within the scope of our research. This study constructs a quasi-natural experiment using 7 pilot provinces (including Shenzhen within Guangdong Province) as the experimental group, and the other 23 provinces as the control group.
The traditional double-difference method uses a dummy variable () to indicate the experimental group, which is determined according to whether it is affected by the policy. If a city is designated as a pilot city, it is assigned to the experimental group. In this case, the dummy variable is equal to 1; otherwise, it is 0 and the city is assigned to the control group. Another dummy variable, T, is considered based on the chronological order of policy implementation to indicate the experimental staging period: It takes the value of 0 prior to the implementation of the policy; otherwise, it takes the value of 1. However, as the regional pilot projects of China’s carbon trading policy were not uniformly planned and implemented within the same year, this study draws on the research method of Yuan Hang et al. [43]. We assign a variable of 0 to the control and experimental groups prior to the implementation of the carbon trading policy; the variable of the experimental group during the carbon trading policy implementation year and after is set to 1. Using this method, the dummy variable was directly generated, in order to represent the implementation of carbon trading policy. Using the dummy variable , a two-way fixed-effect model was then constructed and estimated via the double-difference estimation method. This approach allowed us to examine the net effect of the carbon trading policy on carbon emission reductions, in accordance with Equation (1):
where denotes the explanatory variable, representing the carbon dioxide emissions per capita of region i in year t in logarithmic form; denotes the dummy variable for pilot carbon emission trading policies, and its coefficient reflects the effects of the pilot carbon emission trading policy; denotes a set of control variables; denotes the individual fixed-effect of each province; indicates the time fixed effects; denotes the random error term.
The dependent variable in this study is measured via per capita carbon dioxide emissions. While carbon emissions are intrinsically linked to socioeconomic activities, direct comparisons of aggregate emission levels across pilot regions would compromise the validity of the control variable approach due to significant population disparities. Per capita emissions provide a more accurate representation of municipal-level emission patterns, enhancing cross-jurisdictional comparability between provincial administrations and directly controlled municipalities. This methodological selection aligns with the measurement framework established in Chen Zhigang’s [44] seminal work on regional carbon accounting.
The key explanatory variable is the dummy pilot carbon trading policy variable: . According to the previous theoretical analysis, before is expected to be negative; that is, the pilot carbon trading policy can inhibit carbon emissions. If is significantly less than 0, the pilot carbon trading policy significantly inhibits carbon emissions.
2.5.2. Control Variables
To control other indicators of economic characteristics affecting carbon emissions, referring to existing research practices [45], this study introduces a series of control variables :
- (1)
- Economic development level (): The economic development level increases carbon dioxide emissions through the scale effect and reduces carbon dioxide emissions through technological and structural effects, and this study adopts the GDP per capita as a measure of economic development.
- (2)
- Industrial structure (): Carbon dioxide emissions are mainly a result of the combustion of fossil fuels; thus, this study uses the ratio of the secondary industry to the regional GDP to measure the impact of industrial structures on carbon dioxide emissions.
- (3)
- Population density (): Population density is measured using the ratio of the total population to the area of the province at the end of the year. Population density can reflect the population agglomeration degree, and CO2 emissions are not only influenced by production processes but also by the population agglomeration degree.
- (4)
- Infrastructure level (): The infrastructure level is measured using the per capita road area of each province.
- (5)
- Human capital level (): Referring to Gu Xuesong et al. [46], this is obtained by synthesizing five indicators—namely, the per capita education expenditure, number of students enrolled in higher education/total population, average years of education, R&D expenditure/GDP, and full-time equivalents of R&D personnel—using principal component analysis.
- (6)
- Openness to the outside world (): According to Gu Xuesong et al. [46], this is obtained by synthesizing three indicators—namely, total exports/GDP, total imports/GDP, and the amount of actual utilized foreign capital/GDP—using principal component analysis. To verify the robustness of the results, this research study adopts the double-cluster regression method of controlling individual and time fixed effects.
2.5.3. Mediating Variables
To verify the robustness of the results, this research adopts the double-cluster regression method of controlling for individual and time fixed effects. The mediating variables are as follows:
- (1)
- The market-oriented incentive effect () is measured using the volume of carbon trading in each region, reflecting the scale of the carbon trading market and the overall market situation of carbon trading in each province.
- (2)
- The cost pressure effect () is the ratio of regional environmental protection tax and industrial pollution control completed investment to GDP. These two indicators measure the intensity of environmental regulation, reflecting the cost pressures borne by high-carbon enterprises under environmental regulation.
- (3)
- The technological innovation power effect () is the amount of R&D input.
- (4)
- Energy consumption structure () indicates the share of different energy consumption types. Among the various energy types, the proportion of coal consumption in total energy consumption has great importance, as it is the main source of carbon emissions.
3. Results
3.1. Descriptive Statistics
Table 1 presents the descriptive statistics of the main variables. According to Table 1, the mean value of the of each province is 1.8, with a standard deviation of 0.729, indicating significant differences among provinces. There are notable differences between pilot provinces (experimental group) and non-pilot provinces (control group) in most indicators. The of the experimental group is significantly lower than the control group, with higher levels of the following: economic development, population density, infrastructure, human capital, and openness to the outside world.

Table 1.
Descriptive statistics of variables.
Table 2 shows the results of the multiple covariance and smoothness tests. VIF (variance inflation factor) is utilized to detect multicollinearity between independent variables in the regression model. If the VIF value is greater than 10, this means that serious multicollinearity occurs. The AD (augmented Dickey–Fuller) test is introduced to test the smoothness of the time-series data. The HT (Hausman–Taylor) and Breitung tests are used to test whether the panel data are smooth overall. The test of multicollinearity for each variable in the regression model indicates that is 5.85, which is the only variance inflation factor greater than 5—substantially lower than the critical value of 10. The VIF values of the remaining variables are all lower than 5, suggesting that the model has no serious multicollinearity. Additionally, to prevent the occurrence of pseudo-regression, this study comprehensively applies the ADF, Breitung, and HT tests to assess the smoothness of each variable. Table 2 provides the results of the stationary tests and multiple covariance examinations. According to the table, the variables are at the stationary level, paving the way to estimate the model without concerns of spurious regression.
Table 2.
Multiple covariance test and stationary test results.
3.2. Empirical Analysis and Robustness Test
This study first estimates the direct impact of carbon trading policies on regional carbon emissions. Using a multi-period difference-in-difference (DID) approach, we assessed the net effect of the carbon trading policy on regional carbon emissions by progressively adding control variables. In all regression models, to eliminate confounding factors that affect the core explanatory variable (carbon trading policy ), we controlled for both individual and time fixed effects, with a focus on the DID estimators of the carbon trading policy. The results are presented in Table 3.
Table 3.
Benchmark regression results.
The results show that the coefficients of the variable for the carbon trading policy are significantly negative for all models, validating the policy’s significant role in reducing carbon emissions. In Column (1), which only includes the variable, the coefficient of −0.433 indicates that the pilot policy reduced the per capita carbon emission in pilot provinces by approximately 43.3%. As control variables are incrementally added, the coefficient attenuates to −0.185, but it remains significantly negative. This pattern suggests that while part of the policy effect may operate indirectly through regional economic characteristics, the direct emission reduction effect of the policy itself remains dominant. Finally, Column (6) shows that the carbon trading system reduced the per capita carbon emissions in pilot regions by 18.5%, confirming the policy’s effectiveness in curbing per capita emissions. Thus, Hypothesis 1 is supported. The model’s goodness of fit () increases progressively from 0.634 (Column 1) to 0.694 (Column 6), indicating that the inclusion of control variables effectively captures heterogeneity in emission drivers. For example, industry and facility introductions increase by 0.024 and 0.015, respectively, highlighting the explanatory power of structural factors over carbon emissions.
To ensure the consistency of the multi-period double-difference estimation, it is necessary to satisfy the parallel trend assumption. This assumption states that the trend changes in the experimental and control groups should be the same as those before the implementation of the policy. The rejection of this assumption indicates that the results are biased. The parallel trend assumption implies that the of the experimental and control group provinces exhibited the same changing trend before piloting the carbon trading policy. Equation (2) is used to investigate the parallel trend:
Here, denotes the effect of the period on regional carbon emissions before the implementation of carbon trading policies; denotes the effect of the period on regional carbon emissions after the implementation of carbon trading policies; signifies the current implementation period effect of carbon trading policies on regional carbon emissions. The remaining symbols are as previously stated. Figure 2 displays the parallel trend graph according to Equation (2).
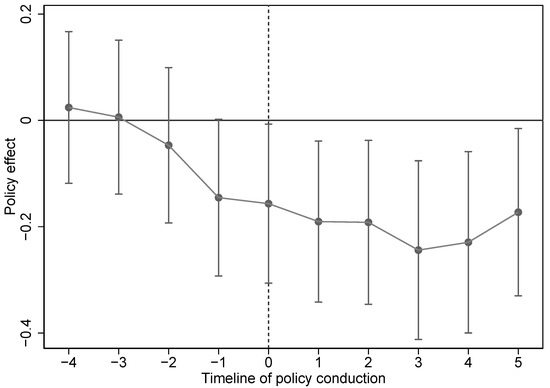
Figure 2.
Plot of parallel trend test.
As shown in Figure 2, prior to the implementation of carbon trading policies, the regression coefficients exhibited a negative trend, and they became more pronounced as the policy’s enactment date approached, but this remained insignificant. This pattern may reflect the anticipatory effects driven by pre-policy signals (e.g., policy announcements or stakeholder expectations). Consistent with the findings of Egami et al. [47], policies in their preparatory phase often generate early positive effects, resulting in gradual divergence between the treatment and control groups. The positive effects further strengthened after implementation. Following the policy’s enactment (marked as the 0 point on the horizontal axis), the confidence intervals consistently lie below the zero line and exclude 0, satisfying the parallel trend assumption. Post-implementation, the regression coefficients are significantly negative, indicating that carbon trading policies exert a sustained inhibitory effect on carbon emissions.
To further ensure the robustness of the estimation results, this study employs a placebo test. This test involves randomly selecting seven provinces from all provinces to form a new pilot carbon trading policy region as a virtual sample, simulating it 500 times. Figure 3 demonstrates the kernel density curves of the estimated coefficient values of the variables after repeating the simulation 500 times, in accordance with Equation (1). Based on the figure, the kernel densities of the coefficient estimates generated during the randomization process almost overlap with a positive tertiary distribution and a mean of 0. The p-values are mostly located above 0.1, and the probability of the baseline regression coefficients appearing as −0.185 is very low given the random sampling method. This indicates that, for the randomly generated experimental group, the suppressive effect of the carbon trading policy on is insignificant. Thus, the estimation results are robust.
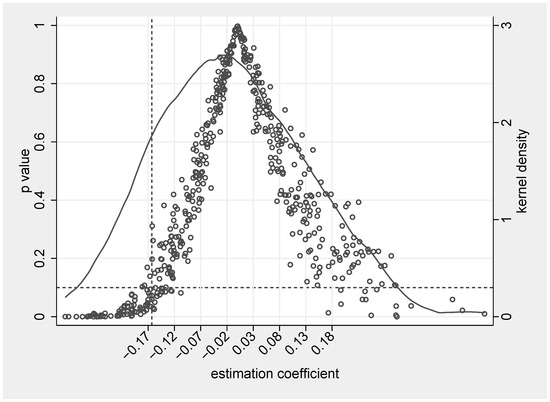
Figure 3.
Placebo test.
To further verify the robustness of the results, the explanatory variables are replaced by the logarithm of total CO2 emissions relative to the province (). Table 4 shows the results of the robustness test. Column (1) provides the results of the regression without control variables, while Column (2) offers the regression results with all control variables included. The coefficients of the core explanatory variable are all negative and significant using the total CO2 emission value, indicating that the carbon trading policy consistently had a significant and inhibitory effect on carbon emissions when replacing the explanatory variables.
Table 4.
Replacement of explanatory variables and regression results with alternative control variables.
Considering significant differences in environmental governance and other aspects among provinces, this paper adds three new control variables including the level of development of the service industry (), environmental regulation (), and attention to green development (). The level of development of the service industry is measured by the ratio of the tertiary industry to the gross domestic product, and the environmental regulation is measured by the amount of investment in industrial pollution control. The measurement of attention to green development refers to the method of Wen Hong et al. [39], which extracts 25 keywords related to “green development” from the “Work Report of the Government” of each province. It takes the ratio of the keyword frequency to the total word frequency as the ratio of the keyword frequency to the total word frequency. The attention to green development in each province is measured by the ratio of the keyword frequency to the total word frequency. Table 4 represents the results of estimating the regression with the alternative control variables. Based on Table 4 column (3)–(6), the coefficient of for the carbon trading policy remains negative at statistically significant. This estimation confirms the results of the regressions.
Considering significant differences in environmental governance and other aspects among provinces, this study introduces three new control variables, including the development level of the service industry (), environmental regulation (), and attention to green development (). The development level of the service industry is measured using the ratio of the tertiary industry to the gross domestic product, and environmental regulation is measured using the amount of investment in industrial pollution control. The measurement of attention to green development refers to the method of Niuqin et al. [38] and Wen Hong et al. [39], which involved extracting 25 keywords related to “green development” from the “Work Report of the Government” of each province. It is measured using the ratio of the keyword frequency to the total word frequency. Table 4 represents the estimation results of the regression performed with alternative control variables. Based on Table 4 and Columns (3)–(6), the coefficient of DID for the carbon trading policy remains negative at the 5% level. This estimation confirms the results of the regressions.
3.3. PSM-DID
As the double-difference (DID) model may suffer from selectivity bias, the propensity score matching–double-difference (PSM-DID) model can overcome or reduce the “selectivity bias” introduced by the pilot policy to some extent. Based on this, this study conducted a PSM-DID test. Using the propensity score matching method, the experimental and control groups are matched. Then, based on this matching, the difference method is applied again for regression analysis. The results shown in Table 5 demonstrate that the carbon trading policy can significantly inhibit carbon emissions.
Table 5.
PSM-DID test results.
3.4. Mechanism Analysis of the Impact of Carbon Trading Policy on Carbon Emissions
This study reveals that the implementation of carbon trading policy has a significant and inhibitory effect on carbon emissions. The mechanism analysis reveals that the carbon trading policy reduces carbon emissions through market-oriented incentives, cost pressure effects, technological innovation power effects, and the optimization of energy consumption structures. Moreover, three synergistic mechanisms contribute to more effective emission reductions: the synergies between market incentives and energy structure optimization; technological innovation and energy structure; and cost pressures and energy structure optimization. This research uses the following mediating effect model to identify and verify the specific channels through which carbon trading policies affect carbon emissions:
Here, M denotes the mediating variable, and indicates the direct effect of carbon trading policies on the mediating variables. The mediating variables include the following: market-oriented incentives (); cost pressure effect (); technological innovation motivation (); the optimization of the energy consumption structure (); and the synergistic interactions between and (), and (), and and (). In addition, indicates the intermediary variable effect on after controlling for the carbon trading policy, and denotes the carbon trading policy effect on after controlling for intermediary variables. The remaining symbols are as previously defined.
The is measured by the amount of carbon trading in each region. To address the issue of varying orders of magnitude among different variables, all variables are standardized before estimating the regression. Table 6 presents the results. Column (1) provides the baseline regression results. Column (2) offers the coefficients associated with the variable, which are positive and significant at 1% level, confirming that the carbon trading policy promotes the regional carbon trading quota. According to column (3), the carbon trading policy has significant coefficients. The absolute value of the carbon trading policy’s coefficient is larger compared to the baseline regression, suggesting that implementing the carbon trading policy can lead to carbon emission reductions. This is achieved by increasing the carbon trading quota and encouraging enterprises to convert carbon costs into benefits. Therefore, the results confirm market-oriented incentives as a mediating mechanism. Hypothesis 2a is verified.
Table 6.
Results of intermediary effect test: market-oriented incentive effect.
is measured in accordance with the volume of carbon trading in each region. To address the varying orders of magnitude among different variables, all variables were standardized before regression estimation. Table 6 presents the results. Column (1) provides the baseline regression results. Column (2) offers the coefficients associated with the variable, which are positive and significant at the 1% level, confirming that the carbon trading policy promotes the regional carbon trading quota. According to Column (3), the carbon trading policy has significant coefficients. The absolute value of the carbon trading policy’s coefficient is greater compared to the baseline regression value, suggesting that implementing carbon trading policies can result in carbon emission reductions. This is realized by increasing carbon trading quotas and encouraging enterprises to convert carbon costs into benefits. Therefore, the results confirm market-oriented incentives as a mediating mechanism. Thus, Hypothesis 2a is verified.
The is measured by two indicators: the amount of environmental protection tax () and the ratio of completed investment in industrial pollution control to the region’s GDP (). To mitigate the impact of large differences in the magnitude of various variables, logarithmic transformations and standardization are applied. According to Table 7, column (1) is the results of the benchmark regression, columns (2)–(3) are the results of testing the amount of environmental protection tax, and columns (4)–(5) are the results of measuring the ratio of the amount of completed investment in industrial pollution control to GDP. According to column (2), the coefficient is 0.028, which is statistically insignificant. Following MacKinnon et al. [48], this paper used the Bootstrap method for 500 samples and obtained a 95% confidence interval of (−0.017, 0.005), which contains 0, indicating that the mediating effect of corporate cost pressure under carbon trading does not exist. Based on column (3), the effect of environmental protection tax on is not significant. Regarding columns (4) and (5), the effect of carbon trading policy on the ratio of completed investment in industrial pollution control to GDP is insignificant, but the ratio of completed investment in industrial pollution control to GDP significantly reduces , and the Bootstrap method test yields a 95% confidence interval of (−0.02, 0.02), rejecting this mediating effect. The reason for this could be that China’s environmental regulations mainly focus on emission limits and pollution control. These regulations often compel enterprises to increase spending on pollution treatment and ecological protection. However, China’s economy is predominantly driven by heavy and manufacturing industries, which face higher levels of environmental regulations and compliance costs. In the short term, these industries may struggle to offset the costs of environmental regulations through green innovation technology.
Table 7.
Intermediary effect test: cost pressure effect.
is measured using two indicators: the amount of environmental protection tax () and the ratio of completed investments in industrial pollution control to the region’s GDP (). To mitigate the impact of large differences in the magnitude of various variables, logarithmic transformations and standardization are applied. According to Table 7, Column (1) is the result of the benchmark regression; Columns (2)–(3) are the testing results of the amount of environmental protection tax; Columns (4)–(5) are the results of measuring the ratio of the amount of completed investment in industrial pollution control to GDP. According to Column (2), the coefficient is 0.028, which is insignificant. Following the findings of MacKinnon et al. [48], this study applied the bootstrap method for 500 samples and obtained a 95% confidence interval of (−0.017, 0.005), which contains 0, indicating that the mediating effect of corporate cost pressure under carbon trading does not exist. Based on Column (3), the environmental protection tax effect on is not significant. Regarding Columns (4) and (5), the carbon trading policy effect on the ratio of completed investment in industrial pollution control to GDP is insignificant; however, the ratio of completed investment in industrial pollution control to GDP significantly reduces , and the bootstrap method test yields a 95% confidence interval of (−0.02, 0.02), rejecting this mediating effect.
The reasons for this phenomenon may be the following: The first is the impact of carbon pricing. The core mechanism of the carbon trading policy lies in guiding corporate emission reductions through carbon price signals; however, if carbon prices remain consistently lower than the firms’ marginal abatement costs, companies may prefer to purchase quotas over proactive mitigation. In the early stages of China’s carbon market, free quota allocation was predominant, resulting in an oversupply and depressed carbon prices. An excessively high proportion of free quotas led to insufficient market liquidity and high price volatility, thereby weakening corporate incentives for emission reduction. The second reason is limited coverage and sectoral heterogeneity. The national carbon market currently covers only the power sector, while high-emission industries such as steel and cement remain excluded. This concentrates mitigation pressures locally and ignores significant inter-industry differences in abatement costs. Uncovered sectors may rely on end-of-pipe governance investments (e.g., environmental taxes) rather than systemic emission reduction strategies. Cui et al. [49] observed that the evaluations of pilot carbon trading policies all reflected significant emission reduction effects in the pilot areas, but nationwide market expansion stalled, with the exclusion of some energy-intensive industries constraining the overall mitigation potential.
Third, insufficient coordination between environmental taxes and carbon trading policies is apparent. Environmental protection taxes and carbon trading are distinct policy tools—the former targets end-of-pipe pollution control, while the latter guides source-level emission reductions through market mechanisms. Failure to synergize these policies may lead firms to allocate resources to end-of-pipe solutions (e.g., environmental equipment investments) rather than low-carbon technology upgrades, thereby weakening the cost pressure effects of carbon trading. Yuan et al. [50] observed that pilot carbon trading policies tended to promote green technology advancement (e.g., clean energy R&D), while end-of-pipe investments may crowd out corporate innovation resources, creating path dependency on emission reduction strategies. Additionally, challenges arise from data quality and regulatory loopholes. Imperfections in the monitoring, reporting, and verification (MRV) system enable some enterprises to falsify data or evade oversight, undermining policy implementation. For example, China’s Ministry of Ecology and Environment reported multiple cases of data fraud in 2022, exposing regulatory vulnerabilities, which also introduce biases into research outcomes.
is measured using the amount of R&D input in each region. Increasing R&D investments not only provides a direct pathway for driving technological innovation, but also reflects the immediate impact of carbon trading policy on incentivizing R&D activities. According to Table 8, Column (1) shows the results of the baseline regression. Column (2) indicates that the carbon trading policy has an insignificant effect on technological innovation incentives, and the results of the bootstrap test exhibit a 5% significance level (−0.0074, 0.07), which includes 0. The results reject this effect. In Column (3), the effect of technological innovation on is not significant.
Table 8.
Mediated effect test results: technological innovation dynamic effects and energy consumption structure.
Two main factors may explain this phenomenon. First, insufficient motivation for technological innovation at the source is apparent. Guo et al. [51] reported that the short-term negative economic impacts of carbon trading policies may drive firms to adopt low-cost coping strategies (e.g., emission relocation) rather than long-term technological investments. Enterprises may prioritize “compliance-driven emission reduction” (e.g., purchasing quotas or paying environmental taxes) over innovation, especially under unstable policy expectations, favoring short-term cost minimization. Some firms evade pressure by relocating production to unregulated areas. Lessmann et al. [7] revealed a negative R&D innovation masking effect as a mediator relative to carbon trading policies, indicating that the policy remains in a “compliance cost” phase, failing to adequately stimulate innovation-driven mitigation. Second, data quality issues and regulatory loopholes further dampen innovation incentives. Carbon data fraud or lax verification reduces corporate urgency to pursue emission reduction through innovation.
On the other hand, the mediating effect of R&D innovation fails to materialize significantly in large enterprises, primarily due to their rigid hierarchical decision-making structures which hinder communication between R&D teams and executives, thus further slowing the implementation of innovative proposals. Simultaneously, strict performance evaluation systems prioritizing short-term gains over long-term technological investments further reduce innovation efficiency in large firms. Lessmann et al. [7] reported that the innovation mediation effect in large enterprises is notably weaker than in smaller firms, as complex hierarchies decouple innovation from emission reduction goals. Consequently, current carbon trading policies cannot yet achieve emission reductions in large enterprises by stimulating R&D-driven innovation.
is measured using the ratio of coal consumption to total energy consumption in each region. In Column (4), the coefficient before the implementation of the DID is negative and significant at the 5% level, indicating that the carbon trading policy can effectively optimize the regional energy consumption structure. In Column (5), the coefficients on the carbon trading policy and energy consumption structure are both significant. The absolute value of the coefficient on the carbon trading policy increased compared to baseline regression results, further indicating the carbon trading policy’s role in achieving carbon emission reductions through optimization of the energy consumption structure. Therefore, these results prove the mediating mechanism of optimizing the energy consumption structure. Hypothesis 2d is verified.
3.5. Synergies of Mechanisms
The synergy between the market-oriented incentive effect and optimization of energy consumption structure is measured using the product of the carbon trading quota of each region and the ratio of coal consumption to total energy consumption of each region (). The synergy between technological innovation, motivation, and the optimization of energy consumption structure is measured via the product of the amount of R&D inputs and the ratio of coal consumption to the total energy consumption of each region (). The cost pressure effect and energy consumption structure synergy are measured using the logarithm of the amount of environmental protection tax in each region and the ratio of the amount of coal consumption in each region to the total energy consumption (). To eliminate excessive order-of-magnitude difference effects in different variables, all variables were standardized before estimating the regressions.
Table 9 represents the results. Column (1) lists the results of the baseline regression, Columns (2)–(3) report the results of the test, Columns (4)–(5) reflect the estimation of the test, and Columns (6)–(7) report the results of the test. According to Columns (2) and (3), the coefficients are significant. Compared to the baseline regression results, the absolute value of the coefficients increases due to the synergistic effect of the market-oriented incentive effect and the optimization of energy consumption structures. This result suggests that the greater the market-oriented effect generated by carbon trading, the higher the effect of carbon trading on carbon emission reductions via the optimization of energy consumption structures. Thus, Hypothesis 3a is verified. Similarly, Columns (6)–(7) show that if the cost pressure effect generated by carbon trading is greater, the effect of carbon trading in promoting carbon emission reductions via optimizing energy consumption structures is higher. Hypothesis 3c is, therefore, verified. According to Columns (4)–(5), the effect of the carbon trading policy on indicator is insignificant. The bootstrap test exhibits that the 95% confidence interval is (−0.0138, 0.013). These results reject the mediating effect of the test, possibly because China is dominated by heavy industries and manufacturing. Insufficient incentives exist with respect to technological innovation generated by the carbon trading market, and the technological innovation generated by the carbon trading market is insufficient for optimizing energy structures. Thus, as a consequence of these factors, carbon emission reductions cannot be promoted in the short-term through the usage of green innovation technology to optimize energy structures. Based on Column (5), the synergistic effect of technological innovation and energy structure optimization has a direct effect on promoting carbon emission reductions. The absolute value of the coefficient is higher than that of the benchmark regression values. Therefore, enterprises can promote carbon emission reductions by simultaneously advancing technological innovation and optimizing the energy consumption structure.
Table 9.
Mediation effect test results: synergistic effect.
3.6. Heterogeneity Analysis of Carbon Emission Reduction Effects of Carbon Trading Policies
Columns (1) and (2) in Table 10 present the regression results of the impact of carbon trading policies on carbon emissions, based on the heterogeneity of green development attention across the country. The absolute values of the pre-DID coefficients for the group of provinces with higher levels of green development attention are greater than those for provinces with lower levels of green development attention; however, the disparity is relatively small. Columns (3) and (4) show the regression results of the impact of carbon trading policies on carbon emissions based on the heterogeneity of green development attention in the pilot provinces. For pilot provinces with a higher level of attention to green development, the impact of carbon trading policies on carbon emissions is negative and significant at the 1% level. In contrast, for pilot provinces with a lower level of attention to green development, the impact of carbon trading policies on carbon emissions is positive and significant at the 1% level. Thus, Hypothesis 4a is verified.
Table 10.
Emission reduction effect of carbon trading policy and the difference between green development attention and green financial development level.
The regression results indicate that the emission reduction effect of carbon trading policies is significantly greater in provinces with higher levels of green development attention than in those with lower levels. Regarding the pilot areas, the carbon trading policy significantly suppressed in provinces with a higher level of attention to green development. In contrast, was enhanced in provinces with a lower level of attention to green development. This indicates that improving the local government’s attention to green development contributes to the effective implementation of carbon emission reduction effects. Therefore, in the future, it is important to improve the transformation action plans relative to green development attention. Additionally, promoting sustainable and optimal green development attention in pilot provinces can also further enhance regional green development.
Green finance serves as a financial tool that directs investment into green products and low-carbon projects, thereby facilitating the regional reduction of carbon emissions. In Table 10, Columns (5) and (6) exhibit the regression results of the pilot regions grouped by their green finance development levels. Column (5) represents the pilot provinces with a green finance index that is higher than the median, and Column (6) shows the pilot provinces with a green finance index that is lower than the median. The results show that—for the pilot provinces with a higher green financial index—the DID coefficient is negative and significant at the 1% level, indicating that the carbon trading policy reduces . However, for the pilot provinces with a lower green financial index, it plays an insignificant role, indicating that a higher level of green financial development can enhance the implementation of the carbon trading policy and thus introduce greater emission reductions. Therefore, Hypothesis 4b is verified. In addition, these results show that each region should strengthen and promote green finance development. Green finance broadens the financial channels of energy-saving and emission reduction projects through innovative financial products—such as green credit, bonds, investments, and securities and energy-efficiency credit. This enables both incentive and constraint effects: Alleviating the financing constraints of the green industry and increasing the debt financing costs for heavily polluting enterprises. In addition, the optimal allocation of resources is realized, and green and low-carbon technology innovation is promoted, thus improving the total factor productivity and driving carbon trading policy to play a stronger role in emission reductions.
4. Discussion
Empirical analysis shows that the coefficients of the DID variable for the carbon trading policy are negative for all models, validating the policy’s significant role in reducing carbon emissions. Specifically, the coefficient for economic development level () is significantly negative across Table 3. Columns (2)–(6), suggesting that economic expansion may suppress emissions through technological upgrades or improvements in energy efficiency. The industrial structure coefficient () is significantly positive (0.020 to 0.015), indicating that a 1-percentage-point increase in industrial share increases per capita emissions by approximately 1.5–2.0%. This result reveals the rigid dependence of carbon emissions on energy-intensive industries, highlighting the need for coordinated industrial policies to enhance mitigation. The infrastructure coefficient () exhibits a significantly positive value of 0.079, suggesting that transportation network expansion may temporarily increase emissions through scale effects, further necessitating green infrastructure policies such as “smart transportation” to optimize its impact. The coefficients for human capital () and openness () remain insignificant, and this is likely because their emission-reduction potential—through skilled labor and foreign trade activities—had not fully materialized during the sample period. While the policy demonstrates effectiveness, regional disparities and data limitations might affect generalizability of the findings. In the Future outlook section, we would discuss possible directions for further improvement.
However, Carbon trading policies cannot promote carbon emission reduction through mechanisms of cost pressure and technological innovation. The reason that cost pressures are not significant could potentially be explained by the followings: first, carbon prices are lower than the marginal cost of reducing emissions for a long time, and companies may be more inclined to buy allowances than to actively reduce emissions. Second, the national ETS currently only covers the power sector, and those that are not covered may rely on end-of-line governance investments (such as environmental taxes) rather than systematic emission reductions. In addition, there may be regulatory loopholes, false reporting and concealment of data, etc.
Similarly, the non-significant effect of technological innovation in reducing carbon emissions could potentially be explained by the followings: one possible reason is the lack of motivation at the source of input; On the other hand, large enterprises usually have a strict hierarchical decision-making structure, and it is difficult to implement innovation proposals quickly.
5. Conclusions
5.1. Research Findings
Based on Chinese inter-provincial panel data from 2002 to 2021, this study assessed the carbon emission reduction effects of pilot carbon trading policies using the multi-period DID method and a mediation effect model. The model was based on four types of channels: market-oriented incentives, cost pressure effect, technological innovation power effect, and energy consumption structure optimization. We also considered the synergistic effects between market-oriented incentives and energy consumption structure optimization; between technological innovation and energy consumption structure optimization; and between cost pressure and energy consumption structure optimization. These synergistic mechanisms were used to test the transmission pathways of the carbon emission reduction effects associated with carbon trading policy, as well as analyzing the impact pathways through which carbon trading policy influences per capita carbon dioxide emissions. This study observed the following findings.
Overall, carbon trading policy has an obvious effect on reducing carbon emissions. Compared to non-pilot regions, the policy in pilot regions facilitated a reduction in per capita carbon dioxide emissions, resulting in a significant decrease in overall emissions.
Second, in terms of the mechanism of action, the carbon trading policy brought about carbon emission reductions through market-oriented incentives and optimization of the energy consumption structure. However, the cost pressure and technological innovation motivation mechanisms were observed to be insignificant relative to the synergistic mechanism. If carbon trading generates greater market-oriented effects and cost pressures, then its role in promoting carbon emission reductions through the optimization of energy consumption structures is more pronounced.
Third, at the level of green development heterogeneity, regional differences in the attention focused on green development and green financial development levels also rendered the carbon emission reduction effects of carbon trading policies heterogeneous. Furthermore, carbon trading policies exhibited stronger emission reduction effects in regions characterized by high levels of green development and green financial development.
5.2. Policy Implications
First, pilot experiences should be proactively promoted; the construction of carbon markets should be accelerated; and their coverage should be expanded. Building upon lessons from existing pilot regions, carbon trading platforms that cover more industries and entities should be established. Emerging economies in developing countries can adapt pilot practices to their local conditions in order to advance carbon market development and foster the global green transition. At present, China’s carbon market only covers the power sector, and the expansion into energy-intensive industries—such as the steel and cement industries—is met with sectoral resistance due to cost disparities and fairness concerns regarding uneven quota allocation. To address implementation challenges, we recommend adopting incremental reforms; for example, sectors with high mitigation potential and robust data foundations (e.g., cement, electrolytic aluminum) should be prioritized. Differentiated quota allocations should be refined based on pilot city experiences, and SMEs should be supported through capacity-building programs to lower barriers to participation.
Second, market incentives can be leveraged to accelerate energy structure optimization. Carbon trading policies can bring about emission reductions through energy mix improvements and market-driven incentives. Developing countries with secondary industries characterized by high energy consumption and pollution particularly need to accelerate the development of clean energy sources such as hydropower, nuclear power, and wind power, and establish a clean, low-carbon energy consumption system. However, high transition costs and regional energy disparities require tailored approaches. With respect to the eastern regions, market incentives should be enhanced via carbon financial instruments (e.g., carbon futures) to channel capital into clean energy projects. In the central and western regions, we recommend establishing ecological compensation mechanisms (e.g., forestry carbon sink trading) to offset transition costs and provide fiscal transfers for technology adoption. This synergy between market incentives and structural optimization will enhance carbon reduction.
Third, this study recommends strengthening cost pressure from carbon trading to spur corporate innovation. While current cost pressures and innovation under carbon trading exhibit limited emission effects, policies should require high-carbon firms to invest more in R&D for low-carbon technologies. To address risks such as short-term production cuts, long-term “shifts from real economy to virtual sectors”, and innovation uncertainties due to overlapping policies, a dual “R&D support + market stability” mechanism should be implemented; for example, an industrial transition fund for high-risk tech subsidies or tax breaks can be created. In turn, expectations can be stabilized via a carbon price floor mechanism to reduce investment risks.
Fourth, regional heterogeneity with respect to green priorities and financial capacities should be accounted for. Moreover, we recommend tailoring carbon market designs (coverage and quota allocation) and green incentives to local conditions. To mitigate challenges such as local protectionism, policy fragmentation, and international fairness conflicts, we recommend the promotion of regional collaboration. This involves integrating pilot carbon markets in city clusters (e.g., Beijing–Tianjin–Hebei, Yangtze River Delta) with cross-regional quota trading. Finally, the mutual recognition of carbon tariffs (e.g., with the EU) should be highlighted and negotiated, in order to secure transition times for high-carbon export industries.
5.3. Future Outlook
While this study validates the short-term emission reduction effects of carbon trading policies and their core mechanisms, the dynamic evolution of policy impacts and sectoral heterogeneity requires further exploration. Future research should deepen the inquiry through exploration of the following directions: First, the dynamic assessment of long-term impacts should be carried out. The effectiveness of carbon trading policies may exhibit nonlinear characteristics, shaped by market maturity, technological progression, and economic cycles. Future studies should update datasets to investigate the long-term emission reduction effects of carbon trading policies.
Second, sectoral heterogeneity and carbon leakage risks should be investigated. Existing research studies predominantly rely on provincial-level macrodata; however, sensitivity disparities relative to carbon prices between energy-intensive (e.g., steel, cement) and low-energy sectors may trigger “carbon leakage” (i.e., relocation of high-carbon industries to non-pilot regions). Future research should conduct sector-specific analyses, integrate firm-level microdata, and propose differentiated quota allocation schemes.
Third, future research should also examine policy synergy optimization. Existing studies primarily focus on the direct emission impacts of carbon trading systems, yet practical implementation often involves concurrent policies related to energy trading and green electricity certificates (GECs), which may result in overlapping goals or institutional conflicts. Building upon this, future research could employ the triple difference-in-difference (DDD) method in order to compare emission reduction outcomes under standalone carbon trading versus integrated “carbon trading + GEC” policy portfolios, thereby identifying optimal mitigation effects under policy synergies.
Supplementary Materials
The following supporting information can be downloaded at: https://www.mdpi.com/article/10.3390/su17114764/s1, Table S1: Panel data.
Author Contributions
The Contributions of all authors are as follows: P.L.: Conceptualization, Data curation, Formal analysis, Investigation, Methodology, Software Visualization, Writing—original draft. L.X.: Investigation, Software, Validation, Visualization. X.G.: Funding acquisition, Project administration, Resources, Supervision, Validation, Writing—review & editing Y.C.: Investigation, Software, Validation, Writing—review & editing. All authors have read and agreed to the published version of the manuscript.
Funding
The authors are grateful for the financial support from the National Social Science Foundation Project of China (No. 23BJY079), the Research Project of the Humanity and Social Science Fund of the Ministry of Education of China (No. 22YJA790015), National Forestry and Grassland Administration Business Entrustment Project of China (20231002), and the Fundamental Research Funds for the Central Universities in Beijing Forestry University (2023SKQ04). The financial support of all four funders listed above in this article have roles in study design, data collection and analysis, decision to publish and preparation of the manuscript. Therefore, they are listed in this manuscript.
Institutional Review Board Statement
Not applicable.
Informed Consent Statement
Not applicable.
Data Availability Statement
The datasets for this study can be found in the Supplementary Materials named as “Panel data”.
Conflicts of Interest
The authors declare no conflicts of interest.
References
- Zhang, H.; Zhang, Z.; Sun, K.; Zou, Y. Emission Reduction Effect, Influencing Factors and Economic Impact of China’s Carbon Market: An Empirical Test Based on a Multi-Period DID Model. Sage Open 2023, 13, 21582440231206626. [Google Scholar] [CrossRef]
- Bolat, C.K.; Soytas, U.; Akinoglu, B.; Nazlioglu, S. Is there a macroeconomic carbon rebound effect in EU ETS? Energy Econ. 2023, 125, 106879. [Google Scholar] [CrossRef]
- Scotti, F.; Flori, A.; Crescenzi, R.; Pammolli, F. Demand-pull and technology-push environmental innovation: A policy mix analysis on EU ETS and EU cohesion policy. Clim. Policy 2025, 25, 153–170. [Google Scholar] [CrossRef]
- Borghesi, S.; Pahle, M.; Perino, G.; Quemin, S.; Willner, M. The market stability reserve in the EU emissions trading system: A critical review. Annu. Rev. Resour. Econ. 2023, 15, 131–152. [Google Scholar] [CrossRef]
- Zaklan, A.; Wachsmuth, J.; Duscha, V. The EU ETS to 2030 and beyond: Adjusting the cap in light of the 1.5 C target and current energy policies. Clim. Policy 2021, 21, 778–791. [Google Scholar] [CrossRef]
- Shen, B.; Dai, F.; Price, L.; Lu, H. California’s cap-and-trade programme and insights for China’s pilot schemes. Energy Environ. 2014, 25, 551–575. [Google Scholar] [CrossRef]
- Lessmann, C.; Kramer, N. The effect of cap-and-trade on sectoral emissions: Evidence from California. Energy Policy 2024, 188, 114066. [Google Scholar] [CrossRef]
- Wang, L.; Liu, C.; Yang, X. Research on Carbon Emission Reduction Effect of China’s Carbon Trading Pilot. Adv. Soc. Sci. Res. J. 2020, 7, 240–250. [Google Scholar] [CrossRef]
- Peng, H.; Qi, S.; Cui, J. The environmental and economic effects of the carbon emissions trading scheme in China: The role of alternative allowance allocation. Sustain. Prod. Consum. 2021, 28, 105–115. [Google Scholar] [CrossRef]
- Wang, D.; Sun, Y.; Wang, Y. Comparing the EU and Chinese carbon trading market operations and their spillover effects. J. Environ. Manag. 2024, 351, 119795. [Google Scholar] [CrossRef]
- Xu, W. The impact and influencing path of the pilot carbon emission trading market—Evidence from China. Front. Environ. Sci. 2021, 9, 787655. [Google Scholar] [CrossRef]
- Liu, J.; Liu, X. Effects of carbon emission trading schemes on green technological innovation by industrial enterprises: Evidence from a quasi-natural experiment in China. J. Innov. Knowl. 2023, 8, 100410. [Google Scholar] [CrossRef]
- Allan, G.; Lecca, P.; McGregor, P.; Swales, K. The economic and environmental impact of a carbon tax for Scotland: A computable general equilibrium analysis. Ecol. Econ. 2014, 100, 40–50. [Google Scholar] [CrossRef]
- Zhang, H.; Duan, M.; Deng, Z. Have China’s pilot emissions trading schemes promoted carbon emission reductions?—The evidence from industrial sub-sectors at the provincial level. J. Clean. Prod. 2019, 234, 912–924. [Google Scholar] [CrossRef]
- Li, Z.; Wang, J. Spatial emission reduction effects of China’s carbon emissions trading: Quasi-natural experiments and policy spillovers. Chin. J. Popul. Resour. Environ. 2021, 19, 246–255. [Google Scholar] [CrossRef]
- Heckman, J.; Ichimura, H.; Todd, P. Matching as an Econometric Evaluation Estimator: Evidence from Evaluating a Job Training Programme. Rev. Econ. Stud. 1997, 64, 605–654. [Google Scholar] [CrossRef]
- Chen, X.; Lin, B. Towards carbon neutrality by implementing carbon emissions trading scheme: Policy evaluation in China. Energy Policy 2021, 157, 112510. [Google Scholar] [CrossRef]
- Nong, D.; Nguyen, T.; Wang, C.; Van Khuc, Q. The environmental and economic impact of the emissions trading scheme (ETS) in Vietnam. Energy Policy 2020, 140, 111362. [Google Scholar] [CrossRef]
- Cong, J.; Xu, T.; Zhang, W.; Dong, L.; Zhao, Y. Creation or crowding out? A “two-eight split” phenomenon in the employment effects of the carbon trading policy in China. J. Clean. Prod. 2023, 415, 137722. [Google Scholar] [CrossRef]
- Bergh, J.; Castro, J.; Drews, S.; Exadaktylos, F.; Foramitti, J.; Klein, F.; Konc, T.; Savin, I. Designing an effective climate-policy mix: Accounting for instrument synergy. Clim. Policy 2021, 21, 745–764. [Google Scholar] [CrossRef]
- Cao, M. A case study on China’s carbon emission trading system: Experiences and recommendations. Asia Pac. J. Environ. Law 2020, 23, 106–135. [Google Scholar] [CrossRef]
- Duan, H.; Mo, J.; Fan, Y.; Wang, S. Achieving China’s energy and climate policy targets in 2030 under multiple uncertainties. Energy Econ. 2018, 70, 45–60. [Google Scholar] [CrossRef]
- Tang, L.; Wu, J.; Yu, L.; Bao, Q. Carbon emissions trading scheme exploration in China: A multi-agent-based model. Energy Policy 2015, 81, 152–169. [Google Scholar] [CrossRef]
- Yang, X.; Jiang, P.; Pan, Y. Does China’s carbon emission trading policy have an employment double dividend and a Porter effect? Energy Policy 2020, 142, 111492. [Google Scholar] [CrossRef]
- Zhang, X.; Zheng, X. Does carbon emission trading policy induce financialization of non-financial firms? Evid. China. Energy Econ. 2024, 131, 107316. [Google Scholar] [CrossRef]
- Dong, F.; Long, R.; Yu, B.; Wang, Y.; Li, J.; Wang, Y.; Dai, Y.; Yang, Q.; Chen, H. How can China allocate CO2 reduction targets at the provincial level considering both equity and efficiency? Evidence from its Copenhagen Accord pledge. Resour. Conserv. Recycl. 2018, 130, 31–43. [Google Scholar] [CrossRef]
- Fernández-Amador, O.; Francois, J.; Oberdabernig, D.; Tomberger, P. Carbon dioxide emissions and economic growth: An assessment based on production and consumption emission inventories. Ecol. Econ. 2017, 135, 269–279. [Google Scholar] [CrossRef]
- Wang, C.; Wang, L.; Wang, W.; Xiong, Y.; Du, C. Does carbon emission trading policy promote the corporate technological innovation? Empirical evidence from China’s high-carbon industries. J. Clean. Prod. 2023, 411, 137286. [Google Scholar] [CrossRef]
- Feng, X.; Zhao, Y.; Yan, R. Does carbon emission trading policy has emission reduction effect?—An empirical study based on quasi-natural experiment method. J. Environ. Manag. 2024, 351, 119791. [Google Scholar] [CrossRef]
- Yu, Y.; Zhang, N. Environmental regulation and innovation: Evidence from China. Glob. Environ. Change 2022, 76, 102587. [Google Scholar] [CrossRef]
- Jing, Z.; Liu, Z.; Wang, T.; Zhang, X. The Impact of Environmental Regulation on Green TFP: A Quasi-Natural Experiment Based on China’s Carbon Emissions Trading Pilot Policy. Energy 2024, 306, 132357. [Google Scholar] [CrossRef]
- Wu, Q.; Tambunlertchai, K.; Pornchaiwiseskul, P. Examining the Impact and Influencing Channels of Carbon Emission Trading Pilot Markets in China. Sustainability 2021, 13, 5664. [Google Scholar] [CrossRef]
- Li, Z.; Wang, J. Spatial spillover effect of carbon emission trading on carbon emission reduction: Empirical data from pilot regions in China. Energy 2022, 251, 123906. [Google Scholar] [CrossRef]
- Zhang, W.; Li, J.; Li, G.; Guo, S. Emission reduction effect and carbon market efficiency of carbon emissions trading policy in China. Energy 2020, 196, 117117. [Google Scholar] [CrossRef]
- Zha, D.; Jiang, P.; Zhang, C.; Xia, D.; Cao, Y. Positive synergy or negative synergy: An assessment of the carbon emission reduction effect of renewable energy policy mixes on China’s power sector. Energy Policy 2023, 183, 113782. [Google Scholar] [CrossRef]
- Jia, S.; Zhu, X.; Gao, X.; Yang, X. The influence of carbon emission trading on the optimization of regional energy structure. Heliyon 2024, 10, e31706. [Google Scholar] [CrossRef]
- Du, Z.; Wang, Y. Does energy-saving and emission reduction policy affects carbon reduction performance? A quasi-experimental evidence in China. Appl. Energy 2022, 324, 119758. [Google Scholar] [CrossRef]
- Niu, Q.; Liu, C. Research on the allocation of local government attention in regional green development—Based on the text analysis of the government work report of Beijing, Tianjin and Hebei (2010–2019). J. China Exec. Leadersh. Acad. Yan’an 2020, 13, 98–106+136. (In Chinese) [Google Scholar]
- Wen, H.; Zhao, X. The allocation of government public service attention and the choice of investment direction of public financial resources -Based on the text analysis of the government work report of six provinces in central China (2007–2012). Soft Sci. 2015, 29, 5–9. (In Chinese) [Google Scholar]
- Chen, Y.; Chen, X. Green Finance Evaluation System in The Time-sharing Zone Based on Entropy Right Method. In Proceedings of the 2024 International Conference on Economic Data Analytics and Artificial Intelligence, Guangzhou, China, 8–10 November 2024. [Google Scholar]
- Liu, H.-K.; He, C. Mechanisms and empirical testing of how green finance promotes high-quality urban economic development: Evidence from 272 prefecture-level cities in China. Investig. Res. 2021, 40, 37–52. [Google Scholar]
- Xu, J.; Chen, F.; Zhang, W.; Liu, Y.; Li, T. Analysis of the Carbon Emission Reduction Effect of Fintech and the Transmission Channel of Green Finance. Financ. Res. Lett. 2023, 56, 104127. [Google Scholar] [CrossRef]
- Yuan, H.; Zhu, C. Has the National High-tech Zone promoted the transformation and upgrading of China’s industrial structure. China Ind. Econ. 2018, 8, 60–77. (In Chinese) [Google Scholar]
- Chen, Z.; Chen, Z.; Gui, L. The impact of green finance development on carbon emissions in 253 prefecture level cities in China: A spatial econometric model test. Sci. Technol. Manag. Res. 2024, 44, 218–226. (In Chinese) [Google Scholar]
- Lin, X.; Zhao, Y.; Ahmad, M.; Ahmed, Z.; Rjoub, H.; Adebayo, T.S. Linking innovative human capital, economic growth, and CO2 emissions: An empirical study based on Chinese provincial panel data. Int. J. Environ. Res. Public Health 2021, 18, 8503. [Google Scholar] [CrossRef]
- Gu, X.; Han, L. Marketization process and technology spillover effect of foreign direct investment. Res. Manag. 2018, 39, 150–158. (In Chinese) [Google Scholar]
- Egami, N.; Yamauchi, S. Using multiple pretreatment periods to improve difference-in-differences and staggered adoption designs. Political Anal. 2023, 31, 195–212. [Google Scholar] [CrossRef]
- MacKinnon, D.; Warsi, G.; Dwyer, J. A simulation study of mediated effect measures. Multivar. Behav. Res. 1995, 30, 41–62. [Google Scholar] [CrossRef]
- Cui, J.; Wang, C.; Zhang, J.; Zheng, Y. The effectiveness of China’s regional carbon market pilots in reducing firm emissions. Proc. Natl. Acad. Sci. USA 2021, 118, e2109912118. [Google Scholar] [CrossRef]
- Yuan, X.; Jin, S.; Zhang, H. Optimal Green Technology Choice for Firms under an Emission Trading Scheme: End-of-Pipe vs. Cleaner Production. Sustainability 2023, 15, 16311. [Google Scholar] [CrossRef]
- Guo, X.; Zhang, Y. How do companies with different life cycles respond to carbon trading?—Analysis of the moderating role of government subsidies. Front. Environ. Sci. 2024, 12, 1320039. [Google Scholar] [CrossRef]
Disclaimer/Publisher’s Note: The statements, opinions and data contained in all publications are solely those of the individual author(s) and contributor(s) and not of MDPI and/or the editor(s). MDPI and/or the editor(s) disclaim responsibility for any injury to people or property resulting from any ideas, methods, instructions or products referred to in the content. |
© 2025 by the authors. Licensee MDPI, Basel, Switzerland. This article is an open access article distributed under the terms and conditions of the Creative Commons Attribution (CC BY) license (https://creativecommons.org/licenses/by/4.0/).