1. Introduction
Around the world, many countries are working to create more jobs for their citizens. A common strategy is to encourage startups, which is also important for long-term economic growth [
1,
2]. The Korean government has established a government-only organization, the Ministry of Small and Medium Business Ventures, to provide administrative and financial support to venture companies to reduce the risks associated with startups. As a result, compared to 2018, Koreans’ interest in startups increased by 2.1% in 2019 [
3]. The Korean government has also expressed interest in startups founded by college students, establishing and implementing the ‘Five-Year Plan for University Startup Education’ in 2013, the ‘Innovation Startup Boom Creation Plan’ to create jobs in 2018, and the ‘Campus Innovation Park Creation Leading Youth Startup and Innovative Growth’ in 2019′. The university has also endeavored to establish startup-related courses in the regular curriculum, operate startup incubators for university students, and support students’ startup club activities [
4].
It is not easy for college students to start a business immediately after graduation, but if they have entrepreneurial intentions (EIs), it can be expected that they will be able to start a business in the future. Since EI is a sign of startup possibility [
5] and a good predictor of startup [
6,
7], it has attracted the attention of academia and policy makers for years [
6,
8,
9]. EI can be motivated by the provision of appropriate opportunities [
10,
11], and the stronger the EI, the greater the possibility of startup success [
12]. According to a previous meta-analysis, EI explains approximately 28% of startup behavior [
13]. Since cognition and emotion are antecedent variables of behavior, EI can be seen as antecedent variables of startup behavior.
EI is defined as the desire to own one’s own business or start a new business [
14], judgment regarding the possibility of owning one’s own business [
15], willingness to invest effort in corporate activities [
16], the desire to start a business [
17], and a startup plan [
18]. In this way, the intention to start a business includes the will, hope, and preparation to do so in the future, contingent on certain conditions [
7,
19]. College students’ intention to start a business can be used to predict the startup behavior of future generations [
20], providing insights as to their likelihood of conducting a business in the future.
Since EI is one of the variables that affects future startups [
17], many researchers have expressed interest in the factors influencing EI. Various theories have been presented, with a particular focus on the startup environment and the psychological characteristics of founders. In developing countries, environmental factors such as the social culture and political system have a greater influence on startups than in developed countries [
21]. For example, the influence of social ecosystem factors such as government financial support, government policies and regulations, cultural factors, and education level is significant [
22]. Among the psychological characteristics that influence EI, personality, self-efficacy, self-satisfaction, business experience, creativity, adventurousness, educational experience, sex [
23,
24], entrepreneurial attitude (EA) [
25,
26,
27], and entrepreneurship (ES) [
26] receive the most attention, with the founder’s entrepreneurial self-efficacy (ESE) and EA being of particular interest. ESE has more influence than social ecosystem factors [
22], consistently and strongly predicting a successful startup as a cognitive antecedent factor of EI [
28,
29,
30,
31,
32]. ESE is defined as self-confidence in startup ability [
33], belief that you can successfully start a business [
34,
35], and belief that you have business aptitude and competency [
36]. In this study, the ESE is defined as the self-confidence that you can lead a startup successfully.
EA has received as much attention as ESE as a variable that affects EI [
26,
27,
37,
38,
39]. EA is defined as entrepreneurial taste [
40], the degree of love for starting a business [
41], judgment regarding the benefits of starting a business [
42], the amount of charm you feel about starting a business [
43], and the degree of satisfaction in starting a business [
44]. EA is sometimes regarded as a leading variable of EI, a result variable of ESE, and a mediating variable of ESE and EI, depending on the researcher [
25,
31,
45,
46]. ESE [
47,
48,
49,
50] and EA [
51,
52] have been confirmed to have a positive relationship with EI. However, it is difficult to find a study that directly confirms which of the two variables is more influential.
ES is another psychological characteristic that may be of interest when it comes to starting a business. ES is defined as an entrepreneurial tendency to take risks and be progressive and innovative [
53,
54], entrepreneurial talent or competence that enables innovative activities [
55], entrepreneurial behavior that promotes creativity and flexibility [
56], and a challenging spirit that captures and pursues business opportunities through risk-taking, innovation, and initiative [
57]. Several studies have highlighted a positive relationship between ES and EI [
58,
59,
60,
61,
62,
63]. ES is a key competency in developing a country’s economy [
64,
65,
66,
67,
68,
69,
70,
71] and promotes individual and social innovation [
19,
67,
72,
73], as it is a source of employment and wealth [
27]. ES is also closely related to EI. Markman and Baron [
74] (2002) viewed ES as an important factor of startup in their study applying the person–ES fit (P-ENT fit). However, very few studies have empirically confirmed the relationship between ES and EI.
As stated above, ESE, EA, and ES are important individual psychological variables that significantly influence EI. Each of these three variables is expected to directly affect EI, and ESE and ES are also expected to affect EA. The results of an empirical study show that there is a positive correlation between ES and EA [
75,
76] and between ESE and EA, with [
25,
46,
77] supporting this. ES and ESE are conceptually related, but it is not clear which is the preceding variable. Therefore, in this study, these two variables were considered as independent variables, with EA mediating the relationship between the two independent variables and EI. In addition, this relationship was different between students who had experience taking startup-related university courses and those who did not. In a university setting, entrepreneurship education (EE) often aims to develop attitudes, behaviors, and abilities that will be beneficial for entrepreneurs [
78]. The goals and content of EE vary, but EI, ESE, and EA are common themes of such courses [
25,
79,
80,
81], and other ES-related qualities [
82] may also be included. In this regard, the relationship between these variables is likely to differ depending on whether college students take a startup-related course. Therefore, the purpose of this study was to determine how ES and ESE affect EA and EI, respectively, whether EA has a mediating effect in this relationship, and whether the relationships differ depending on whether college students take a startup-related course. We have not yet found a study that confirms the relationship between the four variables. The results of this study will provide useful information on which psychological variables the university authorities should focus and provide EE on to increase the EI of college students. Our research will also help us to determine whether EE increases EI among college students.
This thesis consists of eight chapters.
Section 1 is the introduction, which outlines the definitions of the four key variables in this study.
Section 2 introduces the theory of EI.
Section 3 presents the research model, and
Section 4 describes the research methodology, including sampling, the measurement instruments, measurement model validation and structural model validation, analyzing structural equation modeling (SEM) for hypothesis testing, convergent validity and discriminant validity, model fit indices for both the measurement and structural models, verifying common method bias, checking measurement instrument reliability, assessing normality of the data through skewness and kurtosis, and examining linearity among the variables through the Pearson correlation coefficient. Both mediating and moderating effects were analyzed, and the bootstrap method was used. To test the moderating effects, the prerequisite conditions—measurement invariance of the measurement model and structural invariance of the structural model—were each assessed.
Section 5 presents the results of the study, including the outcomes of hypothesis testing, direct and indirect effects, differences in path coefficients, and the results of mediation and moderation analyses.
Section 6 discusses the findings,
Section 7 presents conclusions and suggestions, and
Section 8 outlines the limitations of the study.
The definitions of the key concepts in this study are summarized in
Table 1.
2. Theory of EI
The theories that explain the intention to start a business include Ajzen’s [
83,
84] Theory of Planned Behavior (TPB), Perugini and Bagozzi’s [
85] Model of Goal-Directed Behavior (MGB), Bird’s [
14] Entrepreneurial Intention Model (EIM), Shapero and Sokol [
86]’s Entrepreneurial Event Model (EEM), and the Model of Entrepreneurial Intention (MEI) created by Lüthje and Franke [
87]. The TPB applies Ajzen and Fishbein’s [
88,
89] Theory of Reasonable Action (TRA) to EI. TPB is the most well-researched theory regarding EI. The TRA is the application of the expectation–value theory, which is a motivational theory created by Ajzen and Fishbein [
88,
89]. According to the expectation–value theory, when an action is taken, it is more likely to succeed, and the greater the value (benefit) gained from it, the higher the likelihood of the action. Ajzen’s [
83,
84] TPB theory states that a person sees their own behavior as correct or positive (attitude) or that people around them are more likely to emulate said behavior (subjective norm). Human behavior is a response to stimuli or a planned behavior [
90], and startup behavior is a planned behavior [
17]. For intention to lead to action, various situational and contextual constraints must be resolved; to overcome these constraints, an element called perceived behavioral control was added to the TRA. This element refers to the fact that humans are more likely to act when they feel that they are in control of their behavior. In short, three factors influence the intention of action: attitude toward one’s behavior, the subjective norm one perceives, and a sense of control over one’s behavior. Substituting this perspective into EI means that EI or entrepreneurial behavior occurs when the person involved, and others around them, consider startup behavior to be positive and have faith in their ability to start their own business [
83,
84]. TPB adds a sense of behavioral control to the TRA element; this is referred to as ESE.
In the MGB of Perugini and Baggozzi [
85], in addition to the TPB, social norms, perceived behavioral control, emotional, aspiration-related, and experience-related factors also affect EI. Here, aspiration refers to an intense desire to reach a target [
85], and startup aspiration refers to a desire to become a founder. In this respect, the MGB theory can be interpreted as viewing EA as valuable. EIM explains that EI is influenced by personal and environmental factors. Personal factors include the entrepreneur’s previous experience, personality characteristics, ability, etc., whereas environmental factors include market change and government deregulation. An individual who intends to start a business considers these various conditions reasonably, analytically, intuitively, and entirely [
14]. In this study, ES is one of the individual characteristics of EIM.
According to the EEM, EI is determined by an individual’s perceived desirability, feasibility, and propensity to act. Perceived desirability refers to the attractiveness of starting a business; perceived feasibility refers to the belief that one can start a business; and the propensity to act refers to the ability to act at one’s will [
86], which means controlling something by oneself [
17]. Additionally, according to the EEM, human behavior does not change for the better until an event occurs that replaces or interferes with said behavior. Experiencing certain events, such as unemployment or divorce, or even positive events such as receiving an inheritance or a lottery win, can stimulate EI or starting a business. In this regard, the EEM adds individuals’ life events to the motivation to start a business and incorporates aspects of various other theories: the social desirability of starting a business cited by the TRA; TPB’s sense of self-control; MGB’s desire to start a business; and EIM’s personal characteristics and environmental factors.
According to the MEI, personality characteristics and situational factors influence EI. These personality characteristics include risk sensitivity and internal locus of control, and EA is a mediator. Situational factors may encompass positive aspects such as external support or negative aspects such as barriers [
87]. The MEI also emphasizes the individual characteristics of the EIM, similarly to the MGB’s view of startup aspiration as an important factor; as part of this theory, characteristics such as risk sensitivity and the internal locus of control are emphasized, and EA is also considered. In summary, the theory of EI posits that the main factors that influence EI are personal characteristics such as personality, self-perception of entrepreneurial activities and others’ perceptions of startups, startup aspiration, startup ability, startup conditions, startup opportunities, etc. The most discussed factor is as a sense of startup ability, which has the same meaning as the ESE in this study. Among the three factors influencing EI setting in this study, ES includes risk-taking as an individual characteristic; it is based on the MEI, which emphasizes personality characteristics. ESE is based on TPB, which emphasizes self-control, and EEM, which emphasizes feasibility. EA is based on EEM, which emphasizes the attractiveness of startups, and the MEI theory that EA has a mediating effect when individual characteristics or situational factors influence EI.
4. Research Methodology
4.1. Research Subjects and Measurement Tools
This research was carried out using a quantitative methodology grounded in a deductive approach. The survey subjects were 415 students enrolled in three four-year universities, KH, KR, and HY, located in Seoul, Korea. This study is not a study that is subject to preliminary deliberation by each institution’s Institutional Review Board (IRB) stipulated by Korea’s Bioethics and Safety Act because the study was conducted online without a face-to-face survey and anonymous surveys were conducted so that it was not possible to know who the respondents were (See Institutional Review Board Statement). Respondents to the survey were notified of the following. The results of the survey are not used for any purpose other than research purposes. The researcher would appreciate it if their could respond honestly to the questionnaire and asked to respond only to those who agree to the questionnaire. The estimated response time is around 4 min. Their responses are valuable data for this study. Responses are confidential.
Instead of a researcher, one faculty member from each of the three universities visited several major departments and conducted a survey. The faculty gave students the URL address created by the smartphone survey application through a messenger and asked them to respond. The survey period was about 5 days from 7 October 2022.
Table 2 shows the demographic composition ratio of the samples. In total, 415 college students agreed to participate in the survey, including 163 men (39.3%) and 252 women (60.7%). Of the participants, 47 (11.40%) were in their first year, 74 (18%) were in their second year, 148 (35.9%) were in their third year, and 143 (34.7%) were in their fourth year of university. Three women did not respond to what grade they were in. Of the respondents, 230 students (55.4%) reported that they had taken startup-related courses, whereas 185 (44.6%) had not. Among the students’ major fields, 124 (29.9%) were humanities students, 37 (8.9%) were natural science students, 92 (22.2%) were engineering students, 84 (20.2%) were social science students, 28 (6.7%) were art students, and 10 (2.4%) were other students.
The ES scale was based on research by Lee [
76]. Lee’s scale [
76] was reconstructed with expert advice, referring to the work of McClelland [
55], Miller [
138], Covin and Slevin [
139], Kang [
33], Go [
140], and Yoon [
141]. This scale is based on risk-taking factor (including responses such as, e.g., I do it even if I take some risk if I have to do it); initiative factor (e.g., I do not think I should miss the timing of anything, so I push ahead once I make up my mind); and innovation factor (I have no fear of new challenges). The risk-taking factor consists of 12 questions, which refer to participants’ likelihood of responding boldly to uncertain situations. The initiative factor refers to the future-oriented tendency to make new strategic decisions and is composed of four questions. The innovation factor refers to the efforts made to constantly come up with ideas and is composed of four questions. Each question is rated using a 5-point Likert scale, with scores ranging from 1 to 5 (See
Appendix A).
The entrepreneurial self-efficiency (ESE) scale was used by Lim [
142]. Lim [
142] developed Wilson, Kickul, and Marlino’s [
143] tool for measuring ESE to be applied to college students. This scale measures the strength of one’s belief that one can successfully perform the roles and tasks required of an entrepreneur. There are no sub-factors, and a total of 6 questions (e.g., if I start a business, I am confident in solving the problem that occurs at that time). Each question is rated using a 5-point Likert scale, with scores ranging from 1 to 5. This scale measures problem-solving, decision-making, money management, creativity, interpersonal relationships, and leadership from an entrepreneurial perspective. Since the subjects of this study were college students, the questions were modified slightly to apply to a hypothetical future startup rather than an existing business. Each question is rated using a 5-point Likert scale, with scores ranging from 1 to 5 (See
Appendix A).
The EA scale measures subjective psychology and emotions regarding whether one likes or dislikes the idea of starting a business, and Lee and Jung [
144] modified it by referring to the work of Taylor and Todd [
145]. Some inappropriate expressions were corrected, and sub-factors were removed. The scale comprises three questions: (1) I think positively about starting a business. (2) I think favorably and positively about starting a business, and (3) I like starting a business. Each question is rated using a 5-point Likert scale, with scores ranging from 1 to 5 (See
Appendix A).
The EI scale adapted by Kim [
146] from six items originally developed by Liñán and Chen [
109] was used. This scale defines EI as the process of leading a company and is composed of 6 statements: (1) I am ready to do anything to become an entrepreneur. (2) My goal for a job is to become an entrepreneur. (3) I will make every effort to start a business and operate it. (4) I will start a business if I have a chance in the future. (5) I am very serious about thinking of starting a business. (6) I am willing to establish a company someday. Each question is rated using a 5-point Likert scale, with scores ranging from 1 to 5 (See
Appendix A).
The reliability and convergence validity of each scale were calculated. The reliability was confirmed by Cronbach’s α coefficient, and the convergence validity was confirmed by composite reliability (CR) and average variable extracted (AVE). AVE values are calculated as the ratio of the sum of the squared factor loadings to the number of items and are indicative of communality. Higher AVE values indicate that the associated construct accounts for the greater variation in its corresponding items. The EA scale was used as a measurement variable based on the average of the items because the number of items was insufficient; as such, the AVE was only calculated for the remaining 3 variables. The results are shown in
Table 3. The Cronbach’s α coefficient of the four scales is distributed between 0.688 and 0.939; the CR of the three scales is distributed between 0.781 and 0.922; and the AVE is distributed between 0.781 and 0.992. In general, Cronbach’s α coefficient is considered suitable if it is 0.60 or higher; CR is suitable if it is 0.70 or higher, and the AVE must be 0.50 or higher to be deemed suitable.
4.2. Processing of Data
There were no missing values in the collected data, and the mediating effect and the moderating effect were analyzed by evaluating the structural equation model via SPSS 26 and AMOS 26 programs. The maximum likelihood method was used to estimate the parameter, and the mediating effect was verified using a bootstrap method. At this time, the sample had 2000 restoration extractions, and the statistical significance was verified using the bias-corrected percentile interval method; the confidence interval was 95%. We also determined whether there was a statistically significant difference between the standardized path coefficients.
4.3. Common Method Bias Verification
Since all four scales used in this study were 5-point Likert scales and were measured simultaneously, we were able to confirm whether a common method bias occurred. To this end, we verified whether there was a significant difference between the χ
2 values of the measurement model when the common method factor was constructed and between the χ
2 values of the measurement model when no common method factor was used. At this time, if there was a meaningful difference, it was considered that the same method bias was present [
147]. As a result, the χ
2 value of the measurement model without a common method factor was 51.157, and the degree of freedom was 23, whereas when the common method factor was used, the χ
2 value was 61.099, and the degree of freedom was 24. The common method had an effect because the ∆χ
2 = 9.942, which was larger than the threshold of 3.84 (
p < 0.05) of the significant χ
2 value when Δ
df = 1. The difference in the standardization coefficient between the two models (es1 and es2) was 0.20 or more, and these two measures were considered as having common method bias. Therefore, as a result of reanalysis achieved by connecting covariance between these two measurements, the χ
2 value of the measurement model was 47.655 and
df = 23. It was found to be suitable because it was Δχ
2 = 3.502 (51.157–47.655) and did not exceed the χ
2 threshold of 3.84 when Δ
df = 1. Therefore, in the subsequent analysis, the measurement model and the structural model were verified with the models with covariance connection. But, when Harman’s single factor method was used to check whether the common method bias was confirmed by fixing the number of factors to 1 for 21 measurements and performing principal component analysis without factor rotation, the variance ratio of the factors with the largest factor load was 45.873%, which did not exceed 50%, indicating that there was no common method bias.
4.4. Verification of the Measurement Model
In this study, a two-step method of measurement model verification and structural model verification was used to analyze the structural equation model [
148]. The convergence validity and discriminant validity (DV) were verified. As shown in
Table 1, the CR and AVE were found to be suitable. To determine whether measurement independence was guaranteed between the three scales of ESE, EA, and EI, the Fornell–Larker [
149] method and the HTMT method were used to verify DV. For a scale involving many measurement items, the items were combined into several indicators using a random number generator app to optimize the number of measurement variables suitable for the structural equation model (item parceling).
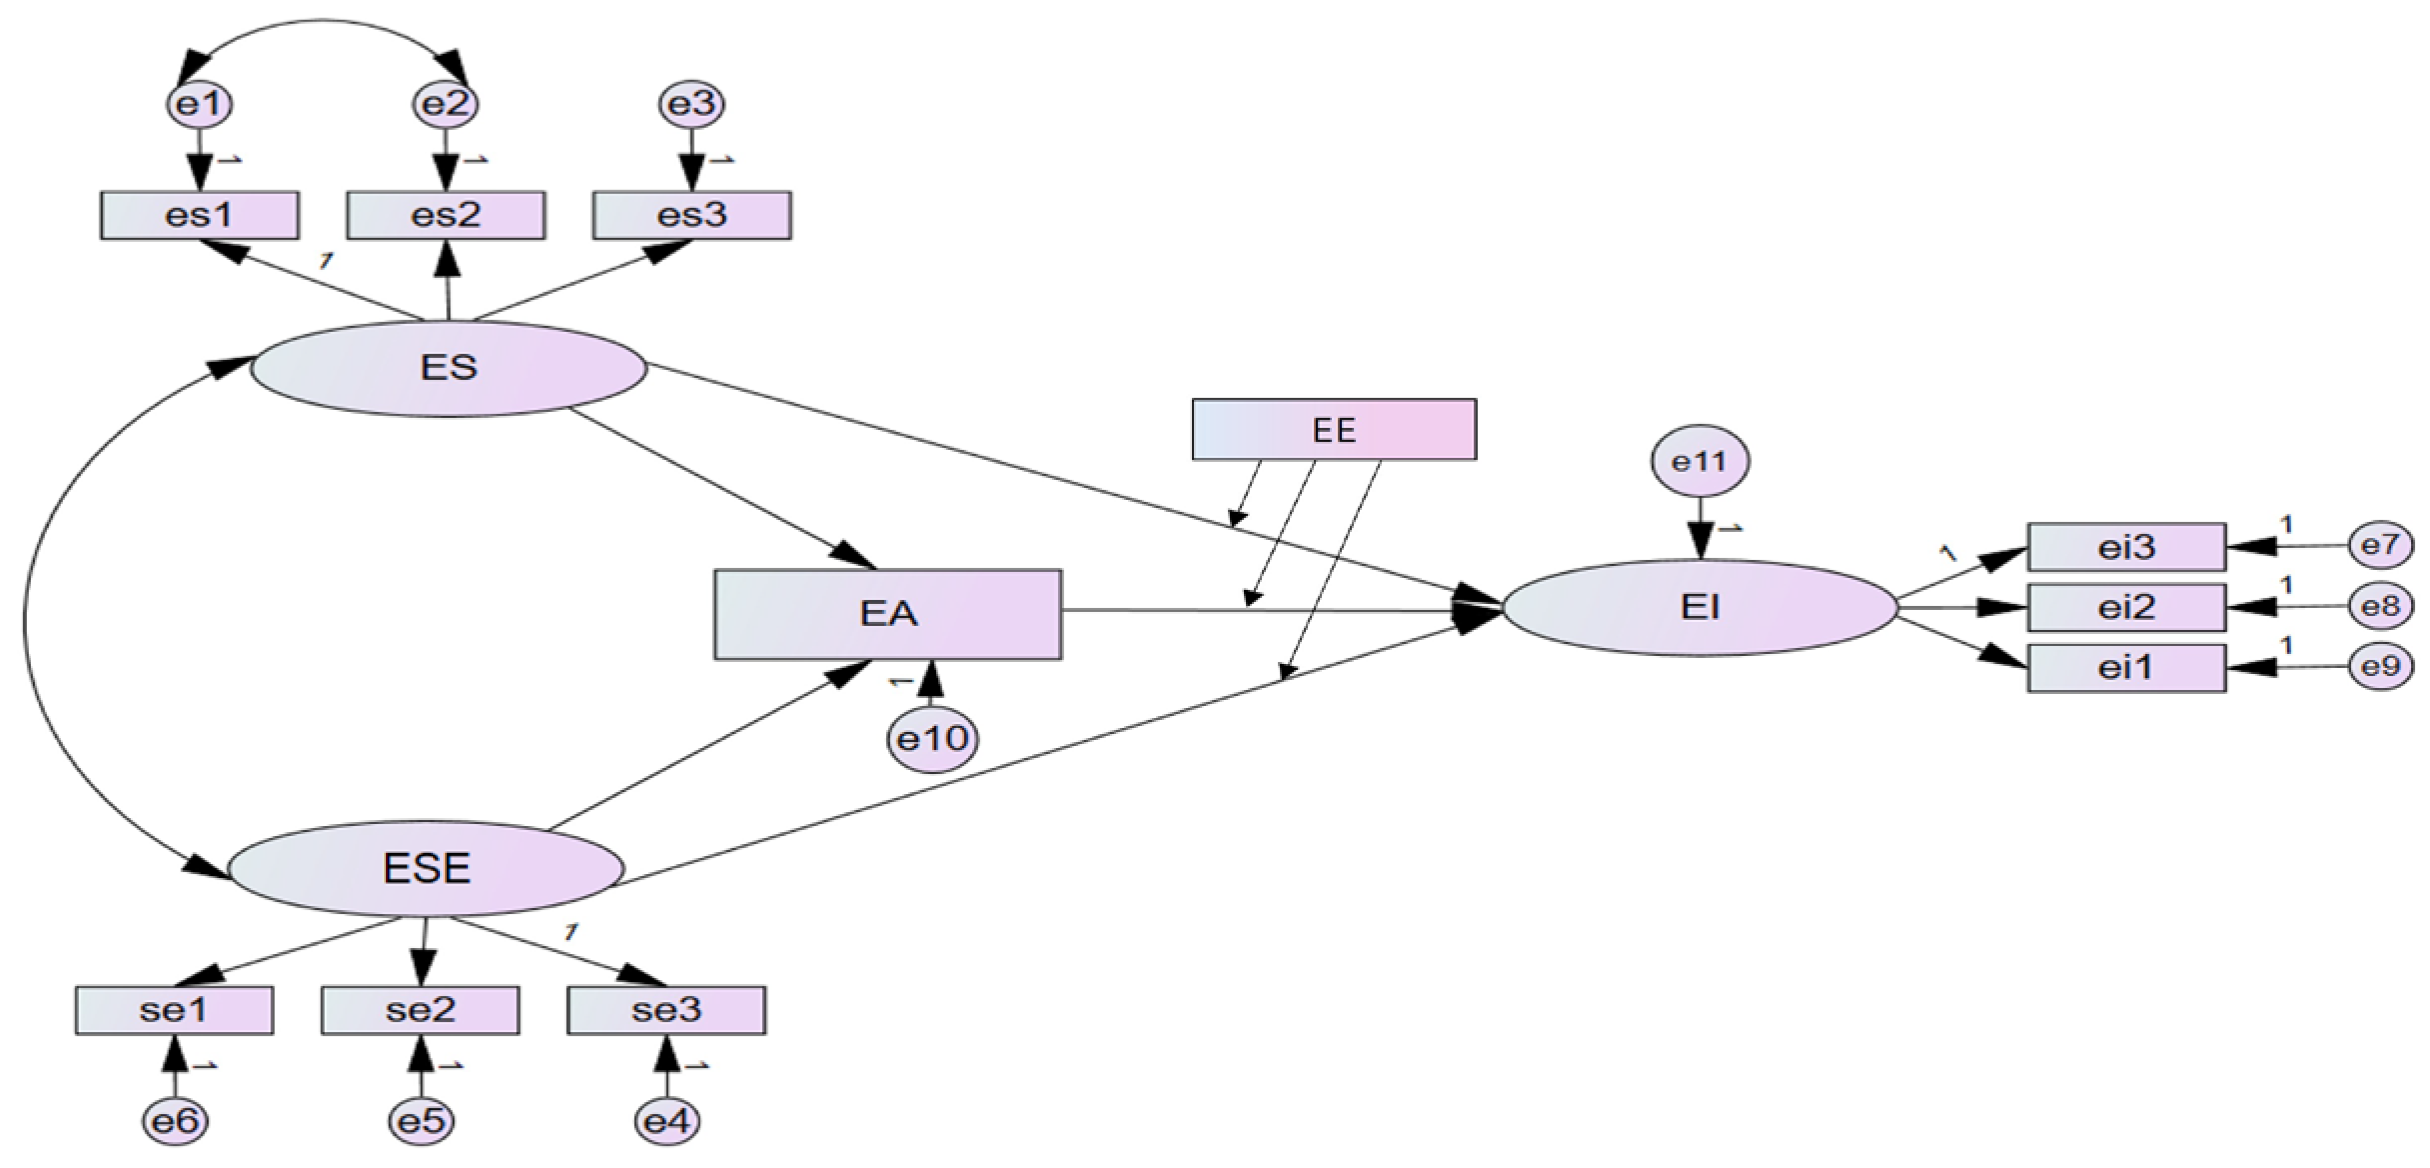
The 12 items on the ES scale were grouped into 3 items, including es1 (No. 1, 2, 3, and 4), es2 (5, 6, 7, and 8), and es3 (9, 10, 11, and 12), and the 6 items on the ESE scale were also grouped into 3 items: se1 (No. 1 and 3), se2 (6 and 4), and se3 (No. 2 and 5). The EA scale comprised three items, so the average was calculated and used as a measurement, and the six items on the EI scale were grouped into three items: ei1 (4 and No. 1), ei2 (6 and No. 2), and ei3 (No. 3 and No. 5). For the three scales, excluding the EA scale, the measurement model fit was analyzed using the confirmatory factor analysis method.
The factor load of the three measurement variables of the latent variable ES scale is 72 to 88, the factor load of the three measurement variables of the ESE scale is 80 to 91, and the factor load of the three measurement variables of the EI scale is 0.92 to 93, which is statistically significant (p < 0.001).
Since the fitness index is affected by the size of the sample, the number of measurement variables, and the complexity of the model [
150], we performed the calculations using fitness indexes which are unaffected by these factors [
151,
152]. The Tucker–Lewis index (TLI) = 0.955, a value of 0.95 or more [
153]; the standardized root mean square residual (SRMR) = 0.018; and the root mean square error approximation (RMSEA) = 0.051. The SRMR was used as a standardization of the RMR, and a score of 0.08 or less is deemed suitable, whereas for the RMSEA, a score of 0.05 or less is suitable [
153,
154]. Since the RMSEA value was estimated based on sample data, errors may have occurred, which can only be found through the estimation interval. A wide confidence interval means that the error in the value of RMSEA is large [
149]. The confidence interval of 90% of the RMSEA value in this model was 0.03~0.071. As the SRMR and TLI values were very good, this measurement model was deemed suitable.
DV was examined using the Fornell–Larcker [
149] method and cross-loadings. If the AVE value is greater than the squared value of the correlation coefficient between latent variables, it is considered to have DV [
149]. For cross-loadings, an item’s cross-loadings on other constructs should be less than its factor loadings on corresponding constructs to demonstrate that the items are successfully captured by their constructs and to highlight significant distinctions between the constructs [
155].
As shown in
Table 4, the AVE of the ES scale is 0.633, and the square of the correlation coefficient between the two corresponding variables is 0.679 and 596. The AVE of the ESE scale is 0.727, and the square of the correlation coefficient between the two corresponding variables is 0.679 and 0.663. The AVE of the EI scale is 0.856, and the square of the correlation coefficient between the two corresponding variables is 0.596 and 0.663. The ESE scale and the EI scale were of particular interest because the square of the correlation coefficient between the corresponding scales was smaller than the AVE value of the two scales. However, for the ES scale and the ESE scale, the AVE was smaller than the square of the correlation coefficient between the corresponding scales.
To confirm the discrimination validity between ES and ESE, the heterotrait-to-monotrait (HTMT) ratio was obtained.
Table 5 shows the correlation coefficient matrix between the ES scale and the ESE scale measurements. The average heterotrait correlation between ES and ESE was 0.554, the average monotrait correlation of ES was 0.656, and the average monotrait correlation of ESE was 0.730. Therefore, the HTMT ratio was calculated as (0.554/√ (0.656 × 0.730) = 0.80. If this ratio is less than 0.90, there is discrimination between the two scales [
156]. As such, when the HTMT method was utilized, it revealed discrimination between the ES and ESE scales. Taken together, these results reveal a clear separation between the three scales.
4.5. Normality and Linearity of Measurement Score Distribution
In order to find out the normal distribution of the measurements, kurtosis and skewness were calculated, and in order to see the linear relationship between the measurements, the product–moment correlation coefficient was calculated. In addition, the factor loadings of the measurement variables for the ES, ESE, and EI latent variables were calculated, and the results are shown in
Table 6. The absolute value of skewness is between 0.05 and 0.91, which does not exceed the absolute value of 2, and the absolute value of kurtosis is between 0.05 and 0.44, which does not exceed the absolute value of 4 (based on the SPSS program), so it can be said that all measurements are normally distributed.
The correlation coefficients between the measured values of each scale were at least r = 0.40 and at most r = 0.75, and they were all statistically significant (p < 0.01), indicating that the measured values were in a linear relationship with each other.
The correlation coefficients between the measured variables were at least r = 0.40 and at most r = 0.76, and all correlation coefficients showed positive correlations and were statistically significant (p < 0.01). The factor values at which the four latent variables explain each measurement are at least 0.72, with a maximum of 0.93. In general, 0.7 or higher is considered good. For the correlation coefficient values, ** indicates that the probability of correlation between the two variables is more than 95%, given the standard error of the sample, and for the factor coefficient, *** means that the probability of the latent variable explaining each measurement is more than 99% given the standard error of the sample.
4.6. Verification of Configural Invariance and Metric Invariance
We investigated whether there was a difference in the standardization coefficient of the latent variable between the group with experience (EL) and the group without (NEL), in regard to who took a startup-related course. Prior to the multi-group analysis, metric invariance and configural invariance were verified to ascertain whether the factor structures were the same between groups.
Table 7 shows the results of the following model analysis, which equally constrained all paths except for a path fixed as one between the latent variable and the measurement variable in the measurement model and the structural model. As a result of the metric invariance verification, the comparative fit index (CFI) and TLI were 0.985 and 0.979, respectively, exceeding 0.95, and the SRMR and RMA were 0.024 and 0.044, respectively, which was less than 0.05. As a result of the configural invariance verification, the CFI and TLI were 0.980 and 0.971, respectively, exceeding 0.95, and the SRMR and RMA were 0.024 and 0.048, respectively, which was less than 0.05. The goodness-of-fit index is an index that mathematically determines whether the collected data are suitable for explaining the relationship between the variables of the model constructed by the researcher. The CFI is a type of relative goodness-of-fit index that can be determined through comparison, and it evaluates how well the case with a model explains the collected data compared to the case without a model. It is like the R-squared value, which is the explanatory power of regression analysis. The larger the value, the more suitable it is. In general, if the value is 0.9 or higher, it is considered good. The TLI is also a relative goodness-of-fit index. Like the CFI, this index is calculated by comparing cases with and without the model. Because the TLI is not affected by model complexity it is a better fit index than the CFI. The SRMR, an absolute goodness-of-fit index, is used as a standardized measurement unit to prevent a larger value between variables when calculating the RMR. The absolute goodness-of-fit index is a value obtained by calculating the ratio of the degree to which the research model constructed by the researcher cannot explain the data collected. Therefore, the smaller this value, the better the model is. In general, if the value is less than 0.08, it is considered good. The RMA is another type of absolute fitness index; like the RMR, it calculates the ratio at which the model cannot explain data. In general, if it is in the range of 0.05 to 0.08, the model is considered acceptable. The RMA has the advantage of being unaffected by model complexity and is more suitable for larger samples. However, if the model is simple or the sample size is small, this value tends to be larger; thus, it is recommended that it be considered with a relative index such as the CFI.
The factor load of the metric invariance model was 0.65~0.91, which was statistically significant (p < 0.001), and the standard error was small at 0.03~0.05. The factor load of the configural invariance model was 0.654~0.908, which was statistically significant, and the standard error was small at 0.30~0.077. The two models showed full metric invariance and full configural invariance.
7. Conclusions and Suggestions
Our research results and discussion are summarized and concluded as follows. First, it is necessary to improve the EI of Korean college students. To achieve this, university authorities must provide students with a more strategic and systematic startup education. Secondly, ES (risk-taking, initiative, and adventurousness), EA, and ESE are important psychological characteristics that positively contributed to college students’ EIs. These three variables explain approximately 73% of an individual’s EI. Of these factors, founder self-efficacy has the strongest influence. The results of this study are consistent with the most common theories about the factors affecting various EIs. In this respect, when providing startup education in university settings, it is necessary to focus on improving ESE. Thirdly, the impact of ESE on EI is relatively more significant than that of EA or ES. Therefore, it is recommended that startup education should focus on competencies such as startup knowledge and startup skills that can affect ESE. In this respect, ESE will contribute to the sustainability of college students’ EI, and college students’ EI will contribute to the sustainability of their business startup.
In the future, we recommend that researchers focus on the following considerations. Firstly, since sampling in this study was conducted at the university level, the collected data are multi-layered. Therefore, we recommend that researchers use a multilevel model analysis or structural equation model analysis, controlling multilevel model conditions. Secondly, as this study focused on individual characteristic factors that have a relatively large influence on EI, based on the results of previous studies, we recommend including socio-ecological factors that influence EI (family economic conditions, government policies, systems, support, startup funds, etc.) to reveal a wider range of influencing factors.


