
A Comprehensive Identification, Distribution and Health Risk Assessment of Microplastics in Natural Mussels from the Shoreline of the Sea of Marmara, Türkiye


Abstract

1. Introduction
2. Materials and Methods
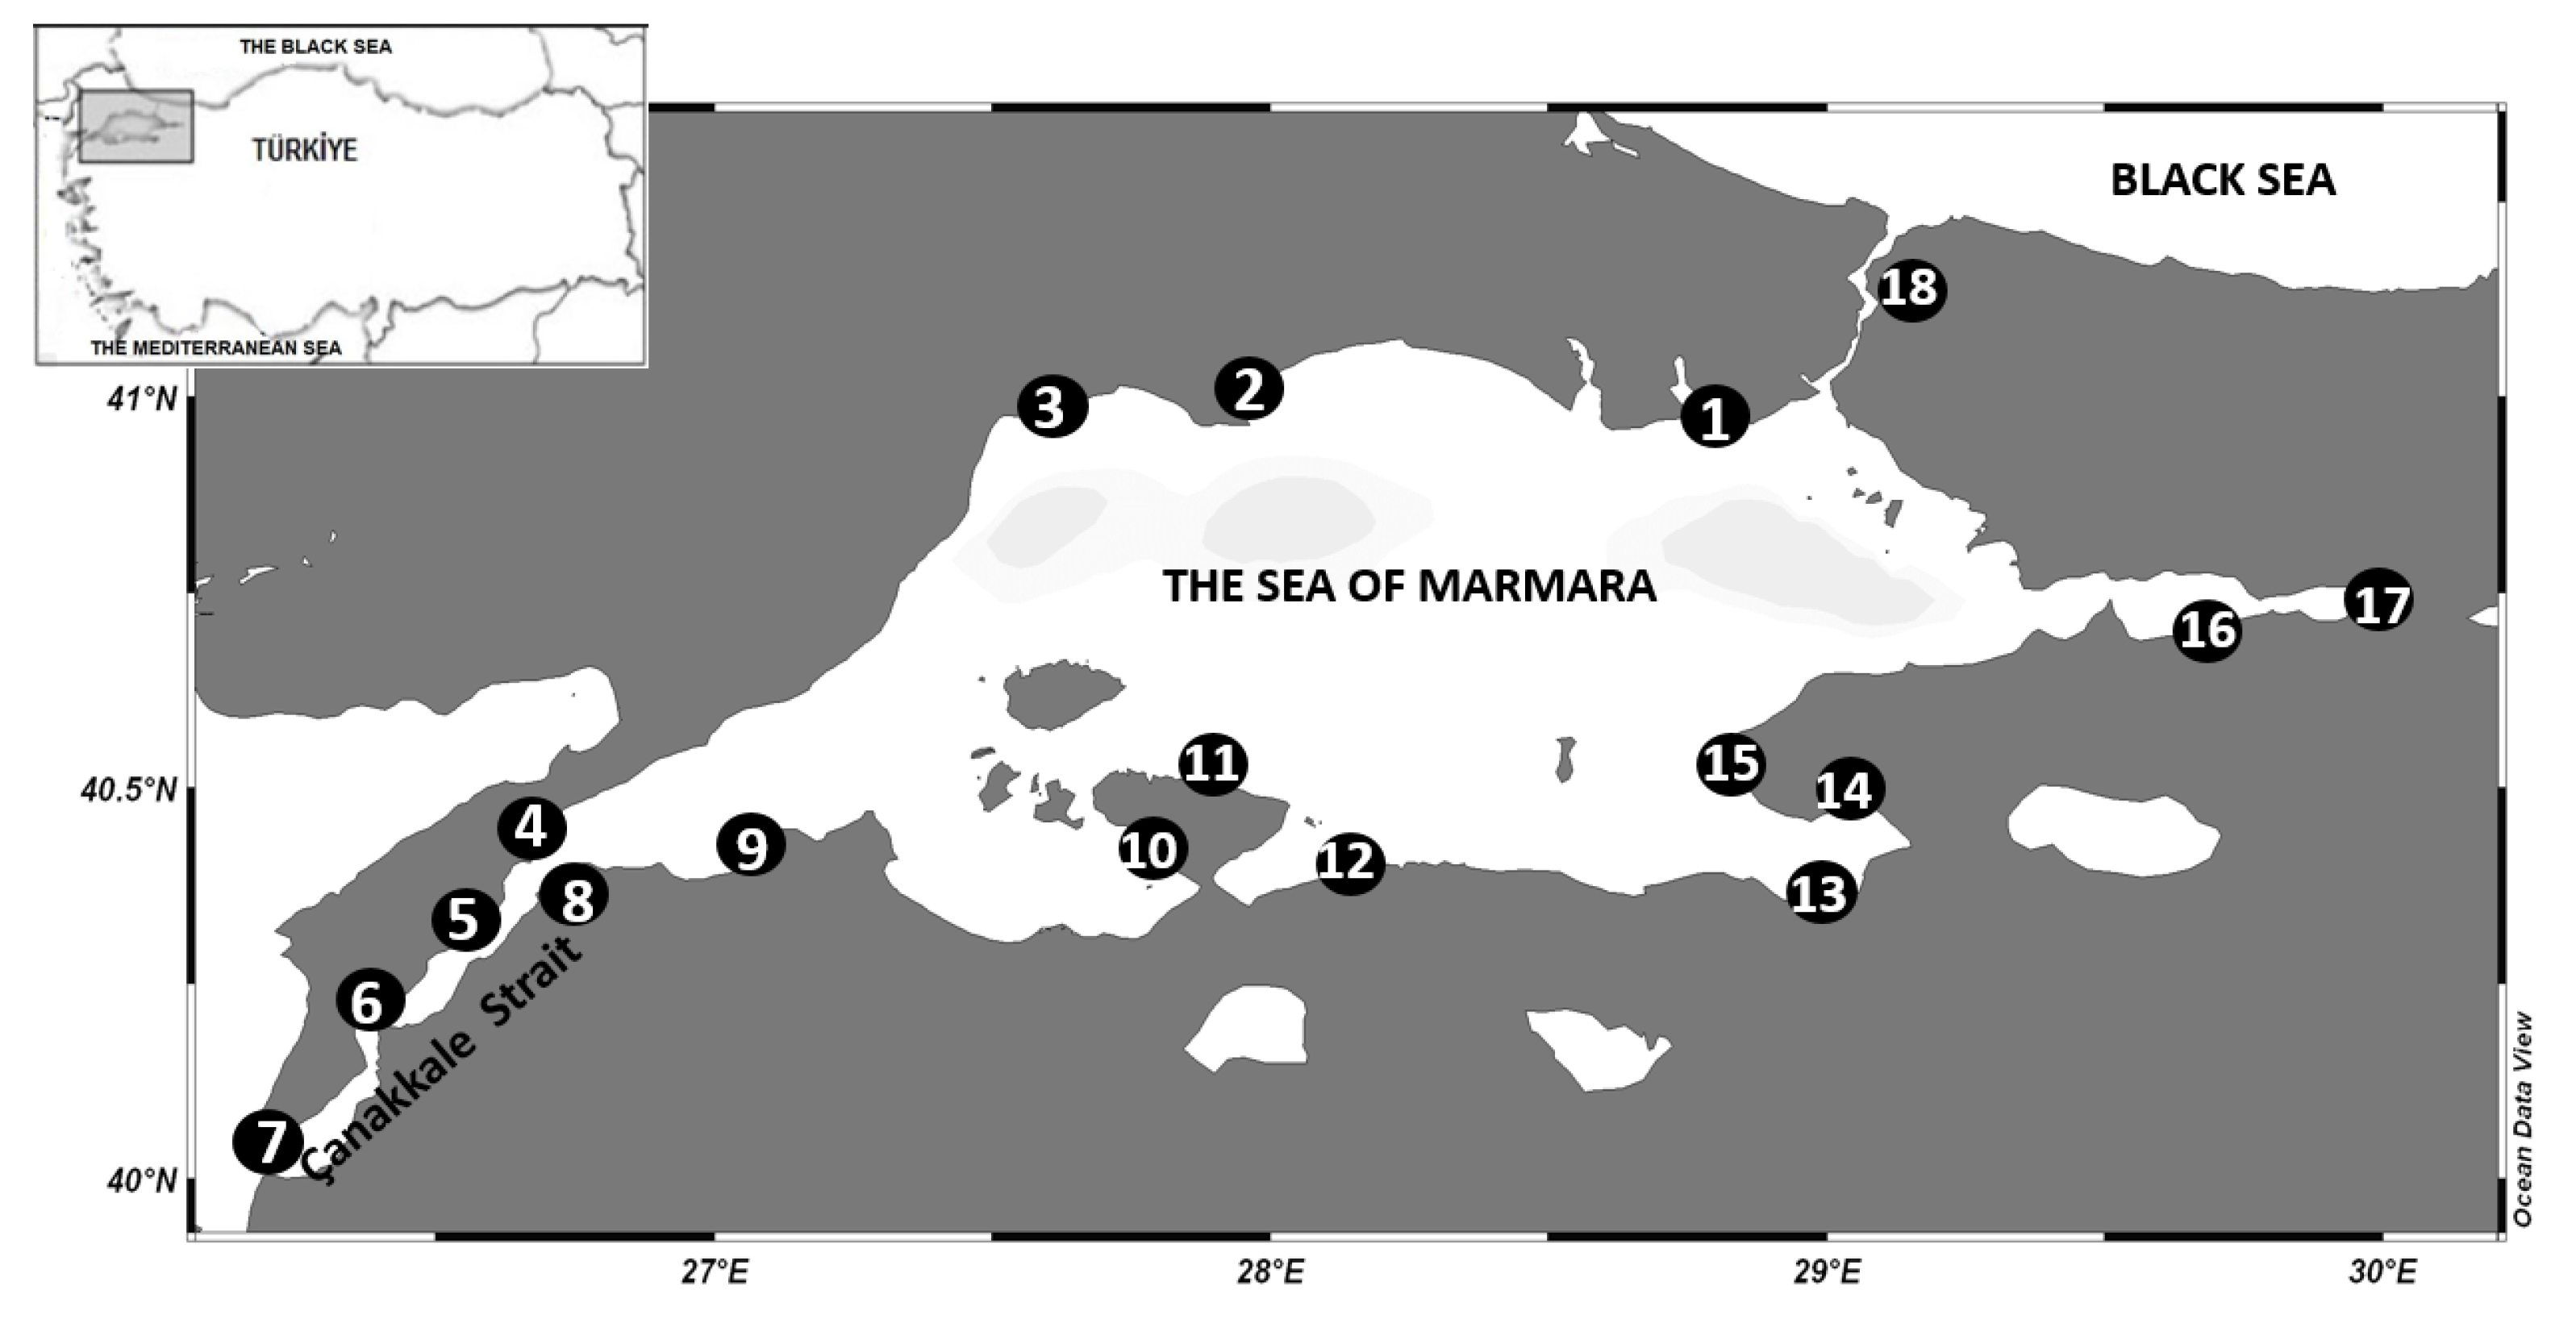
2.1. Sampling Area
2.2. Microplastic Extraction and Digestion
2.3. Visual Counts and FTIR Analysis of MPs
2.4. Quality Assurance and Quality Control (QA/QC)
2.5. Microplastics Contamination Factor and Microplastic Pollution Load Index
2.6. Risk Estimation
2.6.1. Chronic Daily Intake
2.6.2. Microplastic Carcinogenic Risk
2.7. Statistical Analysis
3. Results
3.1. Physicochemical Parameters of Water
3.2. Abundance and Distribution of MPs in Mussels
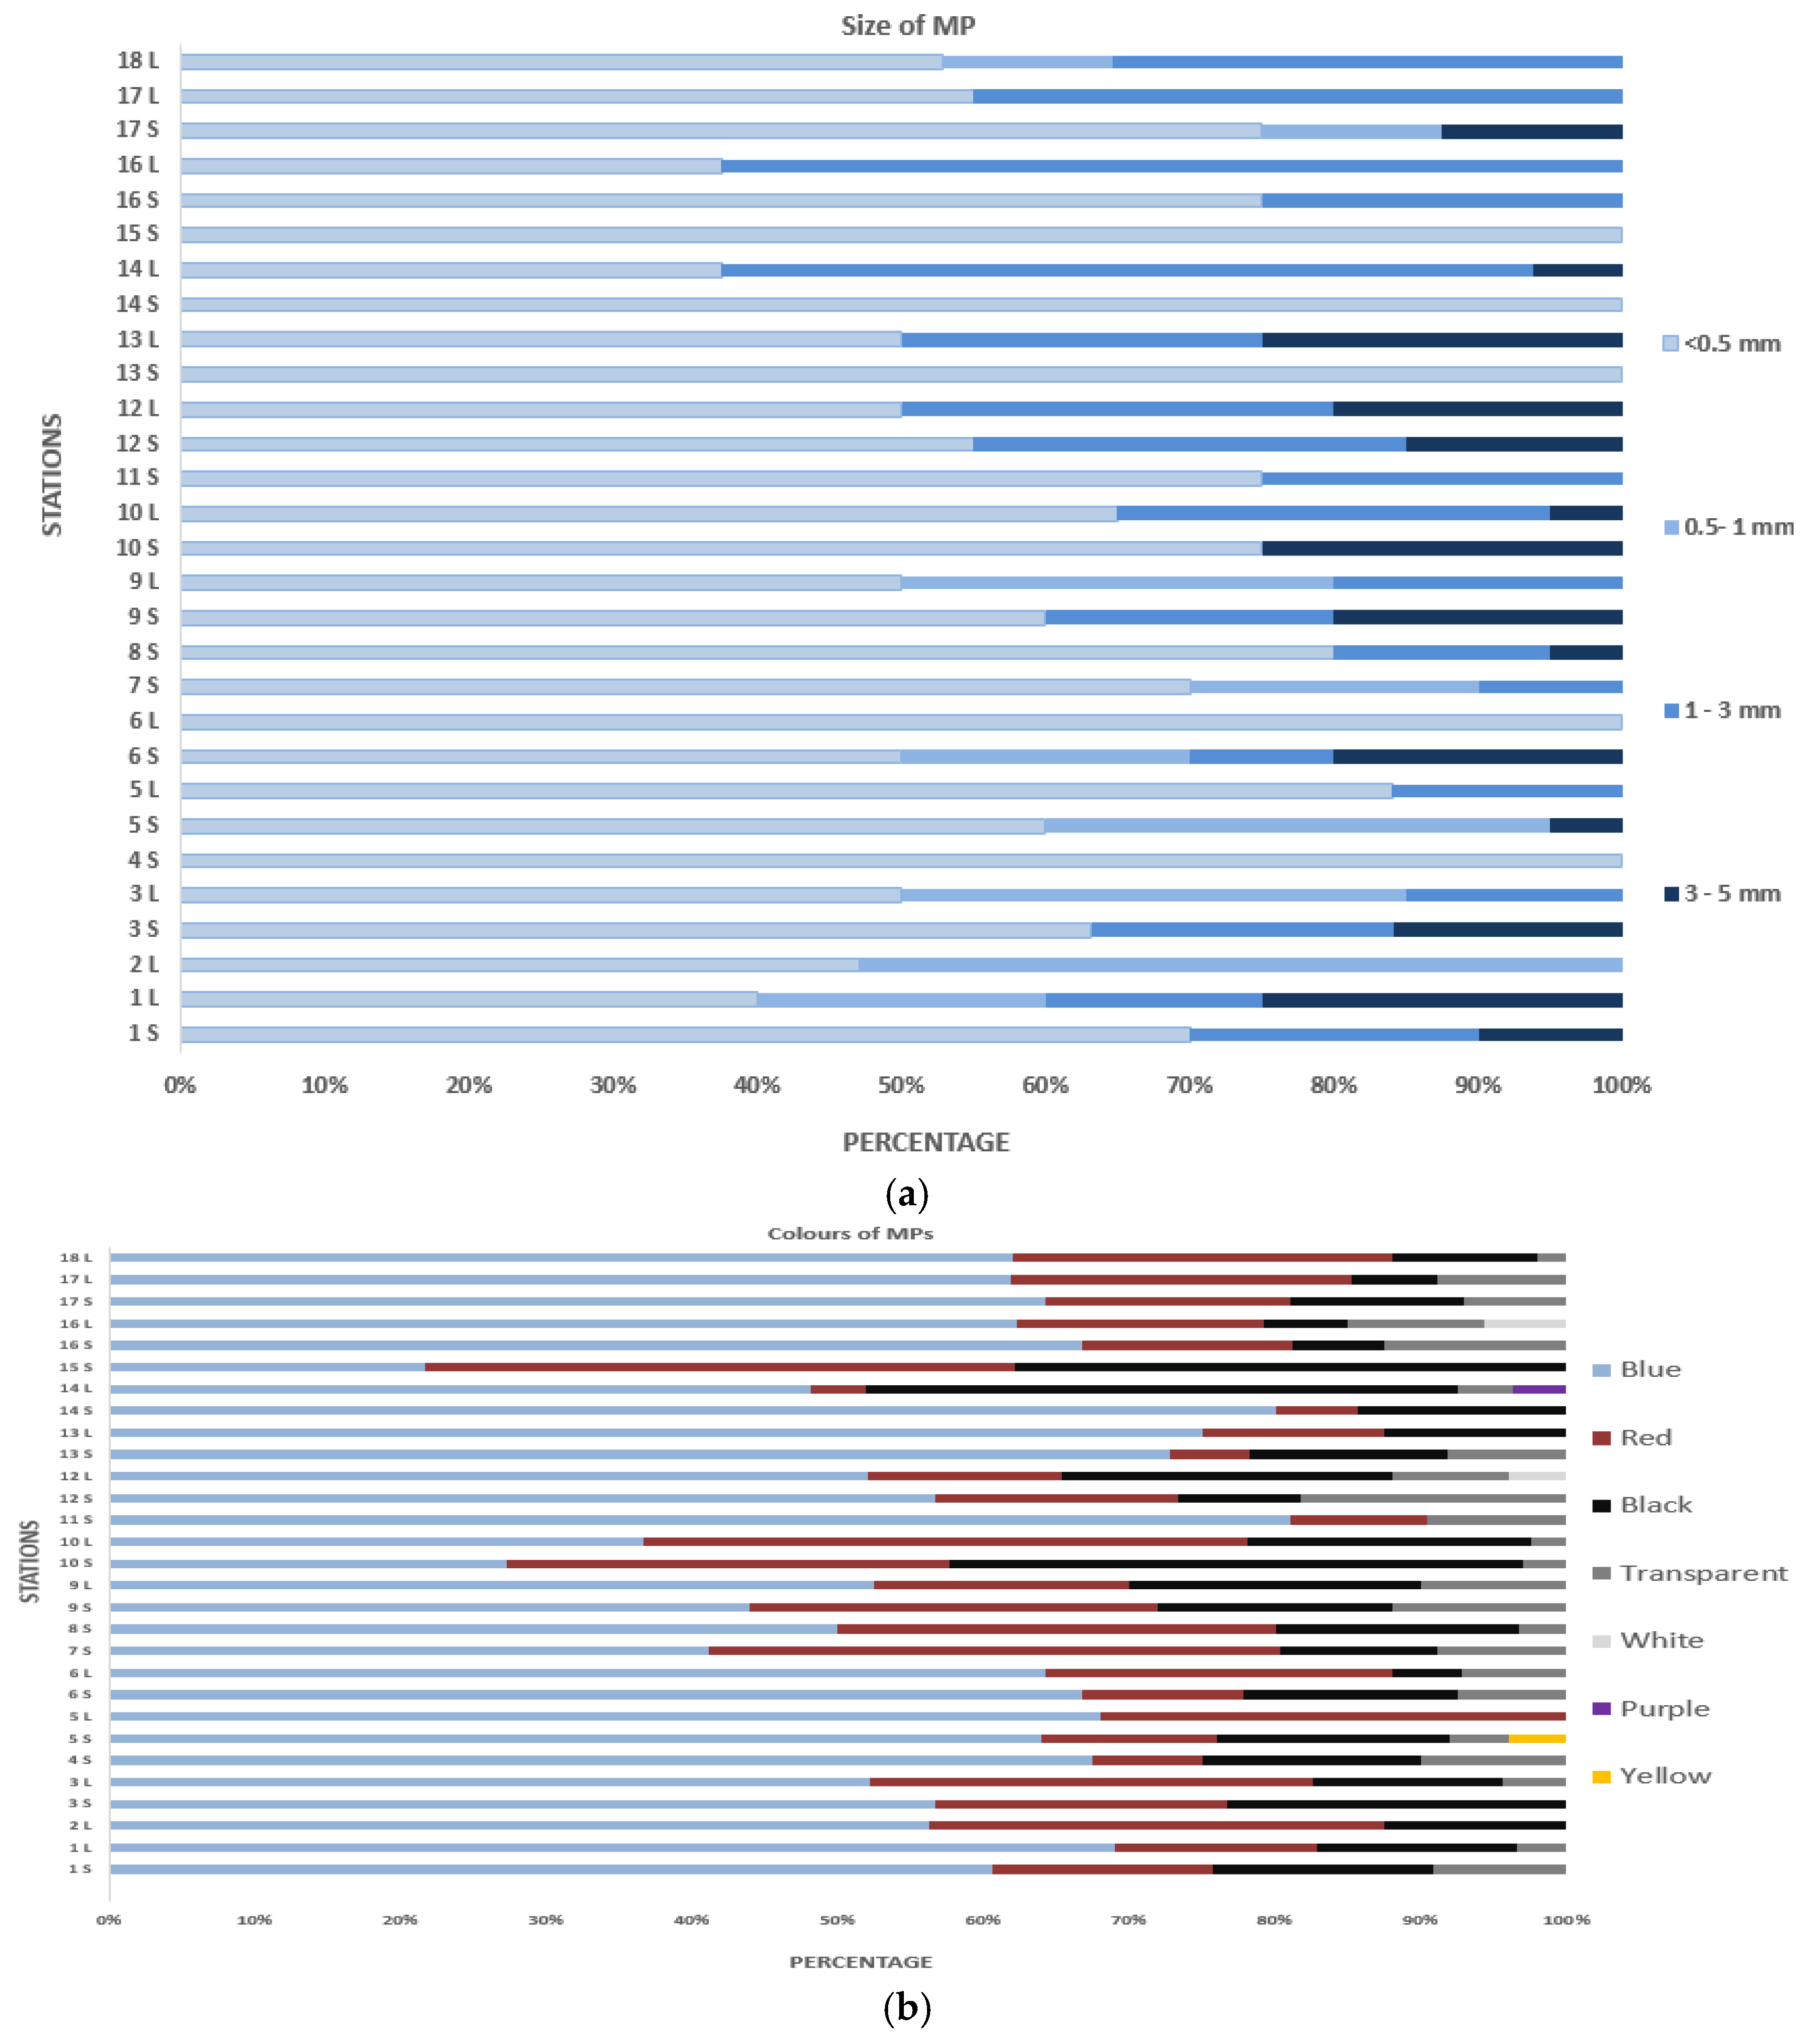
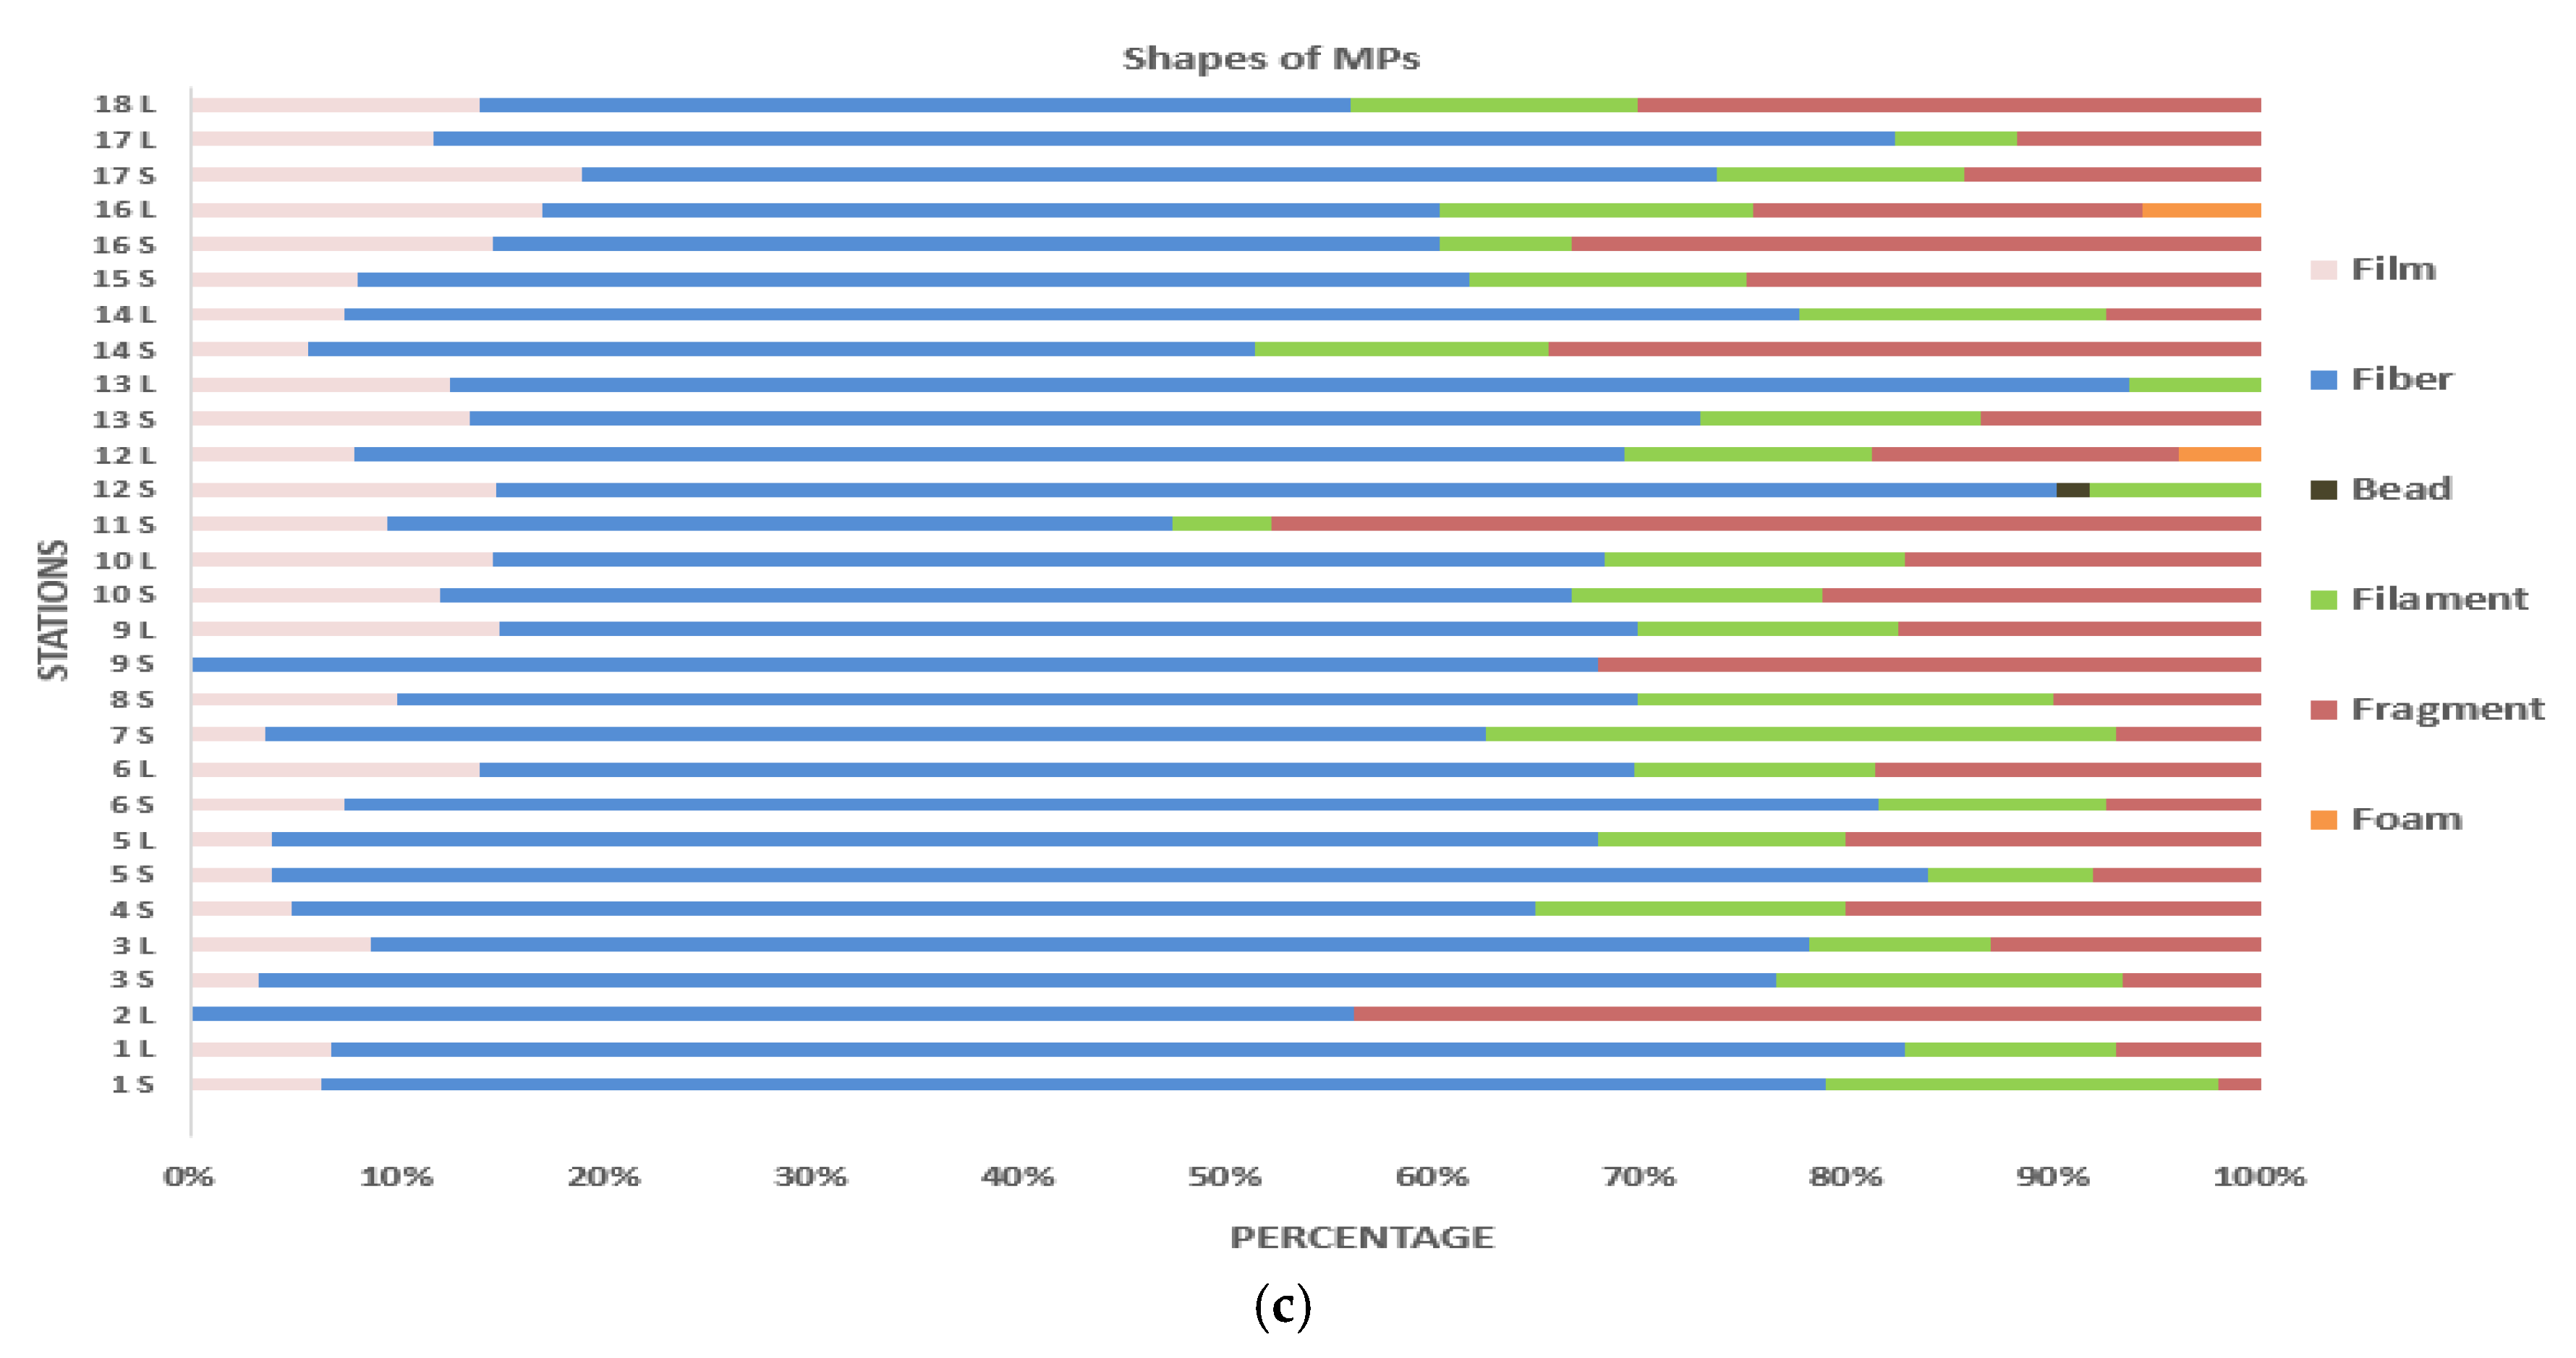
3.3. Morphology and Polymer Type of MPs in Mussels
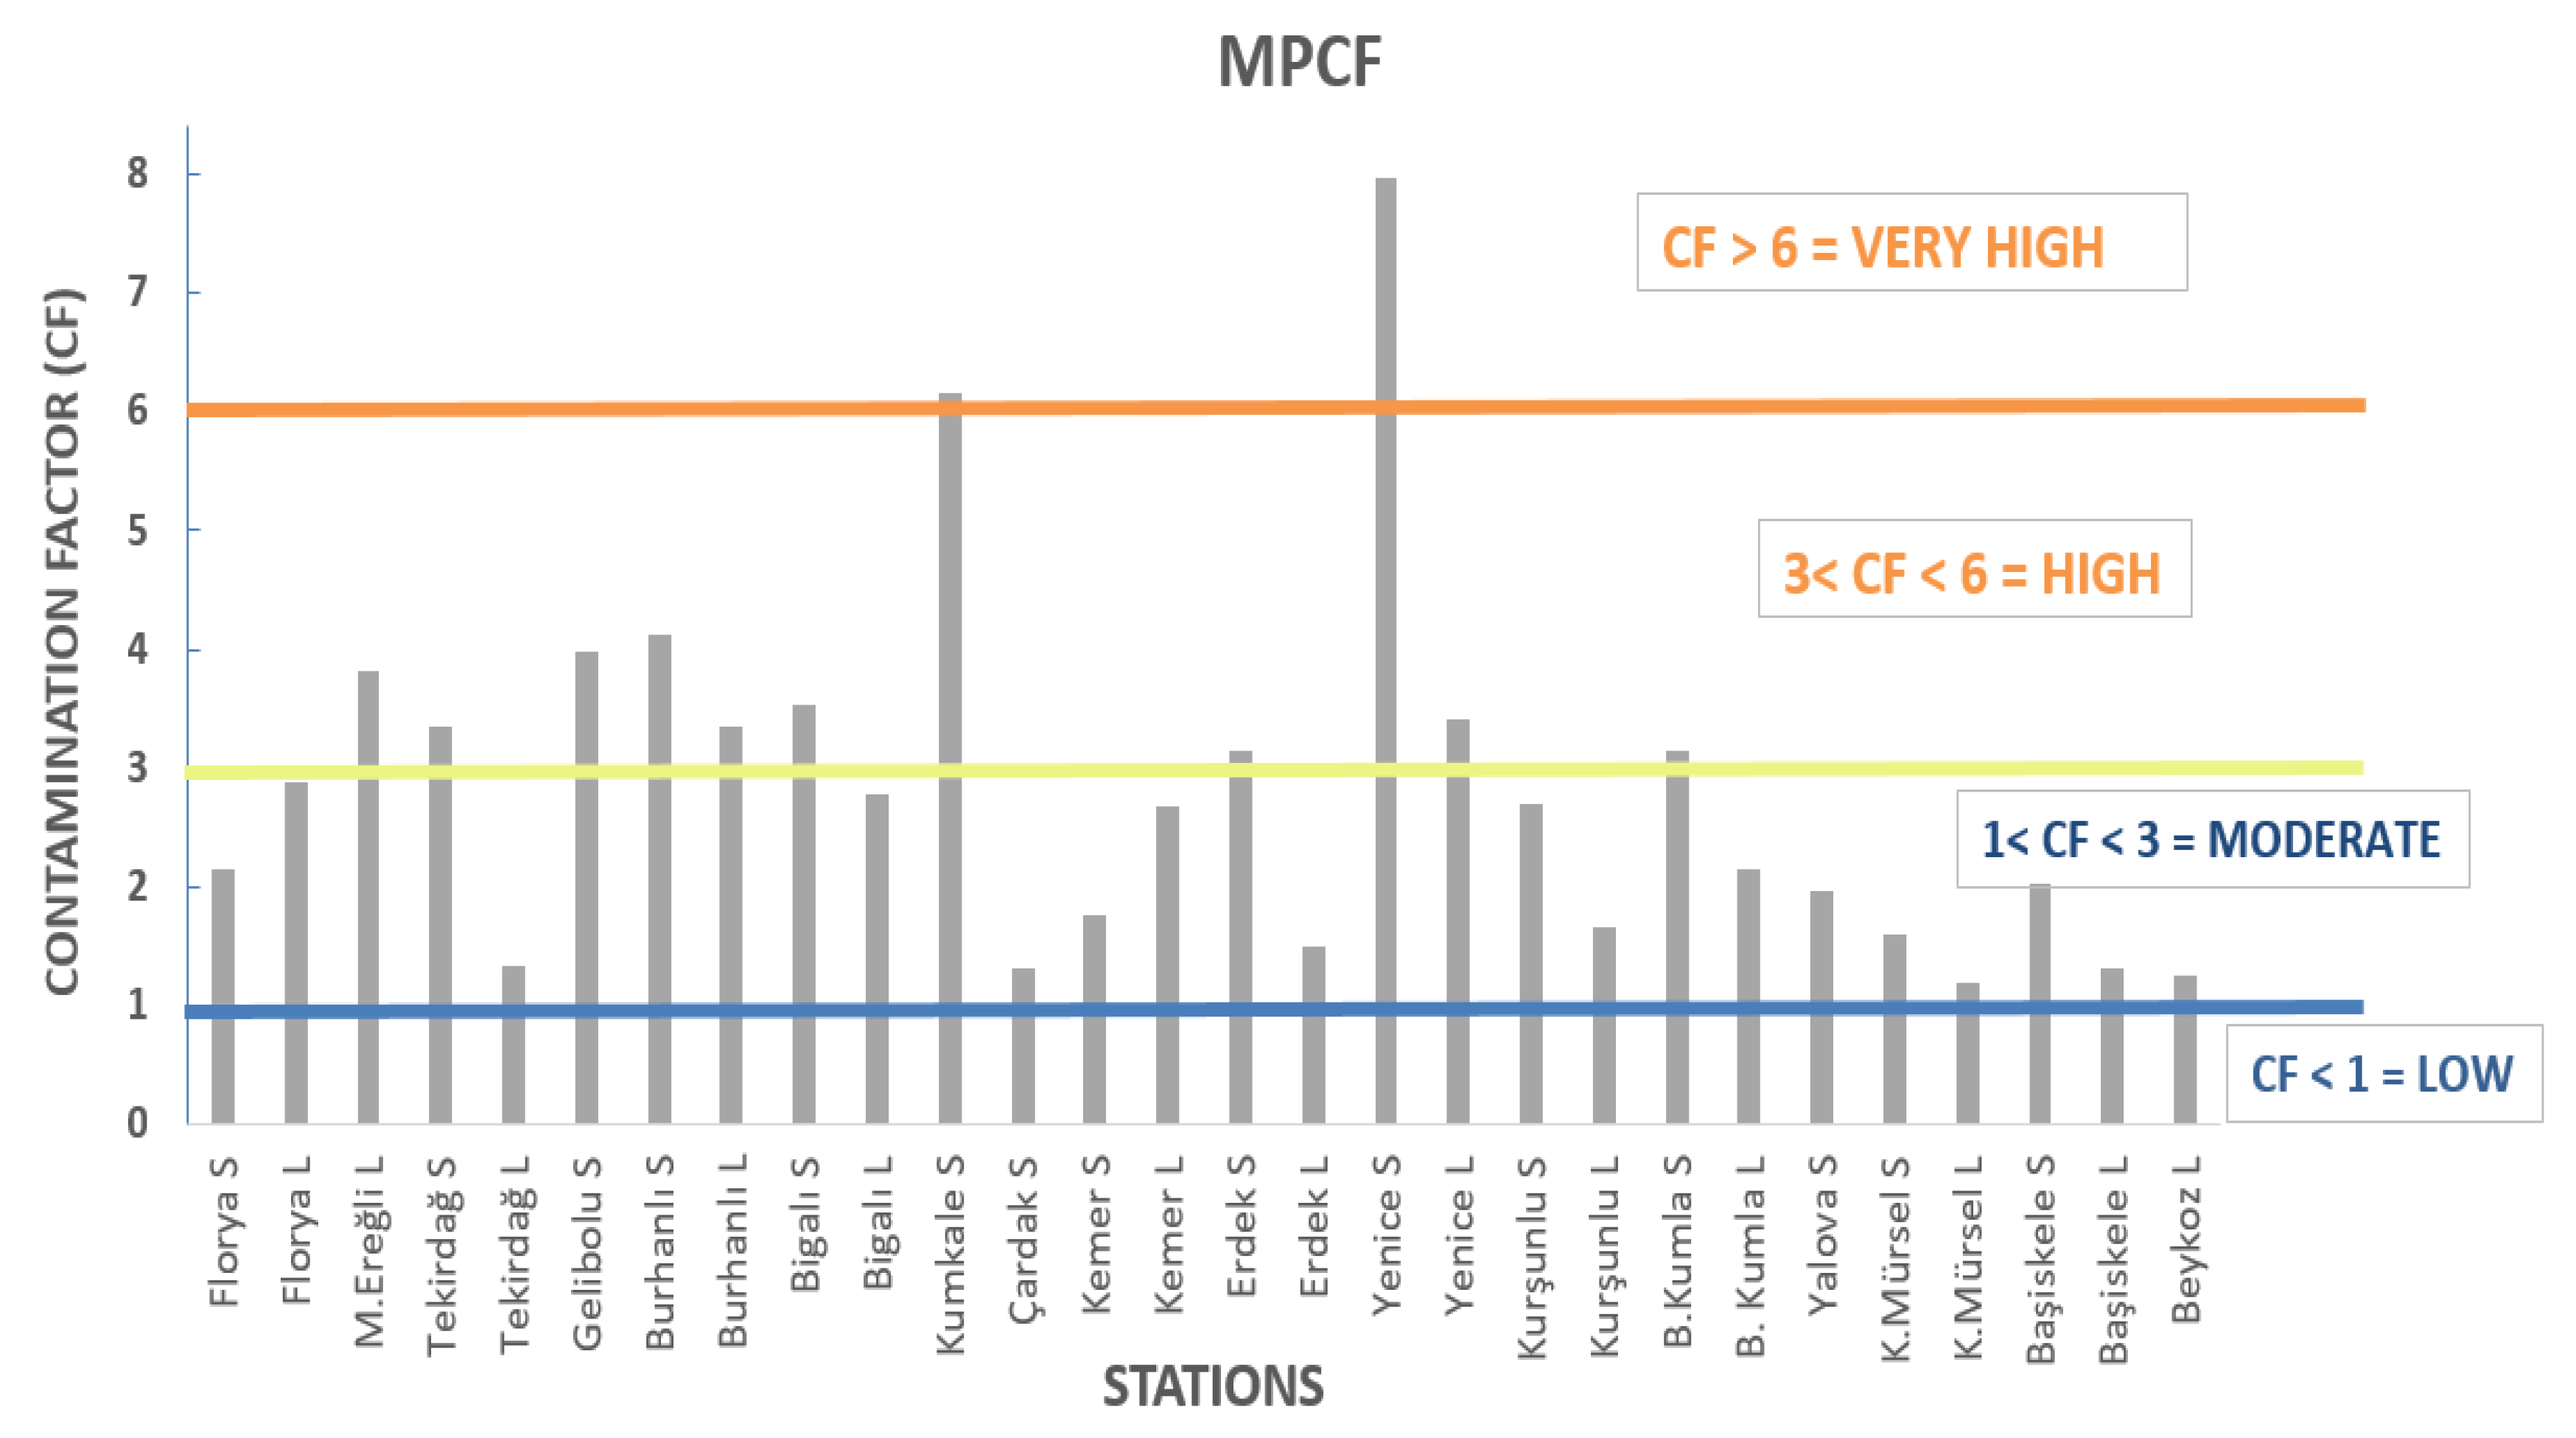
3.4. Pollution Load Index and Microplastic Contamination Factor
3.5. Health Risk Assessment
4. Discussion
5. Conclusions
Funding
Institutional Review Board Statement
Informed Consent Statement
Data Availability Statement
Acknowledgments
Conflicts of Interest
Appendix A

| Station No | Station Name | Coordinates |
|---|---|---|
| 1 | Florya | 40°58′39″ N 28°46′22″ E |
| 2 | M. Ereğlisi | 40°58′09″ N 27°57′37″ E |
| 3 | Tekirdağ | 40°00′04″ N 26°14′00″ E |
| 4 | Gelibolu | 40°59′04″ N 27°34′43″ E |
| 5 | Burhanlı | 40°18′23″ N 26°33′45″ E |
| 6 | Bigalı | 40°12′42″ N 26°23′19″ E |
| 7 | Kumkale | 40°00′04″ N 26°14′00″ E |
| 8 | Çardak | 40°22′34″ N 26°42′43″ E |
| 9 | Kemer | 40°24′50″ N 27°03′45″ E |
| 10 | Erdek | 40°22′47″ N 27°47′58″ E |
| 11 | Turan Village | 40°30′35″ N 27°47′03″ E |
| 12 | Yenice | 40°23′22″ N 28°06′49″ E |
| 13 | Kurşunlu | 40°21′51″ N 29°01′51″ E |
| 14 | B. Kumla | 40°28′36″ N 29°05′01″ E |
| 15 | Yalova | 40°30′32″ N 28°50′18″ E |
| 16 | K. Mürsel | 40°41′34″ N 29°36′24″ E |
| 17 | Başiskele | 40°42′59″ N 26°55′10″ E |
| 18 | Beykoz | 41°10′02″ N 29°04′54″ E |
| Station No | DO (mg/L) | pH | Temperature (°C) | Salinity (PSU) | TSS (mg/L) | TDS (mg/L) |
|---|---|---|---|---|---|---|
| 1 | 8.9 | 8.24 | 19.10 | 19.87 | 55.4 | 17.95 |
| 2 | 8.26 | 8.06 | 18.5 | 19.35 | 37 | 17.34 |
| 3 | 8.21 | 8.18 | 18.8 | 20.98 | 29.4 | 18.14 |
| 4 | 8.51 | 8.21 | 17.9 | 21.74 | 32 | 18.89 |
| 5 | 9.69 | 8.3 | 18 | 21.96 | 54.2 | 19.05 |
| 6 | 9.08 | 8.31 | 17.4 | 22.76 | 35.2 | 19.68 |
| 7 | 8.99 | 8.22 | 19.4 | 23.93 | 48 | 23.60 |
| 8 | 8.44 | 8.21 | 18.50 | 21.29 | 28.2 | 19.25 |
| 9 | 9.1 | 8.29 | 19.9 | 21.67 | 27.2 | 19.56 |
| 10 | 9.77 | 8.25 | 19.2 | 21 | 22.6 | 19.90 |
| 11 | 9.05 | 8.2 | 18.7 | 21.3 | 29 | 19.21 |
| 12 | 8.79 | 8.3 | 19.40 | 21.73 | 39.4 | 19.67 |
| 13 | 9.99 | 8.27 | 17.80 | 19.05 | 22.3 | 17.26 |
| 14 | 8.39 | 8.12 | 18.30 | 20.11 | 30.1 | 18.20 |
| 15 | 10.36 | 8.18 | 17.70 | 19.74 | 25.3 | 17.67 |
| 16 | 9.8 | 8.03 | 18.20 | 19.32 | 48 | 18.63 |
| 17 | 9.89 | 8.16 | 18.40 | 19.66 | 45.4 | 18.56 |
| 18 | 6.97 | 8.01 | 18.9 | 18.08 | 12.3 | 10.16 |
| Min | 6.97 | 8.01 | 17.40 | 18.08 | 12.30 | 10.16 |
| Max | 10.36 | 8.31 | 19.90 | 23.93 | 55.40 | 23.60 |
| Mean | 9.01 | 8.20 | 18.56 | 20.75 | 34.50 | 18.48 |
| Sd | 0.80 | 0.09 | 0.66 | 1.42 | 11.50 | 2.44 |
| St No Mussel Size | CDI Values (MP/Day/Person) | |||||||||||
|---|---|---|---|---|---|---|---|---|---|---|---|---|
| 100 g/Day | 225 g/Day | 1.19 kg/Year | ||||||||||
| C | A | WA | MA | C | A | WA | MA | C | A | WA | MA | |
| 1S | 1.43 | 2.52 × 10⁻¹ | 3.04 × 10⁻² | 2.94 × 10⁻² | 3.21 | 5.67 × 10⁻¹ | 6.84 × 10⁻² | 6.60 × 10⁻² | 4.66 × 10⁻² | 8.22 × 10⁻³ | 9.90 × 10⁻⁴ | 9.57 × 10⁻⁴ |
| 1L | 1.91 | 3.40 × 10⁻¹ | 4.10 × 10⁻² | 3.96 × 10⁻² | 4.30 | 7.66 × 10⁻¹ | 9.23 × 10⁻² | 8.92 × 10⁻² | 6.24 × 10⁻² | 1.11 × 10⁻² | 1.34 × 10⁻³ | 1.29 × 10⁻³ |
| 2L | 2.53 | 4.50 × 10⁻¹ | 5.42 × 10⁻² | 5.23 × 10⁻² | 5.69 | 1.01 | 1.22 × 10⁻¹ | 1.18 × 10⁻¹ | 8.24 × 10⁻² | 1.47 × 10⁻² | 1.77 × 10⁻³ | 1.71 × 10⁻³ |
| 3S | 2.23 | 3.94 × 10⁻¹ | 4.74 × 10⁻² | 4.58 × 10⁻² | 5.02 | 8.86 × 10⁻¹ | 1.07 × 10⁻¹ | 1.03 × 10⁻¹ | 7.27 × 10⁻² | 1.28 × 10⁻² | 1.55 × 10⁻³ | 1.49 × 10⁻³ |
| 3L | 8.89 × 10⁻¹ | 1.58 × 10⁻¹ | 1.91 × 10⁻² | 1.84 × 10⁻² | 2.00 | 3.56 × 10⁻¹ | 4.29 × 10⁻² | 4.15 × 10⁻² | 2.90 × 10⁻² | 5.16 × 10⁻³ | 6.22 × 10⁻⁴ | 6.01 × 10⁻⁴ |
| 4S | 2.65 | 4.68 × 10⁻¹ | 5.64 × 10⁻² | 5.45 × 10⁻² | 5.96 | 1.05 | 1.27 × 10⁻¹ | 1.23 × 10⁻¹ | 8.64 × 10⁻² | 1.52 × 10⁻² | 1.84 × 10⁻³ | 1.78 × 10⁻³ |
| 5S | 2.75 | 4.86 × 10⁻¹ | 5.86 × 10⁻² | 5.66 × 10⁻² | 6.20 | 1.09 | 1.32 × 10⁻¹ | 1.27 × 10⁻¹ | 8.98 × 10⁻² | 1.58 × 10⁻² | 1.91 × 10⁻³ | 1.84 × 10⁻³ |
| 5L | 2.22 | 3.95 × 10⁻¹ | 4.76 × 10⁻² | 4.60 × 10⁻² | 4.99 | 8.89 × 10⁻¹ | 1.07 × 10⁻¹ | 1.03 × 10⁻¹ | 7.24 × 10⁻² | 1.29 × 10⁻² | 1.55 × 10⁻³ | 1.50 × 10⁻³ |
| 6S | 2.36 | 4.16 × 10⁻¹ | 5.01 × 10⁻² | 4.84 × 10⁻² | 5.30 | 9.36 × 10⁻¹ | 1.13 × 10⁻¹ | 1.09 × 10⁻¹ | 7.68 × 10⁻² | 1.36 × 10⁻² | 1.63 × 10⁻³ | 1.58 × 10⁻³ |
| 6L | 1.83 | 3.26 × 10⁻¹ | 3.93 × 10⁻² | 3.80 × 10⁻² | 4.13 | 7.34 × 10⁻¹ | 8.85 × 10⁻² | 8.55 × 10⁻² | 5.98 × 10⁻² | 1.06 × 10⁻² | 1.28 × 10⁻³ | 1.24 × 10⁻³ |
| 7S | 4.10 | 7.24 × 10⁻¹ | 8.73 × 10⁻² | 8.43 × 10⁻² | 9.23 | 1.63 | 1.96 × 10⁻¹ | 1.90 × 10⁻¹ | 1.34 × 10⁻¹ | 2.36 × 10⁻² | 2.84 × 10⁻³ | 2.75 × 10⁻³ |
| 8S | 9.29 × 10⁻¹ | 1.64 × 10⁻¹ | 1.97 × 10⁻² | 1.91 × 10⁻² | 2.09 | 3.69 × 10⁻¹ | 4.44 × 10⁻² | 4.29 × 10⁻² | 3.03 × 10⁻² | 5.34 × 10⁻³ | 6.44 × 10⁻⁴ | 6.22 × 10⁻⁴ |
| 9S | 1.18 | 2.09 × 10⁻¹ | 2.51 × 10⁻² | 2.43 × 10⁻² | 2.66 | 4.70 × 10⁻¹ | 5.66 × 10⁻² | 5.47 × 10⁻² | 3.86 × 10⁻² | 6.80 × 10⁻³ | 8.20 × 10⁻⁴ | 7.92 × 10⁻⁴ |
| 9L | 1.77 | 3.15 × 10⁻¹ | 3.80 × 10⁻² | 3.67 × 10⁻² | 3.98 | 7.09 × 10⁻¹ | 8.54 × 10⁻² | 8.26 × 10⁻² | 5.77 × 10⁻² | 1.03 × 10⁻² | 1.24 × 10⁻³ | 1.20 × 10⁻³ |
| 10S | 2.10 | 3.71 × 10⁻¹ | 4.47 × 10⁻² | 4.32 × 10⁻² | 4.73 | 8.35 × 10⁻¹ | 1.01 × 10⁻¹ | 9.72 × 10⁻² | 6.86 × 10⁻² | 1.21 × 10⁻² | 1.46 × 10⁻³ | 1.41 × 10⁻³ |
| 10L | 7.64 × 10⁻¹ | 1.36 × 10⁻¹ | 1.64 × 10⁻² | 1.58 × 10⁻² | 1.72 | 3.06 × 10⁻¹ | 3.68 × 10⁻² | 3.56 × 10⁻² | 2.49 × 10⁻² | 4.43 × 10⁻³ | 5.34 × 10⁻⁴ | 5.16 × 10⁻⁴ |
| 11S | 1.18 | 2.09 × 10⁻¹ | 2.51 × 10⁻² | 2.43 × 10⁻² | 2.66 | 4.70 × 10⁻¹ | 5.66 × 10⁻² | 5.47 × 10⁻² | 3.86 × 10⁻² | 6.80 × 10⁻³ | 8.20 × 10⁻⁴ | 7.92 × 10⁻⁴ |
| 12S | 5.32 | 9.38 × 10⁻¹ | 1.13 × 10⁻¹ | 1.09 × 10⁻¹ | 1.20 × 101 | 2.11 | 2.54 × 10⁻¹ | 2.46 × 10⁻¹ | 1.73 × 10⁻¹ | 3.06 × 10⁻² | 3.69 × 10⁻³ | 3.56 × 10⁻³ |
| 12L | 2.25 | 4.01 × 10⁻¹ | 4.83 × 10⁻² | 4.66 × 10⁻² | 5.07 | 9.01 × 10⁻¹ | 1.09 × 10⁻¹ | 1.05 × 10⁻¹ | 7.34 × 10⁻² | 1.31 × 10⁻² | 1.57 × 10⁻³ | 1.52 × 10⁻³ |
| 13S | 1.80 | 3.18 × 10⁻¹ | 3.83 × 10⁻² | 3.70 × 10⁻² | 4.05 | 7.15 × 10⁻¹ | 8.62 × 10⁻² | 8.33 × 10⁻² | 5.87 × 10⁻² | 1.04 × 10⁻² | 1.25 × 10⁻³ | 1.21 × 10⁻³ |
| 13L | 1.07 | 1.90 × 10⁻¹ | 2.30 × 10⁻² | 2.22 × 10⁻² | 2.41 | 4.29 × 10⁻¹ | 5.16 × 10⁻² | 4.99 × 10⁻² | 3.49 × 10⁻² | 6.21 × 10⁻³ | 7.48 × 10⁻⁴ | 7.23 × 10⁻⁴ |
| 14S | 2.10 | 3.70 × 10⁻¹ | 4.46 × 10⁻² | 4.31 × 10⁻² | 4.71 | 8.32 × 10⁻¹ | 1.00 × 10⁻¹ | 9.69 × 10⁻² | 6.83 × 10⁻² | 1.21 × 10⁻² | 1.45 × 10⁻³ | 1.40 × 10⁻³ |
| 14L | 1.42 | 2.52 × 10⁻¹ | 3.04 × 10⁻² | 2.94 × 10⁻² | 3.19 | 5.67 × 10⁻¹ | 6.84 × 10⁻² | 6.60 × 10⁻² | 4.62 × 10⁻² | 8.22 × 10⁻³ | 9.90 × 10⁻⁴ | 9.57 × 10⁻⁴ |
| 15S | 1.31 | 2.31 × 10⁻¹ | 2.78 × 10⁻² | 2.69 × 10⁻² | 2.95 | 5.20 × 10⁻¹ | 6.27 × 10⁻² | 6.05 × 10⁻² | 4.27 × 10⁻² | 7.53 × 10⁻³ | 9.08 × 10⁻⁴ | 8.77 × 10⁻⁴ |
| 16S | 1.06 | 1.88 × 10⁻¹ | 2.26 × 10⁻² | 2.19 × 10⁻² | 2.39 | 4.22 × 10⁻¹ | 5.09 × 10⁻² | 4.92 × 10⁻² | 3.47 × 10⁻² | 6.12 × 10⁻³ | 7.37 × 10⁻⁴ | 7.12 × 10⁻⁴ |
| 16L | 7.87 × 10⁻¹ | 1.40 × 10⁻¹ | 1.69 × 10⁻² | 1.63 × 10⁻² | 1.77 | 3.15 × 10⁻¹ | 3.80 × 10⁻² | 3.67 × 10⁻² | 2.57 × 10⁻² | 4.57 × 10⁻³ | 5.50 × 10⁻⁴ | 5.32 × 10⁻⁴ |
| 17S | 1.35 | 2.38 × 10⁻¹ | 2.87 × 10⁻² | 2.77 × 10⁻² | 3.04 | 5.36 × 10⁻¹ | 6.46 × 10⁻² | 6.24 × 10⁻² | 4.40 × 10⁻² | 7.76 × 10⁻³ | 9.35 × 10⁻⁴ | 9.04 × 10⁻⁴ |
| 17L | 8.66 × 10⁻¹ | 1.54 × 10⁻¹ | 1.86 × 10⁻² | 1.79 × 10⁻² | 1.95 | 3.47 × 10⁻¹ | 4.18 × 10⁻² | 4.04 × 10⁻² | 2.82 × 10⁻² | 5.02 × 10⁻³ | 6.05 × 10⁻⁴ | 5.85 × 10⁻⁴ |
| 18L | 5.82 × 10⁻¹ | 1.04 × 10⁻¹ | 1.25 × 10⁻² | 1.21 × 10⁻² | 1.31 | 2.33 × 10⁻¹ | 2.81 × 10⁻² | 2.72 × 10⁻² | 1.90 × 10⁻² | 3.38 × 10⁻³ | 4.07 × 10⁻⁴ | 3.93 × 10⁻⁴ |
| Min | 5.82 × 10⁻¹ | 1.04 × 10⁻¹ | 1.25 × 10⁻² | 1.21 × 10⁻² | 1.31 | 2.33 × 10⁻¹ | 2.81 × 10⁻² | 2.72 × 10⁻² | 1.90 × 10⁻² | 3.38 × 10⁻³ | 4.07 × 10⁻⁴ | 3.93 × 10⁻⁴ |
| Max | 5.32 | 9.38 × 10⁻¹ | 1.13 × 10⁻¹ | 1.09 × 10⁻¹ | 1.20 × 101 | 2.11 | 2.54 × 10⁻¹ | 2.46 × 10⁻¹ | 1.73 × 10⁻¹ | 3.06 × 10⁻² | 3.69 × 10⁻³ | 3.56 × 10⁻³ |
| Mean | 1.82 | 3.22 × 10⁻¹ | 3.88 × 10⁻² | 3.75 × 10⁻² | 4.09 | 7.24 × 10⁻¹ | 8.73 × 10⁻² | 8.44 × 10⁻² | 5.93 × 10⁻² | 1.05 × 10⁻² | 1.26 × 10⁻³ | 1.22 × 10⁻³ |
| Station No | MPCR | |||||
| Children | Adolescents | |||||
| PVC | PP | PE-PET | PVC | PP | PE-PET | |
| 1 | - | - | 1.70 | - | - | 3.02 × 10⁻¹ |
| 3 | - | - | 1.59 | - | - | 2.81 × 10⁻¹ |
| 5 | - | - | 2.54 | - | - | 4.49 × 10⁻¹ |
| 6 | - | 5.03 × 10⁻¹ | 2.14 | - | 8.91 × 10⁻² | 3.79 × 10⁻¹ |
| 7 | - | 9.85 × 10⁻¹ | 4.19 | - | 1.74 × 10⁻¹ | 7.39 × 10⁻¹ |
| 9 | - | - | 1.51 | - | - | 2.67 × 10⁻¹ |
| 10 | - | - | 1.46 | - | - | 2.59 × 10⁻¹ |
| 12 | 7.19 | 9.08 × 10⁻¹ | 3.86 | 1.27 | 1.61 × 10⁻¹ | 6.83 × 10⁻¹ |
| 13 | - | - | 1.46 | - | - | 2.59 × 10⁻¹ |
| 14 | - | - | 1.79 | - | - | 3.17 × 10⁻¹ |
| 17 | 2.10 | - | 1.13 | 3.73 × 10⁻¹ | - | 2.00 × 10⁻¹ |
| 18 | - | - | 5.94 × 10⁻¹ | - | - | 1.06 × 10⁻¹ |
| Min | 2.10 | 5.03 × 10⁻¹ | 5.94 × 10⁻¹ | 3.73 × 10⁻¹ | 8.91 × 10⁻² | 1.06 × 10⁻¹ |
| Max | 7.19 | 9.85 × 10⁻¹ | 4.19 | 1.27 | 1.74 × 10⁻¹ | 7.39 × 10⁻¹ |
| Mean | 4.65 | 7.99 × 10⁻¹ | 1.87 | 8.22 × 10⁻¹ | 1.41 × 10⁻¹ | 3.31 × 10⁻¹ |
| Sd | 2.55 | 2.11 × 10⁻¹ | 9.49 × 10⁻¹ | 4.49 × 10⁻¹ | 3.73 × 10⁻² | 1.68 × 10⁻¹ |
| Station No | MPCR | |||||
| Female Adults | Male Adults | |||||
| PVC | PP | PE-PET | PVC | PP | PE-PET | |
| 1 | - | - | 3.64 × 10⁻² | - | - | 3.52 × 10⁻² |
| 3 | - | - | 3.39 × 10⁻² | - | - | 3.28 × 10⁻² |
| 5 | - | - | 5.41 × 10⁻² | - | - | 5.23 × 10⁻² |
| 6 | - | 1.07 × 10⁻² | 4.56 × 10⁻² | - | 1.04 × 10⁻² | 4.41 × 10⁻² |
| 7 | - | 2.09 × 10⁻² | 8.90 × 10⁻² | - | 2.02 × 10⁻² | 8.60 × 10⁻² |
| 9 | - | - | 3.22 × 10⁻² | - | - | 3.11 × 10⁻² |
| 10 | - | - | 3.12 × 10⁻² | - | - | 3.01 × 10⁻² |
| 12 | 1.53 × 10⁻¹ | 1.94 × 10⁻² | 8.23 × 10⁻² | 8.50 × 10⁻² | 1.87 × 10⁻² | 7.95 × 10⁻² |
| 13 | - | - | 3.12 × 10⁻² | - | - | 3.02 × 10⁻² |
| 14 | - | - | 3.82 × 10⁻² | - | - | 3.69 × 10⁻² |
| 17 | 4.49 × 10⁻² | - | 2.41 × 10⁻² | 2.49 × 10⁻² | - | 2.33 × 10⁻² |
| 18 | - | - | 1.27 × 10⁻² | - | - | 1.23 × 10⁻² |
| Min | 4.49 × 10⁻² | 1.07 × 10⁻² | 1.27 × 10⁻² | 2.49 × 10⁻² | 1.04 × 10⁻² | 1.23 × 10⁻² |
| Max | 1.53 × 10⁻¹ | 2.09 × 10⁻² | 8.90 × 10⁻² | 8.50 × 10⁻² | 2.02 × 10⁻² | 7.95 × 10⁻² |
| Mean | 9.90 × 10⁻² | 1.70 × 10⁻² | 3.99 × 10⁻² | 5.50 × 10⁻² | 1.64 × 10⁻² | 3.70 × 10⁻² |
| Sd | 5.41 × 10⁻² | 4.50 × 10⁻³ | 2.02 × 10⁻² | 3.01 × 10⁻² | 4.31 × 10⁻³ | 1.67 × 10⁻² |
References
- IUCN (International Union for Conservation of Nature and Natural Resources). Plastic Pollution. Issues Brief. 2024. Available online: https://www.iucn.org (accessed on 23 March 2025).
- WWF. Bending the Curve of Biodiversity Loss. In Living Planet Report 2020; Almond, R.E.A., Grooten, M., Petersen, T., Eds.; WWF: Gland, Switzerland, 2020. [Google Scholar]
- Frias, J.P.G.L.; Nash, R. Microplastics: Finding a Consensus on the Definition. Mar. Pollut. Bull. 2019, 138, 145–147. [Google Scholar] [CrossRef] [PubMed]
- Crawford, C.B.; Quinn, B. Microplastic Pollutants, 1st ed.; Elsevier Limited: Oxford, UK, 2016; p. 330. [Google Scholar]
- Wright, S.L.; Thompson, R.C.; Galloway, T.S. The Physical Impacts of Microplastics on Marine Organisms: A Review. Environ. Pollut. 2013, 178, 483–492. [Google Scholar] [CrossRef] [PubMed]
- Eriksen, M.; Cowger, W.; Erdle, L.M.; Coffin, S.; Villarrubia-Gomez, P.; Moore, C.J.; Wilcox, C. A Growing Plastic Smog, Now Estimated to Be Over 170 Trillion Plastic Particles Afloat in the World’s Oceans—Urgent Solutions Required. PLoS ONE 2023, 18, e0281596. [Google Scholar] [CrossRef] [PubMed]
- Barboza, L.G.A.; Frias, J.P.G.L.; Booth, A.M.; Vieira, L.R.; Masura, J.; Baker, J.; Foster, G.; Guilhermino, L. Microplastics Pollution in the Marine Environment. In World Seas: An Environmental Evaluation. Volume III: Ecological Issues and Environmental Impacts, 2nd ed.; Sheppard, C., Ed.; Academic Press (Elsevier): London, UK, 2019; Volume 3, pp. 329–351. [Google Scholar]
- Kane, I.A.; Clare, M.A. Dispersion, Accumulation, and the Ultimate Fate of Microplastics in Deep-Marine Environments: A Review and Future Directions. Front. Earth Sci. 2019, 7, 80. [Google Scholar] [CrossRef]
- Auta, H.S.; Emenike, C.U.; Fauziah, S.H. Distribution and Importance of Microplastics in the Marine Environment: A Review of the Sources, Fate, Effects, and Potential Solutions. Environ. Int. 2017, 102, 165–176. [Google Scholar] [CrossRef]
- Suaria, G.; Avio, C.G.; Mineo, A.; Lattin, G.L.; Magaldi, M.G.; Belmonte, G.; Moore, C.J.; Regoli, F.; Aliani, S. The Mediterranean Plastic Soup: Synthetic Polymers in Mediterranean Surface Waters. Sci. Rep. 2016, 6, 37551. [Google Scholar] [CrossRef] [PubMed]
- Strungaru, S.A.; Jijie, R.; Nicoara, M.; Plavan, G.; Faggio, C. Micro (Nano) Plastics in Freshwater Ecosystems: Abundance, Toxicological Impact and Quantification Methodology. Trends Anal. Chem. 2018, 110, 116–128. [Google Scholar] [CrossRef]
- Djekoun, M.; Gaaied, S.; Romdhani, I.; Rida, A.M.; Missaoui, Y.; Boubekeur, M.S.; Trea, F.; Lakbar, C.; Ouali, K.; Banni, M. Abundance and Distribution of Environmental Microplastic in Edible Fish and Mussels from the South Mediterranean Coasts. Mar. Pollut. Bull. 2024, 206, 116705. [Google Scholar] [CrossRef]
- Barboza, L.G.A.; Vethaak, A.D.; Lavorante, B.R.B.O.; Lundebye, A.-K.; Guilhermino, L. Marine Microplastic Debris: An Emerging Issue for Food Security, Food Safety and Human Health. Mar. Pollut. Bull. 2018, 133, 336–348. [Google Scholar] [CrossRef] [PubMed]
- Gallo, F.; Fossi, C.; Weber, R.; Santillo, D.; Sousa, J.; Ingram, I.; Nadal, A.; Romano, D. Marine Litter Plastics and Microplastics and Their Toxic Chemicals Components: The Need for Urgent Preventive Measures. Environ. Sci. Eur. 2018, 30, 1314. [Google Scholar] [CrossRef]
- Zitouni, N.; Cappello, T.; Missawi, O.; Boughattas, I.; De Marco, G.; Belbekhouche, S.; Mokni, M.; Alphonse, V.; Guerbej, H.; Bousserrhine, N.; et al. Metabolomic Disorders Unveil Hepatotoxicity of Environmental Microplastics in Wild Fish Serranus Scriba (Linnaeus 1758). Sci. Total Environ. 2022, 838 Pt 1, 155872. [Google Scholar] [CrossRef]
- Missawi, O.; Bousserrhine, N.; Belbekhouche, S.; Zitouni, N.; Alphonse, V.; Boughattas, I.; Banni, M. Abundance and Distribution of Small Microplastics (≤3 μm) in Sediments and Seaworms from the Southern Mediterranean Coasts and Characterisation of Their Potential Harmful Effects. Environ. Pollut. 2020, 263 Pt A, 114634. [Google Scholar] [CrossRef]
- Jeong, J.; Choi, J. Adverse Outcome Pathways Potentially Related to Hazard Identification of Microplastics Based on Toxicity Mechanisms. Chemosphere 2019, 231, 249–255. [Google Scholar] [CrossRef] [PubMed]
- Alomar, C.; Sureda, A.; Capo, X.; Guijarro, B.; Tejada, S.; Deudero, S. Microplastic Ingestion by Mullus surmuletus Linnaeus, 1758 Fish and Its Potential for Causing Oxidative Stress. Environ. Res. 2017, 159, 135–142. [Google Scholar] [CrossRef] [PubMed]
- Bricker, S.; Lauenstein, G.; Maruya, K. NOAA’s Mussel Watch Program: Incorporating Contaminants of Emerging Concern (CECs) into a Long-Term Monitoring Program. Mar. Pollut. Bull. 2014, 81, 289–290. [Google Scholar] [CrossRef]
- Rubini, S.; Munari, M.; Baldini, E.; Barsi, F.; Meloni, D.; Pussini, N.; Barchiesi, F.; Di Francesco, G.; Losasso, C.; Cocumelli, C.; et al. Microplastics in Mussels (Mytilus galloprovincialis): Understanding Pollution in Italian Seas. Toxics 2025, 13, 144. [Google Scholar] [CrossRef] [PubMed]
- Kovačić, I.; Štefanko, K.; Špada, V.; Pustijanac, E.; Buršić, M.; Burić, P. Microplastics in Mediterranean Mussel Mytilus galloprovincialis: Comparison between Cultured and Wild-Type Mussels from the Northern Adriatic. Appl. Sci. 2024, 14, 2056. [Google Scholar] [CrossRef]
- Gedik, K.; Eryaşar, A.R.; Gözler, A.M. The Microplastic Pattern of Wild-Caught Mediterranean Mussels from the Marmara Sea. Mar. Pollut. Bull. 2022, 175, 113331. [Google Scholar] [CrossRef]
- De Simone, S.; Perošević-Bajčeta, A.; Joksimović, D.; Beccherelli, R.; Zografopoulos, D.C.; Mussi, V. Study of Microplastics and Inorganic Contaminants in Mussels from the Montenegrin Coast, Adriatic Sea. J. Mar. Sci. Eng. 2021, 9, 544. [Google Scholar] [CrossRef]
- Gedik, K.; Eryaşar, A.R. Microplastic Pollution Profile of Mediterranean Mussels (Mytilus galloprovincialis) Collected along the Turkish Coasts. Chemosphere 2020, 260, 127570. [Google Scholar] [CrossRef]
- Li, J.; Lusher, A.L.; Rotchell, J.M.; Deudero, S.; Turra, A.; Bråte, I.L.N.; Sun, C.; Shahadat Hossain, M.; Li, Q.; Kolandhasamy, P.; et al. Using Mussel as a Global Bioindicator of Coastal Microplastic Pollution. Environ. Pollut. 2019, 244, 522–533. [Google Scholar] [CrossRef] [PubMed]
- TurkStat (Turkish Statistics). Population and Housing Census. 2021. Available online: https://data.tuik.gov.tr/Bulten/Index?p=Nufus-ve-Konut-Sayimi-2021-45866 (accessed on 28 June 2023).
- Erkan, H.S.; Turan, N.B.; Albay, M.; Engin, G.O. A Preliminary Study on the Distribution and Morphology of Microplastics in the Coastal Areas of Istanbul, the Metropolitan City of Turkey: The Effect of Location Differences. J. Clean. Prod. 2021, 307, 127320. [Google Scholar] [CrossRef]
- Öztürk, I.; Seker, M. Ecology of the Marmara Sea: Formation and Interactions of Marine Mucilage, and Recommendations for Solutions. In Turkish Academy of Sciences; TÜBA: Ankara, Türkiye, 2021. [Google Scholar]
- Li, Q.; Ma, C.; Zhang, Q.; Shi, H. Microplastics in Shellfish and Implications for Food Safety. Curr. Opin. Food Sci. 2021, 40, 192–197. [Google Scholar] [CrossRef]
- Mutlu, T.; Eryaşar, A.R.; Karaoğlu, K.; Veske, E.; Gedik, K. Microplastics Pollution in Gulf of Bandırma, Sea of Marmara: Biota and Sediment. Mar. Pollut. Bull. 2025, 213, 117667. [Google Scholar] [CrossRef]
- Tunçelli, İ.C.; Erkan, N. Microplastic Pollution in Wild and Aquacultured Mediterranean Mussels from the Sea of Marmara: Abundance, Characteristics, and Health Risk Estimations. Environ. Res. 2024, 242, 117787. [Google Scholar] [CrossRef] [PubMed]
- Galyon, F.; Ünver Alçay, A. Microplastic Contamination in Raw Mussels Collected in Istanbul. Reg. Stud. Mar. Sci. 2023, 68, 103280. [Google Scholar] [CrossRef]
- Yozukmaz, A. Investigation of Microplastics in Edible Wild Mussels from İzmir Bay (Aegean Sea, Western Turkey): A Risk Assessment for the Consumers. Mar. Pollut. Bull. 2021, 171, 112733. [Google Scholar] [CrossRef]
- Provincial Directorate of Environment, Urbanization and Climate Change, Çanakkale Governorship. Çanakkale Province Environmental Status Report for 2023; Provincial Directorate of Environment, Urbanization and Climate Change, Çanakkale Governorship: Çanakkale, Türkiye, 2023; SS.183. [Google Scholar]
- Beşiktepe, Ş.T.; Sur, H.I.; Özsoy, E.; Latif, M.A.; Oǧuz, T.; Ünlüata, Ü. The Circulation and Hydrography of the Marmara Sea. Prog. Oceanogr. 1994, 34, 285–334. [Google Scholar] [CrossRef]
- Beşiktepe, Ş.T. Density Currents in the Two-Layer Flow: An Example of Dardanelles Outflow. Oceanol. Acta 2003, 26, 243–253. [Google Scholar] [CrossRef]
- Özsoy, E.; Tuğrul, S.; Delfanti, R.; Sannino, G. Dynamics of High Energy Environment: Processes at the Turkish Straits System (DEEP), TUBITAK1001. Available online: https://open.metu.edu.tr/bitstream/handle/11511/49585/TVRVeU16UTA.pdf (accessed on 6 March 2025).
- Özgür, S. The Pollutants Accumulated in the Marmara Sea Basin. Master’s Thesis, Gebze Institute of Advanced Technology, Graduate School, Gebze, Türkiye, 2006. [Google Scholar]
- Li, J.; Qu, X.; Su, L.; Zhang, W.; Yang, D.; Kolandhasamy, P.; Li, D.; Shi, H. Microplastics in Mussels along the Coastal Waters of China. Environ. Pollut. 2016, 214, 177–184. [Google Scholar] [CrossRef]
- Balcıoğlu İlhan, E.B.; İlhan, F.; Balcıoğlu, G.; Taşkın Kaya, D.; Ismayilova, I.J.; Çağlar Balkıs, N. Correlation between Water Quality and Pollution Parameters in the Surface Waters of the Coastal Areas of the Sea of Marmara, Türkiye. Int. J. Environ. Geoinform. 2025, 12, 28–42. [Google Scholar] [CrossRef]
- Winkler, L.W. The Determination of Oxygen Dissolved in Water. Rep. Ger. Chem. Soc. 1888, 21, 2843–2855. [Google Scholar]
- APHA; AWWA; WPCP. Standard Methods for the Examination of Water and Wastewater, 15th ed.; APHA: Washington, DC, USA, 1980. [Google Scholar]
- Hermsen, E.; Mintenig, S.M.; Besseling, E.; Koelmans, A.A. Quality Criteria for the Analysis of Microplastic in Biota Samples: A Critical Review. Environ. Sci. Technol. 2018, 52, 10230–10240. [Google Scholar] [CrossRef] [PubMed]
- Kühn, S.; Van Werven, B.; Van Oyen, A.; Meijboom, A.; Rebolledo, E.L.B.; Van Franeker, J.A. The Use of Potassium Hydroxide (KOH) Solution as a Suitable Approach to Isolate Plastics Ingested by Marine Organisms. Mar. Pollut. Bull. 2017, 115, 86–90. [Google Scholar] [CrossRef]
- Lusher, A.L.; Welden, N.A.; Sobral, P.; Cole, M. Sampling, Isolating and Identifying Microplastics Ingested by Fish and Invertebrates. Anal. Methods 2017, 9, 1346–1360. [Google Scholar] [CrossRef]
- Dehaut, A.; Cassone, A.L.; Frère, L.; Hermabessiere, L.; Himber, C.; Rinnert, E.; Rivière, G.; Lambert, C.; Soudant, P.; Huvet, A.; et al. Microplastics in Seafood: Benchmark Protocol for Their Extraction and Characterization. Environ. Pollut. 2016, 215, 223–233. [Google Scholar] [CrossRef]
- Sparks, C.; Awe, A.; Maneveld, J. Abundance and Characteristics of Microplastics in Retail Mussels from Cape Town, South Africa. Mar. Pollut. Bull. 2021, 166, 112186. [Google Scholar] [CrossRef]
- Wakkaf, T.; El Zrelli, R.; Kedzierski, M.; Balti, R.; Shaiek, M.; Mansour, L.; Tlig-Zouari, S.; Bruzaud, S.; Rabaoui, L. Microplastics in Edible Mussels from a Southern Mediterranean Lagoon: Preliminary Results on Seawater-Mussel Transfer and Implications for Environmental Protection and Seafood Safety. Mar. Pollut. Bull. 2020, 158, 111355. [Google Scholar] [CrossRef] [PubMed]
- Hidalgo-Ruz, V.; Gutow, L.; Thompson, R.C.; Thiel, M. Microplastics in the Marine Environment: A Review of the Methods Used for Identification and Quantification. Environ. Sci. Technol. 2012, 46, 3060–3075. [Google Scholar] [CrossRef]
- Zhao, S.; Ward, J.E.; Danley, M.; Mincer, T.J. Field-Based Evidence for Microplastic in Marine Aggregates and Mussels: Implications for Trophic Transfer. Environ. Sci. Technol. 2018, 52, 11038–11048. [Google Scholar] [CrossRef]
- Avio, C.G.; Cardelli, L.R.; Gorbi, S.; Pellegrini, D.; Regoli, F. Microplastics Pollution after the Removal of the Costa Concordia Wreck: First Evidences from a Biomonitoring Case Study. Environ. Pollut. 2017, 227, 207–214. [Google Scholar] [CrossRef] [PubMed]
- Gwinnett, C.; Miller, R.Z. Are We Contaminating Our Samples? A Preliminary Study to Investigate Procedural Contamination During Field Sampling and Processing for Microplastic and Anthropogenic Microparticles. Mar. Pollut. Bull. 2021, 173 Pt B, 113095. [Google Scholar] [CrossRef]
- Kabir, A.H.M.E.; Sekine, M.; Imai, T.; Yamamoto, K.; Iwasaki, Y.; Kodera, K. Assessing Small-Scale Freshwater Microplastics Pollution, Land-Use, Source-to-Sink Conduits, and Pollution Risks: Perspectives from Japanese Rivers Polluted with Microplastics. Sci. Total Environ. 2021, 768, 144655. [Google Scholar] [CrossRef]
- Vieira, A.R.; Collignon, P.; Aarestrup, F.M.; McEwen, S.A.; Hendriksen, R.S.; Hald, T.; Wegener, H.C. Association Between Antimicrobial Resistance in Escherichia coli Isolates from Food Animals and Blood Stream Isolates from Humans in Europe: An Ecological Study. Foodborne Pathog. Dis. 2011, 8, 1295–1301. [Google Scholar] [CrossRef] [PubMed]
- World Data. Average Height and Weight by Country. Available online: https://www.worlddata.info/average-bodyheight.php#by-country (accessed on 21 July 2024).
- USEPA. Health Assessment Summary Tables. Annual FY-92; Prepared by the Office of Health and Environmental Assessment, Environmental Criteria and Assessment Office, Cincinnati, OH, for the Office of Emergency and Remedial Response, Washington, DC; USEPA: Washington, DC, USA, 1992. [Google Scholar]
- USEPA. Toxics Release Inventory Relative Risk-Based Environmental Indicators: Interim Toxicity Weighting Summary Document. pp. 1–252. Available online: https://nepis.epa.gov/Exe/ZyNET.exe/P1003WSB.TXT?ZyActionD=ZyDocument&Client=EPA&Index=1995+Thru+1999&Docs=&Query=&Time=&EndTime=&SearchMethod=1&TocRestrict=n&Toc=&TocEntry=&QField=&QFieldYear=&QFieldMonth=&QFieldDay=&IntQFieldOp=0&ExtQFieldOp=0&XmlQuery=&File=D%3A%5Czyfiles%5CIndex%20Data%5C95thru99%5CTxt%5C00000023%5CP1003WSB.txt&User=ANONYMOUS&Password=anonymous&SortMethod=h%7C-&MaximumDocuments=1&FuzzyDegree=0&ImageQuality=r75g8/r75g8/x150y150g16/i425&Display=hpfr&DefSeekPage=x&SearchBack=ZyActionL&Back=ZyActionS&BackDesc=Results%20page&MaximumPages=1&ZyEntry=1&SeekPage=x&ZyPURL (accessed on 3 August 2024).
- Salamone, J.C. (Ed.) Polymeric Materials Encyclopedia, v.8 P; CRC Press: Boca Raton, FL, USA, 1996; pp. 6036–6037. [Google Scholar]
- Enyoh, C.E.; Verla, A.W.; Rakib, M.R.J. Application of Index Models for Assessing Freshwater Microplastics Pollution. World News Nat. Sci. 2021, 38, 37–48. [Google Scholar]
- WHO; FAO. Report of the Joint FAO/WHO Expert Consultation on the Risks and Benefits of Fish Consumption, 25–29 January 2010; No. FIPM/R978 (En); World Health Organization: Rome, Italy, 2011. [Google Scholar]
- EFSA. Statement on the Presence of Microplastics and Nanoplastics in Food, with Particular Focus on Seafood. European Food Safety Authority (EFSA) Panel on Contaminants in the Food Chain (CONTAM). EFSA J. 2016, 14, 4501. [Google Scholar] [CrossRef]
- EUMOFA. The EU Fish Market. EUMOFA (European Market Observatory for Fisheries and Aquaculture Products, Luxembourg); FAO, The State of World Fisheries and Aquaculture (SOFIA); FAO: Rome, Italy, 2022. [Google Scholar]
- Song, K.; Wang, R.; Yang, G.; Xie, S.; Chen, Y.; Yang, F.; Huang, W.; Zhang, T.; Feng, Z. Pollution Concerns in Mariculture Water and Cultured Economical Bivalves: Occurrence of Microplastics under Different Aquaculture Modes. J. Clean. Prod. 2023, 406, 136913. [Google Scholar] [CrossRef]
- Ding, J.; Sun, C.; He, C.; Li, J.; Ju, P.; Li, F. Microplastics in Four Bivalve Species and Basis for Using Bivalves as Bioindicators of Microplastic Pollution. Sci. Total Environ. 2021, 782, 146830. [Google Scholar] [CrossRef]
- Gürkan, Ü.; Tekin Özan, S. Susurluk Çayı Bursa-Balıkesir’deki Tatlı Su Kefali Squalias cephalus L’nin Helmint Faunası. SDU J. Sci. 2012, 7, 77–85. [Google Scholar]
- Kudun, K. Hydrogeochemistry of the Simav Brook. Master’s Thesis, Istanbul Technical University, Graduate School of Natural and Applied Sciences, Istanbul, Türkiye, 1994. [Google Scholar]
- Çiçek, N.L.; Güçlü, S.S.; Erdoğan, Ö.; Küçük, F. Water Quality Assessment of Simav River (Susurluk Basin/Turkey) According to Seasons and Stations. Int. J. Comput. Exp. Sci. Eng. 2023, 9, 68–80. [Google Scholar] [CrossRef]
- Besseling, E.; Quik, J.T.; Sun, M.; Koelmans, A.A. Fate of Nano- and Microplastic in Freshwater Systems: A Modeling Study. Environ. Pollut. 2017, 220, 540–548. [Google Scholar] [CrossRef] [PubMed]
- Kooi, M.; Besseling, E.; Kroeze, C.; Wezel, A.P.V.; Koelmans, A.A. Modeling the Fate and Transport of Plastic Debris in Freshwaters: Review and Guidance. Freshw. Microplast. 2018, 58, 125–152. [Google Scholar]
- Peller, J.R.; Eberhardt, L.; Clark, R.; Nelson, C.; Kostelnik, E.; Iceman, C. Tracking the Distribution of Microfiber Pollution in a Southern Lake Michigan Watershed through the Analysis of Water, Sediment and Air. Environ. Sci. Process. Impacts 2019, 21, 1549–1559. [Google Scholar] [CrossRef]
- Junior, T.; Nisaa, A.F.; Karnaningroem, N.; Mardyanto, M.A. The Presence of Microplastics in Surabaya Coastal Area and Its Correlation with Conventional Water Quality Parameters. IOP Conf. Ser. Earth Environ. Sci. 2024, 1414, 012038. [Google Scholar] [CrossRef]
- Kwon, H.J.; Hidayaturrahman, H.; Peera, S.G.; Lee, T.G. Elimination of Microplastics at Different Stages in Wastewater Treatment Plants. Water 2022, 14, 2404. [Google Scholar] [CrossRef]
- Ross, M.S.; Loutan, A.; Groeneveld, T.; Molenaar, D.; Kroetch, K.; Bujaczek, T.; Kolter, S.; Moon, S.; Huynh, A.; Khayam, R.; et al. Estimated Discharge of Microplastics via Urban Stormwater During Individual Rain Events. Front. Environ. Sci. 2023, 11, 1090267. [Google Scholar] [CrossRef]
- Dhea, L.A.; Kurniawan, A.; Ulfa, S.M.; Karimah, K. Correlation of Microplastic Size Distribution and Water Quality Parameters in the Upstream Brantas River. J. Penelit. Pendidik. IPA 2023, 9, 520–526. [Google Scholar] [CrossRef]
- Wolff, S.; Weber, F.; Kerpen, J.; Winklhofer, M.; Engelhart, M.; Barkmann, L. Elimination of Microplastics by Downstream Sand Filters in Wastewater Treatment. Water 2021, 13, 33. [Google Scholar] [CrossRef]
- Cordova, M.R.; Hernawan, U.E. Microplastics in Sumba Waters, East Nusa Tenggara. IOP Conf. Ser. Earth Environ. Sci. 2018, 162, 012023. [Google Scholar] [CrossRef]
- Brandon, J.; Goldstein, M.; Ohman, M.D. Long-Term Aging and Degradation of Microplastic Particles: Comparing in Situ Oceanic and Experimental Weathering Patterns. Mar. Pollut. Bull. 2016, 110, 299–308. [Google Scholar] [CrossRef]
- De Witte, B.; Devriese, L.; Bekaert, K.; Hoffman, S.; Vandermeersch, G.; Cooreman, K.; Robbens, J. Quality Assessment of the Blue Mussel (Mytilus edulis): Comparison Between Commercial and Wild Types. Mar. Pollut. Bull. 2014, 85, 146–155. [Google Scholar] [CrossRef] [PubMed]
- Otegui, M.B.P.; Castro, M.A.; Yuvero, M.C.; Giménez, J. Spatial and Temporal Variation of Microplastic in Mussels from Intertidal and Subtidal Banks in the Southwestern Atlantic Ocean. Sci. Total Environ. 2025, 958, 177957. [Google Scholar] [CrossRef] [PubMed]
- Okamoto, K.; Nomura, M.; Horie, Y.; Okamura, H. Color Preferences and Gastrointestinal-Tract Retention Times of Microplastics by Freshwater and Marine Fishes. Environ. Pollut. 2022, 304, 119253. [Google Scholar] [CrossRef]
- Bošković, N.; Joksimović, D.; Bajt, O. Microplastics in Mussels from the Boka Kotorska Bay (Adriatic Sea) and Impact on Human Health. Food Chem. Toxicol. 2023, 173, 113641. [Google Scholar] [CrossRef]
- Hossain, M.B.; Banik, P.; Nur, A.A.; Choudhury, T.R.; Liba, S.I.; Albeshr, M.F.; Yu, J.; Arai, T. Microplastics in Fish Culture Ponds: Abundance, Characterization, and Contamination Risk Assessment. Front. Environ. Sci. 2023, 11, 1251158. [Google Scholar] [CrossRef]
- Lestari, P.; Trihadiningrum, Y.; Firdaus, M.; Warmadewanthi, I.D.A.A. Microplastic Pollution in Surabaya River Water and Aquatic Biota, Indonesia. IOP Conf. Ser. Mater. Sci. Eng. 2021, 1143, 012054. [Google Scholar] [CrossRef]
- Alam, F.C.; Sembiring, E.; Muntalif, B.E.; Suendo, V. Microplastic Distribution in Surface Water and Sediment River Around Slum and Industrial Area (Case Study: Ciwalengke River, Majalaya District, Indonesia). Chemosphere 2019, 224, 637–645. [Google Scholar] [CrossRef]
- Fang, C.; Zheng, R.; Chen, H.; Hong, F.; Lin, L.; Lin, H.; Guo, H.; Bailey, C.; Segner, H.; Mu, J.; et al. Comparison of Microplastic Contamination in Fish and Bivalves from Two Major Cities in Fujian Province, China, and the Implications for Human Health. Aquaculture 2019, 512, 734322. [Google Scholar] [CrossRef]
- Patterson, J.; Jeyasanta, K.I.; Sathish, N.; Booth, A.M.; Edward, J.K.P. Profiling Microplastics in the Indian Edible Oyster, Magallana bilineata Collected from the Tuticorin Coast, Gulf of Mannar, Southeastern India. Sci. Total Environ. 2019, 691, 727–735. [Google Scholar] [CrossRef]
- Ding, J.; Li, J.; Sun, C.; He, C.; Jiang, F.; Gao, F.; Zheng, L. Separation and Identification of Microplastics in Digestive System of Bivalves. Chin. J. Anal. Chem. 2018, 46, 690–697. [Google Scholar] [CrossRef]
- Li, J.; Yang, D.; Li, L.; Jabeen, K.; Shi, H. Microplastics in Commercial Bivalves from China. Environ. Pollut. 2015, 207, 190–195. [Google Scholar] [CrossRef] [PubMed]
- Yıbar, A.; Nur Genc, M.; Ceylan, A.; Suzer, B.; Duman, M. Determination of Microplastic and Mold Species in Mussels from the Marmara Sea, Turkey. Acta Veter. Eurasia 2024, 50, 196–209. [Google Scholar]
- Bonello, G.; Varrella, P.; Pane, L. First Evaluation of Microplastic Content in Benthic Filter-Feeders of the Gulf of La Spezia (Ligurian Sea). J. Aquat. Food Prod. Technol. 2018, 27, 284–291. [Google Scholar] [CrossRef]
- Rochman, C.; Tahir, A.; Williams, S.; Baxa, D.V. Anthropogenic Debris in Seafood: Plastic Debris and Fibers from Textiles in Fish and Bivalves Sold for Human Consumption. Sci. Rep. 2015, 5, 14340. [Google Scholar] [CrossRef]
- Ünlü, S.; Alpar, B. Distribution and Sources of Hydrocarbons in Surface Sediments of Gemlik Bay (Marmara Sea, Turkey). Chemosphere 2006, 64, 764–777. [Google Scholar] [CrossRef] [PubMed]
- Urban-Malinga, B.; Zalewski, M.; Jakubowska, A.; Wodzinowski, T.; Malinga, M.; Pałys, B.; Dąbrowska, A. Microplastics on Sandy Beaches of the Southern Baltic Sea. Mar. Pollut. Bull. 2020, 155, 111170. [Google Scholar] [CrossRef]
- Yücedağ, E.; Mülayim, A.; Kecel Gündüz, S. Investigation of Microplastic Pollution in the Sediment and Commercial Fish Species of Gemlik Bay (Marmara Sea) by Microscopic and Spectroscopic Methods. Turk. J. Fish. Aquat. Sci. 2024, 23, 15032. [Google Scholar]
- Lots, F.A.E.; Behrens, P.; Vijver, M.G.; Horton, A.A.; Bosker, T. A Large-Scale Investigation of Microplastic Contamination: Abundance and Characteristics of Microplastics in European Beach Sediment. Mar. Pollut. Bull. 2017, 123, 219–226. [Google Scholar] [CrossRef]
- Terzi, Y.; Oztürk, R.Ç.; Eryaşar, A.R.; Yandı, İ.; Şahin, A.; Yılmaz, F.; Gündoğdu, S. Riverine Microplastic Discharge Along the Southern Black Sea Coast of Turkey. Environ. Res. Lett. 2025, 20, 024061. [Google Scholar] [CrossRef]
- Kye, H.; Kim, J.; Ju, S.; Lee, J.; Lim, C.; Yoon, Y. Microplastics in Water Systems: A Review of Their Impacts on the Environment and Their Potential Hazards. Heliyon 2023, 9, e14359. [Google Scholar] [CrossRef]
- Phaksopa, J.; Sukhsangchan, R.; Keawsang, R.; Tanapivattanakul, K.; Asvakittimakul, B.; Thamrongnawasawat, T.; Worachananant, S. Assessment of Microplastics in Green Mussel (Perna viridis) and Surrounding Environments around Sri Racha Bay, Thailand. Sustainability 2023, 15, 9. [Google Scholar] [CrossRef]
- Choy, C.A.; Robison, B.H.; Gagne, T.O.; Erwin, B.; Firl, E.; Halden, R.U.; Hamilton, J.A.; Katija, K.; Lisin, S.E.; Rolsky, C.; et al. The Vertical Distribution and Biological Transport of Marine Microplastics Across the Epipelagic and Mesopelagic Water Column. Sci. Rep. 2019, 9, 7843. [Google Scholar] [CrossRef] [PubMed]
- Allen, E.; Henninger, C.E.; Wood, J.; Garforth, A.; Asuquo, E. Designing Out Microplastic Pollution Released from Textiles and Apparel During Laundering. Camb. Prism. Plast. 2024, 2, e20. [Google Scholar] [CrossRef]
- European Environment Agency (EEA). Microplastics from Textiles: Towards a Circular Economy for Textiles in Europe. Available online: https://www.eea.europa.eu/publications/microplastics-from-textiles-towards-a (accessed on 27 March 2025).
- Mishra, S.; Rath, C.; Das, A.P. Marine microfiber pollution: A review on present status and future challenges. Mar. Pollut. Bull. 2019, 140, 188–197. [Google Scholar] [CrossRef] [PubMed]
- Athey, S.N.; Erdle, L.M. Are we underestimating anthropogenic microfiber pollution? A critical review of occurrence, methods, and reporting. Environ. Toxicol. Chem. 2022, 41, 822–837. [Google Scholar] [CrossRef]
- Ziani, K.; Ioniță-Mîndrican, C.-B.; Mititelu, M.; Neacșu, S.M.; Negrei, C.; Moroșan, E.; Drăgănescu, D.; Preda, O.-T. Microplastics: A real global threat for environment and food safety: A state of the art review. Nutrients 2023, 15, 617. [Google Scholar] [CrossRef]
- Halpern, S. Sebin Project Tackling Microfibers Head on. Available online: http://www.seabinproject.com/Seabin-Project-Tackling-Microfibers-Head-On (accessed on 27 March 2025).
- Browne, M.A.; Dissanayake, A.; Galloway, T.S.; Lowe, D.M.; Thompson, R.C. Ingested microscopic plastic translocates to the circulatory system of the mussel, Mytilus edulis (L.). Environ. Sci. Technol. 2008, 42, 5026–5031. [Google Scholar] [CrossRef]
- Guzzetti, E.; Sureda, A.; Tejada, S.; Faggio, C. Microplastic in marine organism: Environmental and toxicological effects. Environ. Toxicol. Pharmacol. 2018, 64, 164–171. [Google Scholar] [CrossRef]
- Qiao, R.; Sheng, C.; Lu, Y.; Zhang, Y.; Ren, H.; Lemos, B. Microplastics induce intestinal inflammation, oxidative stress, and disorders of metabolome and microbiome in zebrafish. Sci. Total Environ. 2019, 662, 246–253. [Google Scholar] [CrossRef]
- Manolaki, S.M.; Chatzivasileiou, D.; Lampa, M.; Dimitriou, P.D.; Philippidis, A.; Karakassis, I.; Papageorgiou, N. Microplastic contamination in cultured mussels and pearl oysters in Greece. Microplastics 2023, 2, 168–181. [Google Scholar] [CrossRef]
- Browne, M.A.; Crump, P.; Niven, S.J.; Teuten, E.; Tonkin, A.; Galloway, T.; Thompson, R. Accumulation of microplastic on shorelines worldwide: Sources and sinks. Environ. Sci. Technol. 2011, 45, 9175–9179. [Google Scholar] [CrossRef] [PubMed]
- Browne, M.A.; Underwood, A.J.; Chapman, M.G.; Williams, R.; Thompson, R.C.; van Franeker, J.A. Linking effects of anthropogenic debris to ecological impacts. Proc. Biol. Sci. 2015, 282, 20142929. [Google Scholar] [CrossRef] [PubMed]
- World Health Organization (WHO). Dietary and Inhalation Exposure to Nano-And Microplastic Particles and Potential Implications for Human Health; WHO: Geneva, Switzerland, 2022. [Google Scholar]
- Andrady, A.L. Microplastics in the marine environment. Mar. Pollut. Bull. 2011, 62, 1596–1605. [Google Scholar] [CrossRef]
- Eriksen, M.; Lebreton, L.C.M.; Carson, H.S.; Thiel, M.; Moore, C.J.; Borerro, J.C.; Reisser, J. Plastic pollution in the world’s oceans: More than 5 trillion plastic pieces weighing over 250,000 tons afloat at sea. PLoS ONE 2014, 9, e111913. [Google Scholar] [CrossRef] [PubMed]
- Morrison, M.; Trevisan, R.; Ranasinghe, P.; Merril, G.B.; Santos, J.; Hong, A.; Edward, W.C.; Jayasundara, N.; Somarelli, J.A. A growing crisis for One Health: Impacts of plastic pollution across layers of biological function. Front. Mar. Sci. 2022, 9, 980705. [Google Scholar] [CrossRef]
- Noman, A.; Adyel, T.M.; Trevathan-Tackett, S.; Macreadie, P.I. Plastic paradox in blue carbon ecosystems. Environ. Sci. Technol. 2024, 58, 4469–4475. [Google Scholar] [CrossRef]
- Li, H.-X.; Shi, M.; Tian, F.; Lin, L.; Liu, S.; Hou, R.; Peng, J.-P.; Xu, X.-P. Microplastics contamination in bivalves from the Daya Bay: Species variability and spatio-temporal distribution and human health risks. Sci. Total Environ. 2022, 841, 156749. [Google Scholar] [CrossRef]
- Barboza, L.G.A.; Gimenez, B.C.G. Microplastics in the marine environment: Current trends and future perspectives. Mar. Pollut. Bull. 2015, 97, 5–12. [Google Scholar] [CrossRef]
- Barboza, L.G.A.; Lourenço, S.C.; Aleluia, A.; dos Santos, N.C.L.; Huang, M.; Wang, J.; Guilhermino, L. A global synthesis of microplastic contamination in wild fish species: Challenges for conservation, implications for sustainability of wild fish stocks and future directions. Adv. Mar. Biol. 2023, 94, 159–200. [Google Scholar]
- Catarino, A.I.; Asselman, J.; Khan, F.R.; Everaert, G. Editorial: Plastic Pollution in a Changing Marine Environment: Effects and Risk. Front. Mar. Sci. 2023, 10, 1213393. [Google Scholar] [CrossRef]
- Kibria, G. Global Review and Analysis of the Presence of Microplastics in Fish. Asian Fish. Sci. 2022, 35, 191–256. [Google Scholar] [CrossRef]
- Azoulay, D.; Villa, P.; Arellano, Y.; Gordon, M.; Moon, D.; Miller, K.; Thompson, K. Plastic and Health: The Hidden Costs of a Plastic Planet; Center for International Environmental Law (CIEL): Washington, DC, USA, 2019. [Google Scholar]
- Ragusa, A.; Svelato, A.; Santacroce, C.; Catalano, P.; Notarstefano, V.; Carnevali, O.; Papa, F.; Rongioletti, M.C.A.; Baiocco, F.; Draghi, S.; et al. Plasticenta: First Evidence of Microplastics in Human Placenta. Environ. Int. 2021, 146, 106274. [Google Scholar] [CrossRef] [PubMed]
- Hwang, J.; Choi, D.; Han, S.; Jung, S.Y.; Choi, J.; Hong, J. Potential Toxicity of Polystyrene Microplastic Particles. Sci. Rep. 2020, 10, 7391. [Google Scholar] [CrossRef] [PubMed]
- Nie, H.; Wang, J.; Xu, K.; Huang, Y.; Yan, M. Microplastic Pollution in Water and Fish Samples Around Nanxun Reef in Nansha Islands, South China Sea. Sci. Total Environ. 2019, 696, 134022. [Google Scholar] [CrossRef] [PubMed]
- Zhu, L.; Bai, H.; Chen, B.; Sun, X.; Qu, K.; Xia, B. Microplastic Pollution in North Yellow Sea, China: Observations on Occurrence, Distribution and Identification. Sci. Total Environ. 2018, 636, 20–29. [Google Scholar] [CrossRef] [PubMed]
- Andrady, A.L. The Plastic in Microplastics: A Review. Mar. Pollut. Bull. 2017, 119, 12–22. [Google Scholar] [CrossRef]
- Tripathi, D.; Ebrary, I. Practical Guide to Polypropylene; Rapra Technology Limited: Shrewsbury, UK, 2002. [Google Scholar]
- Multisanti, C.R.; Merola, C.; Perugini, M.; Aliko, V.; Faggio, C. Sentinel Species Selection for Monitoring Microplastic Pollution: A Review on One Health Approach. Ecol. Indic. 2022, 145, 109587. [Google Scholar] [CrossRef]
- Harris, N.L.; Gibbs, D.A.; Baccini, A.; Birdsey, R.A.; de Bruin, S.; Farina, M.; Fatoyinbo, L.; Hansen, M.C.; Herold, M.; Houghton, R.A.; et al. Global Maps of Twenty-First Century Forest Carbon Fluxes. Nat. Clim. Chang. 2021, 11, 234–240. [Google Scholar] [CrossRef]
- Digka, N.; Tsangaris, C.; Torre, M.; Anastasopoulou, A.; Zeri, C. Microplastics in Mussels and Fish from the Northern Ionian Sea. Mar. Pollut. Bull. 2018, 135, 30–40. [Google Scholar] [CrossRef]
- Zhang, H. Transport of Microplastics in Coastal Seas. Estuar. Coast. Shelf Sci. 2017, 199, 74–86. [Google Scholar] [CrossRef]
- Oehlmann, J.; Schulte-Oehlmann, U. Endocrine Disruption in Invertebrates. Pure Appl. Chem. 2003, 75, 2207–2218. [Google Scholar] [CrossRef]
- Hongsawat, P.; Thinjong, W.; Chouychai, B.; Punyapalakul, P.; Prarat, P. Microplastics in Retail Shellfish from a Seafood Market in Eastern Thailand: Occurrence and Risks to Human Food Safety. Mar. Pollut. Bull. 2024, 201, 116228. [Google Scholar] [CrossRef]
- Aakre, I.; Næss, S.; Kjellevold, M.; Markhus, M.W.; Alvheim, A.R.; Dalane, J.Ø.; Kielland, E.; Dahl, L. New Data on Nutrient Composition in a Large Selection of Commercially Available Seafood Products and Its Impact on Micronutrient Intake. Food Nutr. Res. 2019, 63, 3573. [Google Scholar] [CrossRef]
- Ding, J.; Sun, Y.; He, C.; Li, J.; Li, F. Towards Risk Assessments of Microplastics in Bivalve Mollusks Globally. J. Mar. Sci. Eng. 2022, 10, 288. [Google Scholar] [CrossRef]
- Garrido Gamarro, E.; Costanzo, V. Microplastics in Food Commodities—A Food Safety Review on Human Exposure through Dietary Sources. Food Safety and Quality Series No. 18; FAO: Rome, Italy, 2022. [Google Scholar] [CrossRef]
- Abelouah, M.R.; Romdhani, I.; Ben-Haddad, M.; Hajji, S.; De-la-Torre, G.E.; Gaaied, S.; Barra, I.; Banni, M.; Ait Alla, A. Binational Survey Using Mytilus galloprovincialis as a Bioindicator of Microplastic Pollution: Insights into Chemical Analysis and Potential Risk on Humans. Sci. Total Environ. 2023, 870, 161894. [Google Scholar] [CrossRef]
- Ferreira, O.; Barboza, L.G.A.; Rudnitskaya, A.; Moreirinha, C.; Vieira, L.R.; Botelho, M.J.; Vale, C.; Fernandes, J.O.; Cunha, S.; Guilhermino, L. Microplastics in Marine Mussels, Biological Effects and Human Risk of Intake: A Case Study in a Multi-Stressor Environment. Mar. Pollut. Bull. 2023, 197, 115704. [Google Scholar] [CrossRef] [PubMed]
- Trani, A.; Mezzapesa, G.; Piscitelli, L.; Mondelli, D.; Nardelli, L.; Belmonte, G.; Toso, A.; Piraino, S.; Panti, C.; Baini, M.; et al. Microplastics in Water Surface and in the Gastrointestinal Tract of Target Marine Organisms in Salento Coastal Seas (Italy, Southern Puglia). Environ. Pollut. 2023, 316 Pt 1, 120702. [Google Scholar] [CrossRef]
- Expόsito, N.; Rovira, J.; Sierra, J.; Gimenez, G.; Domingo, J.L.; Schuhmacher, M. Levels of Microplastics and Their Characteristics in Molluscs from North-West Mediterranean Sea: Human Intake. Mar. Pollut. Bull. 2022, 181, 113843. [Google Scholar] [CrossRef] [PubMed]
- Vital, S.A.; Cardoso, C.; Avio, C.; Pittura, L.; Regoli, F.; Bebianno, M.J. Do Microplastic Contaminated Seafood Consumption Pose a Potential Risk to Human Health? Mar. Pollut. Bull. 2021, 171, 112769. [Google Scholar] [CrossRef]
- Gündoğdu, S.; Çevik, C.; Ataş, N.T. Stuffed with Microplastics: Microplastic Occurrence in Traditional Stuffed Mussels Sold in the Turkish Market. Food Biosci. 2020, 37, 100715. [Google Scholar] [CrossRef]
- Monfort, M.C. The European Market for Mussels. Globefish Res. Progr. 2014, 115, 2014. [Google Scholar]
- Renzi, M.; Guerranti, C.; Blašković, A. Microplastic Contents from Maricultured and Natural Mussels. Mar. Pollut. Bull. 2018, 131, 248–251. [Google Scholar] [CrossRef] [PubMed]
- Cox, K.D.; Covernton, G.A.; Davies, H.L.; Dower, J.F.; Juanes, F.; Dudas, S.E. Human Consumption of Microplastics. Environ. Sci. Technol. 2019, 53, 7068–7074. [Google Scholar] [CrossRef]
- Nor, H.M.N.; Merel, K.; Noël, J.D.; Koelmans, A.A. Lifetime Accumulation of Microplastic in Children and Adults. Environ. Sci. Technol. 2021, 55, 5084–5096. [Google Scholar]
- USEPA. Recommended Use of BW3/4 as the Default Method in Derivation of the Oral Reference Dose. Available online: https://www.epa.gov/sites/default/files/2013-09/documents/recommended-use-of-bw34.pdf (accessed on 25 March 2025).
- Terrazas-López, R.; Guadarrama-Guzman, P.; Sujitha, S.B.; Arreola-Mendoza, L.; Ponniah, J.M. The Occurrence of Microplastics in the Marine Food Web in Latin America: Insights on the Current State of Knowledge and Future Perspectives. Sustainability 2024, 16, 5905. [Google Scholar] [CrossRef]
- FAO. FAO Aquaculture Newsletter. No. 57 (September); FAO: Rome, Italy, 2017. [Google Scholar]
- Pletz, M. Ingested Microplastics: Do Humans Eat One Credit Card per Week? J. Hazard. Mater. Lett. 2022, 3, 100071. [Google Scholar] [CrossRef]
- Senathirajah, K.; Attwood, S.; Bhagwat, G.; Carbery, M.; Wilson, S.; Palanisami, T. Estimation of the Mass of Microplastics Ingested—A Pivotal First Step Towards Human Health Risk Assessment. J. Hazard. Mater. 2021, 404, 124004. [Google Scholar] [CrossRef]
- Van Cauwenberghe, L.; Janssen, C.R. Microplastics in Bivalves Cultured for Human Consumption. Environ. Pollut. 2014, 193, 65–70. [Google Scholar] [CrossRef]
- Ding, J.; Sun, C.; Li, J.; Shi, H.; Xu, X.; Ju, P.; Jiang, F.; Li, F. Microplastics in Global Bivalve Mollusks: A Call for Protocol Standardization. J. Hazard. Mater. 2022, 438, 129490. [Google Scholar] [CrossRef]
- Barboza, L.G.A.; Otero, X.L.; Guilhermino, L. Microplastic Contamination in Marine Mussels from the Atlantic Coast of North Portugal and Human Risk of Microplastic Intake through Mussel Consumption. Environ. Pollut. 2024, 352, 124133. [Google Scholar] [CrossRef]
- Rist, S.; Carney Almroth, B.; Hartmann, N.B.; Karlsson, T.M. A Critical Perspective on Early Communications Concerning Human Health Aspects of Microplastics. Sci. Total Environ. 2018, 626, 720–726. [Google Scholar] [CrossRef] [PubMed]
- Wang, Q.; Enyoh, C.E.; Chowdhury, T.; Chowdhury, M.A.H. Analytical Techniques, Occurrence and Health Effects of Micro and Nano Plastics Deposited in Street Dust. Int. J. Environ. Anal. Chem. 2022, 102, 6435–6453. [Google Scholar] [CrossRef]
| No | Stations’ Names | Height (cm) | Length (cm) | Width (cm) | Frequency of MP (%) | Items/g | Items/ind |
|---|---|---|---|---|---|---|---|
| 1 | Florya S | 4.7 ± 0.1 | 2.5 ± 0.2 | 1.8 ± 0.2 | 100 | 1.8 | 3 |
| 1 | Florya L | 5.5 ± 0.3 | 2.8 ± 0.3 | 2.1 ± 0.1 | 100 | 2.43 | 4.14 |
| 2 | M. Ereğlisi L | 5.1 ± 0.1 | 2.8 ± 0.3 | 1.7 ± 0.3 | 100 | 3.21 | 4 |
| 3 | Tekirdağ S | 4.5 ± 0.4 | 2.4 ± 0.2 | 1.6 ± 0.2 | 100 | 2.81 | 3 |
| 3 | Tekirdağ L | 5.8 ± 0.4 | 2.9 ± 0.2 | 2.2 ± 0.2 | 100 | 1.13 | 3.29 |
| 4 | Gelibolu S | 4.3 ± 0.4 | 2.4 ± 0.2 | 1.7 ± 0.2 | 100 | 3.34 | 4 |
| 5 | Burhanlı S | 4.7 ± 0.2 | 2.5 ± 0.2 | 2.1 ± 0.2 | 100 | 3.47 | 5 |
| 5 | Burhanlı | 5.5 ± 0.2 | 3.1 ± 0.3 | 2.3 ± 0.3 | 100 | 2.82 | 6.25 |
| 6 | Bigalı S | 4.2 ± 0.4 | 2.4 ± 0.2 | 1.6 ± 0.1 | 100 | 2.97 | 3.86 |
| 6 | Bigalı L | 5.8 ± 0.5 | 3.2 ± 0.3 | 2.2 ± 0.3 | 100 | 2.33 | 5.38 |
| 7 | Kumkale S | 4.2 ± 0.4 | 2.3 ± 0.2 | 1.6 ± 0.2 | 100 | 5.17 | 4.31 |
| 8 | Çardak S | 4.5 ± 0.3 | 2.7 ± 0.3 | 4.7 ± 0.2 | 100 | 1.11 | 2.14 |
| 9 | Kemer S | 4.6 ± 0.3 | 2.4 ± 0.1 | 1.6 ± 0.1 | 100 | 1.49 | 1.92 |
| 9 | Kemer L | 5.5 ± 0.3 | 2.8 ± 0.2 | 2 ± 0.2 | 100 | 2.25 | 4 |
| 10 | Erdek S | 4.1 ± 0.7 | 2.5 ± 0.5 | 1.5 ± 0.4 | 100 | 2.65 | 4.71 |
| 10 | Erdek L | 6.9 ± 0.6 | 3.6 ± 0.3 | 2.7 ± 0.2 | 100 | 1.26 | 5.13 |
| 11 | Turan V. S. | 4 ± 0.3 | 2.3 ± 0.2 | 1.4 ± 0.1 | 100 | 0.84 | 0.88 |
| 12 | Yenice S | 4.4 ± 0.4 | 2.6 ± 0.2 | 1.7 ± 0.2 | 100 | 4.7 | 6.8 |
| 12 | Yenice L | 5.9 ± 0.3 | 3.2 ± 0.2 | 2.3 ± 0.3 | 100 | 2.86 | 6.82 |
| 13 | Kurşunlu S | 4.2 ± 0.2 | 2.4 ± 0.1 | 1.5 ± 0.1 | 100 | 2.27 | 2.31 |
| 13 | Kurşunlu L | 6.6 ± 0.5 | 3.3 ± 0.3 | 2.6 ± 0.2 | 100 | 1.39 | 4 |
| 14 | B. Kumla S | 4.2 ± 0.2 | 2.3 ± 0.2 | 1.5 ± 0.2 | 100 | 2.64 | 3.5 |
| 14 | B. Kumla L | 5.5 ± 0.5 | 2.9 ± 0.2 | 2 ± 0.4 | 100 | 1.8 | 5.4 |
| 15 | Yalova S | 4.8 ± 0.2 | 2.5 ± 0.2 | 1.7 ± 0.2 | 100 | 1.65 | 1.85 |
| 16 | K. Mürsel S | 4.6 ± 0.2 | 2.6 ± 0.2 | 1.6 ± 0.2 | 100 | 1.34 | 2.67 |
| 16 | K. Mürsel L | 5.8 ± 0.4 | 3.1 ± 0.2 | 2.1 ± 0.3 | 100 | 1 | 2.65 |
| 17 | Başiskele S | 4.7 ± 0.2 | 2.6 ± 0.2 | 1.6 ± 0.1 | 100 | 1.7 | 2.8 |
| 17 | Başiskele L | 5.7 ± 0.4 | 3 ± 0.3 | 2 ± 0.3 | 100 | 1.1 | 2.8 |
| 18 | Beykoz L | 6.9 ± 0.4 | 3.6 ± 0.2 | 2.5 ± 0.2 | 100 | 1.05 | 2.5 |
| No | Stations’ Names | Regions | CF | PLI | ||
|---|---|---|---|---|---|---|
| 1 | Florya S | North Shelf | 2.14 | 2.67 | ||
| 1 | Florya L | 2.89 | ||||
| 2 | M. Ereğlisi L | 3.82 | ||||
| 3 | Tekirdağ S | 3.35 | ||||
| 3 | Tekirdağ L | 1.35 | ||||
| 4 | Gelibolu S | Çanakkale Strait | 3.98 | 3.28 | ||
| 5 | Burhanlı S | 4.13 | ||||
| 5 | Burhanlı L | 3.36 | ||||
| 6 | Bigalı S | 3.54 | ||||
| 6 | Bigalı L | 2.77 | ||||
| 7 | Kumkale S | 6.15 | ||||
| 8 | Çardak S | 1.32 | ||||
| 9 | Kemer S | South Shelf | 1.77 | 3.09 | ||
| 9 | Kemer L | 2.68 | ||||
| 10 | Erdek S | 3.15 | ||||
| 10 | Erdek L | 1.50 | ||||
| 12 | Yenice S | 7.98 | ||||
| 12 | Yenice L | 3.40 | ||||
| 13 | Kurşunlu S | Gemlik Bay | 2.70 | 2.24 | ||
| 13 | Kurşunlu L | 1.65 | ||||
| 14 | B. Kumla S | 3.14 | ||||
| 14 | B. Kumla L | 2.14 | ||||
| 15 | Yalova S | 1.96 | ||||
| 16 | K. Mürsel S | Gulf of Izmit | 1.60 | 1.32 | ||
| 16 | K. Mürsel L | 1.19 | ||||
| 17 | Başiskele S | 2.02 | ||||
| 17 | Başiskele L | 1.31 | ||||
| 18 | Beykoz L | 1.25 | ||||
| Risk Category | Low (I) | Moderate (II) | High (III) | Very High (IV) | Dangerous (V) | |
| Contamination Factor (CF) | <1 | 1–3 | 3–6 | >6 | ||
| Pollution Load Index (PLI) | <1 | 1–3 | 3–4 | 4–5 | >5 | |
| Risk Groups (MP/year) | References | |||||
|---|---|---|---|---|---|---|
| Location | Regions | MPs/g | Children | Adolescents | Adults | |
| North Portugal | Carreço | 0.71 | 874 | 324 | 1298 | [155] |
| North Portugal | Moledo | 0.39 | 1576 | 585 | 2342 | [155] |
| North Portugal | Estela | 0.14 | 458 | 170 | 680 | [155] |
| North Portugal | Cabedeb | 0.66 | 1180 | 438 | 1754 | [155] |
| North Portugal | Tavira | 1.00 | 2223 | 825 | 3303 | [142] |
| North Portugal | Lagos | 1.05 | 2334 | 866 | 3568 | [142] |
| North Portugal | Faro | 0.45 | 1000 | 371 | 1486 | [142] |
| North Portugal | Vila Real de Santo Antonio | 0.44 | 978 | 363 | 1453 | [142] |
| North Portugal | Olhao | 0.56 | 1245 | 462 | 1850 | [142] |
| North Portugal | Vilamoura | 1.29 | 2867 | 866 | 3468 | [142] |
| Italy | San Foca | 0.11 | - | 1935 | 823 | [140] |
| Italy | Taranto | 0.54 | - | 9412 | 4001 | [140] |
| Italy | Porto Cesareo | 0.09 | - | 1495 | 636 | [140] |
| Spain | Catalan coast | 6.47 | 12,634 | 14,972 | 6825 | [140] |
| Türkiye, SoM | İstanbul Strait | 8.45 | - | - | 844.86 | [31] |
| Türkiye, SoM | Çanakkale Strait | 7.65 | - | - | 764.93 | [31] |
| Türkiye, Aegean Sea | İzmir Bay | 3.90 | - | - | 70.82 | [33] |
| Türkiye, SoM | Çanakkale Strait | 3.03 | 933.94 | 158.22 | 18.74 | This study |
| Türkiye, SoM | North Shelf | 2.28 | 700.45 | 124.31 | 14.73 | This study |
| Türkiye, SoM | South Shelf | 2.87 | 892.95 | 127.16 | 15.07 | This study |
| Türkiye, SoM | Gemlik Bay | 2.03 | 633.44 | 96.87 | 11.48 | This study |
| Türkiye, SoM | Gulf of İzmit | 1.36 | 440.32 | 65.69 | 7.78 | This study |
Disclaimer/Publisher’s Note: The statements, opinions and data contained in all publications are solely those of the individual author(s) and contributor(s) and not of MDPI and/or the editor(s). MDPI and/or the editor(s) disclaim responsibility for any injury to people or property resulting from any ideas, methods, instructions or products referred to in the content. |
© 2025 by the author. Licensee MDPI, Basel, Switzerland. This article is an open access article distributed under the terms and conditions of the Creative Commons Attribution (CC BY) license (https://creativecommons.org/licenses/by/4.0/).
Share and Cite
Balcıoğlu İlhan, E.B. A Comprehensive Identification, Distribution and Health Risk Assessment of Microplastics in Natural Mussels from the Shoreline of the Sea of Marmara, Türkiye. Sustainability 2025, 17, 4731. https://doi.org/10.3390/su17104731
Balcıoğlu İlhan EB. A Comprehensive Identification, Distribution and Health Risk Assessment of Microplastics in Natural Mussels from the Shoreline of the Sea of Marmara, Türkiye. Sustainability. 2025; 17(10):4731. https://doi.org/10.3390/su17104731
Chicago/Turabian StyleBalcıoğlu İlhan, Esra Billur. 2025. "A Comprehensive Identification, Distribution and Health Risk Assessment of Microplastics in Natural Mussels from the Shoreline of the Sea of Marmara, Türkiye" Sustainability 17, no. 10: 4731. https://doi.org/10.3390/su17104731
APA StyleBalcıoğlu İlhan, E. B. (2025). A Comprehensive Identification, Distribution and Health Risk Assessment of Microplastics in Natural Mussels from the Shoreline of the Sea of Marmara, Türkiye. Sustainability, 17(10), 4731. https://doi.org/10.3390/su17104731