Article

Spatiotemporal Dynamics and Optimization Management of Ecosystem Service Flows in the Yangtze River Delta Urban Agglomeration, China

by
Huilan Jia
and
Hongmin Chen
*
Department of Environmental Science and Engineering, Fudan University, Shanghai 200438, China
*
Author to whom correspondence should be addressed.
Sustainability 2025, 17(10), 4727; https://doi.org/10.3390/su17104727
Submission received: 8 April 2025 / Revised: 13 May 2025 / Accepted: 19 May 2025 / Published: 21 May 2025
(This article belongs to the Special Issue Advances in Ecosystem Services and Urban Sustainability, 2nd Edition)

Abstract

:
Ecosystem service flow (ESF) provides a new perspective for understanding the spatial transfer of ecosystem services across urban administrative boundaries, which is of significant importance for optimizing the regional ecological resource allocation. Taking the Yangtze River Delta (YRD) urban agglomeration as a case study, this study analyzed the spatiotemporal evolution characteristics of the ecosystem service value (ESV) and ESF in 41 cities of the region from 2000 to 2020, combining the modified equivalence factor method and the breaking-point model. It also revealed the regional division and evolution patterns of per area ESV and per capita GDP based on ESF in the YRD. The results showed that from 2000 to 2020, the overall ESV in the YRD exhibited a declining trend, with a spatial distribution showing higher values in the south and lower values in the north. Forest contributed over 50% of total ESV, while the value of hydrological regulation services consistently held the largest proportion and contributed the most significant growth. The overall decline in ESF was only 0.6%, with more than 70% of the flow occurring within provincial boundaries. Hangzhou, Taizhou (Zhejiang), and Chuzhou had the highest net outflows, while Jinhua, Changzhou, and Taizhou (Jiangsu) led in net inflows. The number of service-providing areas (SPAs) and service beneficiary areas (SBAs) remained relatively stable. Furthermore, a four-quadrant framework based on ESF, per area ESV, and per capita GDP was constructed, showing that the cities in the YRD mainly shifted between Quadrants I, II, and IV, with several cities transitioning from Quadrant III to II. Based on these findings, optimized management strategies for the coordinated economic-ecological development of the YRD are proposed.

1. Introduction

The concept of ecosystem services originated in the field of ecology [1]. Early research primarily focused on the structures, attributes, functions, or value of ecosystems, treating them purely as objective environmental conditions and processes that sustain human life [2,3]. Subsequent studies gradually emphasized the importance of human needs, suggesting that ecosystem services as the natural components that both generate and consume human well-being [4]. As urbanization accelerates, human activities have profoundly altered patterns and processes of ecosystems, leading to issues such as reduced ecological land, habitat degradation, and a decrease in the supply capacity of ecosystem services [5,6,7]. Meanwhile, the growing population and increasing demand for a better quality of life have led to a greater need for services such as climate regulation, water conservation, and soil conservation. The decline in the supply capacity of ecosystem services and the rising demand for human well-being have resulted in an imbalance and mismatch between the supply and demand of ecosystem services, both in terms of quantity and space, hindering the high-quality sustainable regional development [8,9,10].
On the other hand, as research has progressed, scholars have gradually realized that there is a heterogeneous distribution of ecosystem service supply and demand across geographic spaces. Ecosystem services do not exist statically but undergo processes of transfer, shift, and flow within certain spatiotemporal boundaries, thereby exerting their service functions elsewhere [11,12]. The mobility of ecosystem services implies that urban residents’ ecological well-being is not only related to the local ecosystem space and resource allocation but also benefits from the optimized ecological space and resource allocation across the entire region. Therefore, to more effectively meet the ecological well-being of residents, it is necessary to promote the optimization of ecological spaces and resources from a regional urban collaborative perspective. However, current ecological space management and ecological assessments based on administrative boundaries overlook the impact of the mobility of ecosystem services on the ecological carrying capacity of different cities and residents’ ecological well-being, which may lead to resource misallocation and an imbalance of responsibilities and authorities. Therefore, it is essential to incorporate the mobility of ecosystem services into the consideration of ecological space, agricultural space, and urban space management and optimization.
Over the past decade, academic research has increasingly adopted the concept of “ecosystem service flow” (ESF) to describe the process through which ecosystem services are realized across different locations [13,14,15]. ESF connects natural ecosystems with human social systems and explores the spatial transfer process of ecosystem services from supply areas to demand areas [16]. This has, to some extent, advanced previous research by breaking through the narrow boundaries of biophysical and administrative boundaries, evolving towards cross-regional coordinated development [17,18,19]. Shakya et al. visualized ESF in the eastern Himalayas between China, India, and Myanmar [20]. Bagstad et al. quantitatively analyzed ESF variations during the migration of species such as the Northern Pintail and the Black-veined White Butterfly across the Americas [21]. Liu et al. analyzed the spatial transfer path of food production service flows in the Pearl River Delta based on the food supply-demand ratio [22]. Similarly, Lin et al. analyzed the impact of urbanization on freshwater supply and demand changes in the Daijiang River basin in Fujian [23]. However, there is still no unified consensus on the basic concepts of ESF, such as its definition, connotations, scope, and types [24,25]. Existing empirical studies predominantly focus on natural geographical units such as watersheds, plateaus, and mountains [26,27,28,29], or on single factors, such as flows like water flow, food flow, and other tangible service flows [30,31,32,33]. Existing research remains limited in explaining the spatial transmission of comprehensive ecosystem service flows between cities, and further exploration from both theoretical and practical perspectives is needed.
China has comprehensively promoted ecological civilization in recent years, achieving significant progress in land spatial function zoning, the delineation of ecological protection red lines, and the realization of ecological product value. The YRD urban agglomeration, one of China’s most economically developed regions, has pioneered promoting regional integration and development and served as a frontier in advancing the modernization of harmonious coexistence between humans and nature. Although the YRD urban agglomeration has largely achieved the free flow of labor, capital, and other factors, as well as regional optimization, the cross-regional optimization of ecological factors still faces certain obstacles, with a lack of interregional coordinated management [26,34,35]. Therefore, research into ESF could provide an ideal case and policy directions for the cross-regional optimization of ecological factors in the YRD urban agglomeration. Therefore, this study mainly explores the following two questions: (1) How do ecosystem services spatially flow between different cities within the YRD urban agglomeration, and which cities function as supply and demand areas for ecosystem services? (2) How can we comprehensively consider the impact of ecosystem service flows and promote the cross-regional optimization of ecological resources in the YRD urban agglomeration while forming corresponding policy guidance?

2. Materials and Methods

2.1. Study Area

The Yangtze River Delta (YRD), located in the downstream region of China’s Yangtze River (114°54′–123°10′ E, 27°02′–35°20′ N), is an alluvial plain formed before the Yangtze River flows into the Yellow Sea and the East China Sea, adjacent to the Yellow Sea and East China Sea. The total area of the YRD covers approximately 358,000 km2, including the entire territories of Shanghai, Jiangsu, Zhejiang, and Anhui provinces, with 41 prefecture-level cities and 306 districts and counties, as shown in Figure 1. In 2020, the GDP of the three provinces and one municipality in the YRD reached CNY 24.47 trillion, accounting for 24.1% of the national GDP. At the same time, the region had an average population density of 657 persons/km2, approximately 4.5 times the China’s national average, making it a highly urbanized area. YRD had a total population of approximately 235 million. Among the sub-regions, Jiangsu had around 84.75 million people, Zhejiang 64.57 million, Anhui 61.03 million, and Shanghai 24.87 million. Cropland is the primary land use type in the YRD, accounting for 47.1% in 2020, followed by forest, construction land, water, grassland, and unused land, which account for 28.3%, 13.7%, 7.5%, 3.3%, and 0.1%, respectively.

2.2. Data Sources

This study utilized datasets from three time periods: 2000, 2010, and 2020. The data sources were as follows: (1) Land use data, sourced from the Resource and Environmental Science and Data Center, Chinese Academy of Sciences (http://www.resdc.cn) (accessed on 10 May 2024), with a spatial resolution of 30 m. Unified quality control and verification were conducted using field survey data. Accuracy validation was performed in 10% of counties, and the overall classification accuracy for the three periods exceeded 93%. Using techniques such as mask extraction, grid projection, and spatial statistics, land use types were reclassified into six major categories: cropland, forest, grassland, water, construction land, and unused land. (2) Basic geographic information data, including administrative boundary data, were sourced from the National Geographical Information System (NGIS) official website, which provides vector maps of the administrative divisions of the 41 cities in the YRD. (3) Statistical data, including GDP and population data from the China Statistical Yearbook, as well as economic and social development statistical bulletins for Anhui, Jiangsu, Shanghai, and Zhejiang provinces, and the National Agricultural Product Cost-Benefit Survey data.

2.3. Research Methods

2.3.1. Calculating the ESV

In 2005, the Millennium Ecosystem Assessment (MEA) proposed a classification system for ecosystem services based on their functional benefits: “Provisioning-Supporting-Regulating-Cultural” services [36]. Costanza et al. first proposed a method for evaluating the value of ecosystem services in 1997 [37]. To adapt this method to China, Xie et al. developed a set of ecosystem service value equivalence factors for China based on surveys of over 700 experts [38]. In 2015, Xie et al. revised and supplemented the equivalence factor table based on existing research and spatiotemporal biomass distribution data, thereby providing a comprehensive and objective approach for dynamic ESV assessment in China [39]. Currently, the equivalent factor method has been recognized by scholars and is frequently applied in research [40,41,42,43].
The calculation of ESV consisted of three steps. First, representative major food crops—including early rice, middle rice, late rice, maize, wheat, and soybeans in the YRD—were selected. The annual sowing areas and related economic output values of these crops are used as the basis to calculate the economic value of the standard equivalence factor. The value of a standard equivalence factor is equivalent to 1/7 of the economic value of food production per hectare in the agricultural ecosystem of the region [37]. To eliminate the impact of inflation, the consumer price index (CPI) for food is introduced to adjust the market prices of food crops in each year to a uniform price level [44]. The formula is as follows:
D n = D n × λ
D n = 1 7 × P i × Q i
λ = α n α 0
where D n represents the ESV per unit area of land (CNY/hm2); n refers to the study region (Jiangsu, Zhejiang, Anhui, Shanghai); P i is the average market price of food per unit area in the study area n (CNY/kg); Q i denotes the average yield per unit area of food in the study area n (kg/hm2); α n is the current year’s food Consumer Price Index (CPI); and α 0 is the base-year food CPI.
Secondly, referring to equivalent factor table revised by Xie et al. [39], this study adjusts the ecosystem service value equivalence table for the YRD urban agglomeration, this study selected four primary service types (provisioning, regulating, supporting, and cultural services) and nine specific evaluation indicators (food production, raw material production, gas regulation, climate regulation, hydrological regulation, waste disposal, soil conservation, biodiversity, and aesthetic landscape) based on the current situation of the YRD urban agglomeration.
Finally, the nine ESVs were calculated separately and summed, as follows:
E S V = s = 1 9 k = 1 8 D n × B s , k × A k
where ESV is the total of nine ESVs (CNY); B denotes the equivalent factor of ecosystem service per unit area; A represents the area of each land-cover type; S is the type of ecosystem service; and K indicates the land type.

2.3.2. Calculating the ESF

Ecosystem services are spatially mobile, and the amount of value transferred tends to decay as the distance from the SPA increases. To compare the utility of ecosystem services in external regions, this study employed the breaking-point theory proposed by Converse, where the attractiveness between two cities is related to their scale and distance [45]. This theory has been widely applied to analyze urban economic radiation [46]. Recently, the breaking-point model has also been adopted in studies of interregional ESF [47,48,49,50,51].
Firstly, the method calculates the transfer radius of ecosystem services from the SPA and simulates the radiation range of ecosystem services from SPA to SBA using a buffering function. The formula is as follows:
d j = D i j 1 + m j / m i
where d j is the radiation distance of ecosystem services from region i to region j (km); D i j is the shortest straight-line distance between region i and region j ; m i and m j are ESV of regions i and j , respectively.
Secondly, the SPA radiation area was defined as a circle centered at the geometric center with the radiation distance as the radius, representing the radiation capability of ecosystem services. The average radiation intensity of ecosystem services transferred from SPA to SBA was calculated using the field-strength model [45,52]. The formula is as follows:
F i j = m i D i j 2
where F i j represents the average radiation intensity of ecosystem services from region i to region j ; other symbols are as previously defined.
Finally, ESF was calculated based on the radiation range and the average radiation intensity between regions. The formula is as follows:
E i j = F i j × A t × α
where E i j is the ESF from region i to region j (CNY); A t is the radiation area of region i , which is the intersection area between the SPA radiation zone and SBA; α is the parameter for spatial value transfer, set as 0.6 [53].

3. Results

3.1. ESV

From 2000 to 2020, the ESV of the YRD urban agglomeration exhibited a “rapid-then-slow” pattern of decline. From 2000 to 2010, the region experienced a phase of rapid decrease, with the total ESV dropping sharply from CNY 2633.69 billion in 2000 to CNY 2608.71 billion in 2010—a reduction of CNY 24.98 billion. This was mainly attributed to the one-way conversion of high-value land types such as cropland and forest into construction land. Their combined contribution rate of these two land types dropped from 77.2% in 2000 to 75.4% in 2010 (Figure 2). From 2010 to 2020, the rate of decline significantly slowed, with a total reduction of CNY 13.16 billion, narrowing the decline to just 0.5%. This improvement was primarily due to an increase in water and a deceleration in the expansion of construction land. In terms of service functions, six types of services—food production, raw material production, gas regulation, climate regulation, soil conservation, and biodiversity—continued to shrink during the study period, with a cumulative reduction of CNY 43.12 billion. Among these, food production services experienced the largest decline, at 6.7%. Conversely, three types of services—hydrological regulation, waste disposal, and aesthetic landscape—increased against the overall trend, rising by CNY 7.32 billion, 0.55 billion, and 1.27 billion, respectively. In 2020, hydrological regulation ranked first in ESV by function, accounting for 19.2% of the total, an increase of 1.4 percentage points compared to 2000, becoming the core driver of ESV growth. In terms of land types, the YRD presents the general characteristics of “dominated by forest, shrinking cropland and supported by water”. Forest consistently remained the dominant contributor to ESV, maintaining a share of over 50%. Meanwhile, the share of cropland decreased by 2.0%, while the share of water increased by 1.8% and the water ESV increased by 6.9%, partially mitigating the pressure from the loss of cropland.
At the provincial level, all four administrative divisions—Anhui, Jiangsu, Shanghai, and Zhejiang—exhibited declining trends in ESV, with varying degrees of reduction. In Anhui Province, the ESV decreased from CNY 931.16 billion in 2000 to CNY 918.96 billion in 2020, representing a cumulative decline of 1.3%. The rate of decline gradually slowed over time, primarily due to the compensatory increase in water ESV that offset part of the cropland loss. However, continued contraction of cropland still contributed to the overall ESV reduction. In Jiangsu Province, the ESV fell from CNY 604.29 billion to CNY 598.58 billion, a 0.9% decline characterized by slow but persistent contraction. This was mainly driven by the large-scale expansion of construction land, which led to a combined loss of CNY 31.39 billion in the service value of cropland and forest. The southern Jiangsu urban agglomeration was particularly affected by construction land encroachment. Shanghai experienced the sharpest drop in ESV (16.3%) as high-intensity construction land expansion reduced cropland by 26.7%, accounting for 37.2% of the city’s total ESV loss. Zhejiang Province consistently held the highest ESV in the YRD, with a marginal decline from CNY 1055.77 billion to CNY 1042.43 billion (1.3%) over the 20-year period. Notably, the decline narrowed to just 0.2‰ between 2010 and 2020, indicating a trend toward stabilization, largely due to increases in water ESV that mitigated the negative impacts of construction land expansion in the Hangzhou–Ningbo metropolitan area. Overall, the changes in ESV across the three provinces and one municipality reflect distinct regional dynamics. Anhui Province and Zhejiang Province experienced a slower rate of ESV decline due to ecological restoration efforts supported by their natural endowments, whereas Jiangsu Province and Shanghai faced continued ESV reduction as a result of sustained ecological space compression driven by economic agglomeration.
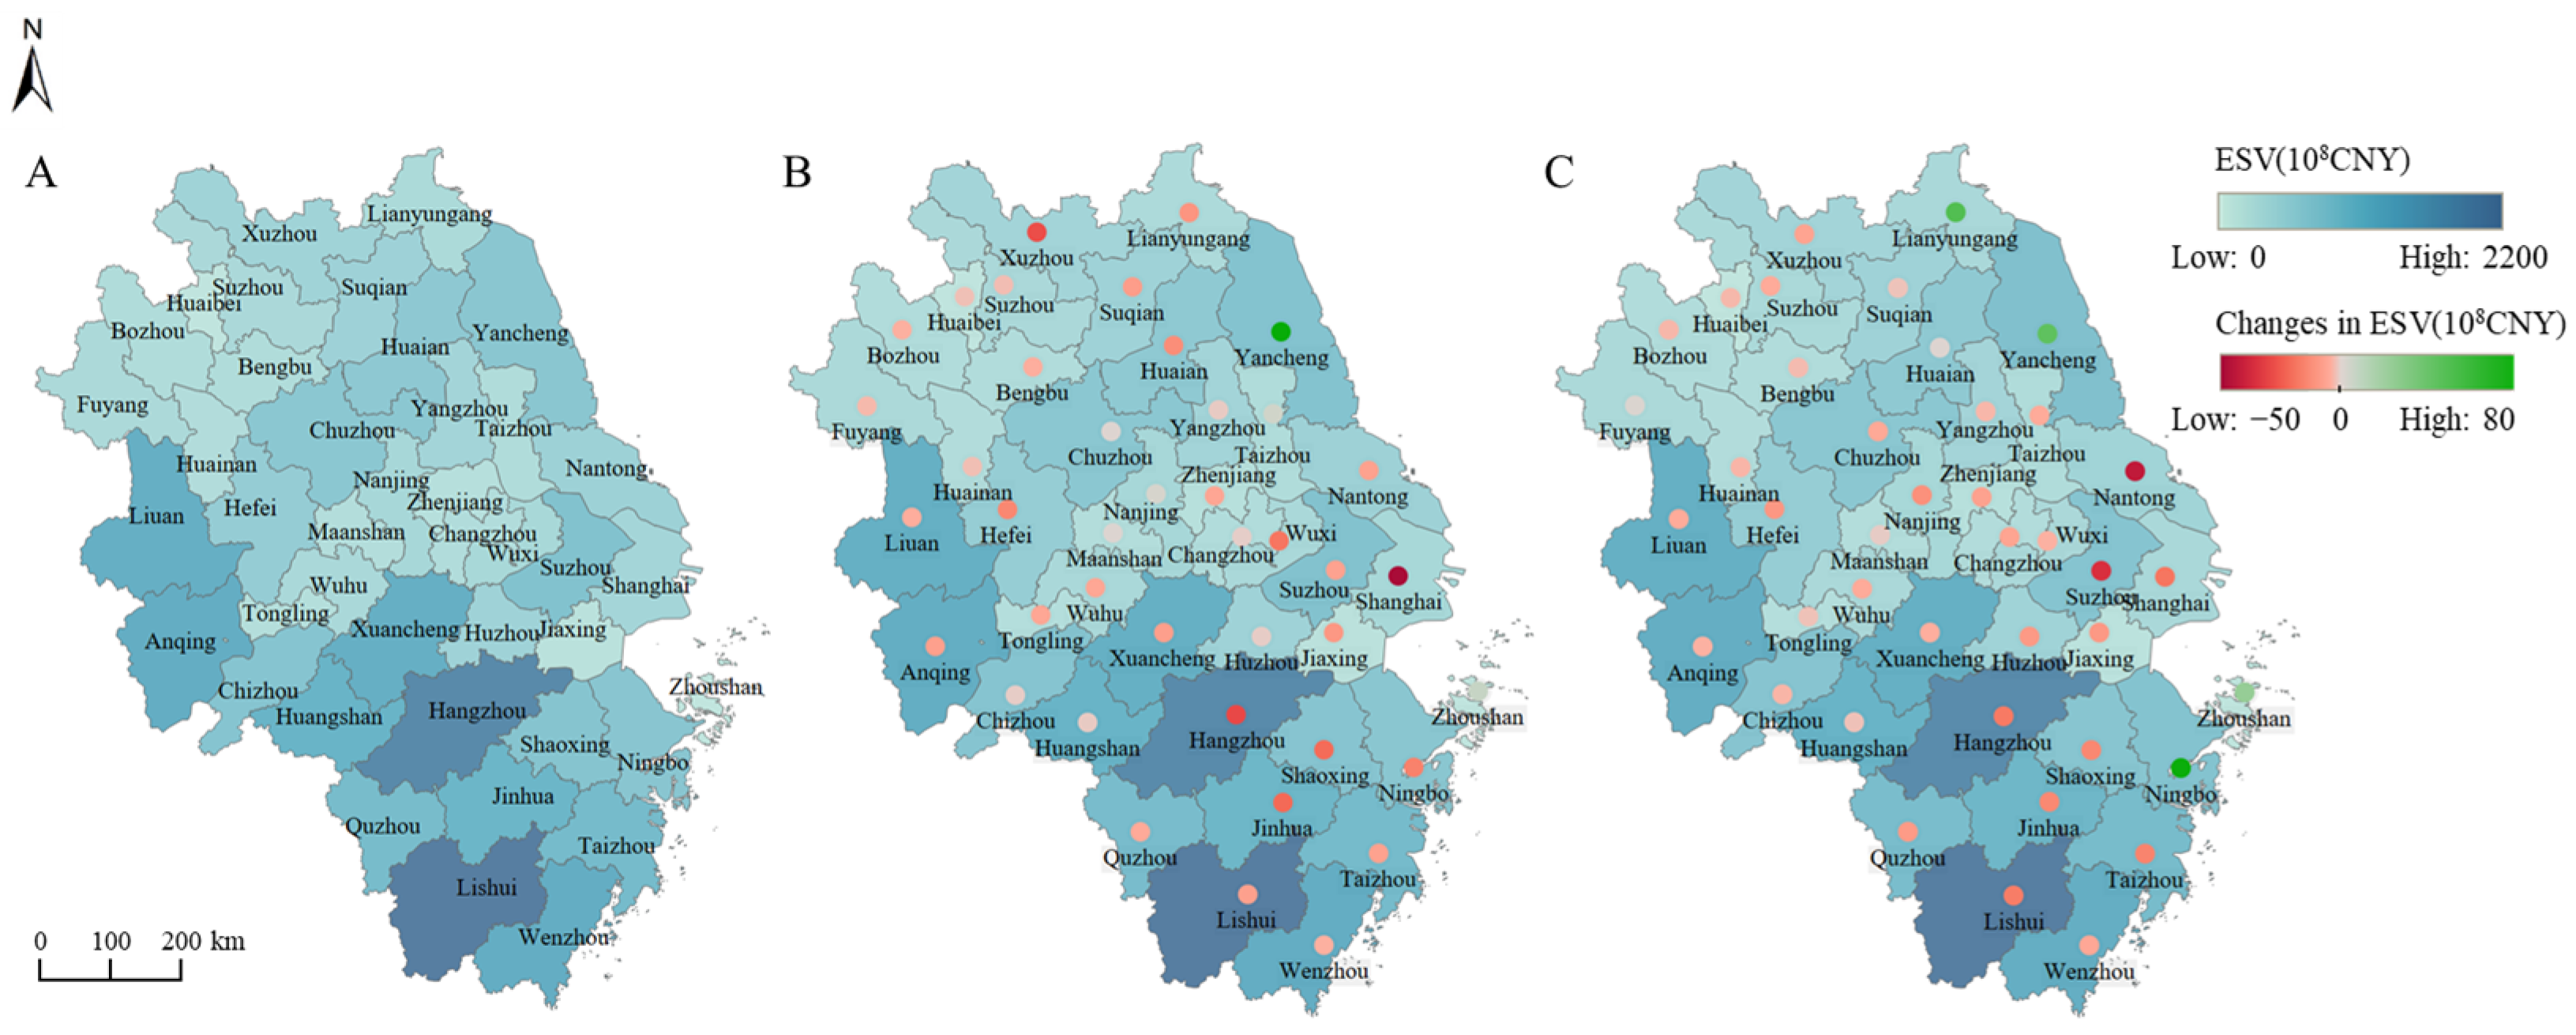
In terms of spatial distribution (Figure 3), cities with high ESV were mainly concentrated in the southern part of the YRD urban agglomeration, especially in most regions of Zhejiang Province. In 2020, Lishui ranked first with an ESV of CNY 208.72 billion, followed by Hangzhou with CNY 183.96 billion. These cities maintained strong ecological functions primarily due to their high forest coverage and dense river networks. On the other hand, cities with low ESVs were primarily located in the central-northern region of Anhui Province and central Jiangsu Province, including Bozhou (CNY 27.11 billion), Fuyang (CNY 32.97 billion), Changzhou (CNY 26.11 billion), and Taizhou (CNY 27.64 billion). These figures reflect the combined pressures of cropland degradation and urban expansion in agricultural plains.
At the municipal level, only Yancheng, Ningbo, Lianyungang, and Zhoushan experienced growth in ESV, among which Yancheng saw the largest increase of CNY 11.73 billion, followed by Zhoushan with CNY 2.73 billion. Ningbo and Lianyungang experienced initial declines but later achieved a rebound in ESV, increasing by CNY 5.91 billion and 3.50 billion, respectively. The remaining cities showed overall contraction in ESV. From a temporal perspective, between 2000 and 2010, rapid urban expansion was the dominant driver of ESV decline. Cities such as Changzhou and Wuxi in southern Jiangsu and Bozhou and Fuyang in northern Anhui experienced significant reductions in provisioning services due to the large-scale conversion of cropland into construction land. In contrast, mountainous cities such as Huangshan and Lishui maintained relatively stable ESV levels, supported by forest protection policies. Notably, Yancheng achieved a 10.4% increase in ESV during this period—an exception attributed to successful coastal wetland restoration efforts. Between 2010 and 2020, ecological restoration projects helped partially offset the downward pressure on ESV. Coastal cities such as Yancheng, Ningbo, and Zhoushan saw marked increases in hydrological regulation services due to enhanced protection of wetlands and coastal zones, resulting in ESV growth of 5.0%, 10.0%, and 20.8%, respectively.
Specifically, in more than 35% of the 41 cities, forest was the dominant contributor to ESV, such as Huangshan, Lishui, Quzhou, and Hangzhou, where forest consistently accounted for over 80% of total ESV. Huangshan reached the highest proportion at 83.6%, with the biodiversity service value stabilizing around CNY 17.4 billion. Aside from Zhoushan, which experienced a 5.5 percentage point increase in forest contribution due to coastal ecological restoration, changes in forest contribution were generally within 3% for other cities. Approximately 25% of cities experienced a decline of more than 5% in the contribution rate from cropland, reflecting a common trend of cropland shrinkage under ongoing urban expansion, among which the share of Yancheng, Lianyungang, and Zhoushan cities decreased by 10.0%, 8.5%, and 8.1%, respectively, and only Xuzhou and Nantong exhibited an upward trend. The share of water areas generally ranged from 10% to 40%; however, in Suzhou (Jiangsu), due to the influence of Lake Taihu, the value share of the water ESV exceeded 80%. Regarding service types, the variation in contribution proportions across cities was generally below 1%. The value of hydrological regulation services showed the most notable increase. Among all cities, only Nantong saw a slight decrease of 0.1% in aesthetic landscape service value; for the rest, the proportions either remained stable or increased slightly.

3.2. Interregional ESF

ESF calculations and spatial analyses were generated using ArcGIS 10.7 and Python 3.11. From 2000 to 2020, ESF in the YRD urban agglomeration exhibited an overall trend of “slight initial increase followed by gradual decline”. The total flow rose slightly from CNY 212.07 billion in 2000 to CNY 212.55 billion in 2010, then declined to CNY 211.32 billion in 2020, with a total fluctuation of only 0.6%. Chord diagrams were used to visualize the spatial flows of ecosystem services within the YRD, as shown in Figure 4. Intra-provincial circulation dominated in Anhui, Jiangsu, and Zhejiang, with internal flows accounting for over 70% of the total ESF. Among them, Zhejiang Province ranked first in 2020 with a flow volume of CNY 78.46 billion, followed by Anhui, Jiangsu, and Shanghai.
In terms of ecosystem service outflows, cities such as Hangzhou, Huangshan, Xuancheng, Taizhou (Zhejiang), and Huai’an consistently ranked among the top five contributors throughout the study period, jointly accounting for 41–42% of the total regional outflow. In 2020, Hangzhou topped the list with an outflow of CNY 31.94 billion, while Yancheng became the leading growth pole with a 35.5% increase in outflow, while Shanghai’s outflow volume remained minimal at only CNY 0.01 billion. Regarding inflow, Jinhua, Xuancheng, Hangzhou, Changzhou, and Shaoxing were consistently the top five recipient cities, accounting for about 34% of the total throughout the study period. In 2020, Jinhua remained the largest inflow recipient, with a volume of CNY 22.83 billion, accounting for 10.8% of the regional total. Taizhou (Jiangsu) and Jiaxing also became major growth contributors, with inflow increases of 14.6% and 120.7%, respectively. Notably, Suzhou (Jiangsu), despite being a major economic center, maintained an inflow volume of less than CNY 0.04 billion.
From a phased perspective, from 2000 to 2010, a total of 38 pairs of cities experienced ESF change rates greater than 10%. Among them, 10 city pairs recorded an absolute change in ESF exceeding CNY 0.1 billion (Figure 4). For example, the ESF from Ningbo to Nanjing increased from CNY 0.22 billion in 2000 to CNY 0.54 billion in 2010, representing a growth of 142.2%. Other notable increases occurred in flows from Yancheng to Yangzhou, from Ningbo to Taizhou (Zhejiang), from Ningbo to Shaoxing, and from Yancheng to Taizhou (Jiangsu), with respective increases of 55.8%, 53.3%, 25.6%, and 22.6%. Conversely, a significant decline was observed in flows from Shaoxing to Ningbo, from Nantong to Yancheng, and from Xuzhou to Suzhou (Anhui), with decreases of 32.7%, 31.5%, and 20.3%, respectively. These patterns suggest that cities such as Ningbo and Yancheng have increasingly played the role of ecological exporters, reflecting a growing ecological radiation effect. From 2010 to 2020, the overall changes in ESF were more moderate. Only seven pairs of cities recorded a flow change rate above 10%, and three of them had absolute flow increases greater than CNY 0.1 billion. Notably, the ESF from Lianyungang to both Suzhou in Anhui and Xuzhou increased by 14.5 percent. In addition, the flow from Ningbo to Shaoxing rose from CNY 1.31 billion in 2010 to CNY 1.64 billion in 2020, with an increase of 10.0%. These trends indicate a relatively stable stage of ecological redistribution.
Overall, the outflow and inflow of ecosystem services are not perfectly balanced for any given city. Each city in the YRD urban agglomeration is regarded as both an SPA and an SBA. If a city’s outflow exceeds its inflow, resulting in a net positive flow, it is defined as an SPA; conversely, if the net flow is negative, it is categorized as an SBA. In 2020, cities such as Hangzhou, Taizhou (Zhejiang), Chuzhou, Huai’an, and Yancheng were leading SPAs, with net outflows of CNY 20.32 billion, 8.20 billion, 6.70 billion, 6.60 billion, and 6.30 billion, respectively. On the other hand, top SBAs such as Jinhua, Changzhou, Taizhou (Jiangsu), Shaoxing, and Zhenjiang recorded the highest net inflows, reaching net inflows of CNY 14.15 billion, 7.25 billion, 6.67 billion, 4.01 billion, and 4.00 billion, respectively. As shown in Figure 5, the number of SPAs and SBAs across the YRD urban agglomeration remained relatively stable at 25 and 26, respectively. Notably, Nantong shifted from an SPA to an SBA in 2010, while Ningbo became an SPA in 2020.
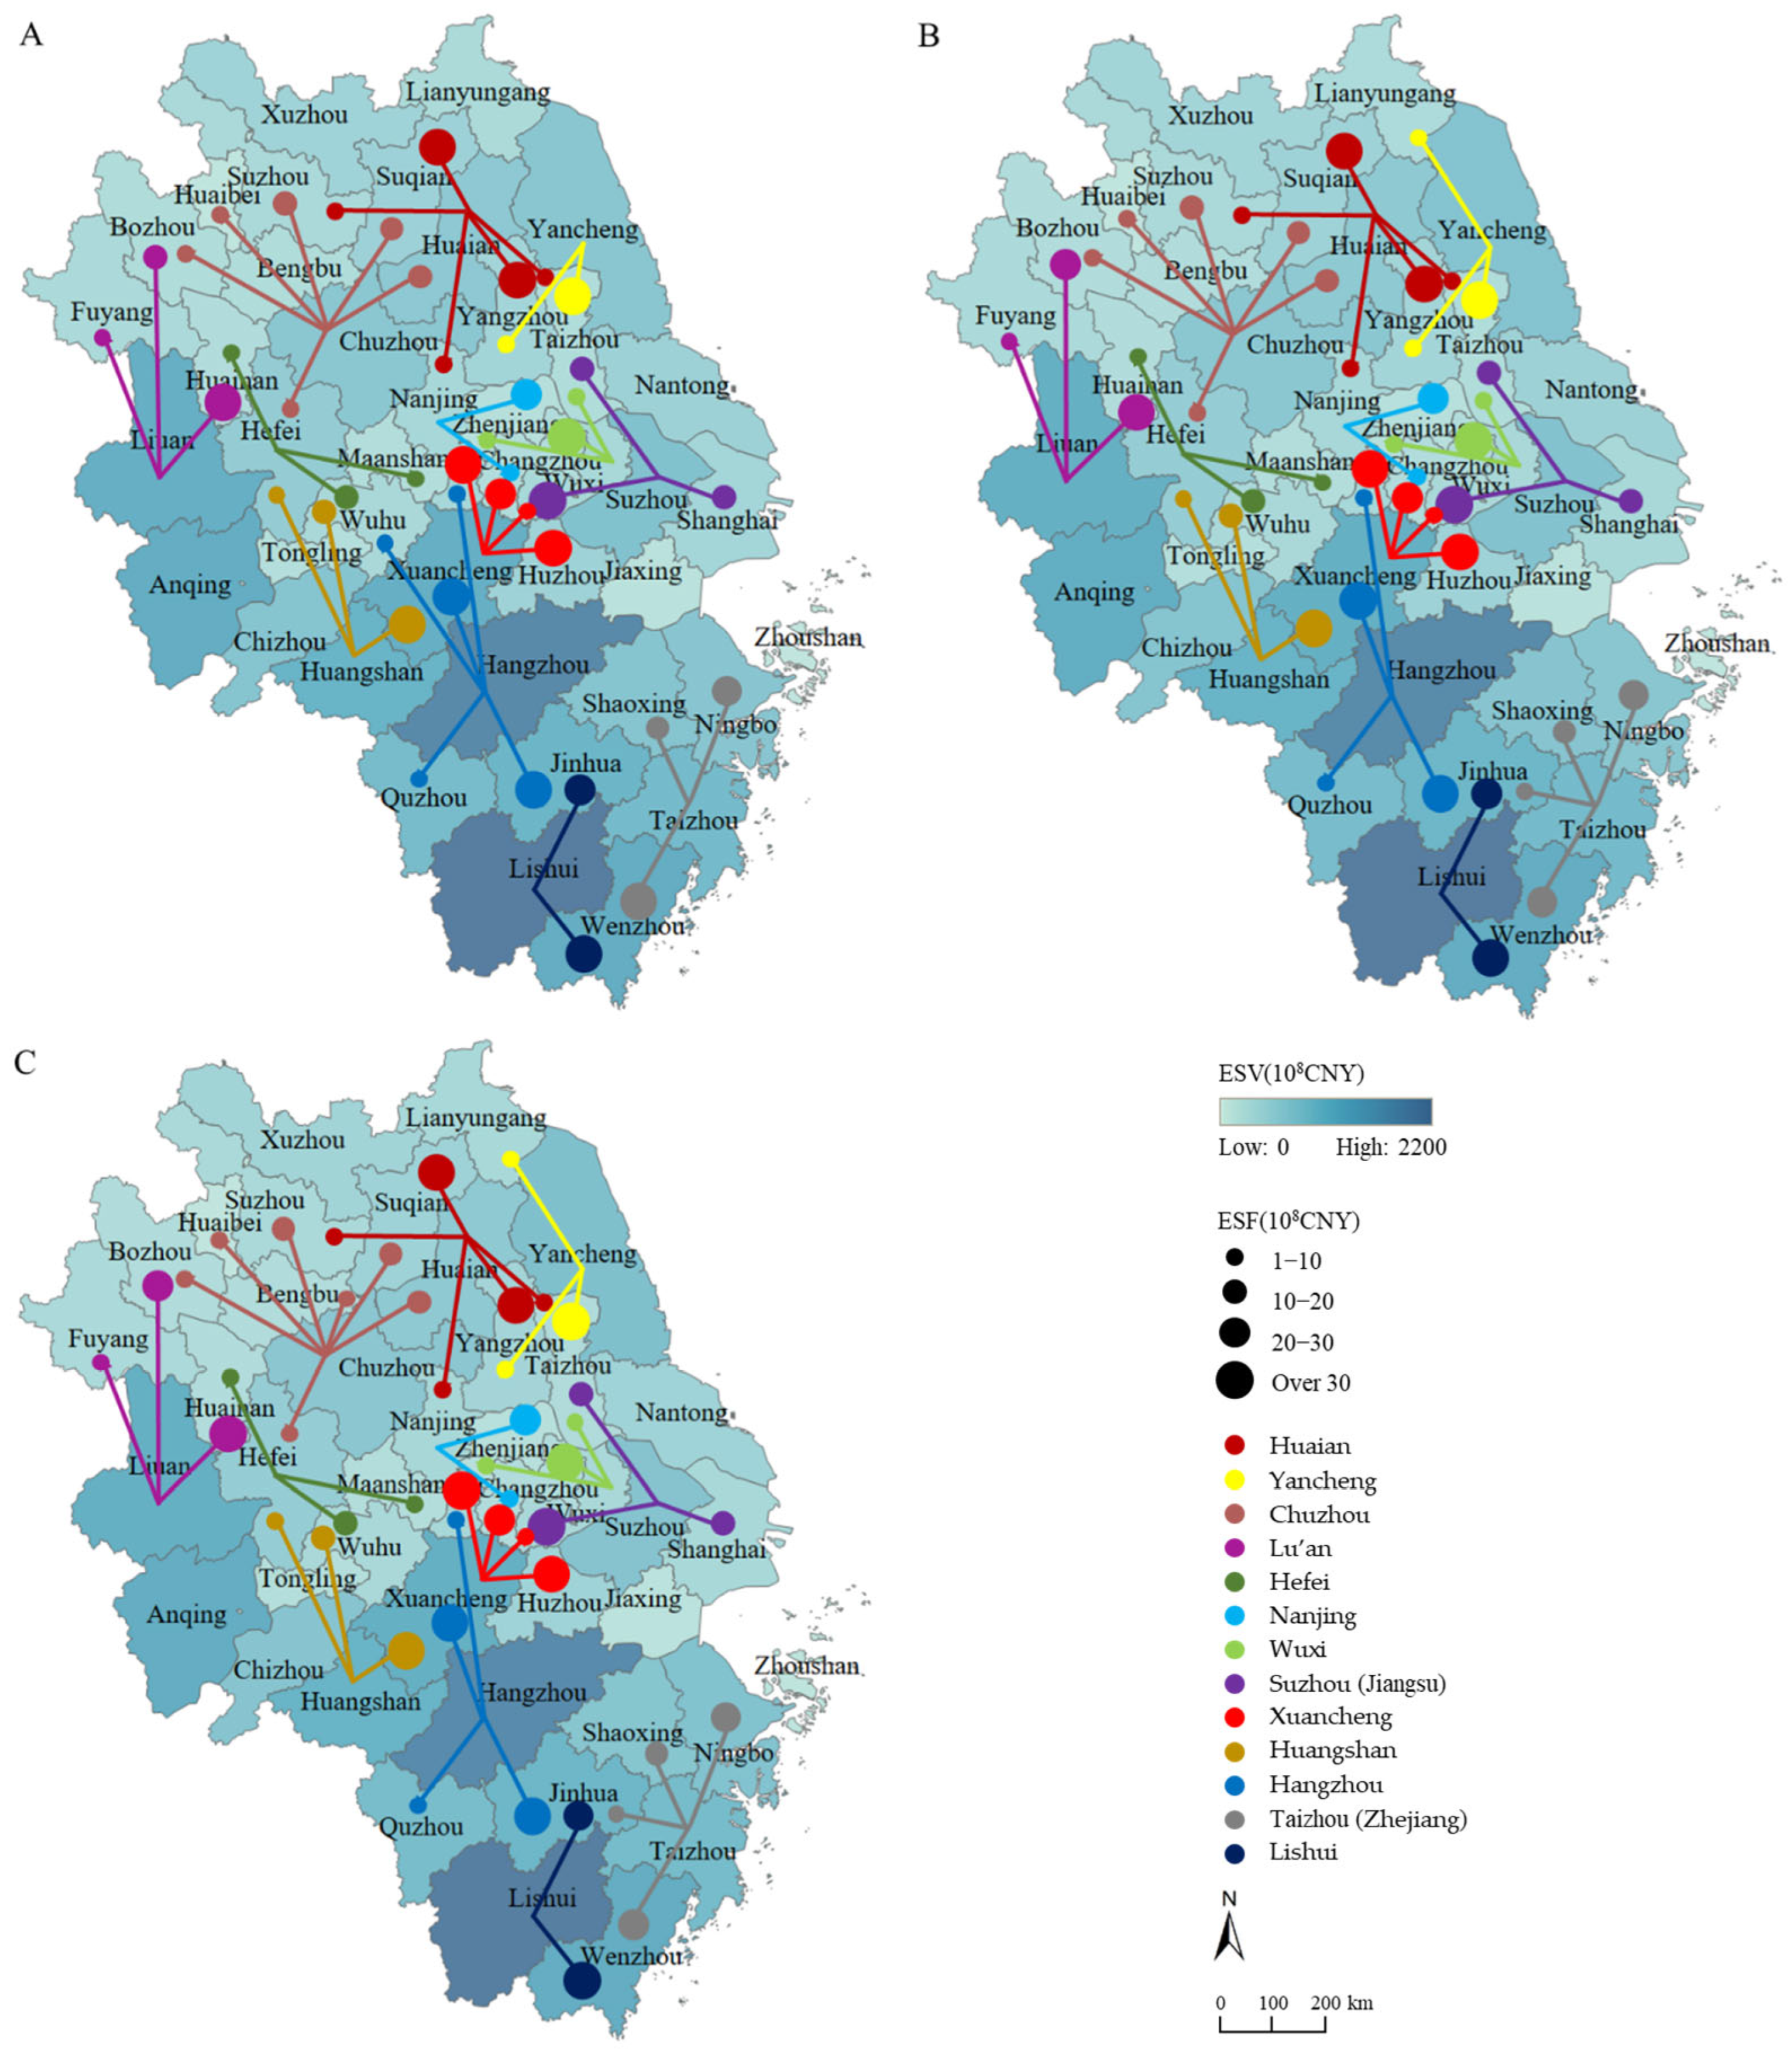
Furthermore, according to the 2019 “Outline of the Integrated Regional Development of the Yangtze River Delta” issued by the CPC Central Committee and the State Council, 27 cities were designated as the core cities of the YRD, encompassing Shanghai, the major cities of southern Jiangsu, eastern Anhui, and most of Zhejiang Province, while the remaining 14 cities were classified as the non-core cities. Based on this classification, this study selected 13 cities with a net ecosystem service outflow exceeding CNY 1.00 billion from 2000 to 2020 (Figure 6), and further categorized them into core and non-core regions:
1.
Core cities: Hangzhou, Suzhou (Jiangsu), Wuxi, Nanjing, Hefei, Taizhou (Zhejiang), Yancheng, Chuzhou, and Xuancheng;
Hangzhou’s net outflows to Jinhua and Xuancheng slightly declined from CNY 12.40 billion and 5.55 billion in 2000 to CNY 12.20 billion and 5.13 billion in 2020. This weakening of service output is closely related to the city’s urban expansion of 129.8%. Meanwhile, the long-distance net outflow from Hangzhou to Nanjing slightly declined from CNY 0.69 billion to 0.67 billion, indicating a spatial concentration of supply to geographically closer regions. Net outflows of Suzhou (Jiangsu) to Wuxi and Taizhou (Zhejiang) narrowed from CNY 3.96 billion and 1.53 billion to CNY 3.78 billion and 1.38 billion, respectively, primarily due to the degradation of regulating services in the Lake Tai region caused by industrial land expansion; in contrast, the net outflow to Shanghai increased by CNY 0.20 billion, mainly driven by a sharp 16.3% decline in Shanghai’s ESV and the resulting ecological service gap. Wuxi’s net outflow to Changzhou declined from CNY 4.95 billion in 2000 to CNY 4.41 billion in 2020, as the slower decline in Changzhou’s ESV led to a reduction in Wuxi’s radiation radius. The net flow from Nanjing to Zhenjiang showed a fluctuating pattern—CNY 2.73 billion in 2000, rising to CNY 2.84 billion in 2010, then decreasing to CNY 2.75 billion in 2020—while the net outflow to Changzhou steadily declined to CNY 0.54 billion. Likewise, Hefei’s net outflows to Wuhu and Ma’anshan fell from CNY 1.15 billion and 0.91 billion to CNY 1.08 billion and 0.81 billion, respectively, as Hefei’s own ESV declined more rapidly than its neighbors, narrowing the ecological service gap. Net outflows of Taizhou (Zhejiang) to Ningbo and Wenzhou steadily decreased from CNY 2.54 billion and 4.38 billion to CNY 2.13 billion and 4.21 billion, respectively. Through coastal wetland restoration, Yancheng significantly increased its net outflow to Taizhou (Zhejiang) from CNY 4.20 billion to 5.68 billion and to Yangzhou from CNY 0.57 billion to 0.95 billion, becoming a new regional growth pole for service provision. Xuancheng, located at the intersection of three provinces and possessing high-value services, maintained stable net outflows of around CNY 3.00 billion to Nanjing, Huzhou, and Changzhou, exhibiting prominent cross-provincial service flows. Chuzhou, leveraging its ecological advantages in the north, steadily increased its net outflows to Suqian, Huai’an, and Suzhou (Anhui) from CNY 1.90 billion, 1.81 billion, and 1.46 billion to CNY 1.92 billion, 1.87 billion, and 1.48 billion, respectively, demonstrating sustained output capacity due to the relatively weak ecological endowments of its neighboring cities.
2.
Non-core cities: Huangshan, Lishui, Huai’an, and Lu’an;
Cities such as Huangshan, Lishui, Huai’an, and Lu’an were officially included in the planning scope of the YRD urban agglomeration by the end of 2019. These cities are located on the boundaries of the YRD region. Huangshan, as a core ecological supply area with abundant forest resources, recorded a 4.7% increase in net outflows during the study period, with net outflows to Xuancheng fluctuating from CNY 5.06 billion in 2000 to CNY 5.10 billion in 2020, while its net outflow to Wuhu remained stable at around CNY 1.75 billion, Lishui exhibited strong overall export characteristics, with net outflows to Wenzhou slightly decreasing from CNY 0.02 billion to CNY 5.13 billion, while outflows to Jinhua increased slightly by CNY 0.07 billion, reaching CNY 2.78 billion. Huai’an ranked first in the YRD urban agglomeration in terms of net outflows, with an average annual net outflow of CNY 6.60 billion, with net outflows to neighboring cities such as Suqian and Yangzhou each exceeding CNY 3.00 billion. This is mainly due to Huai’an’s superior ecological baseline compared to its neighbors, which resulted in a sustained ecological gradient spillover. Lu’an maintained a stable output level of around CNY 5.00 billion based on its cropland resources, with net outflows to Huainan slightly increasing by CNY 0.02 billion to 4.05 billion and to Bozhou increasing by CNY 0.05 billion to 2.02 billion, reflecting the driving force of agricultural ecological potential.

3.3. Regional Division of the YRD from a Three-Dimensional Perspective of Ecological Support, Economic Development, and ESF

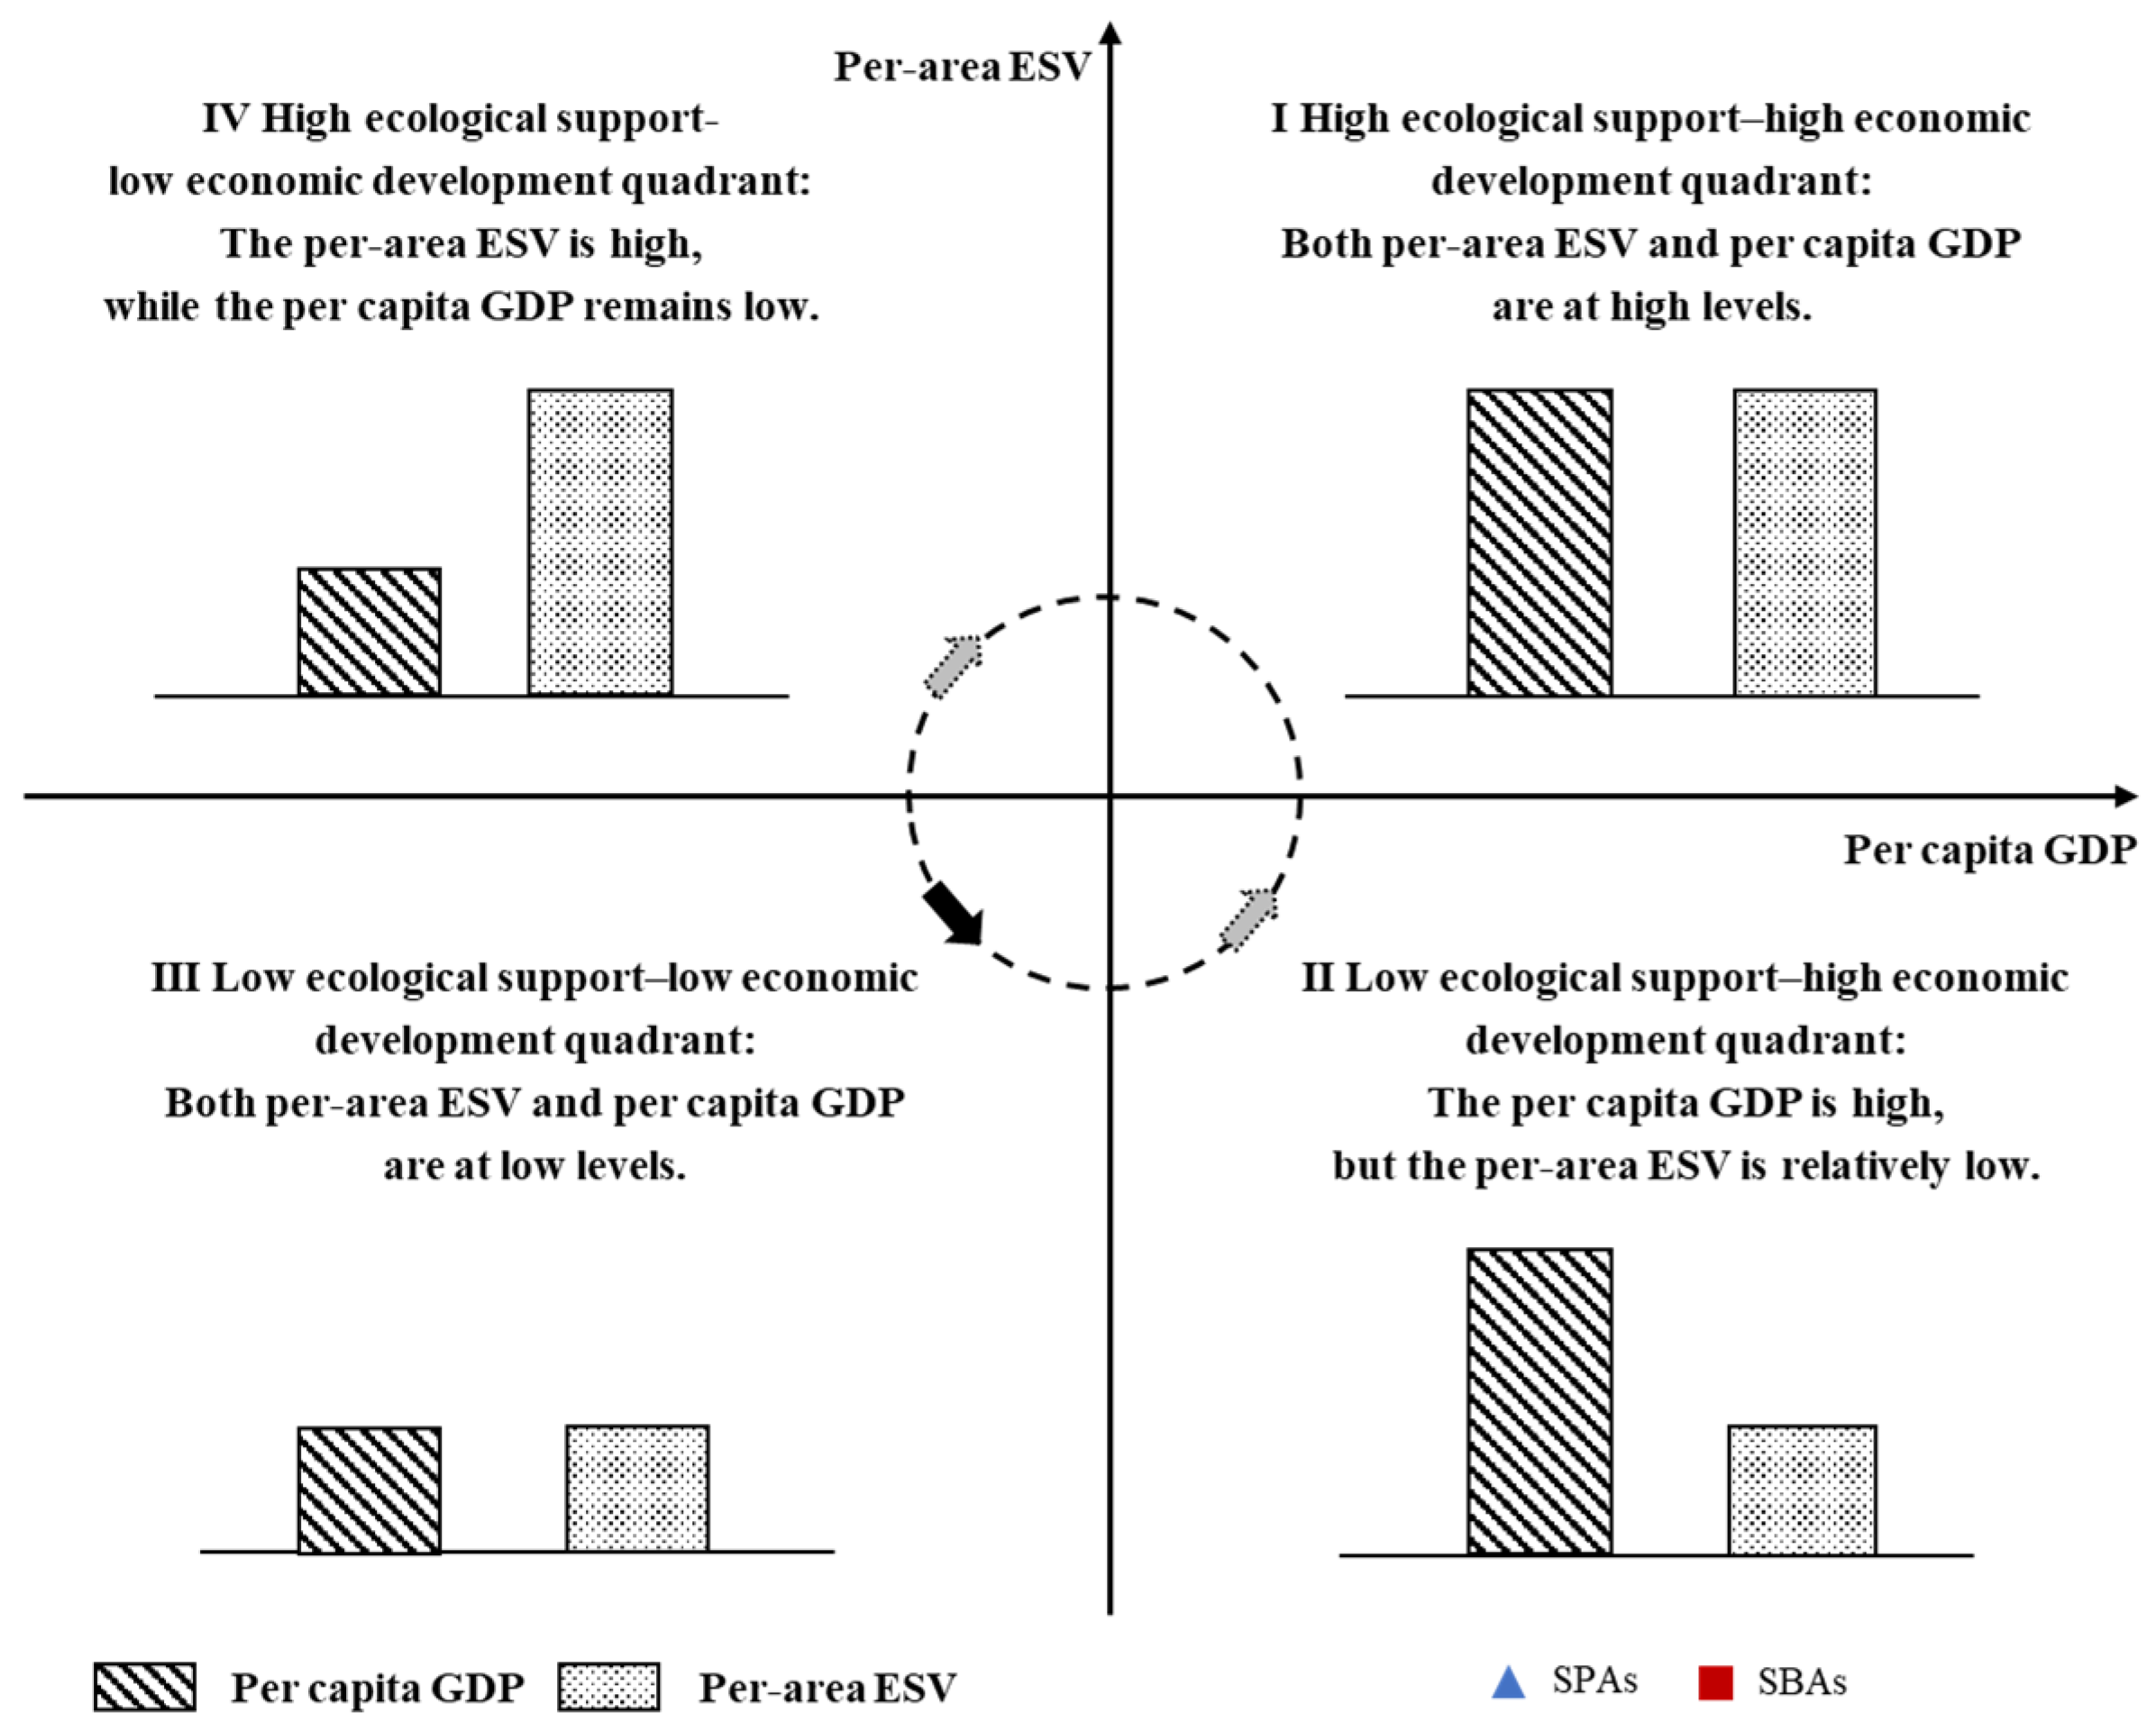
In the context of ecological integration in the YRD urban agglomeration, it is essential to coordinate the development of population, land, economy, and ecological environment. This requires not only focusing on economic development but also ensuring the rational allocation of ecological resources to meet human demands for ecological well-being. Research on ESF in the YRD urban agglomeration can break through the limitations of ecological functions and economic development levels defined by urban administrative boundaries, providing potential for optimizing regional population, spatial, and economic coordination. Per area ESV reflects the service efficiency of a city’s ecosystem per unit of land area and effectively measures the ecological support capacity of cities. On the other hand, per capita GDP represents the average economic output of urban residents and is a widely used indicator to measure economic development levels. Therefore, this study uses per-area ESV to represent urban ecological support capacity and per capita GDP to reflect the economic development status. Based on this, quadrant analysis is employed to classify the 41 cities in the YRD urban agglomeration from 2000 to 2020, with the median values of per area ESV and per capita GDP as the origin of the coordinate system. The points are colored and shaped according to the net outflow or net inflow of ecosystem services in the cities. Positive values represent net ecosystem service outflows, while negative values represent net ecosystem service inflows, as illustrated in Figure 7.
Quadrant I is referred to as the high ecological support–high economic development quadrant (Quadrant I in Figure 7), where cities exhibit both high per area ESV and high per capita GDP, indicating that local residents can simultaneously benefit from ecological services and economic growth. Quadrant II is defined as the low ecological support–high economic development quadrant (Quadrant II in Figure 7), representing that cities in this quadrant have high per capita GDP, allowing residents to enjoy economic benefits and improved public services. However, these cities have relatively scarce ecosystem services, which may limit the improvement of residents’ ecological well-being. Quadrant III is the low ecological support–low economic development quadrant (Quadrant III in Figure 7), where both per area ESV and per capita GDP are at low levels. This implies weak ecosystem functions, limited or low-quality ecological products and services, and relatively underdeveloped economic conditions, resulting in significant development challenges for residents. Quadrant IV is the high ecological support–low economic development quadrant (Quadrant IV in Figure 7), referring to cities with strong ecosystem functions and abundant high-quality ecological space, capable of providing ecological products and services to local and surrounding residents. However, these cities have low per capita GDP and relatively slow economic development, making it difficult to meet local residents’ development needs.
In addition, each quadrant is further classified based on the net inflow or net outflow of ecosystem services. Net ecosystem service outflow indicates that the city has an ecological spillover effect on surrounding areas, while net ecosystem service inflow suggests that the city is ecologically dependent on other regions.
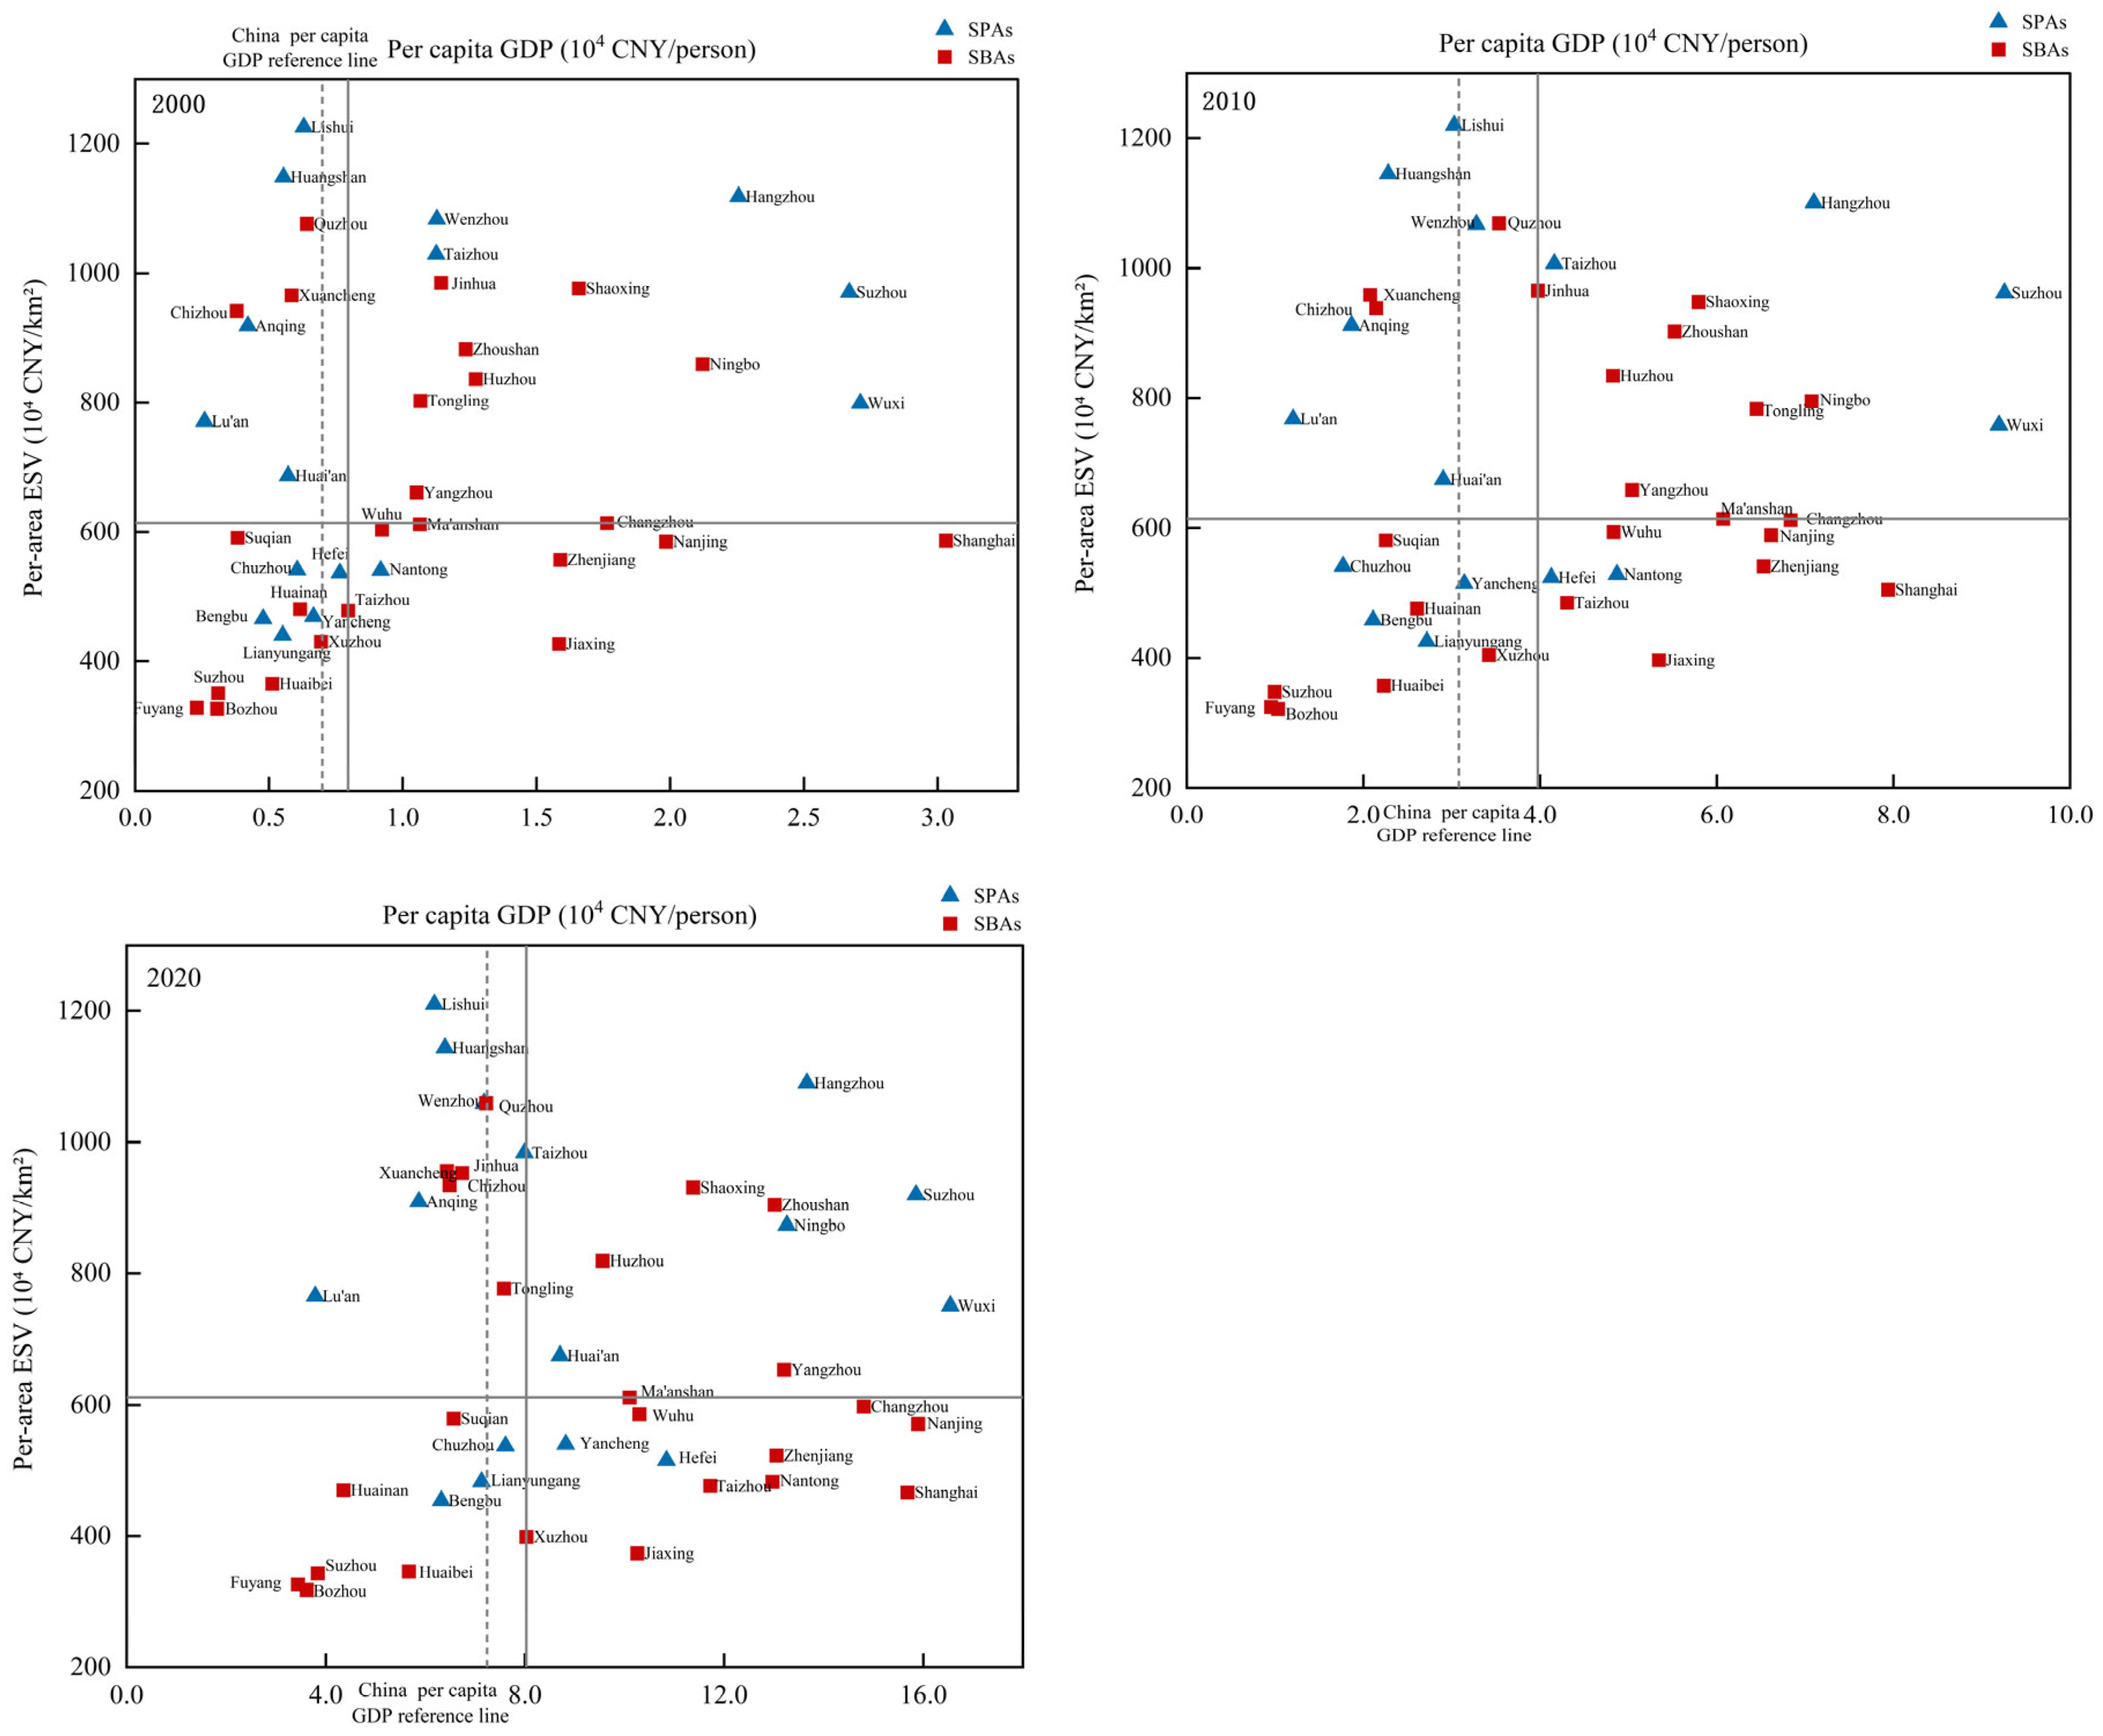
As shown in Figure 8, in 2020, the cities in Quadrant I included Hangzhou, Shaoxing, Suzhou (Jiangsu), Zhoushan, Ningbo, Huzhou, Wuxi, Huai’an, Yangzhou, and Ma’anshan, totaling 10 cities. Among these, the number of SPAs and SBAs was evenly split at 50%, with Hangzhou, Suzhou (Jiangsu), Ningbo, Wuxi, and Huai’an classified as SPAs, and the remaining cities as SBAs. Huai’an moved into Quadrant I in 2010, having advanced from Quadrant IV. Conversely, Taizhou (Zhejiang), Jinhua, and Tongling, which were in Quadrant I in 2010, fell to Quadrant IV by 2020. Ma’anshan evolved from Quadrant II in 2000 to Quadrant I, while Changzhou and Wenzhou dropped from Quadrant I to Quadrants II and IV, respectively, in 2010. Over the 2000–2020 period, the number of cities in Quadrant I steadily decreased from 13 in 2000 to 12 in 2010 and further contracted to 10 in 2020. Quadrant II included 11 cities in 2020: Changzhou, Wuhu, Nanjing, Yancheng, Zhenjiang, Hefei, Nantong, Taizhou (Jiangsu), Shanghai, Xuzhou, and Jiaxing. Among these, only Yancheng and Hefei were SPAs, while the remaining nine cities were SBAs. Hefei and Taizhou (Jiangsu) transitioned from Quadrant III in 2000, and Yancheng and Xuzhou moved up from Quadrant III in 2010. The number of cities in Quadrant II steadily increased from seven cities in 2000 to nine cities in 2010, and continued to rise to 11 cities by 2020. Quadrant III included nine cities in 2020: Suqian, Chuzhou, Lianyungang, Huainan, Bengbu, Huaibei, Suzhou (Anhui), Fuyang, and Bozhou. Among these, Chuzhou, Lianyungang, and Bengbu were SPAs, accounting for only three cities, while the other six were SBAs. The number of cities in Quadrant III has continuously decreased from 13 cities in 2000 to 11 cities in 2010, and further contracted to nine cities in 2020, with all cities transitioning to Quadrant II. Quadrant IV consisted of 11 cities: Lishui, Huangshan, Quzhou, Wenzhou, Taizhou (Zhejiang), Xuancheng, Jinhua, Chizhou, Anqing, Tongling, and Lu’an. Among these, six cities—Lishui, Huangshan, Wenzhou, Taizhou (Zhejiang), Anqing, and Lu’an—were SPAs, while the remaining five were SBAs. Over the 2000–2020 period, the number of cities in Quadrant IV increased steadily from 8 in 2000 to 9 in 2010 and reached 11 by 2020, with all newly added cities having fallen from Quadrant I. Huai’an is the only city that moved upward from Quadrant IV to Quadrant I.
Table 1 presents the evolution of city divisions in the YRD urban agglomeration from 2000 to 2020. The results indicate that the transitions mainly involve the mutual transitions between Quadrants I, II, and IV, along with some cities moving from Quadrant III to Quadrant II. Given that the quadrant classification is based on regional median values, the shifts of cities between Quadrants I, II, and IV from 2000 to 2020 reflect intensifying competition among cities for optimized allocation of economic and ecological resources. This competition, to some extent, fosters a spiral of eco-economically coordinated development among different cities in the YRD. Cities in Quadrant III have mainly transitioned to Quadrant II, indicating that economic growth remains the primary pathway for cities in Quadrant III to advance. Notably, no city fell back into Quadrant III during the period from 2000 to 2020, suggesting that the ecological-economic coordination across the YRD has entered a virtuous cycle.

4. Discussion

Based on clearly defining a four-quadrant classification framework for per area ESV and per capita GDP based on ESF, this study further explores the pathways and strategies for optimizing regional ecological and economic coordination, as illustrated by the arrows in Figure 7. According to the quadrant analysis results, the high ecological support–high economic development state (Quadrant I) represents a positive coordination between ecology and economy, jointly determined by per area ESV and per capita GDP. For cities with net ecosystem service outflows such as Hangzhou, Suzhou (Jiangsu), Ningbo, and Huai’an, which demonstrate ecological spillover effects to surrounding areas, these cites exhibit higher per area ESV compared to their per capita GDP levels. This indicates that their ecological supply capacity relatively outweighs local demand. Therefore, while prioritizing the fundamental guarantee of local residents’ well-being, these cities possess surplus ecosystem service value and sufficient material incentives to facilitate the spatial radiation and transmission of ecosystem services to neighboring cities. On the other hand, these cities are well-positioned to become important population inflow areas, alleviating the ecological support deficit in other cities through population migration, while also promoting improvements in residents’ ecological and economic well-being. Therefore, the establishment of an ecological compensation mechanisms can be considered to provide targeted compensation for the labor value and economic benefits generated by supplying regional ecosystem services and products. For cities with net ecosystem service inflows, such as Shaoxing, Zhoushan, Huzhou, Wuxi, Yangzhou, and Ma’anshan, these cities also maintain a coordinated ecological-economic development state. However, due to ecological disparities between cities, they benefit from the ESF of neighboring high-ecological potential cities. Consequently, these cities also represent important population inflow areas, and the establishment of an ecological compensation mechanism can similarly be considered. It is important to build a comprehensive platform for trading and operating ecological products, which could increase the regional ecological empowerment driving economic development. These cities can use population inflows and the ecological compensation mechanism to enhance their ecological capacities and boost economic growth.
Cities in the low ecological support–high economic development (Quadrant II) are mostly densely populated and economically developed, with higher per capita GDP but lower per area ESV. For cities with net ecosystem service outflows, such as Yancheng and Hefei, both of which are situated in the northern part of the YRD urban agglomeration, the ESV is relatively low. However, the ESV of their surrounding cities is even lower. This suggests that cities in this region are experiencing ecological resource scarcity and may face challenges such as population overload and the lack of mechanisms for realizing ecological product value. However, this area has the potential for ecological expansion and material conditions for ecological needs. Therefore, cities can cooperate within their radiating range to strengthen internal collaboration, promote comprehensive ecological restoration, and environmental governance projects across the region. Moreover, they should seek to form secondary ecosystem service supply chains with cities that possess abundant ecological resources nearby, co-create paths for realizing ecological product value across regions, and strengthen the supply of ecosystem services to neighboring cities to help alleviate ecological pressures. Additionally, it is important to leverage the material economic foundation of the region, increase investment in ecological capital, and use the material economy to “feed back” into the ecology, gradually evolving toward Quadrant I. For cities with net ecosystem service inflows and outflows, such as Changzhou, Wuhu, Nanjing, Zhenjiang, Nantong, Taizhou (Jiangsu), Shanghai, Xuzhou, and Jiaxing, these cities rely heavily on ecosystem service supply from cities like Hangzhou, Suzhou (Jiangsu), Xuancheng, and Wuxi, forming a city cluster development pattern driven by regional points. These cities are economically developed, but their local ecological support capacity is insufficient. However, neighboring cities can provide ecosystem service flow support, enabling these cities to become population inflow areas and potential ecological product consumption markets. On the other hand, residents may not directly enjoy ecological services locally, but could travel to nearby cities with rich ecological resources. For example, residents of Shanghai might choose to visit Hangzhou or Nanjing over the weekend to enjoy their ecological spaces. This mechanism, referred to as the “People to Nature” (P2N) mechanism [54], could be explored, where people actively consume ecosystem services from neighboring regions to meet local residents’ ecological well-being needs, alleviating the local population and ecological pressures. More resources would then be concentrated at the economic development level, optimizing functional zoning and efficiently allocating resources, ultimately stabilizing in Quadrant II.
In the low ecological support–low economic development (Quadrant III, both per area ESV and per capita GDP are at relatively low levels, with poor natural resource endowment and economic location. Both economic development and ecological restoration in these areas require substantial costs. For cities with net ecosystem service outflows, such as Chuzhou, Lianyungang, and Bengbu, these cities are located in the northern part of the YRD, where the ESV of surrounding regions is generally low. Despite their own relatively low per area ESV, they still contribute to service flows to neighboring cities. It is recommended to establish horizontal ecological compensation mechanisms between regions and actively explore market-oriented paths for realizing ecological value. For cities with net ecosystem service inflows, such as Suqian, Huainan, Huaibei, Suzhou (Anhui), Fuyang, and Bozhou, these cities are situated on the northernmost boundary of the Yangtze River Delta, which has the lowest ESV in the entire region, and their natural resource endowment and economic location are also poor. Regardless of whether they have net outflows or inflows of ecosystem services, it is recommended to establish a transfer payment mechanism. This mechanism should integrate surrounding cities at the provincial level to carry out land comprehensive management and ecological restoration and guide the overburdened population in ecologically fragile areas toward regions with coordinated economic-ecological development to relieve regional population development pressures. This would also facilitate the advancement of these cities toward Quadrant IV.
In the high ecological support–low economic development (Quadrant IV) region, per area ESV is high, but per capita GDP is low. Regardless of whether these cities have net ecosystem service outflows or net ecosystem service inflows, it is essential to focus on promoting mechanisms for realizing the value of ecological products, which will positively drive regional economic development. Policy-level vertical and horizontal compensation mechanisms should be constructed, coupled with combining the development of ecological consumption markets in Quadrant II cities. This will fully mobilize the participation of multiple stakeholders in ecological protection and construction, achieving an efficient conversion from per area ESV to per capita GDP. The goal is to transform “green mountains and clear water” into “golden mountains and silver mountains”, thereby advancing toward Quadrant I.
From a national strategic perspective, the YRD urban agglomeration, as a key growth engine for China’s economic development, has a median per capita GDP significantly higher than the national average (as shown by the dashed line in Figure 8). Although this study classifies the 41 cities within the YRD into four quadrants based on their internal characteristics, viewed from a national scale, the overall development level of the YRD is already at a leading position. Therefore, the development goals of all cities in the YRD should aim for high ecological support–high economic development (Quadrant I) at the national level. The four-quadrant analytical framework established in this study not only helps clarify the development positioning of cities within the YRD, optimizing regional functional zoning and resource allocation, but more importantly, it provides scientific evidence and practical pathways for the overall transition of the YRD urban agglomeration towards Quadrant I at the national scale. By accurately identifying the development shortcomings and advantages of each city and formulating differentiated development strategies, this will strongly promote the YRD region’s role as a model for the coordination of ecosystem services and economic development, offering a replicable and scalable approach for regional coordinated development across the country.

5. Conclusions

This study focused on the YRD urban agglomeration, using the equivalence factor method and breakpoint model to analyze the spatiotemporal evolution characteristics of ESV and their flows in 41 cities of the YRD from 2000 to 2020. Distinct from previous research that mostly focused on single-factor flows or natural geographical units, this study innovatively conducts a long-term, comprehensive ESF analysis at the mega-urban agglomeration scale, offering new insights into cross-administrative ecological interactions. By constructing a four-quadrant framework integrating per area ESV and per capita GDP based on ESF classifications, this study revealed the regional division and evolution patterns of cities within the YRD from 2000 and 2020 and proposes optimization management strategies for the coordinated ecological and economic development of the YRD urban agglomeration. The main conclusions are as follows:
1.
From 2000 to 2020, the ESV of the YRD urban agglomeration exhibited a “rapid then slow” declining trend. The conversion of high-value land types, such as cropland and forest, to construction land was the main factor behind this decline, while the growth in water and the deceleration of construction land expansion slowed the decline. The ESV declined across all three provinces and one municipality, except for Yancheng, Ningbo, Lianyungang, and Zhoushan, where it increased. Among them, Yancheng showed the highest growth with an increase of CNY 11.73 billion. The regional distribution displayed a high-south, low-north spatial pattern. Among the 41 cities, over 35% of cities’ ESV was primarily contributed by forest, and 25% of cities experienced a reduction exceeding 5% in the contribution of cropland. In terms of service types, only hydrological regulation, waste treatment, and aesthetic landscape services showed value growth, while the remaining six service types continued to decline. Among these, the value of hydrological regulation services accounted for 19.3% in 2020, maintaining the largest proportion with notable growth.
2.
From 2000 to 2020, ESF in the YRD urban agglomeration remained relatively stable, characterized by predominantly intra-provincial circulation. The ESF slightly increased initially in 2000 and then gradually declined, reaching CNY 211.32 billion in 2020, with an overall decrease of only 0.6%. Anhui, Jiangsu, and Zhejiang provinces primarily followed an intra-provincial circulation pattern, with internal flows accounting for over 70%. In terms of city outflows, Hangzhou, Huangshan, Xuancheng, Taizhou (Zhejiang), and Huai’an consistently ranked among the top five, collectively accounting for 41–42% of total outflows; Yancheng had the highest growth in outflows with a 35.5% increase. For city inflows, Jinhua, Xuancheng, Hangzhou, Changzhou, and Shaoxing consistently remained the top five recipients, collectively accounting for approximately 34%; Taizhou (Jiangsu) and Jiaxing were key drivers of inflow growth. In terms of net outflows/inflows, Hangzhou, Taizhou (Zhejiang), and Chuzhou had the highest net output levels, while Jinhua, Changzhou, and Taizhou (Jiangsu) had the highest net input levels. The numbers of SPAs and SBAs remained stable at 25 and 26, respectively; Nantong shifted from an SPA to an SBA in 2010, while Ningbo became an SPA in 2020.
3.
A four-quadrant framework of per area ESV and per capita GDP was constructed based on ESF, classifying 41 cities in YRD into four distinct states: high ecological support–high economic development Quadrant I; low ecological support–high economic development Quadrant II; low ecological support–low economic development Quadrant III; and high ecological support–low economic development Quadrant IV. The results indicate that from 2000 to 2020, cities in YRD primarily transitioned among Quadrants I, II, and IV, with some cities moving from Quadrant III to Quadrant II, and no cities reverted to Quadrant III. Based on the four-quadrant classification, optimization management pathways and strategies for regional ecological-economic coordination were proposed. It integrates population, land, economic, and ecological dimensions to promote coordinated development. By overcoming the constraints of administrative boundaries on ecological functions and economic performance, the study puts forward ESF strategies for ecological and economic optimization. These strategies provide decision-making references for improving ecological compensation mechanisms, advancing regional collaborative governance, and facilitating the market-oriented transaction of ecosystem services.

Author Contributions

Conceptualization, methodology, validation, formal analysis, writing—original draft preparation, H.J.; writing—review and editing, H.C. All authors have read and agreed to the published version of the manuscript.

Funding

This research was funded by the Shanghai Philosophy and Social Science Planning Project: “The Logic and Synergistic Promotion Strategies of Green and Low-Carbon Lifestyle Transformation of Residents” (Project No. 2024BCK007).

Institutional Review Board Statement

Not applicable.

Informed Consent Statement

Not applicable.

Data Availability Statement

Data are available upon request.

Conflicts of Interest

The authors declare no conflicts of interest.

Abbreviations

The following abbreviations are used in this manuscript:
ESVEcosystem service value
ESFEcosystem service flow
YRDYangtze River Delta

References

  1. Costanza, R.; de Groot, R.; Braat, L.; Kubiszewski, I.; Fioramonti, L.; Sutton, P.; Farber, S.; Grasso, M. Twenty Years of Ecosystem Services: How Far Have We Come and How Far Do We Still Need to Go? Ecosyst. Serv. 2017, 28, 1–16. [Google Scholar] [CrossRef]
  2. Xiao, Y.; Xie, G.; Lu, C.; Xu, J. Involvement of ecosystem service flows in human wellbeing based on the relationship between supply and demand. Acta Ecol. Sin. 2016, 36, 3096–3102. [Google Scholar] [CrossRef]
  3. Peng, J.; Hu, X.; Zhao, M.; Liu, Y.; Tian, L. Research progress on ecosystem service trade-offs: From cognition to decision-making. Acta Geogr. Sin. 2017, 72, 960–973. [Google Scholar] [CrossRef]
  4. Boyd, J.; Banzhaf, S. What Are Ecosystem Services? The Need for Standardized Environmental Accounting Units. Ecol. Econ. 2007, 63, 616–626. [Google Scholar] [CrossRef]
  5. Bai, Y.; Wong, C.P.; Jiang, B.; Hughes, A.C.; Wang, M.; Wang, Q. Developing China’s Ecological Redline Policy Using Ecosystem Services Assessments for Land Use Planning. Nat. Commun. 2018, 9, 3034. [Google Scholar] [CrossRef]
  6. Arunrat, N.; Sereenonchai, S.; Wang, C. Carbon Footprint and Predicting the Impact of Climate Change on Carbon Sequestration Ecosystem Services of Organic Rice Farming and Conventional Rice Farming: A Case Study in Phichit Province, Thailand. J. Environ. Manag. 2021, 289, 112458. [Google Scholar] [CrossRef]
  7. Wu, Q.; Cao, Y.; Fang, X.; Wang, J.; Li, G. A Systematic Coupling Analysis Framework and Multi-Stage Interaction Mechanism between Urban Land Use Efficiency and Ecological Carrying Capacity. Sci. Total Environ. 2022, 853, 158444. [Google Scholar] [CrossRef]
  8. Baró, F.; Palomo, I.; Zulian, G.; Vizcaino, P.; Haase, D.; Gómez-Baggethun, E. Mapping Ecosystem Service Capacity, Flow and Demand for Landscape and Urban Planning: A Case Study in the Barcelona Metropolitan Region. Land Use Policy 2016, 57, 405–417. [Google Scholar] [CrossRef]
  9. Song, X.-P.; Hansen, M.C.; Stehman, S.V.; Potapov, P.V.; Tyukavina, A.; Vermote, E.F.; Townshend, J.R. Global Land Change from 1982 to 2016. Nature 2018, 560, 639–643. [Google Scholar] [CrossRef]
  10. Liu, L.; Wu, J. Ecosystem Services-Human Wellbeing Relationships Vary with Spatial Scales and Indicators: The Case of China. Resour. Conserv. Recycl. 2021, 172, 105662. [Google Scholar] [CrossRef]
  11. Hein, L.; van Koppen, K.; de Groot, R.S.; van Ierland, E.C. Spatial Scales, Stakeholders and the Valuation of Ecosystem Services. Ecol. Econ. 2006, 57, 209–228. [Google Scholar] [CrossRef]
  12. Kroll, F.; Müller, F.; Haase, D.; Fohrer, N. Rural–Urban Gradient Analysis of Ecosystem Services Supply and Demand Dynamics. Land Use Policy 2012, 29, 521–535. [Google Scholar] [CrossRef]
  13. Liu, H.; Fan, Y.; Ding, S. Research progress of ecosystem service flow. Chin. J. Appl. Ecol. 2016, 27, 2161–2171. [Google Scholar] [CrossRef]
  14. Li, S.; Zhang, C.; Liu, J.; Zhu, W.; Ma, C.; Wang, J. The tradeoffs and synergies of ecosystem services: Research progress, development trend, and themes of geography. Geogr. Res. 2013, 32, 1379–1390. [Google Scholar]
  15. Serna-Chavez, H.M.; Schulp, C.J.E.; van Bodegom, P.M.; Bouten, W.; Verburg, P.H.; Davidson, M.D. A Quantitative Framework for Assessing Spatial Flows of Ecosystem Services. Ecol. Indic. 2014, 39, 24–33. [Google Scholar] [CrossRef]
  16. Wang, J.; Zhou, W. Ecosystem service flows: Recent progress and future perspectives. Acta Ecol. Sin. 2019, 39, 4213–4222. Available online: https://kns.cnki.net/kcms2/article/abstract?v=TD_mLQSGK6ualo9_AYoF3aCIznRzGnXnm5n9dmxaTuEugOBgnHFf7OHqGpJfe0ndRY4YUICIhKXbf0Z2bRjdiO6z2NnkNTB4Cpy0ZrGyy9Ndx1uTmF_5fpZDRkHTJ8Zn1oR0EJl75kzP7pbam9ACD6ky4kGYhBQLaX2A5SfAM_HO3TpAnUyzjQ==&uniplatform=NZKPT&language=CHS (accessed on 10 May 2024).
  17. López-Hoffman, L.; Varady, R.G.; Flessa, K.W.; Balvanera, P. Ecosystem Services across Borders: A Framework for Transboundary Conservation Policy. Front. Ecol. Environ. 2010, 8, 84–91. [Google Scholar] [CrossRef]
  18. Koellner, T.; Bonn, A.; Arnhold, S.; Bagstad, K.J.; Fridman, D.; Guerra, C.A.; Kastner, T.; Kissinger, M.; Kleemann, J.; Kuhlicke, C.; et al. Guidance for Assessing Interregional Ecosystem Service Flows. Ecol. Indic. 2019, 105, 92–106. [Google Scholar] [CrossRef]
  19. Feurer, M.; Rueff, H.; Celio, E.; Heinimann, A.; Blaser, J.; Htun, A.M.; Zaehringer, J.G. Regional Scale Mapping of Ecosystem Services Supply, Demand, Flow and Mismatches in Southern Myanmar. Ecosyst. Serv. 2021, 52, 101363. [Google Scholar] [CrossRef]
  20. Shakya, B.; Uddin, K.; Yi, S.; Bhatta, L.D.; Lodhi, M.S.; Htun, N.Z.; Yang, Y. Mapping of the Ecosystem Services Flow from Three Protected Areas in the Far-Eastern Himalayan Landscape: An Impetus to Regional Cooperation. Ecosyst. Serv. 2021, 47, 101222. [Google Scholar] [CrossRef]
  21. Bagstad, K.J.; Semmens, D.J.; Diffendorfer, J.E.; Mattsson, B.J.; Dubovsky, J.; Thogmartin, W.E.; Wiederholt, R.; Loomis, J.; Bieri, J.A.; Sample, C.; et al. Ecosystem Service Flows from a Migratory Species: Spatial Subsidies of the Northern Pintail. Ambio 2019, 48, 61–73. [Google Scholar] [CrossRef] [PubMed]
  22. Liu, W.; Zhan, J.; Zhao, F.; Zhang, F.; Teng, Y.; Wang, C.; Chu, X.; Kumi, M.A. The Tradeoffs between Food Supply and Demand from the Perspective of Ecosystem Service Flows: A Case Study in the Pearl River Delta, China. J. Environ. Manag. 2022, 301, 113814. [Google Scholar] [CrossRef] [PubMed]
  23. Lin, J.; Huang, J.; Prell, C.; Bryan, B.A. Changes in Supply and Demand Mediate the Effects of Land-Use Change on Freshwater Ecosystem Services Flows. Sci. Total Environ. 2021, 763, 143012. [Google Scholar] [CrossRef]
  24. Schirpke, U.; Candiago, S.; Egarter Vigl, L.; Jäger, H.; Labadini, A.; Marsoner, T.; Meisch, C.; Tasser, E.; Tappeiner, U. Integrating Supply, Flow and Demand to Enhance the Understanding of Interactions among Multiple Ecosystem Services. Sci. Total Environ. 2019, 651, 928–941. [Google Scholar] [CrossRef] [PubMed]
  25. Wang, Z.; Zhang, L.; Li, X.; Li, Y.; Frans, V.F.; Yan, J. A Network Perspective for Mapping Freshwater Service Flows at the Watershed Scale. Ecosyst. Serv. 2020, 45, 101129. [Google Scholar] [CrossRef]
  26. Qiao, X.; Zhang, T.; Yang, Y.; Niu, H.; Yang, D. Spatial flow of ecosystem services and impacts on human well-being in the Weigan River Basin. Resour. Sci. 2017, 39, 533–544. [Google Scholar] [CrossRef]
  27. Nikodinoska, N.; Paletto, A.; Pastorella, F.; Granvik, M.; Franzese, P.P. Assessing, Valuing and Mapping Ecosystem Services at City Level: The Case of Uppsala (Sweden). Ecol. Model. 2018, 368, 411–424. [Google Scholar] [CrossRef]
  28. Shen, J.; Wang, Y. Allocating and Mapping Ecosystem Service Demands with Spatial Flow from Built-up Areas to Natural Spaces. Sci. Total Environ. 2021, 798, 149330. [Google Scholar] [CrossRef]
  29. Zhai, T.; Zhang, D.; Zhao, C. How to Optimize Ecological Compensation to Alleviate Environmental Injustice in Different Cities in the Yellow River Basin? A Case of Integrating Ecosystem Service Supply, Demand and Flow. Sustain. Cities Soc. 2021, 75, 103341. [Google Scholar] [CrossRef]
  30. Goldenberg, R.; Kalantari, Z.; Cvetkovic, V.; Mörtberg, U.; Deal, B.; Destouni, G. Distinction, Quantification and Mapping of Potential and Realized Supply-Demand of Flow-Dependent Ecosystem Services. Sci. Total Environ. 2017, 593–594, 599–609. [Google Scholar] [CrossRef]
  31. Li, D.; Wu, S.; Liu, L.; Liang, Z.; Li, S. Evaluating Regional Water Security through a Freshwater Ecosystem Service Flow Model: A Case Study in Beijing-Tianjian-Hebei Region, China. Ecol. Indic. 2017, 81, 159–170. [Google Scholar] [CrossRef]
  32. Chen, R.; Zhang, D.; Li, B. Spatial–Temporal Calculation Simulation of Ecological Footprint of Resource and Environmental Pollution in Green Communication. EURASIP J. Wirel. Commun. Netw. 2020, 2020, 258. [Google Scholar] [CrossRef]
  33. Bai, J.; Li, J.; Zhou, Z.; Dang, H.; Zhang, Y.; Wang, C.; Sun, Y. Actual Supply of Soil Conservation Services Limits Their Use: From an Ecosystem Service Flow Perspective. Ecol. Indic. 2025, 173, 113420. [Google Scholar] [CrossRef]
  34. Hu, Y.; Pan, T.; Zhang, W. On the Economic Growth Effect of the Coordinated Innovation of the Yangtze River Delta Urban Agglomeration under the Integrated National Strategy. J. East China Norm. Univ. (Humanit. Soc. Sci.) 2019, 51, 99–106. [Google Scholar] [CrossRef]
  35. Zhang, X.; Lin, Y.; Meng, M. The Evolution of Regional Integration Development Mechanism in the Yangtze River Delta: Experiences and Future Trends. J. Anhui Univ. (Philos. Soc. Sci. Ed.) 2019, 43, 138–147. [Google Scholar] [CrossRef]
  36. Reid, W.; Mooney, H.; Cropper, A.; Capistrano, D.; Carpenter, S.; Chopra, K. Ecosystems and Human Well-Being: Synthesis; World Resources Institute: Washington, DC, USA, 2005; pp. 39–45. [Google Scholar]
  37. Costanza, R.; d’Arge, R.; de Groot, R.; Farber, S.; Grasso, M.; Hannon, B.; Limburg, K.; Naeem, S.; O’Neill, R.V.; Paruelo, J.; et al. The Value of the World’s Ecosystem Services and Natural Capital. Nature 1997, 387, 253–260. [Google Scholar] [CrossRef]
  38. Xie, G.; Zhen, L.; Lu, C.; Xiao, Y.; Chen, C. Expert Knowledge Based Valuation Method of Ecosystem Services in China. J. Nat. Resour. 2008, 23, 911–919. [Google Scholar] [CrossRef]
  39. Xie, G.; Zhang, C.; Zhang, L.; Chen, W.; Li, S. Improvement of the Evaluation Method for Ecosystem Service Value Based on Per Unit Area. J. Nat. Resour. 2015, 30, 1243–1254. [Google Scholar] [CrossRef]
  40. Su, K.; Wei, D.; Lin, W. Evaluation of Ecosystem Services Value and Its Implications for Policy Making in China—A Case Study of Fujian Province. Ecol. Indic. 2020, 108, 105752. [Google Scholar] [CrossRef]
  41. Niu, H.; An, R.; Xiao, D.; Liu, M.; Zhao, X. Estimation of Ecosystem Services Value at a Basin Scale Based on Modified Equivalent Coefficient: A Case Study of the Yellow River Basin (Henan Section), China. Int. J. Environ. Res. Public Health 2022, 19, 16648. [Google Scholar] [CrossRef]
  42. Zhang, J.; He, C.; Huang, Q.; Li, L. Understanding Ecosystem Service Flows through the Metacoupling Framework. Ecol. Indic. 2023, 151, 110303. [Google Scholar] [CrossRef]
  43. Zhang, X.-L.; Niu, C.-H.; Ma, S.; Wang, L.-J.; Hu, H.-B.; Jiang, J. Exploring Ecological Compensation Standards in the Urbanization Process: An Ecosystem Service Value-Based Perspective. Ecol. Indic. 2024, 166, 112510. [Google Scholar] [CrossRef]
  44. Wang, T.; Wang, X.; Qin, Y.; Gao, P.; Wang, H. Spatial-temporal Correlation Analysis of Ecosystem Services Value and Human Activities in Danjiangkou Reservoir Area. Resour. Environ. Yangtze Basin 2021, 30, 330–341. [Google Scholar] [CrossRef]
  45. Converse, P.D.; Reilly, W.J. New Laws of Retail Gravitation. J. Mark. 1949, 14, 379–384. [Google Scholar] [CrossRef]
  46. Chang, H.; Geng, W.; Zhang, P.; Shao, J.; Liu, Z.; Lou, Y.; Wang, Q.; Zhang, J.; Zhu, H. Study on the Evolution of Urban Radiation Intensity and Pattern in Henan Province. J. Henan Univ. (Nat. Sci.) 2021, 51, 524–534. [Google Scholar] [CrossRef]
  47. Tan, F.; Lu, Z. Regional Sustainability System as Ecosystem: Case Study of China’s Two Leading Economic Circles from a Keystone Perspective. Environ. Dev. Sustain. 2019, 21, 961–983. [Google Scholar] [CrossRef]
  48. Liu, M.; Fan, J.; Wang, Y.; Hu, C. Study on Ecosystem Service Value (ESV) Spatial Transfer in the Central Plains Urban Agglomeration in the Yellow River Basin, China. Int. J. Environ. Res. Public Health 2021, 18, 9751. [Google Scholar] [CrossRef]
  49. Wang, C.; Li, W.; Sun, M.; Wang, Y.; Wang, S. Exploring the Formulation of Ecological Management Policies by Quantifying Interregional Primary Ecosystem Service Flows in Yangtze River Delta Region, China. J. Environ. Manag. 2021, 284, 112042. [Google Scholar] [CrossRef]
  50. Ji, Q.; Feng, X.; Sun, S.; Zhang, J.; Li, S.; Fu, B. Cross-Scale Coupling of Ecosystem Service Flows and Socio-Ecological Interactions in the Yellow River Basin. J. Environ. Manag. 2024, 367, 122071. [Google Scholar] [CrossRef]
  51. Chi, C.; Shen, J.; Gao, X.; Hu, P.; Yi, P. Horizontal Ecological Compensation Standards Based on Ecosystem Services Flow. Ecol. Indic. 2024, 163, 112081. [Google Scholar] [CrossRef]
  52. Wu, J.; Feng, Z.; Zhang, X.; Xu, Y.; Peng, J. Delineating Urban Hinterland Boundaries in the Pearl River Delta: An Approach Integrating Toponym Co-Occurrence with Field Strength Model. Cities 2020, 96, 102457. [Google Scholar] [CrossRef]
  53. Fan, X.; Gao, J.; Wen, W. Exploratory Study on Eco-Assets Transferring and the Valuating Models. Res. Environ. Sci. 2007, 20, 160–164. [Google Scholar] [CrossRef]
  54. Dolan, R.; Bullock, J.M.; Jones, J.P.G.; Athanasiadis, I.N.; Martinez-Lopez, J.; Willcock, S. The Flows of Nature to People, and of People to Nature: Applying Movement Concepts to Ecosystem Services. Land 2021, 10, 576. [Google Scholar] [CrossRef]
Figure 1. Study area.
Sustainability 17 04727 g001
Figure 2. Structure of ESV in the YRD urban agglomeration from 2000 to 2020: (a) composition by land use types; (b) composition by ecosystem service types.
Sustainability 17 04727 g002
Figure 3. Spatial distribution of ESV in the YRD urban agglomeration from 2000 to 2020 ((A) is the ESV in 2000, (B) is the ESV in 2010, and (C) is the ESV in 2020). The dots in B represent the changes in ESV from 2000 to 2010, and the dots in C represent the changes in ESV from 2010 to 2020. The colors represent the magnitude of the change.
Sustainability 17 04727 g003
Figure 4. ESF in the YRD urban agglomeration from 2000 to 2020 ((A) is the ESF in 2000, (B) is the ESF in 2010, and (C) is the ESF in 2020). Cities with the same font color indicate ESF increases over 10% and CNY 0.1 billion; italics represent SBAs. Cities with the same circle color indicate ESF decreases over 10% and CNY 0.1 billion. (B) represents changes from 2000 to 2010, and (C) represents changes from 2010 to 2020.
Sustainability 17 04727 g004
Figure 5. SPAs and SBAs in the YRD urban agglomeration from 2000 to 2020.
Sustainability 17 04727 g005
Figure 6. Net ecosystem service outflows in representative cities of the YRD urban agglomeration from 2000 to 2020 ((A) is the net ecosystem service outflows in 2000, (B) is the net ecosystem service outflows in 2010, and (C) is the net ecosystem service outflows in 2020). Lines and circles in the same color represent the net ecosystem service outflow from the same city.
Sustainability 17 04727 g006
Figure 7. Schematic diagram of the four-quadrant division of per area ESV and per capita GDP based on ESF. The arrows represent the paths of urban evolution in the YRD, black arrows are paths that need to move forward, and gray arrows are optional paths.
Sustainability 17 04727 g007
Figure 8. Results of the quadrant division of the YRD urban agglomeration from 2000 to 2020.
Sustainability 17 04727 g008
Table 1. Evolution of city quadrant division in the YRD urban agglomeration from 2000 to 2020.
Initial QuadrantFinal QuadrantCities
High ecological support–high economic development quadrant ILow ecological support–high economic development quadrant IIChangzhou
High ecological support–high economic development quadrant IHigh ecological support–low economic development quadrant IVTaizhou (Zhejiang), Jinhua, Tongling, and Wenzhou
Low ecological support–high economic development quadrant IIHigh ecological support–high economic development quadrant IMa’anshan
High ecological support–low economic development quadrant IVHigh ecological support–high economic development quadrant IHuai’an
Low ecological support–low economic development quadrant IIILow ecological support–high economic development quadrant IIYancheng, Xuzhou, Hefei, and Taizhou (Jiangsu)
Disclaimer/Publisher’s Note: The statements, opinions and data contained in all publications are solely those of the individual author(s) and contributor(s) and not of MDPI and/or the editor(s). MDPI and/or the editor(s) disclaim responsibility for any injury to people or property resulting from any ideas, methods, instructions or products referred to in the content.