1. Introduction
The transition to renewable energy sources and the incorporation of green hydrogen into the global energy matrix are essential strategies for mitigating environmental impacts and promoting sustainability. Green hydrogen is defined as hydrogen produced through water electrolysis using 100% renewable energy, such as offshore wind energy, playing an important role in the decarbonisation of industrial and transport sectors and contributing to the reduction in greenhouse gas emissions. In 2023, the installed capacity of renewable energy reached nearly 540 GW, representing a 75% increase compared to the previous year according to the IEA (International Energy Agency) [
1] in its Executive Summary—CO
2 Emissions, highlighting the growing interest and investment in clean and efficient technologies.
In the Brazilian context, wind energy stands out as a highly promising solution, particularly in offshore areas [
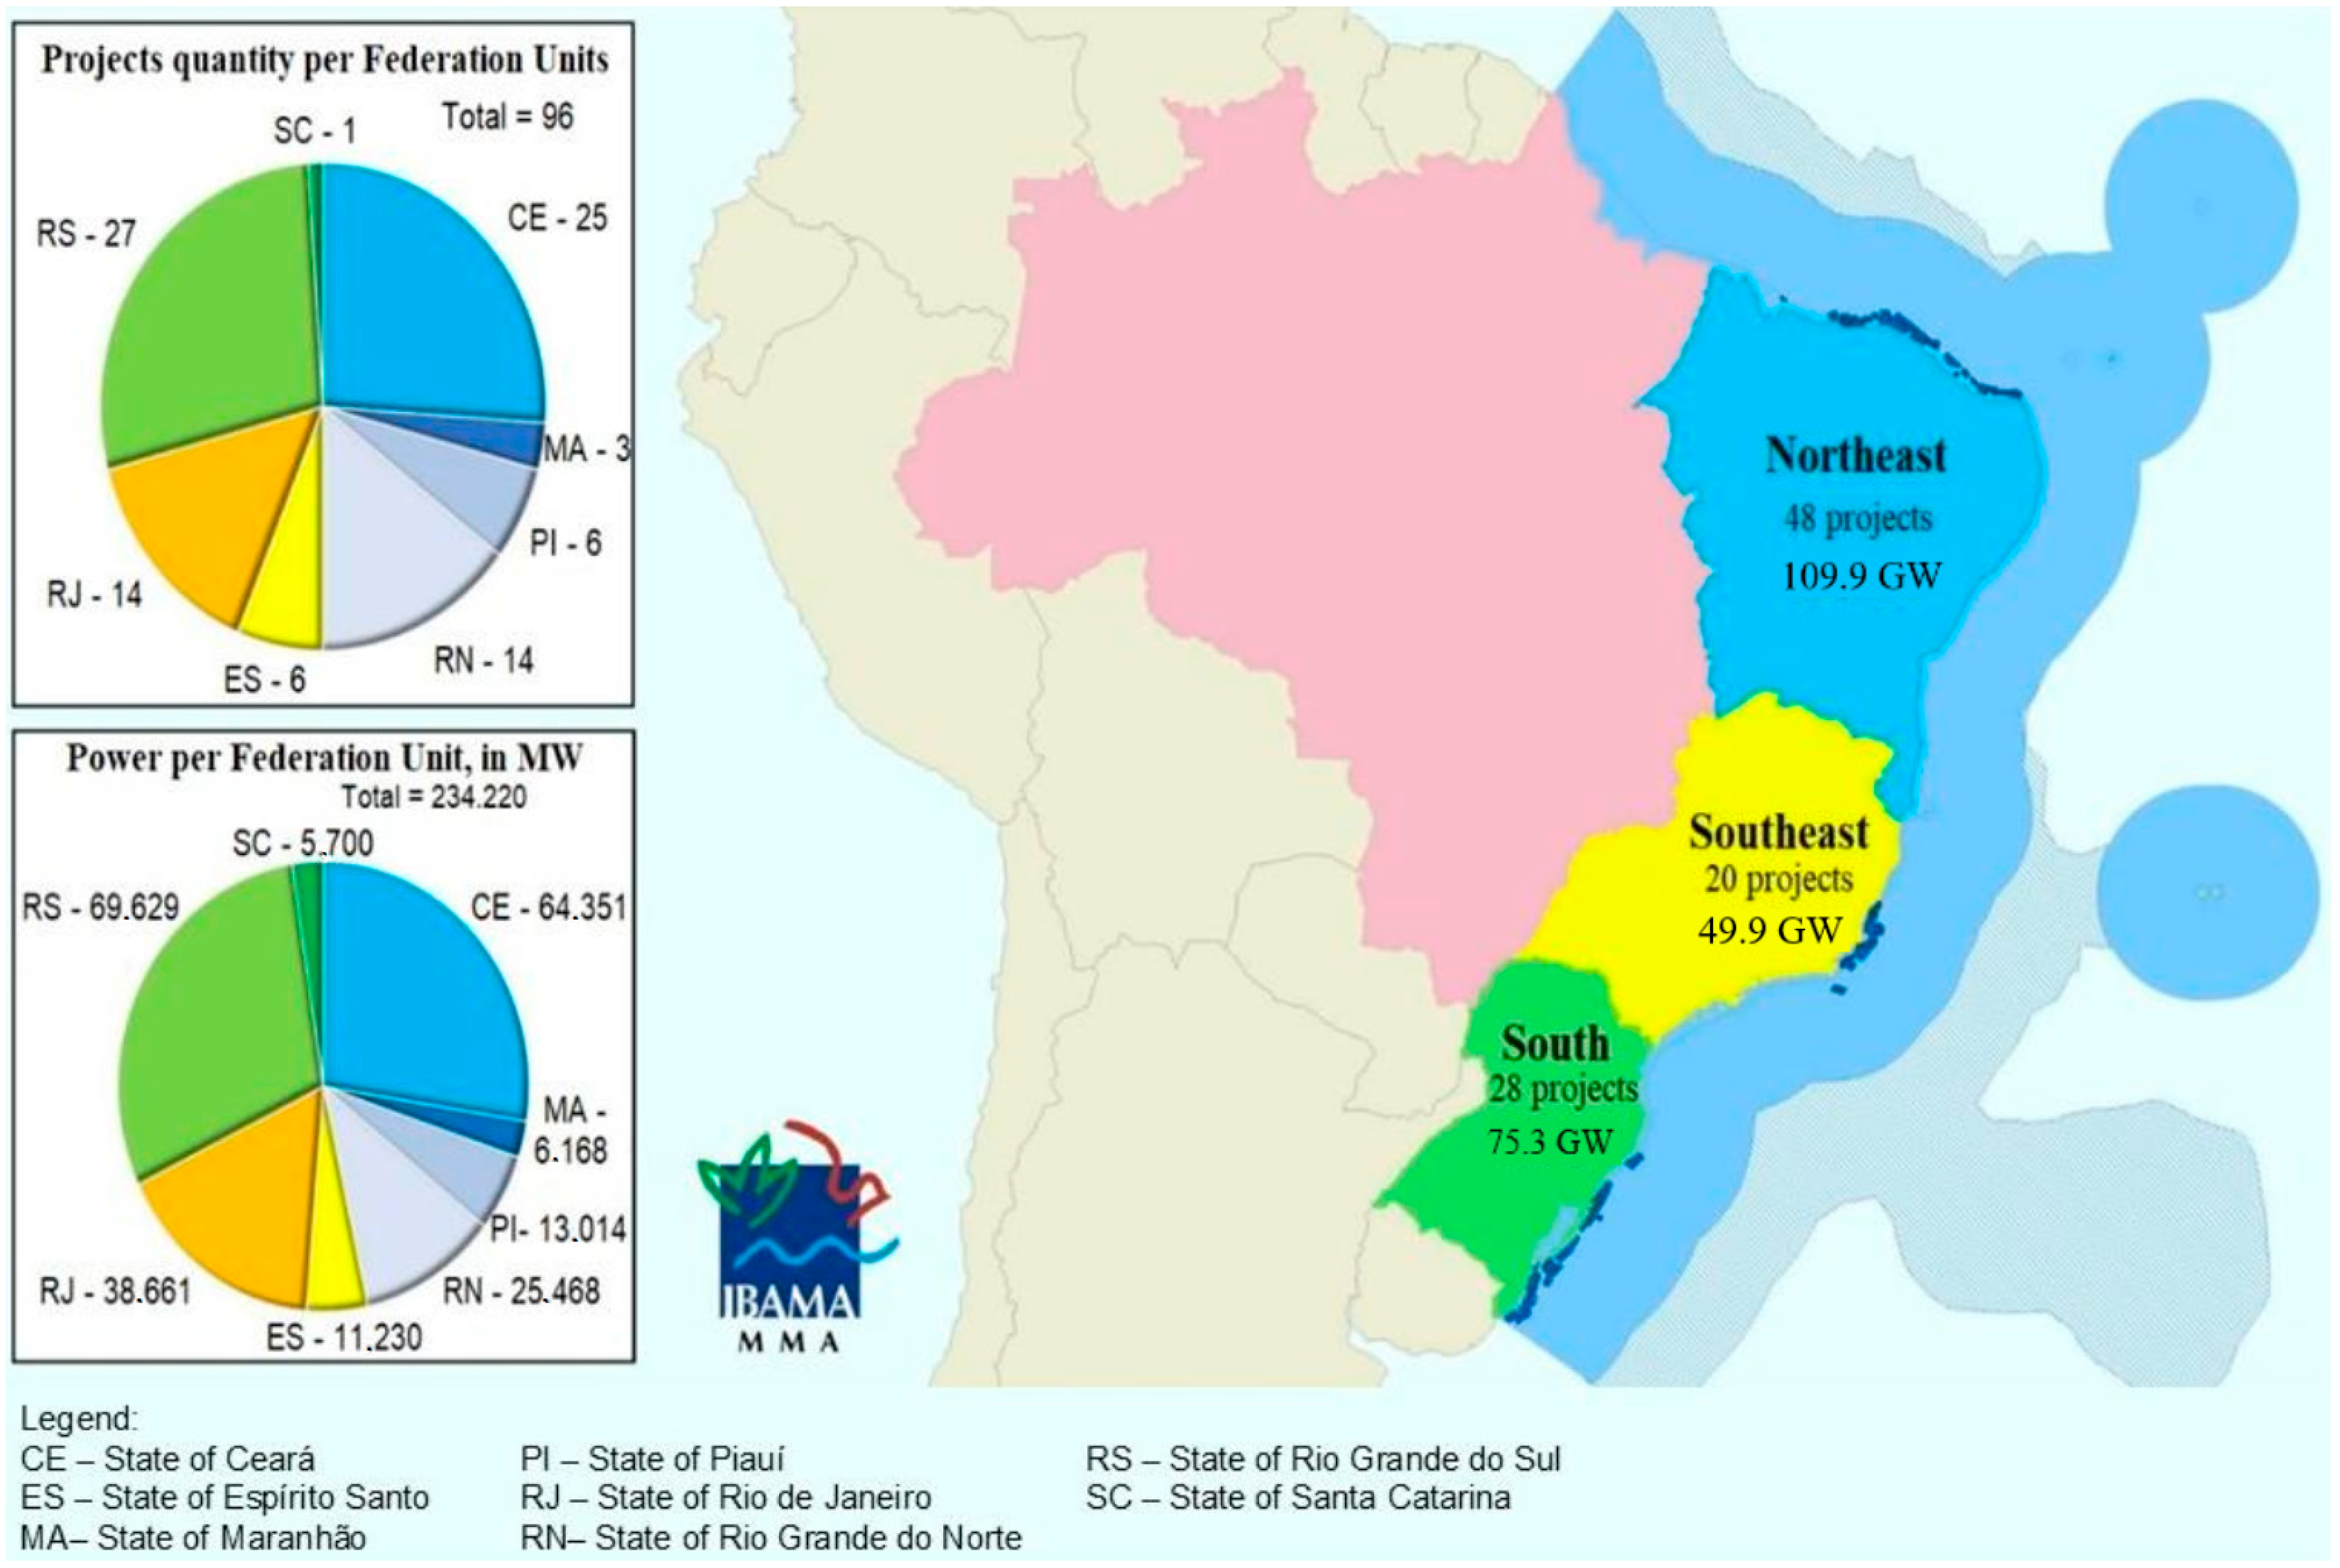
2]. The northeast region has been at the forefront of this movement, with 96 offshore wind projects currently under review by the IBAMA (Brazilian Institute for the Environment and Renewable Natural Resources) [
3] and the state of Ceará playing a leading role in the generation of clean energy.
Figure 1 illustrates a map showing the distribution of these projects across different regions of the country, along with the installed capacity in megawatts (MWs), demonstrating both the concentration of investments and the expansion potential of this energy source.
This offshore wind potential is considered important for enabling large-scale green hydrogen (GH
2) production in Ceará, aligning with state strategies to develop an GH
2 hub [
4]. The production of GH
2 via water electrolysis depends directly on the availability of sufficient and affordable renewable energy [
5]. Offshore wind turbines not only generate electricity but also enable the production of a fuel that can reduce the reliance on fossil fuels in key sectors, making green hydrogen an important part of the energy transition [
6].
However, developing this potential for offshore wind generation, and consequently for GH
2 production, presents challenges along the coast of Ceará, particularly related to soil conditions. The coastal areas of Ceará are mostly composed of carbonate soils, which form through natural processes such as weathering, transport, and mineral deposition [
7]. These soils, made up of thick layers of limestone sediments, are common in northeastern coastal regions. In Ceará, they mainly consist of “coarse-grained carbonates” (sediments with relatively larger particles, often formed from the breakdown of bioclastic structures like corals), with significant amounts of Halimeda, Lithothamnion, and “rhodoliths” (rounded clusters of limestone fragments, formed mainly from the accumulation and consolidation of calcareous algae residues) [
8]. Studies by Poulos [
9] and Semple [
10] highlight that limestone sediments differ from silica sands as they tend to be structurally weaker and vary in their mechanical properties, which can affect the stability of wind turbine foundations. Furthermore, the dynamic parameters of this kind of soil are also a topic of discussion, as seen in the study by Barroso and Moura [
11].
Globally, marine carbonate soils present specific geotechnical challenges compared to silica-based soils, affecting the design and installation of offshore foundations [
9,
10]. Research from regions with carbonate deposits, such as the Northwest Shelf of Australia, the North Sea, and the Persian Gulf [
12,
13], indicates concerns regarding the compressibility, susceptibility to particle crushing under loads, variable cementation effects, and the soil response to the cyclic loading from waves and wind [
12,
14]. These factors can influence the performance of foundation types like monopiles, jackets, or gravity bases, affecting the axial and lateral capacity, settlement behaviour, and long-term stability [
15,
16]. Therefore, a characterisation of the specific properties of local carbonate sands is needed for selecting appropriate engineering solutions and reducing risks associated with offshore wind projects in the Brazilian context.
Geotechnical tests assess how these soils behave under different conditions, providing data to help design suitable foundations for wind turbines [
17]. This study used both field and laboratory tests to analyse three types of soil found along the Ceará coastline: one sample of quartz sand and two samples of carbonate sands with different calcium carbonate levels. The methods used included a particle size analysis, X-ray fluorescence tests, electron microscopy, as well as direct shear, triaxial, and pressuremeter tests (using the Ménard method).
These tests helped determine key parameters, such as shear strength, compressibility, and elasticity, which are essential for installation planning and structural safety. Initial results suggest that while carbonate soils present technical challenges due to their high porosity and variability, experimental data help identify suitable foundation solutions. The sample with a higher calcium carbonate content showed a greater mechanical strength, whereas the quartz sand sample had an intermediate performance. These findings highlight the importance of a detailed material analysis when designing large structures like offshore wind turbines.
This study investigates the implications of these geotechnical findings for the related development of wind power for green hydrogen production, indicating how Ceará might utilise its renewable resources. The link between clean electricity generation (supported by suitable offshore foundations) and electrolysis, which avoids carbon emissions by using renewable energy, underlines the need for investments in sustainable energy technologies.
This study highlights the role of geotechnical tests in addressing the challenges of carbonate soils along Ceará’s coast for offshore wind deployment and explores the implications for the associated green hydrogen production. The findings provide technical guidance to reduce risks associated with offshore wind turbine installation, on this specific soil, and support the development of a cleaner and more sustainable energy system.
Based on these findings, this study contributes to geotechnical engineering knowledge regarding carbonate sands, an understanding needed for integrating renewable energy with hydrogen production, reinforcing Ceará’s role in the energy transition and in developing a more environmentally responsible future.
2. Materials and Methods
2.1. Sample Collection and Characterisation
The selection of sampling locations was based on the study by Almeida et al. [
18], which examined the sedimentary facies of the continental shelf in Ceará. This study analysed 1907 samples collected along the entire coastline, providing insights into how materials are deposited in the region due to transport, deposition, or diagenetic processes.
Figure 2 presents a map illustrating these patterns.
As shown in
Figure 2, a large section of the coastline contains bioclastic materials composed of biological components, such as shells, marine skeletons, and algae. This zone covers 11,455 km
2 of Ceará’s coast, extending from Barroquinha to São Gonçalo do Amarante (western coast) and from Fortim to Icapuí (eastern coast).
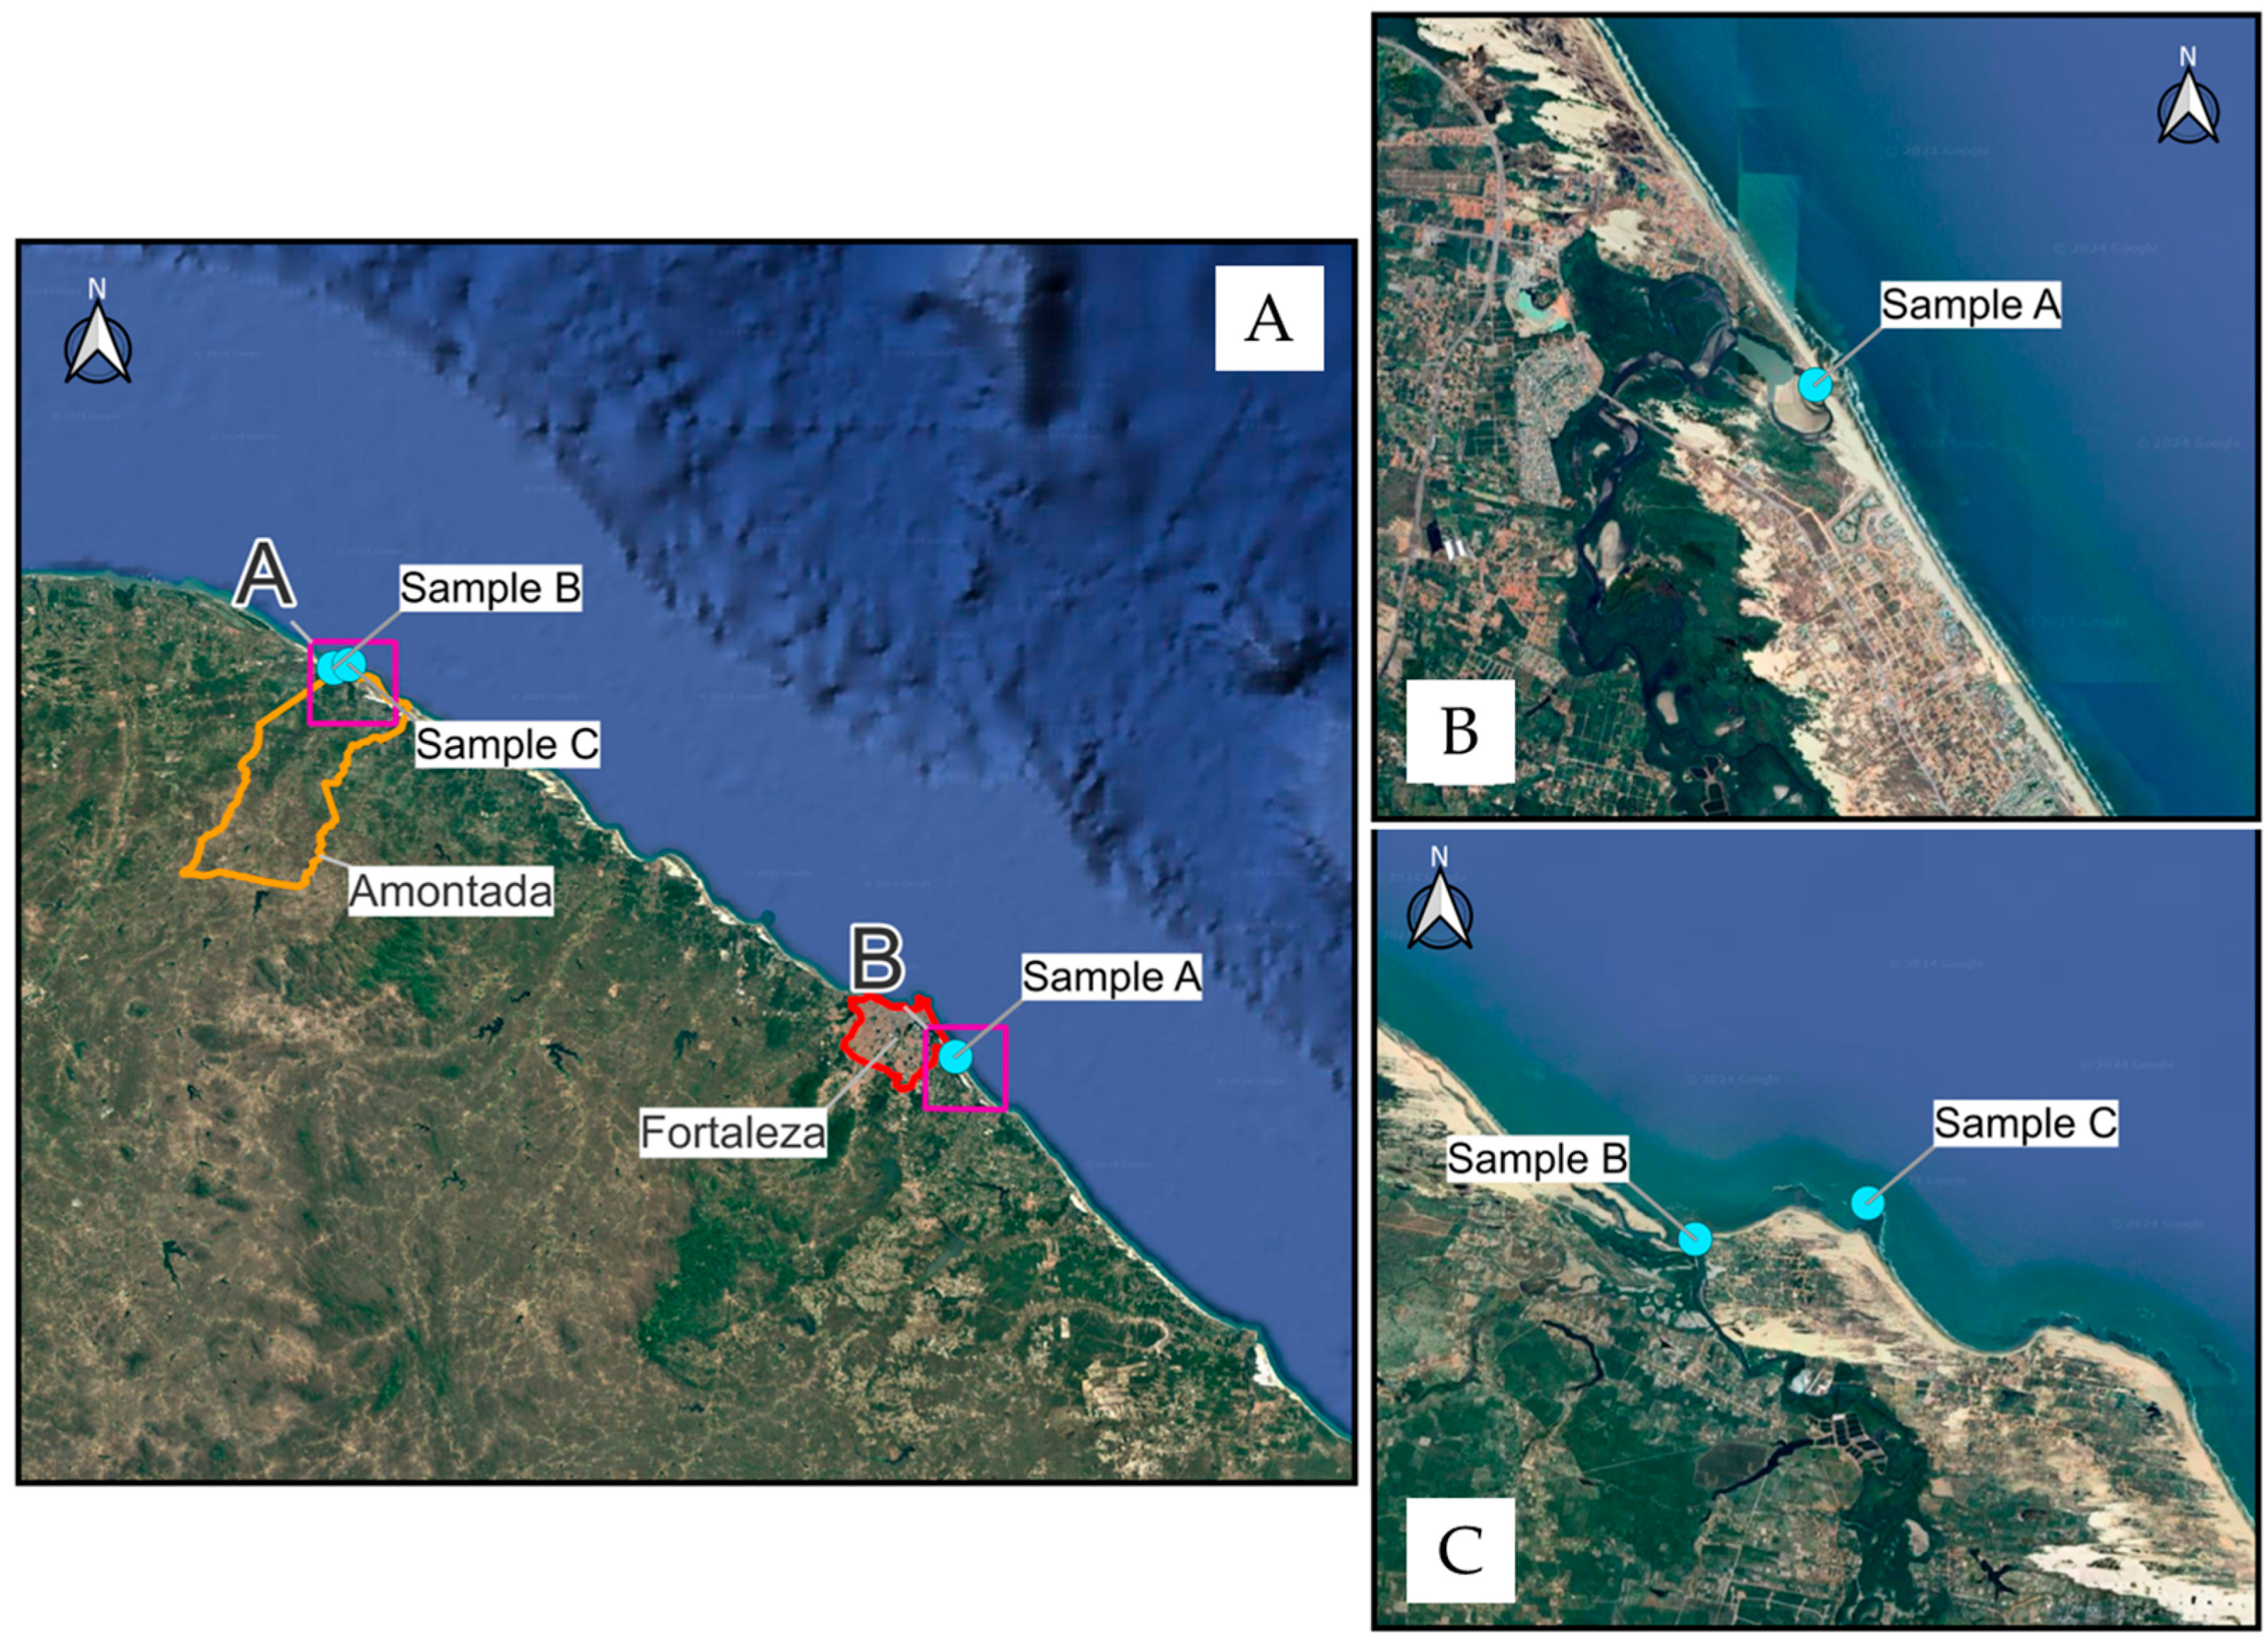
The map also indicates a significant overlap between the bioclastic material zone and the coastline of Amontada, suggesting a high likelihood of finding sandy sediments with notable carbonate contents. Based on this, samples were collected from three different locations (
Figure 3):
Sample A: quartz sand from the mouth of the Pacoti River, on the border between Fortaleza and Aquiraz (Ceará);
Sample B: carbonate sand collected from the mouth of the Aracatiaçu River, at Moitas Beach (Amontada, Ceará);
Sample C: offshore carbonate sand extracted from the seabed at a depth of 7 m below sea level and 650 m from the coast, also at Moitas Beach.
Figure 3.
Map of location of collected samples. (A) Site Overview, (B) Sample A and (C) Samples B and C.
Figure 3.
Map of location of collected samples. (A) Site Overview, (B) Sample A and (C) Samples B and C.
Sample A, collected at a depth of approximately 40 cm using a hand auger, is light in colour and contains no noticeable calcareous fragments or bioclasts. Sample B (carbonate sand), taken from around a 1 m depth, is more varied, containing shells and rhodoliths, indicating its bioclastic composition. Sample C (offshore carbonate sand), retrieved from a depth of 7 m below sea level and 650 m from the shoreline, consists mainly of whole and fragmented shells and has a darker colour.
The onshore samples (A and B) were collected manually using augers and shovels. The material was then placed in sealed plastic bags and labelled. For the offshore sample (C), professional divers equipped with diving gear used manual scoop samplers to extract the sediment from the seabed at a 7 m depth below sea level. The material was carefully handled to minimise the disturbance of its original structure and stored in sealed, labelled plastic bags.
To characterise the samples, eight types of tests were carried out at the laboratories of the Federal University of Cariri (UFCA) and the Federal University of Ceará (UFC). The samples were air-dried, quartered, and divided following the ABNT 6457 [
19] standard. Particle size distribution was determined by sieve analysis ABNT 7181 [
20], and the relative density of grains (Gs) was measured using a pycnometer in accordance with ABNT 6458 [
21]. Maximum and minimum void ratios were obtained using metal cylinders and a sieve shaker, following the ABNT 16840 [
22] and ABNT 16843 [
23] standards.
X-ray fluorescence tests were performed to determine the chemical composition of the samples, along with specific tests to quantify the calcium carbonate (CaCO
3) content using a modified Bernard Calcimeter (
Figure 4a). The equipment’s calibration was verified using standard calcium carbonate (CaCO
3 P.A.) to ensure the accuracy of the released CO
2 volume measurements. A low-vacuum scanning electron microscope (Hitachi TM3000 model, Tokyo, Japan) was used to analyse particle morphology, as shown in
Figure 4b.
To assess strength and deformability parameters—such as friction angle, cohesion intercept, and secant Young’s modulus (measured at 50% of failure load)—direct shear tests were carried out under saturated conditions. The tests were conducted on both loose and dense samples using confining stresses of 50 kPa, 100 kPa, and 200 kPa, following ASTM D3080/D3080 M-23 [
24] guidelines, using an Owntec MS 101 device (Santa Cruz do Sul, Brazil). The dense-state specimens for each sample were prepared by calculating their mass based on the minimum void ratio of the soil, the relative density of the soil grains (Gs), and the volume of the split mould used in the test, targeting the experimentally determined values presented in
Section 3 (0.58 for Sample A, 0.53 for Sample B, and 0.60 for Sample C). In contrast, the loose-state specimens had their masses determined according to the maximum void ratio, targeting the values also in
Section 3 (0.79 for Sample A, 0.76 for Sample B, and 0.89 for Sample C). This preparation method resulted in the dense specimens exhibiting mass increases (compared to the loose state) of approximately 13.2% for Sample A, 15.4% for Sample B, and 18.4% for Sample C. Additionally, consolidated drained (CD) triaxial tests were performed in accordance with ASTM D7181-20 [
25] using a Matest S301N apparatus (Treviolo, Italy). The selection of consolidated drained tests was because sandy soils generally exhibit drained behaviour under loading, which aligns with the conditions found in coastal sands.
Field tests were also carried out in areas near the shoreline, where subsurface conditions are considered like those of the seabed in the region. The advantage of in situ testing is that it provides data that reflect the actual stress state, as well as site-specific chemical, thermal, and structural conditions.
The confining stresses used in the strength tests were selected to represent the stress state of the soil down to approximately 10 m below the seabed. It is important to note that as depth increases, the soil is subjected to greater stresses, which can lead to significant variations in its strength parameters. This factor is particularly relevant when designing foundations for offshore wind turbines, as structures installed at greater depths experience higher static and dynamic loads. These factors influence the technical feasibility and reliability of clean energy projects, as well as the potential for sustainable green hydrogen production. Understanding how confining stresses affect soil behaviour is therefore essential for the development of offshore wind farms and for advancing the energy transition, particularly in regions like Ceará, where renewable energy potential can drive sustainability initiatives.
2.2. In Situ Soil Characterisation
Determining geotechnical parameters through in situ tests is important not only for designing stable foundations for offshore wind turbines but also for supporting renewable energy projects with reduced environmental impact. These data contribute to the sustainable generation of electricity and the production of green hydrogen, reinforcing environmental responsibility.
For field testing, a Ménard-type pressuremeter,
Figure 5, manufactured by the French company APAGEO (Magny-les-Hameaux, France) was used. This equipment consists of a 25 m long tubing system that connects the probe to the central pressure and volume control unit (CPV). The pressure source is a compressed nitrogen gas cylinder with a capacity of 1 m
3. The probe used was a BX-type with fitted cells and a diameter of 60 mm, equipped with a 3 mm thick rubber membrane designed for low-pressure operation [
26].
To carry out the pressuremeter test, an initial borehole with a diameter of 68 mm was drilled using a manual shell auger. The probe was inserted to a depth of 2.0 m and expanded with nitrogen gas, controlled via the command unit,
Figure 6. The test was not performed at 1.0 m depth as the sand was loosely compacted, providing insufficient resistance for probe expansion, which would have prevented the acquisition of a complete pressuremeter curve for determining soil parameters.
During the expansion process, pressure readings were recorded using a manometer, while volume measurements were taken with a volumeter. These values were adjusted based on the equipment’s calibration curves, accounting for volume loss due to the expansion of the tubing and the device itself, as well as pressure loss caused by the resistance of the probe’s membrane during expansion.
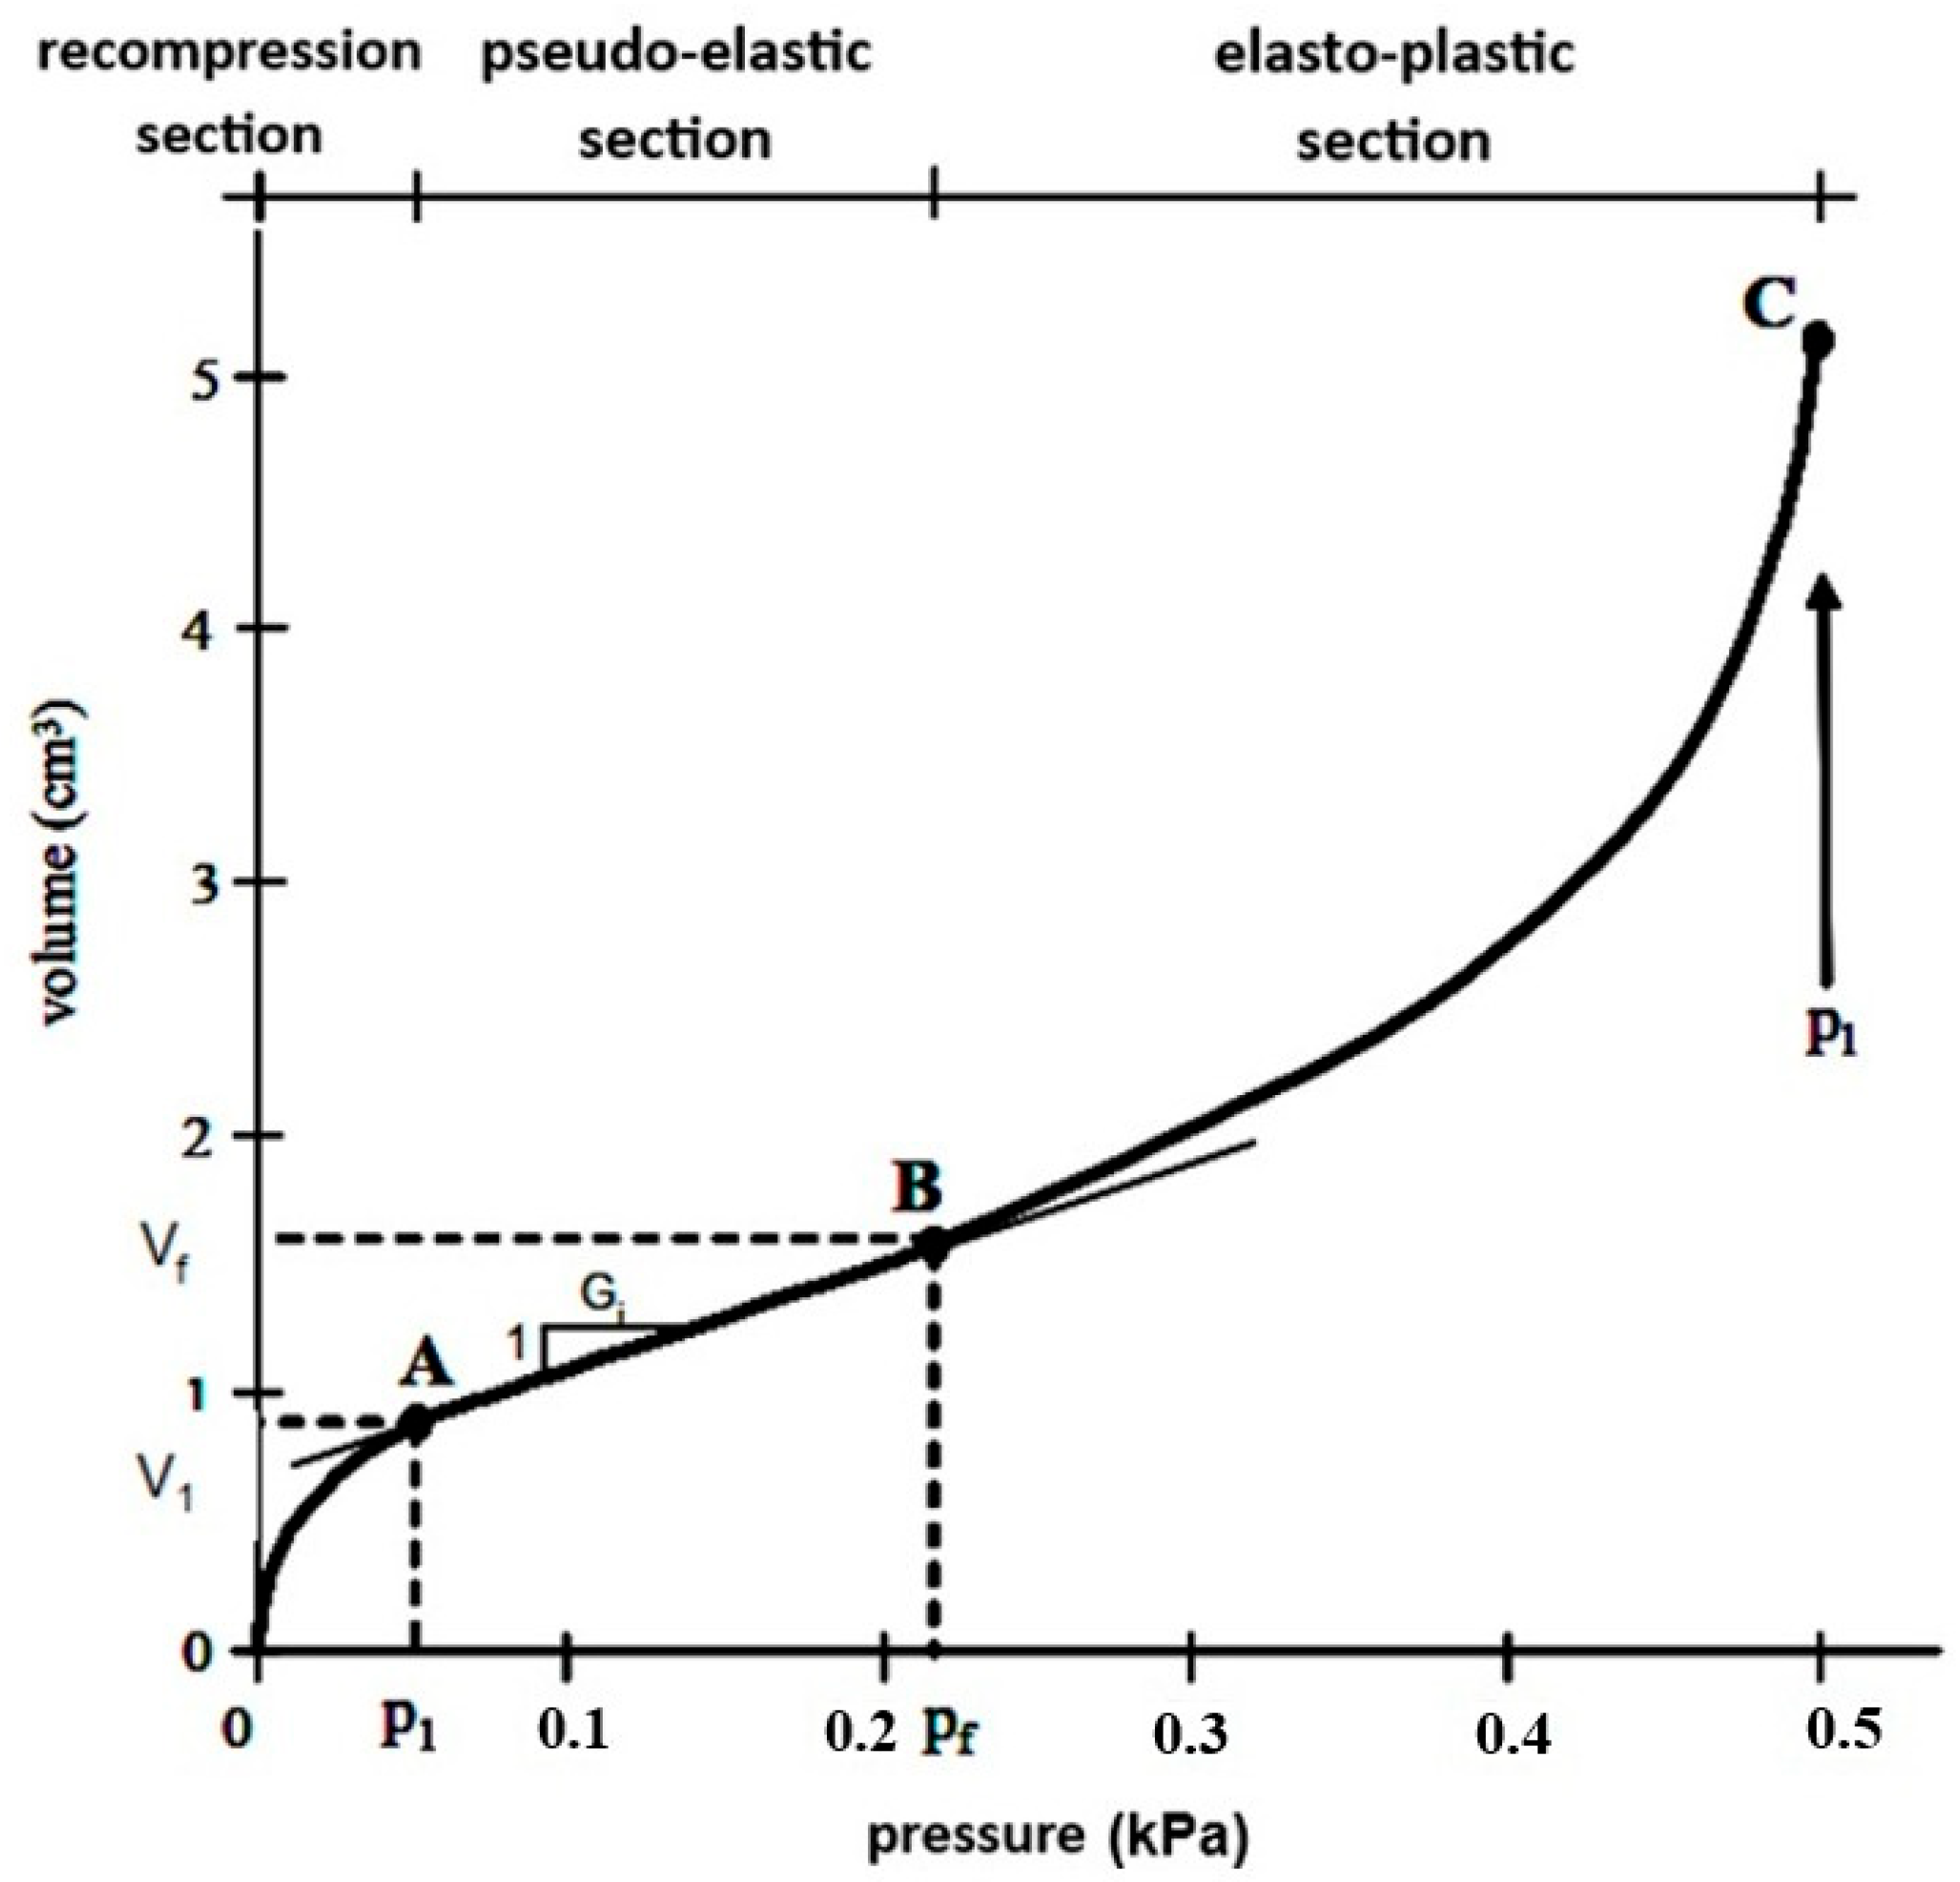
Following the cylindrical cavity expansion theory and the guidelines of the AFNOR P 94-110-1 [
27] standard, the recorded data were used to construct the pressuremeter curve shown in
Figure 7. This curve enables the determination of various geotechnical parameters in the soil’s natural state, including the initial pressuremeter modulus (E
0), the pressuremeter modulus (E
m), the limit pressure (P
l), and the creep pressure (P
f). These parameters provide essential information on soil deformability and strength, which are key considerations when designing structural solutions for offshore wind turbine foundations, ensuring both safety and long-term reliability.
Points A, B, and C in
Figure 7 represent the initial pressure (or horizontal stress at rest), the creep pressure, and the limit pressure, respectively. Using equations derived from the cylindrical cavity expansion theory, the soil’s deformability parameters can be determined.
The French standard AFNOR P 94-110-1 [
27] defines the procedures for determining these parameters, and Equations (1)–(5) allow for their direct calculation.
ν = Poisson’s ratio;
= initial probe volume;
= initial volume of the elastic range;
= final volume of the elastic range;
= initial pressure in the elastic range;
= final pressure in the elastic range.
The rheological factor (α), introduced by Ménard [
29], relates the pressuremeter modulus (E
m) to the elastic modulus (E) of the soil. As shown in
Table 1, this factor varies depending on the type of soil and its degree of compaction. Based on this relationship, the elastic modulus is calculated as follows:
G = shear modulus;
E = elastic modulus;
ν = Poisson’s ratio.
The horizontal stress at rest is an important parameter in soil stress analysis. It represents the stress at the point of contact between the probe and the cavity wall, measured immediately after the recompression phase.
The limit pressure () is defined as the pressure required to double the initial volume of the central measuring cell. It indicates the soil’s bearing capacity.
The effective limit pressure (
) is calculated by subtracting the horizontal stress at rest (
) from the limit pressure (
), as shown in Equation (4).
The creep pressure (), refers to the stress at which the soil transitions from elastic behaviour to plastic deformation.
In the context of the pressuremeter test, the friction angle (ϕ′) can be estimated by interpreting results such as the limit pressure (
) and horizontal stress at rest (
). According to Baguelin [
30], pressuremeter test data support cylindrical cavity expansion theories, which relate in situ measurements to soil strength properties. In sandy soils, where drained behaviour is dominant, the estimation of ϕ′ is more reliable.
where
- -
circumferential stress (measured from the pressuremeter test);
- -
Radial stress.
3. Results and Discussion
3.1. Ménard Pressuremeter Test (PMT)
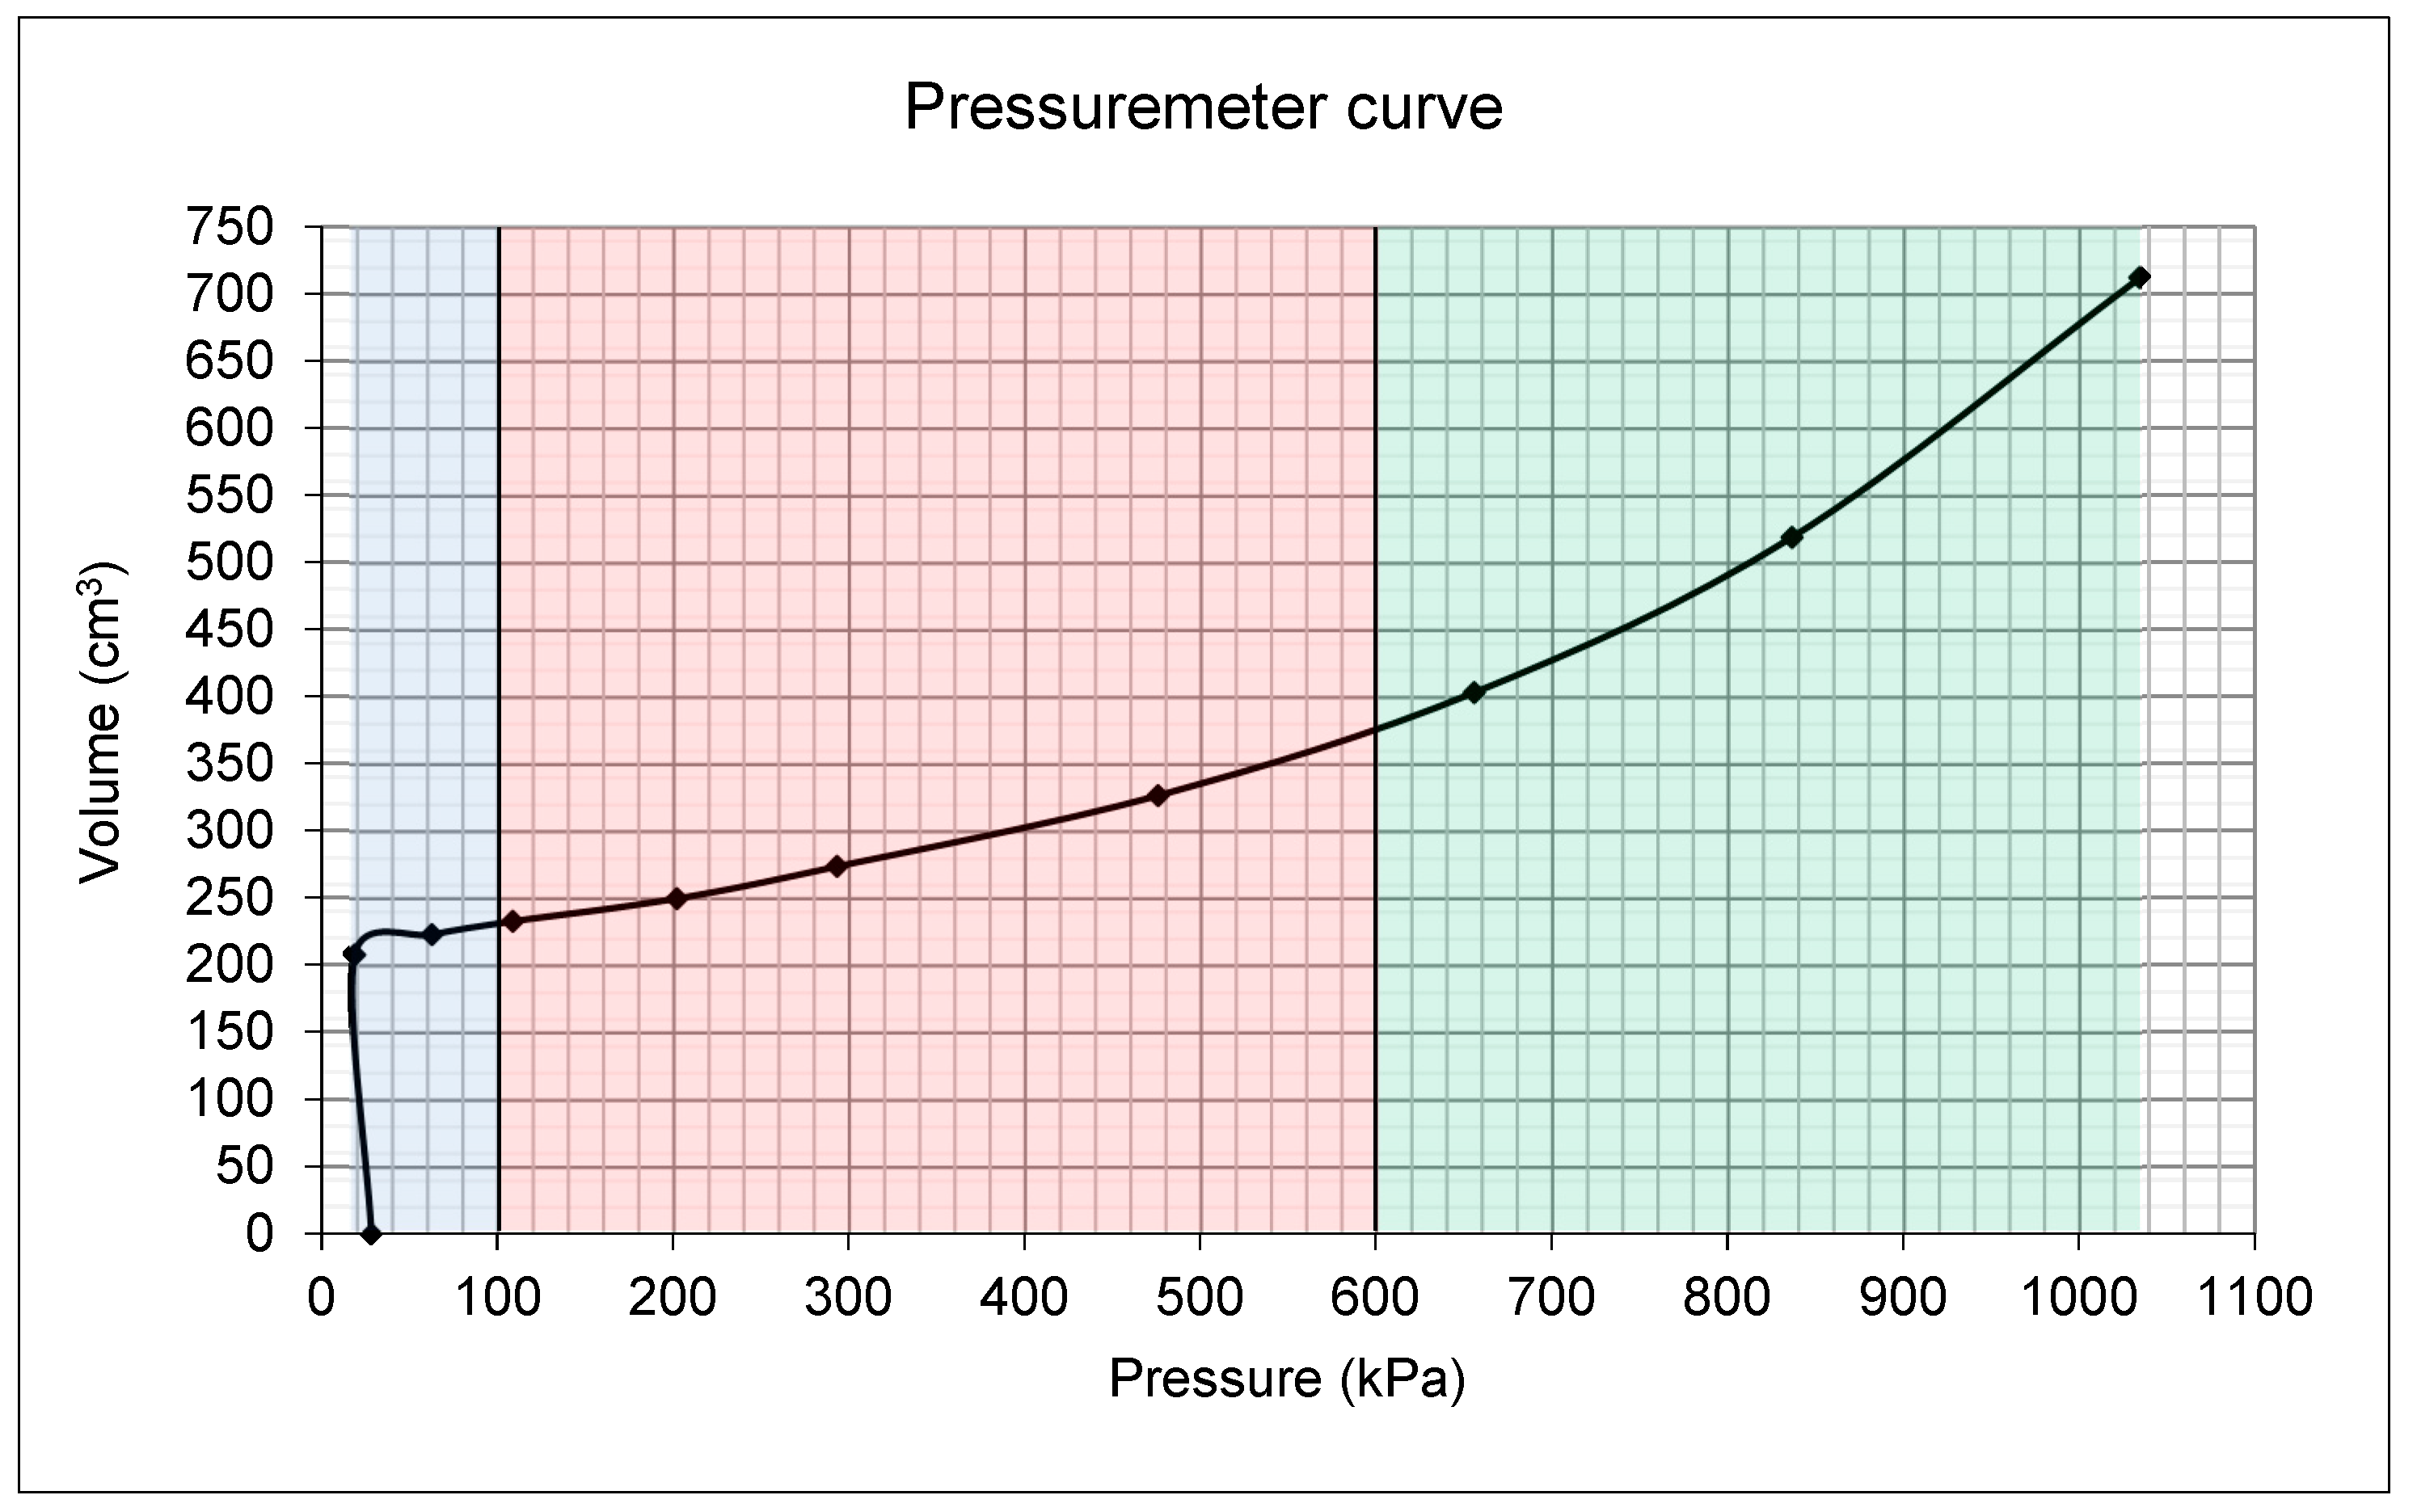
The processed data from the PMT resulted in the pressuremeter curve shown in
Figure 8, and the parameters obtained are listed in
Table 2.
The pressuremeter curve in
Figure 8 illustrates the variation in pressure and volume applied to the probe during the test. This curve allows different stages to be identified. Initially, there is a recompression phase (highlighted in blue), ranging from approximately 24 kPa to 100 kPa. This phase represents the pressure increase needed to balance the existing horizontal stress in the soil before the test.
The pressure recorded at this stage is used to determine the coefficient of the earth pressure at rest. The second section, known as the “pseudo-elastic phase”, extends from = 100 kPa to = 600 kPa. In this phase, the soil responds almost linearly to pressure changes, meaning the deformation is proportional to the applied pressure increase, allowing the determination of the deformation modulus. Finally, the last section of the curve extends from = 600 kPa to approximately 1035 kPa, where the soil’s elastoplastic behaviour is observed, and the limit pressure is determined. The limit pressure refers to the point where the soil reaches its maximum load capacity, which is obtained by extrapolating the elastoplastic section of the curve following the guidelines of NF P94-110—AFNOR (2000).
The parameters presented in
Table 2 were obtained from the
,
, and
values measured on the pressuremeter curve, using Equations (1) to (5) and the procedures set by AFNOR P 94-110-1 [
27]. At the test depth, the horizontal stress was
= 100 kPa, corresponding to the pressure recorded when the probe first contacts the borehole walls, equalising the horizontal stresses in the soil. The limit pressure, associated with soil failure, was determined as
= 1437.13 kPa. The elastic modulus, calculated from the pressuremeter modulus and the soil rheological factor, was 3531.18 kPa, which is lower than the typical range for loose quartz sands. The coefficient of the earth pressure at rest was 2.79, calculated as the ratio between the effective horizontal stress—measured when the probe contacts the borehole wall—and the effective vertical stress, obtained from the product of the soil unit weight and test depth. This value is consistent with its classification as a compact sand. Finally, the effective friction angle was determined as 38.36°.
Comparing these results with the literature, the effective friction angle (Φ′ = 38.36°) estimated from the PMT falls broadly within the range observed for calcareous sands. It is lower than the
peak friction angles reported from CD triaxial tests on Persian Gulf calcareous sands by Hassanlourad et al. [
31] (which ranged from approximately 40° to 47° depending on the density and stress level) but higher than their calculated base friction angle (Mf ≈ 33°). This highlights the influence of the test type (in situ PMT vs. laboratory triaxial) and interpretation method, alongside factors like cementation and particle characteristics noted by Semple [
10]. The calculated elastic modulus (E ≈ 3.5 MPa) appears relatively low. While Hassanlourad et al. [
31] did not report directly comparable PMT or stiffness moduli, their extensive analysis of particle breakage in similar sands under triaxial loading suggests that the potential for grain crushing, alongside inherent porosity, could contribute to a lower macroscopic stiffness, especially under higher stresses than typically applied in PMTs. This observation reinforces the importance of site-specific testing and suggests that deformability may be a key design consideration for foundations on these Ceará sands. The physical properties (Gs, void ratio ranges) of the studied sands (
Table 1 and Table 4) are comparable to those reported by Hassanlourad et al. [
31], indicating similar basic grain characteristics. The Ko value of 2.79 suggests a specific in situ stress history at the test location.
3.2. Particle Size Distribution
The sand collected from the mouth of the Pacoti River (Sample A) has a uniform grain size distribution, with 78% of grains between 0.2 mm and 0.6 mm, classifying it as a poorly graded sand (SP) according to the Unified Soil Classification System (USCS). This suggests that its mechanical properties are predictable, making it suitable for planning offshore wind turbine foundations.
In contrast, the sands from Moitas Beach (Samples B and C) have a more varied grain size distribution, classifying them as well-graded sands (SW). This variation requires detailed analysis to ensure the stability of structures in areas exposed to strong winds and waves.
Figure 9 presents the particle size curves.
The Pacoti River sand (Sample A) consists mainly of medium sand, with 99.8% of particles passing through the No. 10 sieve (2 mm) and 22.4% through the No. 40 sieve (0.425 mm). Its composition consists of 0.2% coarse sand, 77.4% medium sand, 21.5% fine sand, and 0.9% particles smaller than 0.075 mm. This indicates low variation, which simplifies foundation design. However, the low fine content (0.9%) may increase the permeability, requiring special considerations in subsea projects. Sample A consists primarily of quartz grains.
Samples B and C have a wider grain size range, including coarse sand and gravel. The Aracatiaçu River sand (Sample B) consists of 57.4% medium sand, 12% gravel, 14% coarse sand, 15.5% fine sand, and 1.1% fine particles. The presence of gravel (12%) can improve the mechanical resistance but may require solutions, such as piles or drainage systems, to maintain stability under cyclic loading. Sample B is classified as well-graded but has an intermediate uniformity.
The offshore sand from Moitas Beach (Sample C) has the highest fine content (11.6%), classifying it as sand with silt (SW-SM). Its composition includes 28.5% gravel, 13.6% coarse sand, 28.8% medium sand, and 17.5% fine sand. The high gravel content (28.5%) can improve resistance, but it also increases the risk of soil movement in strong wind conditions, requiring engineering solutions such as drainage systems.
Table 3 summarises the results.
Table 3 presents particle diameters (D
10, D
30, D
60), the coefficient of uniformity (CNU), and the percentage of fine material. The higher CNU value in Sample C (30.5) indicates a greater grain size variation, which is relevant for energy dissipation under dynamic loads, such as in offshore wind farms. However, the fine content (11.6%) may reduce the permeability, requiring specific engineering solutions.
3.3. Relative Density and Void Ratio
The relative grain density (Gs) values of the carbonate sands (Samples B and C) are similar to those of the quartz sand (Sample A). The Aracatiaçu River sand (Sample B) has a slightly lower density than quartz sand, whereas the offshore sand from Moitas Beach (Sample C), with a higher calcium carbonate content, has a density almost identical to quartz sand.
Regarding void ratios, the offshore carbonate sand (Sample C) has the highest minimum (e
min) and maximum (e
max), values, while the Aracatiaçu River sand (Sample B) has the lowest values.
Table 4 summarises these parameters, including the minimum (
) and maximum (
) bulk densities for each sample.
Overall, the relative grain density (Gs) and void ratio (emin and emax) values of the carbonate sands (B and C) are like those of the quartz sand (A), which occupies an intermediate position among the samples.
This similarity is relevant for offshore wind turbine foundation designs, as it influences the compressive strength and structural stability.
A higher density (e.g., 2.69 in Sample C) suggests heavier and more compact soil, which is beneficial for supporting heavy loads, particularly in areas with strong winds.
A lower density (e.g., 2.65 in Sample B) may require solutions such as piles or concrete blocks to ensure stability, as less dense soils tend to be more compressible.
Void ratio values also influence design:
A higher void ratio (e.g., emax = 0.89 in Sample C) indicates a greater permeability and lower compressive strength, requiring measures to prevent liquefaction in high wind conditions.
A lower void ratio (e.g., emin = 0.53 in Sample B) indicates a more compact soil, which is advantageous for shallow foundations but may reduce the drainage capacity, necessitating drainage solutions.
This information supports the selection of suitable engineering solutions, ensuring structural stability, minimising environmental impacts, and improving the economic feasibility of projects.
In this context, the carbonate sands from Ceará’s coastline have distinct characteristics compared to most calcareous carbonate sands described in a lot of studies [
10,
31,
33,
34,
35,
36], which generally show a greater variation in these parameters.
3.4. X-Ray Fluorescence and Calcium Carbonate (CaCO3) Content
Analyses conducted using Bernard’s Calcimeter and X-ray fluorescence tests allowed for the determination of the calcium carbonate (CaCO
3) content and the chemical composition of the samples, including the percentage of oxides and elements present in each type of sand, as detailed in
Table 5.
The calcium carbonate content analysis revealed significant differences between the samples. The Pacoti River sand (Sample A) contained only 1.23% CaCO
3, whereas the Aracatiaçu River sand (Sample B) and offshore sand from Moitas Beach (Sample C) had 48.81% and 88.46%, respectively. The offshore sand (Sample C), visibly richer in bioclasts, had the highest calcium carbonate content compared to the Aracatiaçu River sand (Sample B). The X-ray fluorescence results are presented in
Table 6, showing the percentage of oxides composing each sample.
As expected, Sample A was composed mainly of silicon dioxide (SiO2), with a content of 92.87%, characteristic of quartz, classifying it as quartz sand with a uniform grain size distribution. In contrast, the calcium oxide (CaO) content was below 1%, confirming the low presence of calcium carbonate materials.
On the other hand, the carbonate sands (Samples B and C) exhibited progressively lower silica contents as calcium oxide levels increased. The offshore sand from Moitas Beach (Sample C), which had the highest calcium carbonate content, also showed the highest percentage of calcium oxide, reflecting its markedly calcareous composition.
The strength of the soil, influenced by the CaCO3 content and chemical composition, is relevant for foundation design:
Soils with a high CaCO3 content (such as Sample C) tend to have a greater compressive strength, making them suitable for supporting heavy loads in areas with strong winds;
Soils with a low CaCO3 content (such as Sample A) may require piles or concrete blocks to compensate for lower mechanical resistance.
During construction, the porosity of high-CaCO3 soils may necessitate drainage solutions to prevent liquefaction. During turbine operation, the soil stability reduces the maintenance requirements, while the chemical composition affects structural corrosion, impacting durability.
3.5. Microscopy
The microscopic analysis of the sand samples was conducted using scanning electron microscopes (SEMs) to obtain detailed images of the soil grains and calcareous sediments. For the carbonate sands (Samples B and C), the collected samples contained larger elements such as rhodoliths, shells, and pebbles. Therefore, the portions analysed under the SEM were sieved beforehand to match the grain size range used in direct shear and triaxial tests.
Figure 10 presents the SEM images of the analysed samples.
The microscopic examination of the carbonate sands (Samples B and C) identified the presence of rhodoliths, shell fragments, and pebbles, which influence both mechanical behaviour and permeability. These characteristics affect the selection of foundation systems, such as piles, concrete blocks, or floating structures, and may require drainage measures to reduce the risk of liquefaction under strong wind loading. In preparation for laboratory testing, coarse particles and bioclastic fragments necessitate preliminary sieving to ensure the specimen’s compatibility with equipment such as the direct shear and triaxial apparatus. These same characteristics also have implications for field construction, where adaptations in material handling, compaction techniques, and drainage systems may be necessary.
During turbine operation, the soil microstructure continues to play a significant role in maintaining the foundation’s stability. For example, soils like Sample C, with a higher CaCO3 content and more angular particles, exhibit a greater shear strength, potentially reducing maintenance needs over time. The mineral composition of the soils may also influence corrosion processes, affecting the long-term durability of turbine structures.
Scanning Electron Microscopy (SEM) images (
Figure 10) help to contextualise the mechanical results. The angular, irregular grains observed in Sample C, in contrast to the more rounded quartz particles in Sample A, likely contribute to the higher friction angles recorded under dense conditions (see
Section 3.6 and
Section 3.7) due to increased interlocking. Moreover, the heterogeneity introduced by larger bioclastic fragments in carbonate samples may lead to localised variations in strength and an increased potential for particle breakage under loads.
3.6. Direct Shear Test
To analyse the shear strength parameters of the sand samples, direct shear tests were conducted on all three samples in both loose and dense states.
Figure 11 presents the shear stress envelopes for the sand samples, followed by
Table 7, which provides the shear strength parameters obtained in each test.
The direct shear test results showed a significant increase in the effective friction angle from the loose to dense states across all samples. The offshore carbonate sand (Sample C) exhibited the highest values and the greatest increase (8.4°), whereas the quartz sand (Sample A) and carbonate sand (Sample B) had increases of 6.5° and 5.0°, respectively. The cohesion intercepts were zero for all samples.
The normal and confining stresses applied were 50 kPa, 100 kPa, and 200 kPa, allowing for comparisons between tests. The interpretation of
Figure 12 indicates that the shear strength envelopes for Samples A, B, and C vary depending on the grain size distribution and composition. The slope of the curves, corresponding to the tangent of the effective friction angle (ϕ′), suggests a higher resistance in the dense states. R
2 values close to one confirm the linear behaviour of sandy soils, with no significant cohesion intercept.
Denser soils, such as Sample C, exhibit a higher shear strength, allowing for more compact or shallow foundations, which can help reduce construction costs. During construction, the difference between loose and dense states determines the need for compaction. During operation, the shear strength influences the stability of wind turbines under dynamic loads, reducing the risk of structural failures and minimising maintenance requirements.
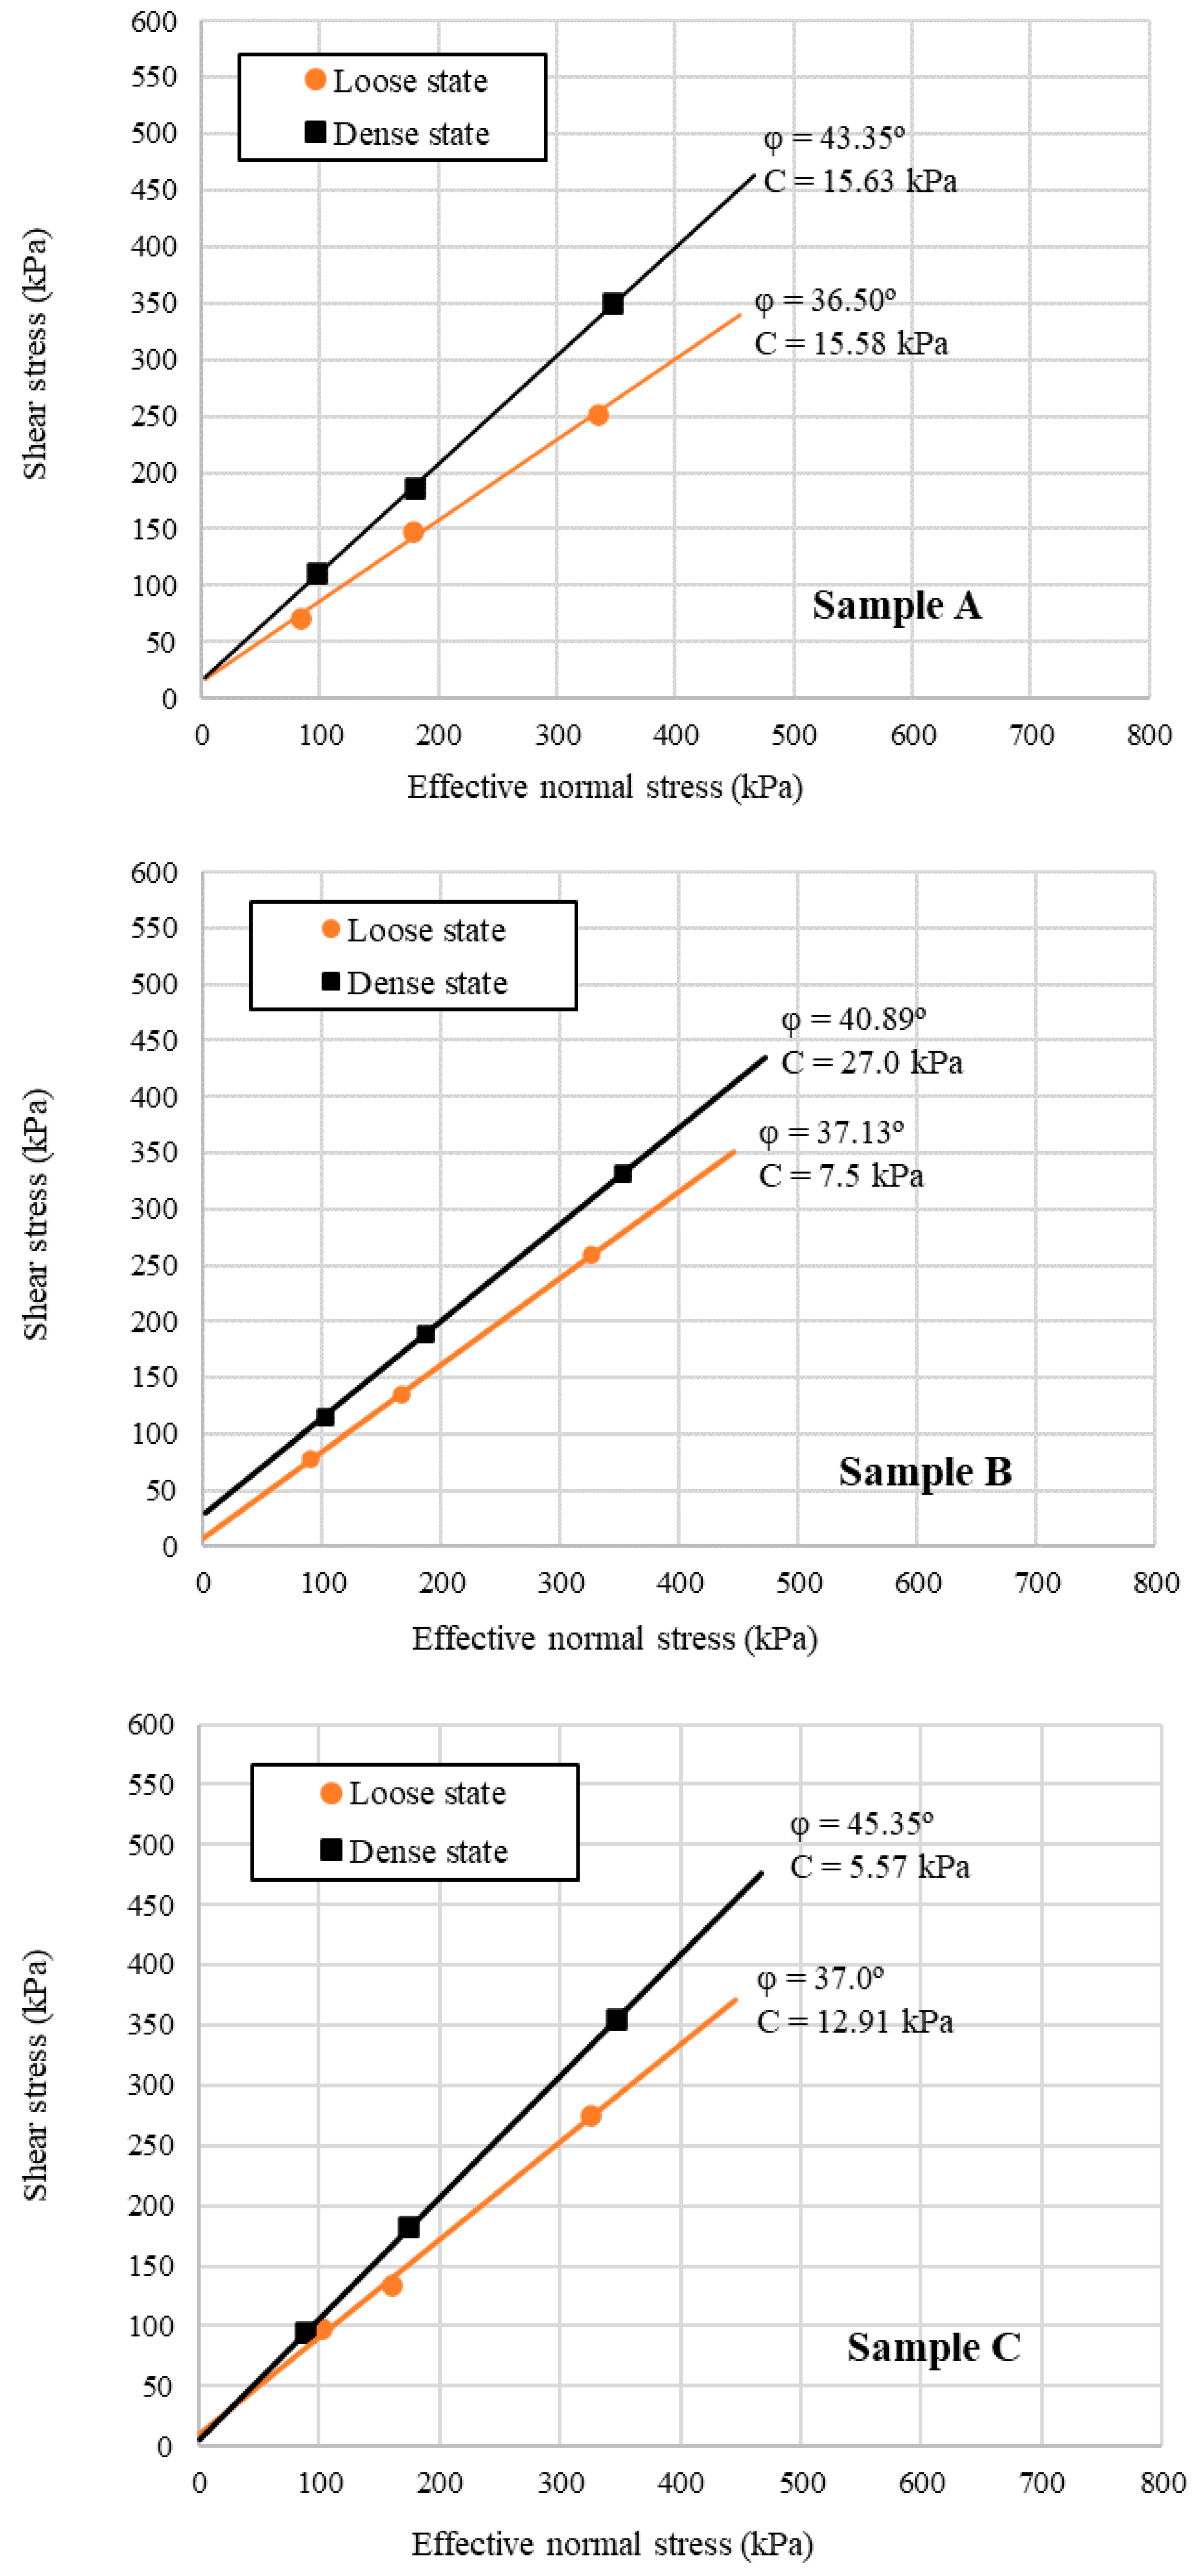
3.7. Triaxial Tests
Consolidated drained (CD) triaxial tests were conducted on the reconstituted specimens of all three sand samples (A, B, and C) in both loose and dense states. These tests allowed for the analysis of the mechanical behaviour under different compaction conditions, providing insights for the design, construction, and operation of offshore wind turbine foundations.
Figure 12 presents the shear strength envelopes obtained for Samples A, B, and C, comparing loose and dense states.
In the figure, the horizontal axis represents effective normal stress, while the vertical axis indicates the shear stress at failure. The fitted Mohr–Coulomb lines provide two key parameters:
The effective friction angle (ϕ′), where the slope reflects the soil strength;
The cohesion intercept (c), associated with factors such as the microstructure and carbonate content.
Sample C, which had the highest CaCO3 content, exhibited the highest friction angle (45.35° in the dense state), possibly due to angular particles and interlocking effects. Samples A (quartz) and B (carbonate with a lower CaCO3 content) showed different ϕ′ and c values, influenced by the grain size distribution and composition.
Unlike direct shear tests, the triaxial tests recorded non-zero cohesion intercepts, as shown in
Table 8, suggesting the influence of compaction and the chemical composition.
In the dense state, the effective friction angles followed the same trend as in direct shear tests, with Sample C showing the highest values. However, unlike direct shear tests, triaxial test results indicated non-zero cohesion intercepts, as shown in
Table 9.
Table 10 presents Young’s modulus (secant) at 50% of the maximum deviatoric stress for each test. Sample A (quartz sand) recorded the highest values among the three sands.
Regarding the overall behaviour of the studied sands, the dilative behaviour observed in the three samples shows similarities to those of the Persian Gulf sands studied by Hassanlourad et al. [
31]; furthermore, the specific gravity and void ratio values of the studied sand are also compatible with these Persian Gulf sands.
A comparison of the sample properties highlights that carbonate sands differ from quartz sand in terms of grain size distribution, chemical composition, and strength parameters. However, the results indicate that there is no direct correlation between the CaCO3 content and shear strength:
Sample A (quartz sand) exhibited intermediate strength parameters in most direct shear and triaxial tests compared to carbonate sands B and C;
Sample C (highest CaCO3 content) had higher strength values in most cases, demonstrating that factors beyond the CaCO3 fraction must be considered.
Triaxial tests are important for the design, construction, and operation of offshore wind turbine foundations:
In the design phase, ϕ′ values define the soil’s ability to support lateral loads (wind and wave forces).
- ⚬
A higher ϕ′ (e.g., Sample C) allows for shallower or smaller foundations, reducing costs.
- ⚬
A lower ϕ′ (e.g., Sample A) may require piles or other deep foundation solutions, increasing costs.
The presence of non-zero cohesion intercepts suggests that the microstructure and carbonate content influence soil behaviour, although low cohesion values are expected in frictional soils and must be considered in designs.
During operation, the shear strength affects the wind turbine stability under dynamic loads (wind and seismic activity).
- ⚬
Higher ϕ′ values reduce the risk of structural failure, lowering maintenance costs.
Well-designed foundations minimise material use, reducing the impact on the seabed and preserving local ecosystems.
3.8. Implications for Offshore Wind Foundation Design in Ceará
The geotechnical parameters identified in this study are directly relevant to assessing the feasibility and informing the design and installation of foundations for offshore wind turbines proposed along the coast of Ceará. Common foundation types for such applications include monopiles, piled jacket structures, and, potentially, gravity base systems, each of which interacts differently with the underlying soil.
Shear strength parameters are important for evaluating the foundation capacity. The relatively high effective friction angles obtained, particularly under denser conditions (up to 44.3° in direct shear and 45.3° in triaxial tests for Sample C), indicate the potential for an elevated bearing resistance in shallow foundations and a substantial shaft resistance for deep foundations. These strength values observed in Sample C, despite its high calcium carbonate (CaCO
3) content, suggest that other factors such as particle angularity (as observed in SEM imaging,
Figure 10) and the structure associated with its bioclastic origin play a more significant role in governing shear strength. This interpretation aligns with findings reported in previous studies [
35,
37]. The apparent cohesion intercepts identified in the triaxial tests (
Table 9), possibly linked to interlocking effects or mild cementation commonly found in carbonate sediments, should nonetheless be interpreted cautiously, especially in the context of typically cohesionless sands, and warrant further investigation.
The deformation behaviour, reflected by Young’s modulus (
Table 10), is also critical for settlement estimations. The results demonstrate a substantial variability and generally lower stiffness in the carbonate sands (Samples B and C) compared to the quartz sand (Sample A) under equivalent conditions, particularly in the loose state. The pressuremeter test results for Sample B further support this observation, indicating comparatively low elastic modulus values (
Section 3.1). These findings suggest that foundations installed in carbonate sands may experience greater settlements than those founded in quartz sands, which should be considered in the design of monopiles—where tilting may occur—and gravity-based systems, where total and differential settlements may be critical.
Additionally, although not explicitly measured in this study, the tendency of many carbonate sands to undergo particle crushing under elevated stress levels [
15,
38] presents a potential risk during the pile installation and under operational loads. This behaviour may affect the drivability, alter the ultimate capacity, and contribute to long-term deformation. Moreover, the cyclic loading imposed by the wind and wave action on offshore structures necessitates an understanding of the soil’s response to repeated loading, which could lead to a reduction in stiffness or, in looser deposits, trigger liquefaction. These issues merit further detailed investigations in the context of the carbonate sands found off the Ceará coast.
Given these considerations, engineering designs must account for the specific mechanical behaviour of these sediments. This may include adjustments to pile dimensions, the use of ground improvement techniques, or the selection of alternative installation methods—such as drilling instead of driving—to minimise the effects of particle crushing and ensure long-term performance.
3.9. Study Limitations and Future Research
This study has several limitations that should be considered. The results are based on samples collected from a limited number of sites along the Ceará coast, which may not reflect the full range of spatial variability in the region. Laboratory tests were carried out on reconstituted specimens, which might not fully represent the natural structure, cementation, or ageing characteristics of the in situ soils. Furthermore, the analysis was restricted to static loading conditions; the response of the soils to cyclic loading, an important factor for offshore foundation performance, was not evaluated. Other long-term processes, such as marine erosion and local scour around foundations, were also beyond the scope of this investigation. Future studies could explore these aspects through broader in situ testing campaigns (such as CPTu or SCPTu), the examination of undisturbed samples, the evaluation of cyclic loading and the liquefaction potential, and assessments of particle crushing under stress conditions typical of offshore environments.
4. Conclusions
This study provided a detailed geotechnical characterisation of carbonate and quartz sands from the coast of Ceará, Brazil, integrating field (pressuremeter) and laboratory analyses, encompassing physical, chemical, microstructural, and mechanical tests, relevant to the development of offshore wind energy. The results confirmed distinct differences between the local carbonate sands and quartz sand, particularly in the particle size distribution, mineral composition, morphology, shear strength, and deformability. A key finding is that the mechanical behaviour of carbonate sands cannot be attributed solely to their calcium carbonate (CaCO3) content. For example, Sample C, despite having the highest CaCO3 concentration (88.5%), exhibited the greatest effective friction angle in the dense state (up to 45.3°), likely influenced by the angular and irregular bioclastic particles observed in the SEM imaging, which promote interlocking. In contrast, the carbonate sands generally displayed lower stiffness values (Young’s modulus) than quartz sand under comparable test conditions. This work establishes a baseline dataset for the geotechnical parameters of northeastern Brazilian carbonate sands, illustrating that the particle characteristics and origin are critical determinants of engineering performance alongside the carbonate content.
These findings have direct implications for foundation design in the offshore wind projects planned for Ceará. The shear strength and deformability parameters obtained are important for evaluating the stability and serviceability of foundation types, such as monopiles and piled jackets. The high friction angles observed indicate the potential for adequate bearing or shaft resistance; however, the relatively low stiffness highlights the importance of settlement assessments, especially for structures sensitive to deformation. Additionally, known challenges associated with carbonate sands, such as particle crushing during pile installation or under load and the uncertain performance under cyclic loading, should be incorporated into site-specific geotechnical analyses and risk evaluations. These aspects point to the need for the continued integration of laboratory and in situ testing to better capture the behaviour of these complex soils.
Ultimately, the geotechnical data and insights presented in this study are essential for supporting the implementation of offshore wind energy infrastructure in Ceará. By advancing the understanding of the behaviour of local soils, this research contributes to optimising and de-risking foundation designs, which is a necessary step toward the state’s broader objective of producing green hydrogen through offshore renewable energy. The integration of detailed, site-specific geotechnical information into planning processes strengthens efforts to advance Brazil’s energy transition and diversify its energy matrix in a more sustainable direction.


 ,
, 


