Article

Research on the Interlinked Mechanism of Agricultural System Risks from an Industry Perspective

by
Shiyi Yuan
1,*,
Miao Yang
2,
Baohua Liu
1,* and
Ganqiong Li
1
1
Institute of Agricultural Information, Chinese Academy of Agricultural Sciences, Beijing 100081, China
2
School of Business, Beijing Technology and Business University, Beijing 100048, China
*
Authors to whom correspondence should be addressed.
Sustainability 2025, 17(10), 4719; https://doi.org/10.3390/su17104719
Submission received: 20 March 2025 / Revised: 28 April 2025 / Accepted: 3 May 2025 / Published: 21 May 2025

Abstract

:
Studying the risk propagation mechanisms in agricultural systems is crucial for maintaining agricultural stability and promoting sustainable development. This research analyzes the risk effects and risk propagation mechanisms in agricultural systems using the DCC-t-Copula-CoVaR model, multi-layer network structures, and the mixed-frequency regression MIDAS model. The study finds that there is significant heterogeneity in risk spillover and absorption in agricultural systems; the risk propagation in agricultural systems is stable, and the stronger the connectivity of industry nodes, the greater the risk. Taking the seed industry as an example, its structural indicator values consistently range between 1.0 and 1.1, with fluctuations closely linked to industry development and policy adjustments. Major risks are caused by risk resonance across multiple industries, not triggered by a single industry alone; the interconnections between industries within the agricultural system can disperse risks, forming a collective risk-sharing mechanism. Understanding these dynamics is essential for developing resilient agricultural practices that support long-term sustainability, ensuring food security, and mitigating environmental impacts. By addressing risk propagation and fostering interconnected risk-sharing mechanisms, agricultural systems can better adapt to challenges such as climate change, resource scarcity, and market volatility, ultimately contributing to a more sustainable and stable global food system.

1. Introduction

To protect against systemic risks in agriculture and ensure stable agricultural production is crucial for national food security, rural stability, and the continued growth of farmers’ incomes. In 2023, China’s paramount policy document, the No.1 Central Document, specifically advocated for the creation and enhancement of an agricultural risk protection mechanism. This initiative aims to bolster the capacity to fend off systemic risks, thereby safeguarding the safety and stability of agricultural production. In the face of a complex and volatile international economic landscape, characterized by strategic competition among major powers, regional conflicts, escalating trade barriers for agricultural products, and unstable market supply and demand, the global agricultural system’s operation and stability are under significant strain. As a vital pillar of the global economic system, agriculture is increasingly susceptible to systemic risks. The globalization-driven accumulation and transmission of risks have amplified the uncertainty facing China’s agricultural system, introducing new challenges in agricultural production, trade, food security, and the stability of the agricultural system itself. Systemic risk research has long been a focal point in social, financial, and management sciences, with scholars extensively exploring systems in economics, finance, and public administration. However, the agricultural sector’s systemic risks have received relatively little attention. Considering the agricultural system’s critical importance to global food security and social stability, this study zeroes in on agriculture. It delves into the risk spillover and absorption effects across different sectors of the agricultural system, examines the mechanisms and characteristics of risk transmission, and offers targeted policy recommendations.
In recent years, scholars have increasingly turned their attention to the interconnectedness and transmission of risks within macroeconomic and financial systems, especially in the wake of risk shocks. However, the exploration of similar dynamics within agricultural systems has not received the same level of scrutiny. This oversight has become more pronounced as regional conflicts escalate and protectionist policies in agricultural trade gain traction, amplifying the interconnectedness of risks within agricultural systems. Consequently, these developments have paved the way for more intricate pathways of cross-regional risk transmission, thereby posing a significant threat to global food security and the sustainable growth of agriculture.
In the field of agriculture, research on risk management and efficiency assessment increasingly relies on diverse econometric methods. These methods examine agricultural production efficiency and risk from various perspectives, providing profound insights and practical tools to address numerous challenges. For instance, data envelopment analysis (DEA) is employed to compare the inputs and outputs of different production units, assessing the efficiency and risk levels of agricultural production [1]. Structural equation modeling (SEM), on the other hand, reveals the internal structure of agricultural systems and the complex relationships between variables, aiding in the identification and understanding of risk factors [2]. Spatial autoregressive models comprehensively consider the influence of geographical factors, analyzing the spread of risk and correlations between different agricultural regions [3]. Meanwhile, regression analysis explores the relationships between different variables in agricultural risk data through statistical methods [4]. A combination of the Value at Risk (VaR) model and the autoregressive conditional heteroskedasticity (ARCH) model is utilized to evaluate risk in agricultural markets [5]. Additionally, univariate statistical methods, including descriptive statistics and time series analysis, are employed to study the risk levels of individual agricultural products [6]. In terms of parameter estimation, ordinary least squares (OLS) is applied to fit agricultural risk models and make predictions [7]. The Susceptible–Infectious–Recovered (SIR) model is applied to risk management in agricultural production [8]. Evaluation methods are also evolving, including composite index assessment, propensity score matching, multi-attribute comprehensive evaluation, the EES index, and multiple trend moving average cross-analysis, providing multidimensional risk assessment tools [9,10,11,12].
With the rise in complex network research in agricultural risk management, various models and analysis methods have been proposed, such as Bayesian networks, the TailVaR model, weighted risk correlation networks, complex network analysis, and hybrid causality testing methods. These approaches enhance our understanding of the interactions between factors in agricultural systems, thereby providing strong support for risk management [13,14,15,16,17,18].
Research on agricultural systems primarily focuses on risk linkage and transmission. The importance of various factors in the propagation of agricultural risks is typically ranked as follows: market risk, policy risk, natural risk, technological risk, and managerial risk [19]. Research indicates that exogenous variables, including spot markets for agricultural products, macroeconomic volumes, and international market transactions, substantially influence the risk spillover effects of soybean futures between China and the U.S. [20] Furthermore, a specific risk transmission mechanism has been identified between China’s corn export prices and Brent crude oil spot prices [21]. Notably, the gender of farmers plays a role in the efficiency of risk transmission [22], and the accuracy of temperature readings over time is critical for assessing risks within the agricultural ecosystem model [23]. The lack of necessary analytical skills among technical workers can exacerbate risks in agricultural production [24]. Additionally, abiotic factors are becoming increasingly significant in the risks associated with crop growth [25].
Various risk types exhibit different transmission pathways that ultimately influence the prices of agricultural products [26]. Extreme fluctuations in the prices of crop cultivation can disrupt the balance of risks in the market [27]. Commonalities exist between the risk points and types in livestock farming and the overall risks in the agricultural system [28]. Natural disasters, such as wildfires, not only result in economic losses and degradation of ecosystem services but also elevate risks to the agricultural sector [29]. The longer the duration of agricultural pests, the broader the impact range of their risk transmission [30]. Financial risks in the soybean futures market exhibit distinct transmission mechanisms upstream and downstream [31]. Additionally, various types of risks encountered in the bio-breeding supply chain contribute to heightened risk across the entire industry chain [32].
While the existing body of literature has delved into the exploration of risk linkages and their transmission within agricultural systems, it has not been without its potential shortcomings. Initially, the focus of research on risks within agricultural systems has been predominantly one-dimensional, concentrating on singular relationships such as those between crop growth and climate change, soil quality and crop yield, pest outbreaks and biodiversity, and the impact of agricultural inputs on environmental pollution. This narrow scope falls short of fully capturing the diversity, complexity, and interdependence that characterize systemic risks in agriculture. Furthermore, although the multi-layer network theory has laid a groundwork in the realm of agricultural risk research, it frequently neglects the intricate multi-level interactions among various sectors within the agricultural system and how these interactions contribute to the systemic risk linkages and their contagion properties. The application of multi-layer network models, with their comprehensive attributes and diverse structural characteristics, not only deepens the understanding of the internal dynamics within agricultural systems but also sheds light on potential mechanisms of risk transmission across different agricultural sectors, thereby broadening the utility of multi-layer network structures in research endeavors. Additionally, the predominant focus of existing studies has been on macro-level risks tied to industry or supply chains, overlooking the critical analysis from pivotal nodes and the absence of dynamic studies on the indicators and variables involved in risk transmission.
This study zeroes in on the CSI Industry Indexes and utilizes the DCC-t-Copula-CoVaR model to evaluate the systemic risk effects within the agricultural sector. By crafting a multi-layer network structure and selecting structural indicators for analysis, coupled with the employment of the Mixed Data Sampling (MIDAS) approach, it aims to unravel the linkages and transmission pathways of industry risks. The innovative contributions of this paper can be summarized in three key areas: firstly, leveraging multi-layer network theory, it devises a spectrum of attribute- and type-based models to assess agricultural system risks from an industry standpoint, elucidating the spillover and absorption effects of risk. Secondly, by conducting mixed-frequency regression analysis with high-frequency data, it uncovers the mechanisms of industry risk transmission within a multi-layer network framework. Lastly, the study delves into the dynamic evolution characteristics of pivotal nodes, examining the time-varying attributes of individual nodes under various types of risk transmission, thereby providing a more tangible understanding of the mechanisms at play.
The application of multi-layer network models, with their comprehensive attributes and diverse structural characteristics, not only deepens the understanding of the internal dynamics within agricultural systems but also sheds light on potential mechanisms of risk transmission across different agricultural sectors, thereby broadening the utility of multi-layer network structures in research endeavors. Trade frictions, geopolitical conflicts, and policy adjustments are significant factors affecting international economic activities in the context of globalization [33]. Traditional risk correlation analysis methods, such as single-layer network analysis, often focus on only one type of connection, overlooking the multifaceted interrelations within the agricultural system [34,35,36]. Additionally, the predominant focus of existing studies has been on macro-level risks tied to industry or supply chains, overlooking the critical analysis from pivotal nodes and the absence of dynamic studies on the indicators and variables involved in risk transmission.

2. Materials and Methods

2.1. Model Construction

This study constructs a DCC-t-Copula-CoVaR model applied to measure the risk spillover, risk absorption, and related indicators among sectors in the agricultural system [37,38,39]. This multifaceted approach not only accurately seizes the dynamic correlations and the likelihood of extreme event occurrences but also significantly bolsters the model’s predictive precision and interpretability.
Risk spillover:
Δ C o V a R j , t O U T = i = 1 n   Δ C o V a R q , t i | j
Risk absorption:
Δ C o V a R j , t I N = i = 1 n   Δ C o V a R q , t j | i
Net risk spillover:
Δ C o V a R q , ι j | i = Φ 1 ( q ) ρ i j , t σ j , t = V a R q , t j ρ i j , t
In this context, Δ C o V a R j , t O U T represents the risk spillover level of industry j at time t, while Δ C o V a R q , t i | j denotes the risk spillover from industry j to industry i . Conversely, Δ C o V a R j , t I N measures the risk absorption capacity of industry j at time t , and Δ C o V a R q , t j | i indicates the risk absorption from industry j to industry i . The variable n stands for the total number of industries. V a R q , ι j signifies the inherent risk value within the system for a single sector j , ρ i j , t is the time-varying coefficient within the system, and σ i , t and σ j , t are the time-varying conditional variances for sectors i and j , respectively, determined by their marginal distributions. The confidence level q is typically set at 0.95; Φ represents the probability distribution function of losses. Given that Φ 1 ( 0.5 ) = 0 , the risk value V a R q , t j = Φ 1 ( q ) σ j , t .

2.2. Questionnaire Development and Pre-Testing

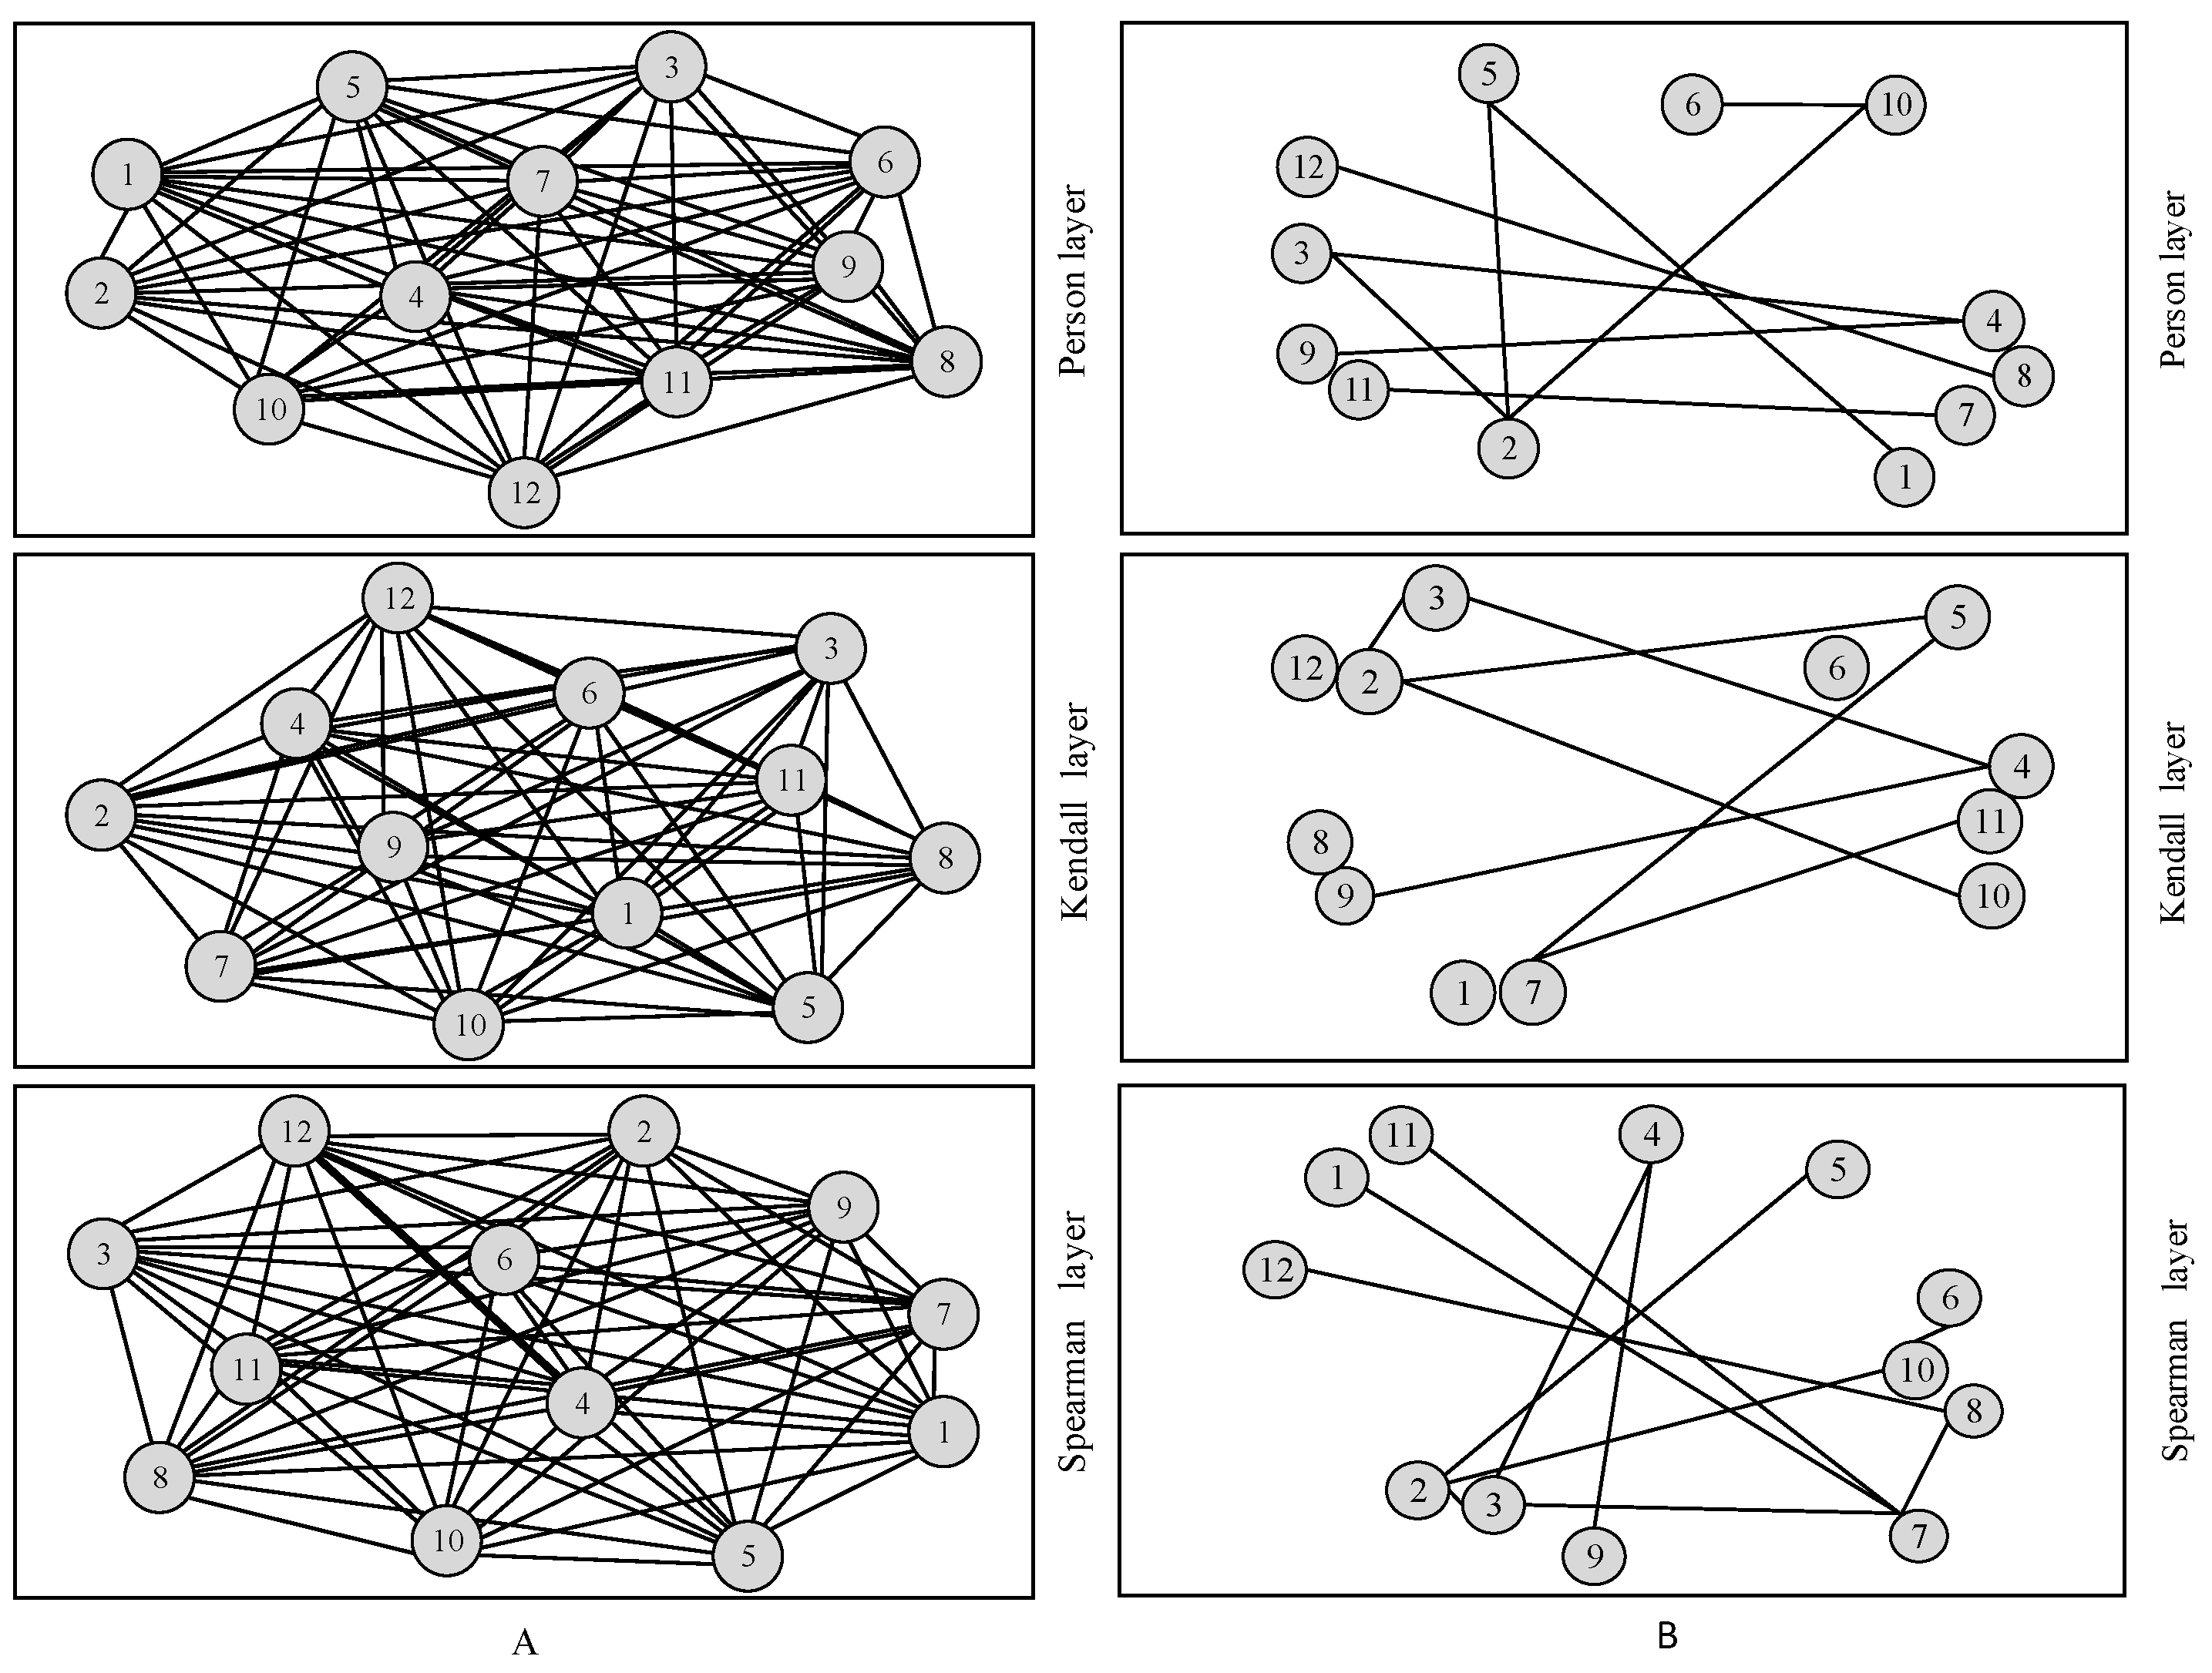
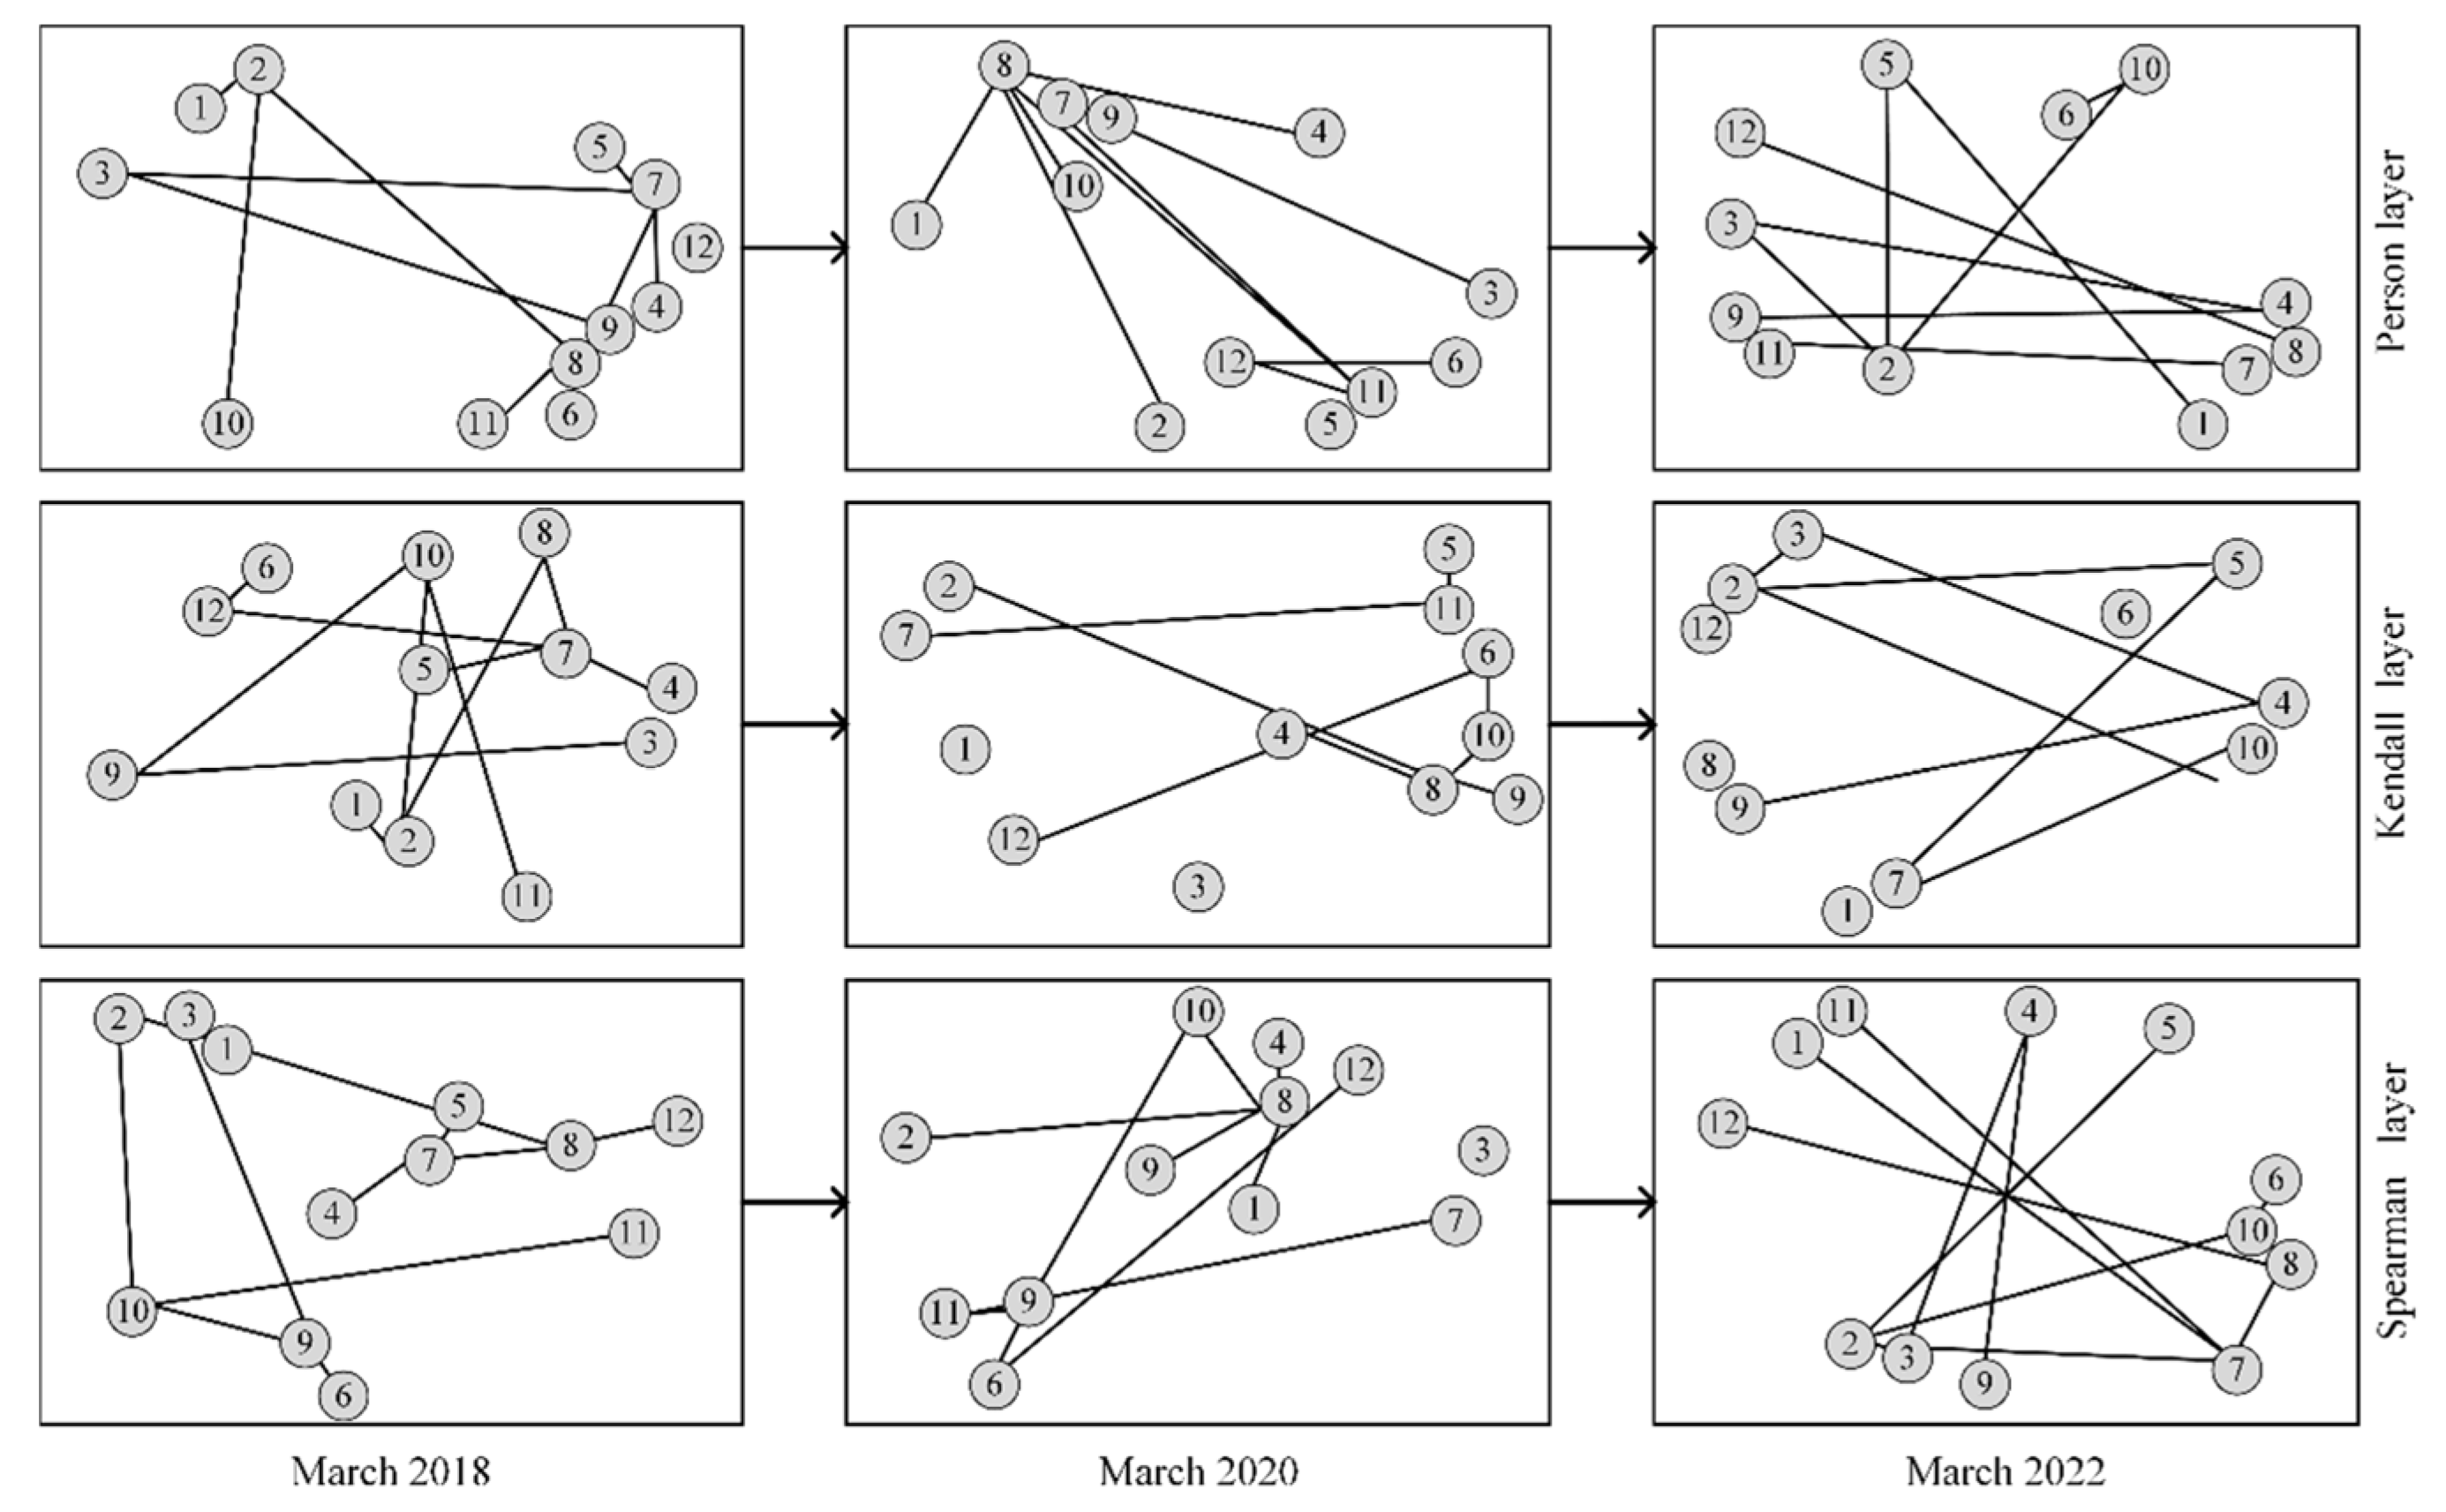
This study constructs a multi-layer network model, using various levels as key nodes, and the interrelationships between industries as the connecting lines [40,41]. The formula for computation is outlined as follows:
A ( R t E [ R t ] ) = β ¯ F t + η t
In this context, A represents the contemporaneous correlation matrix between endogenous variables, while F t stands for the common factors. R t is the vector of observed returns at time t , with an expected value denoted by E [ R t ] . The term β ¯ captures the risk exposure of the returns to the common factors. η t is the vector of structural idiosyncratic residuals, which has a diagonal covariance matrix represented by Σ η .
Assuming that A is invertible, the equation can be expressed as follows:
I R j = 1 d δ j W j R i = A R t = E R t + β F t + η t
In the formula, d represents the number of layers in the network and R is the diagonal parameter matrix; δ j denotes the weights of each layer of the network, and they satisfy the relationship j = 1 d   δ j = 1 , with δ j 0 , j = 1,2 , , d . The computation formula for the multi-layer network is as follows:
W = j = 1 d δ j W j
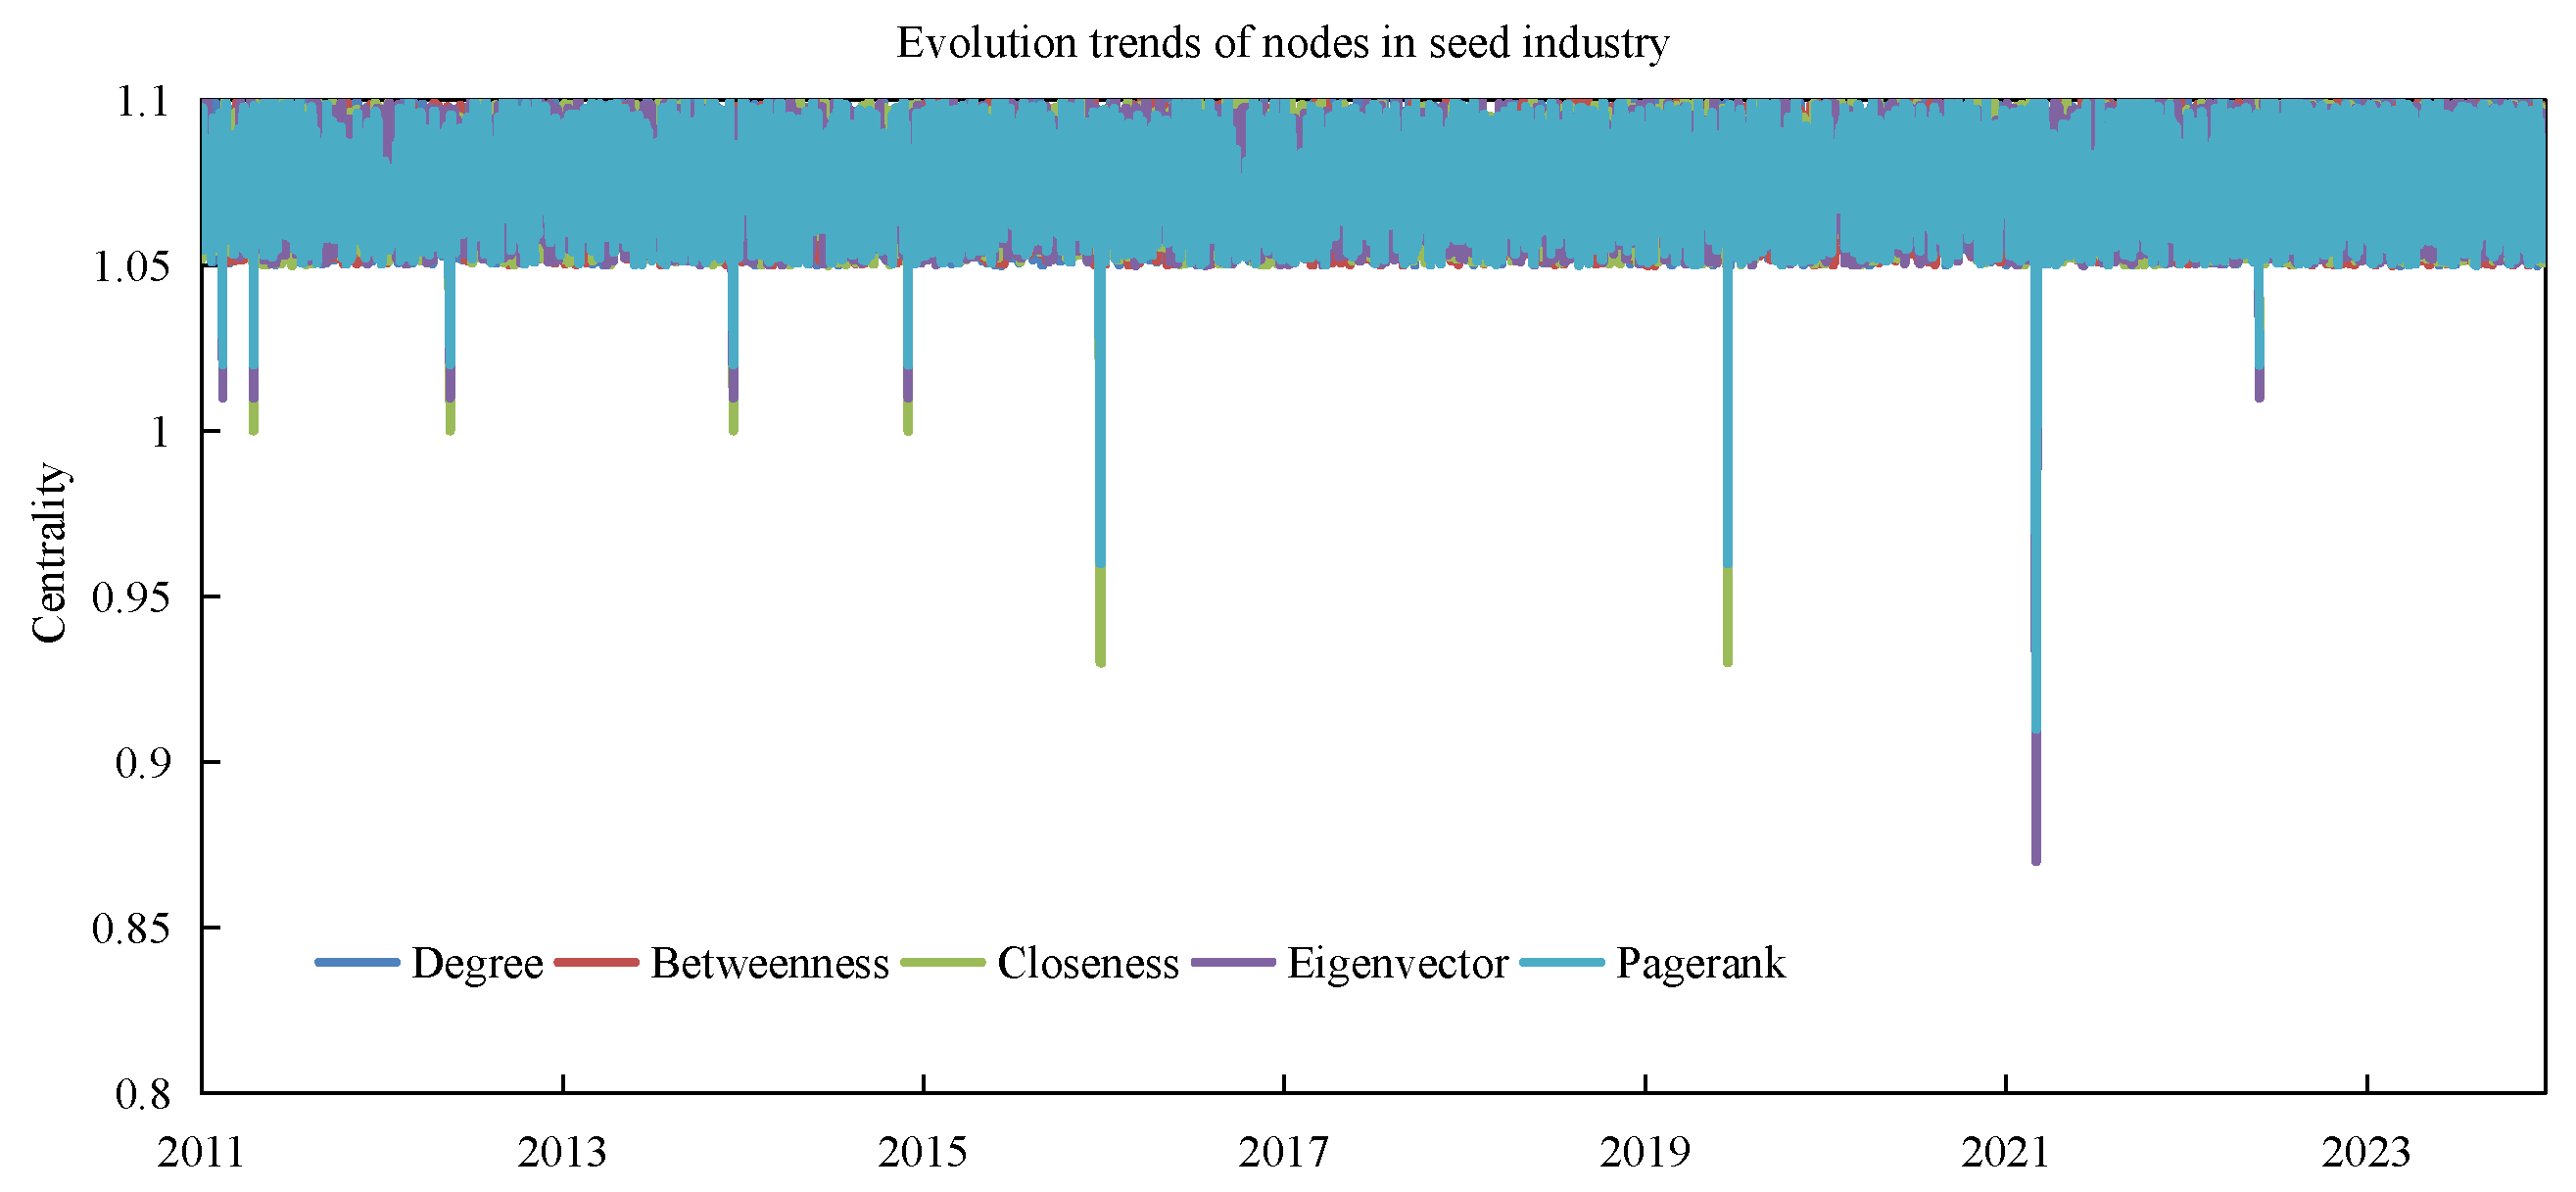
This study employs Pearson, Kendall, and Spearman correlation coefficients to describe the inter-industry associations. Additionally, it utilizes centrality measures such as degree centrality, betweenness centrality, closeness centrality, eigenvector centrality, and an improved version of eigenvector centrality to assess the importance of nodes.
After calculating the structural indicators of each level, a synthesis of the indicators of different levels within the same observation window was conducted [42]. For instance, the formula for degree centrality is as follows:
C d e g = k 3   C d e g k C d e g t o t a l l n C d e g k C d e g t o t a l

2.3. Construct Measurement

This study conducts mixed-frequency regression analysis on the MIDAS method [43]. The computational formula is as follows:
B ( L 1 / m ; θ ) x t h ( m ) = k = 0 K   α k L k / m x t h k / m ( m ) L k / m = k = 0 K   α k x t h k / m ( m )
In this context, x t ( m ) represents the high-frequency explanatory variable, where m is the sampling frequency of high-frequency relative to low-frequency. For example, if monthly data are used to explain quarterly data, then m = 3 . K denotes the number of lags, and α k are their weights. The core of mixed-frequency regression is to address the weighting issue in high-frequency data science. U-MIDAS, Step, Almon Polynomial, Exponential Almon weighting, Beta weighting, etc., are some commonly used weighting strategies.

2.4. Sample and Data Collection Procedures

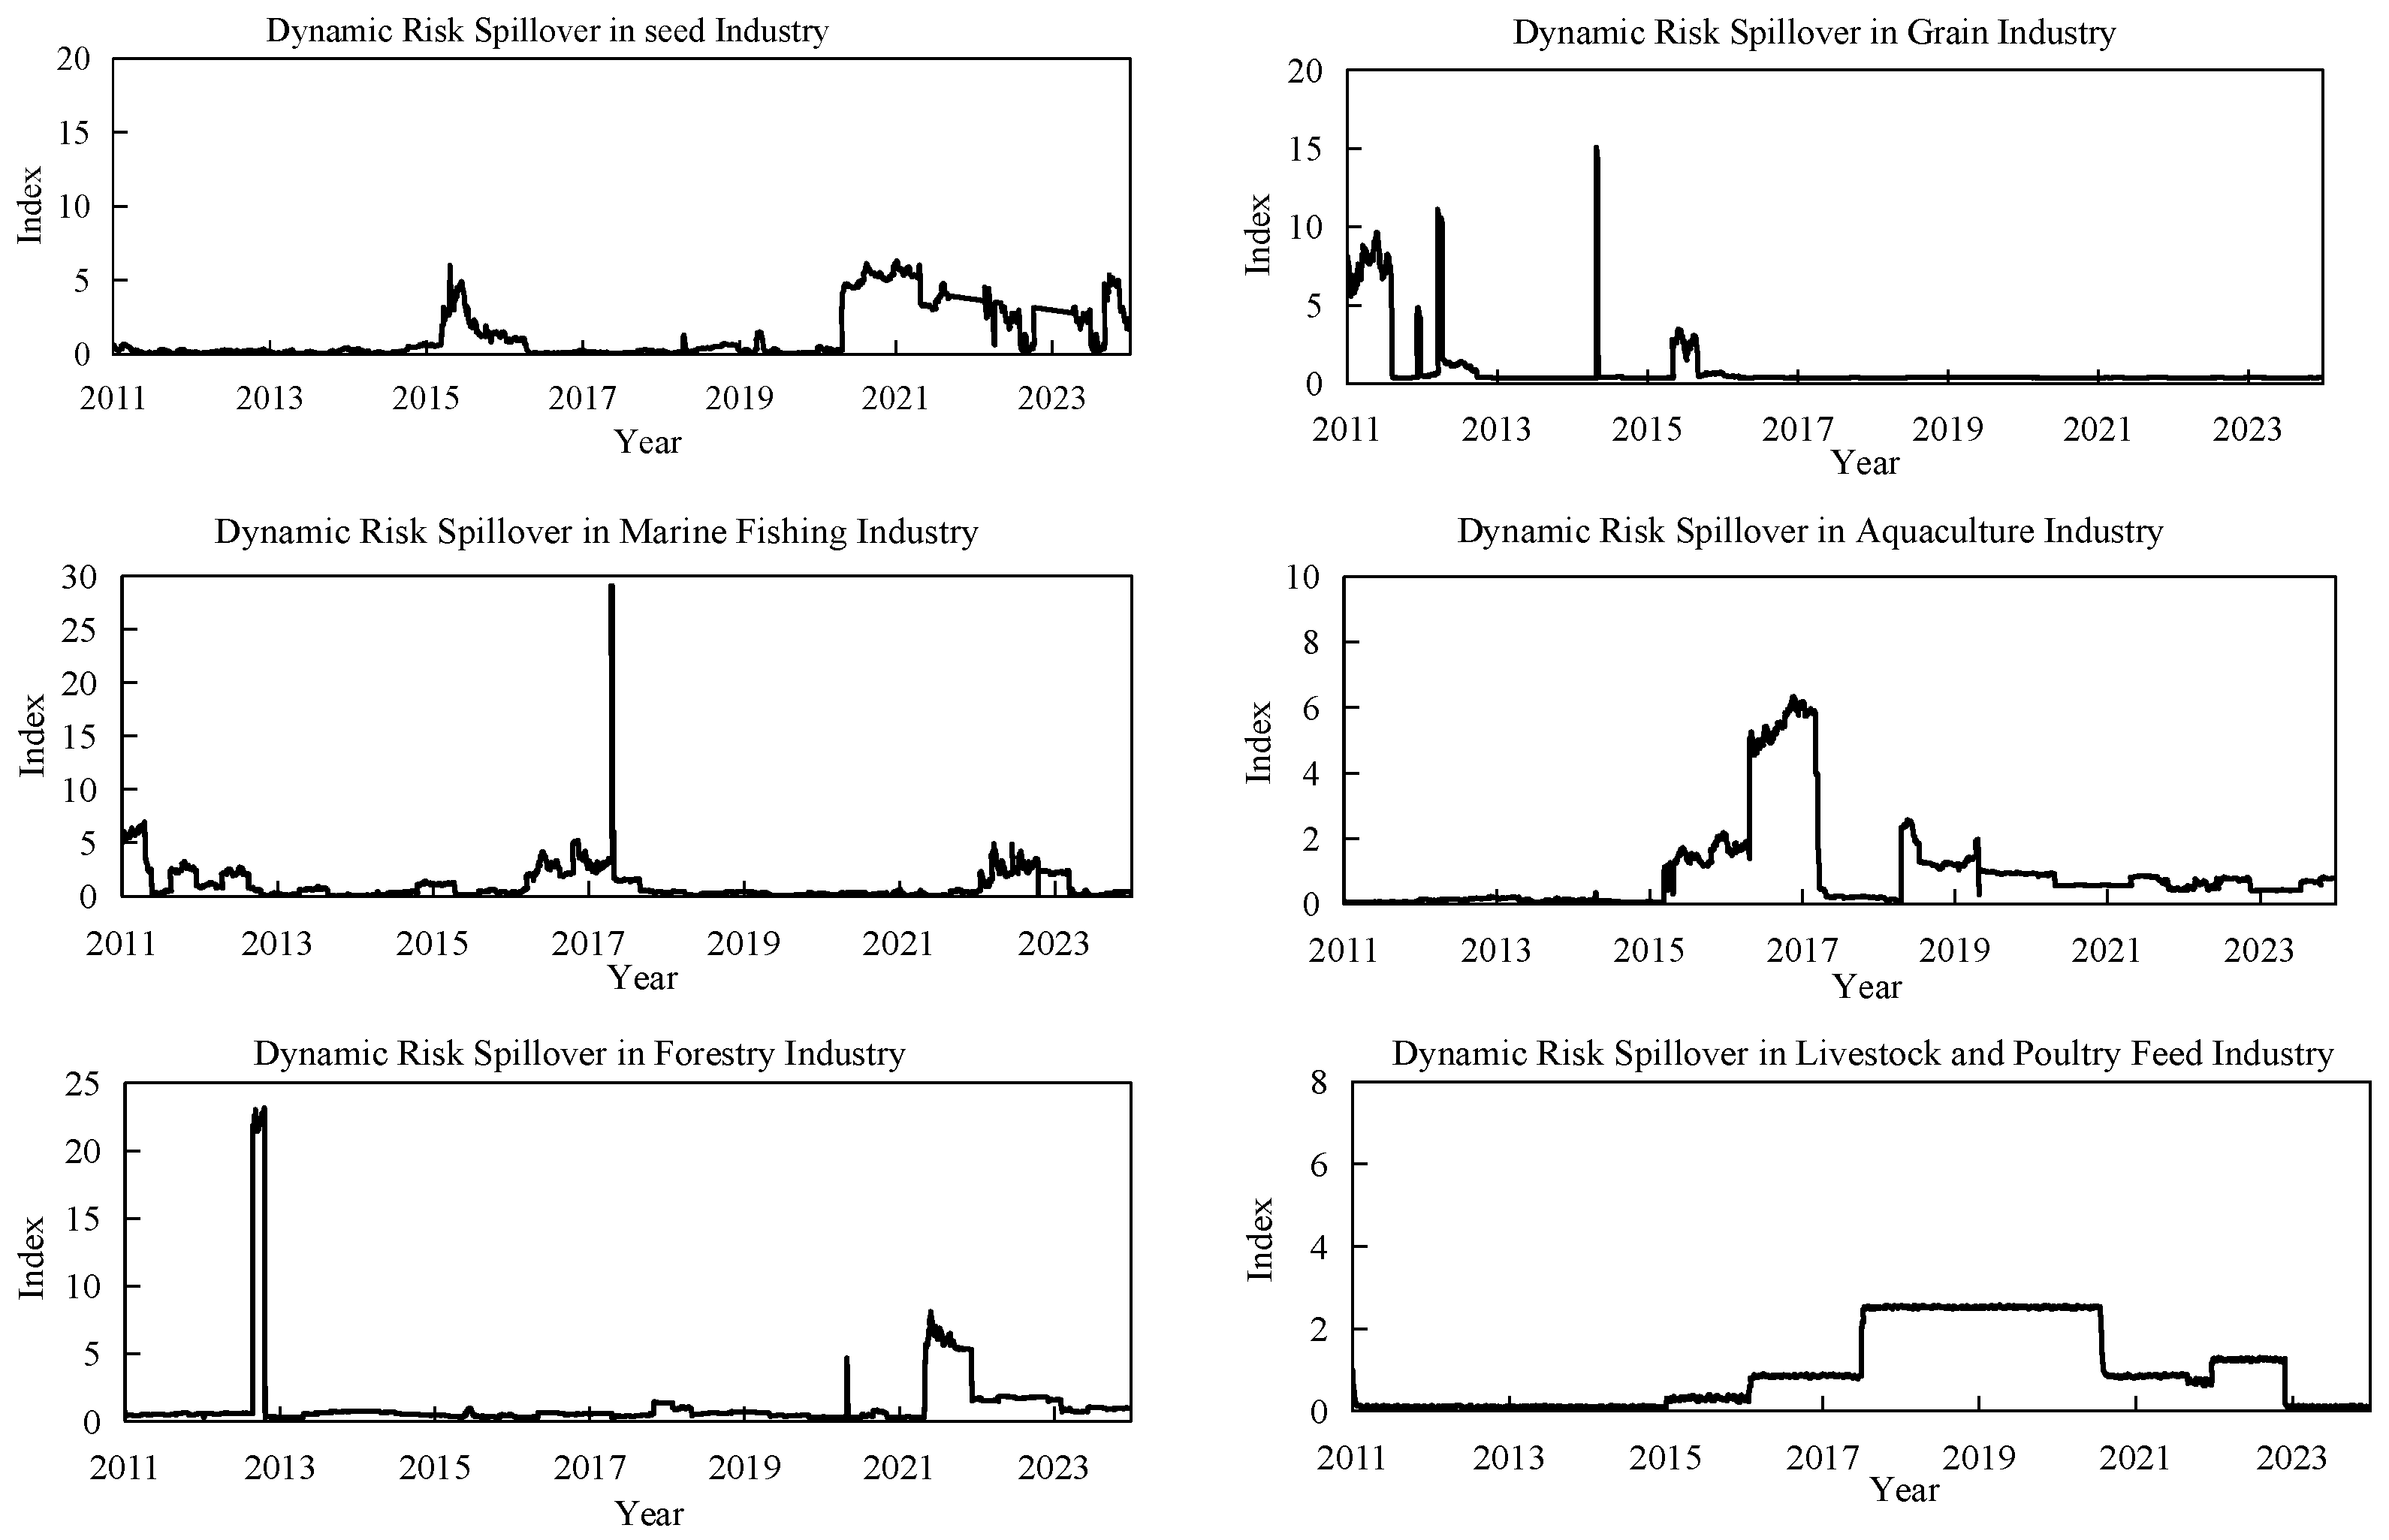
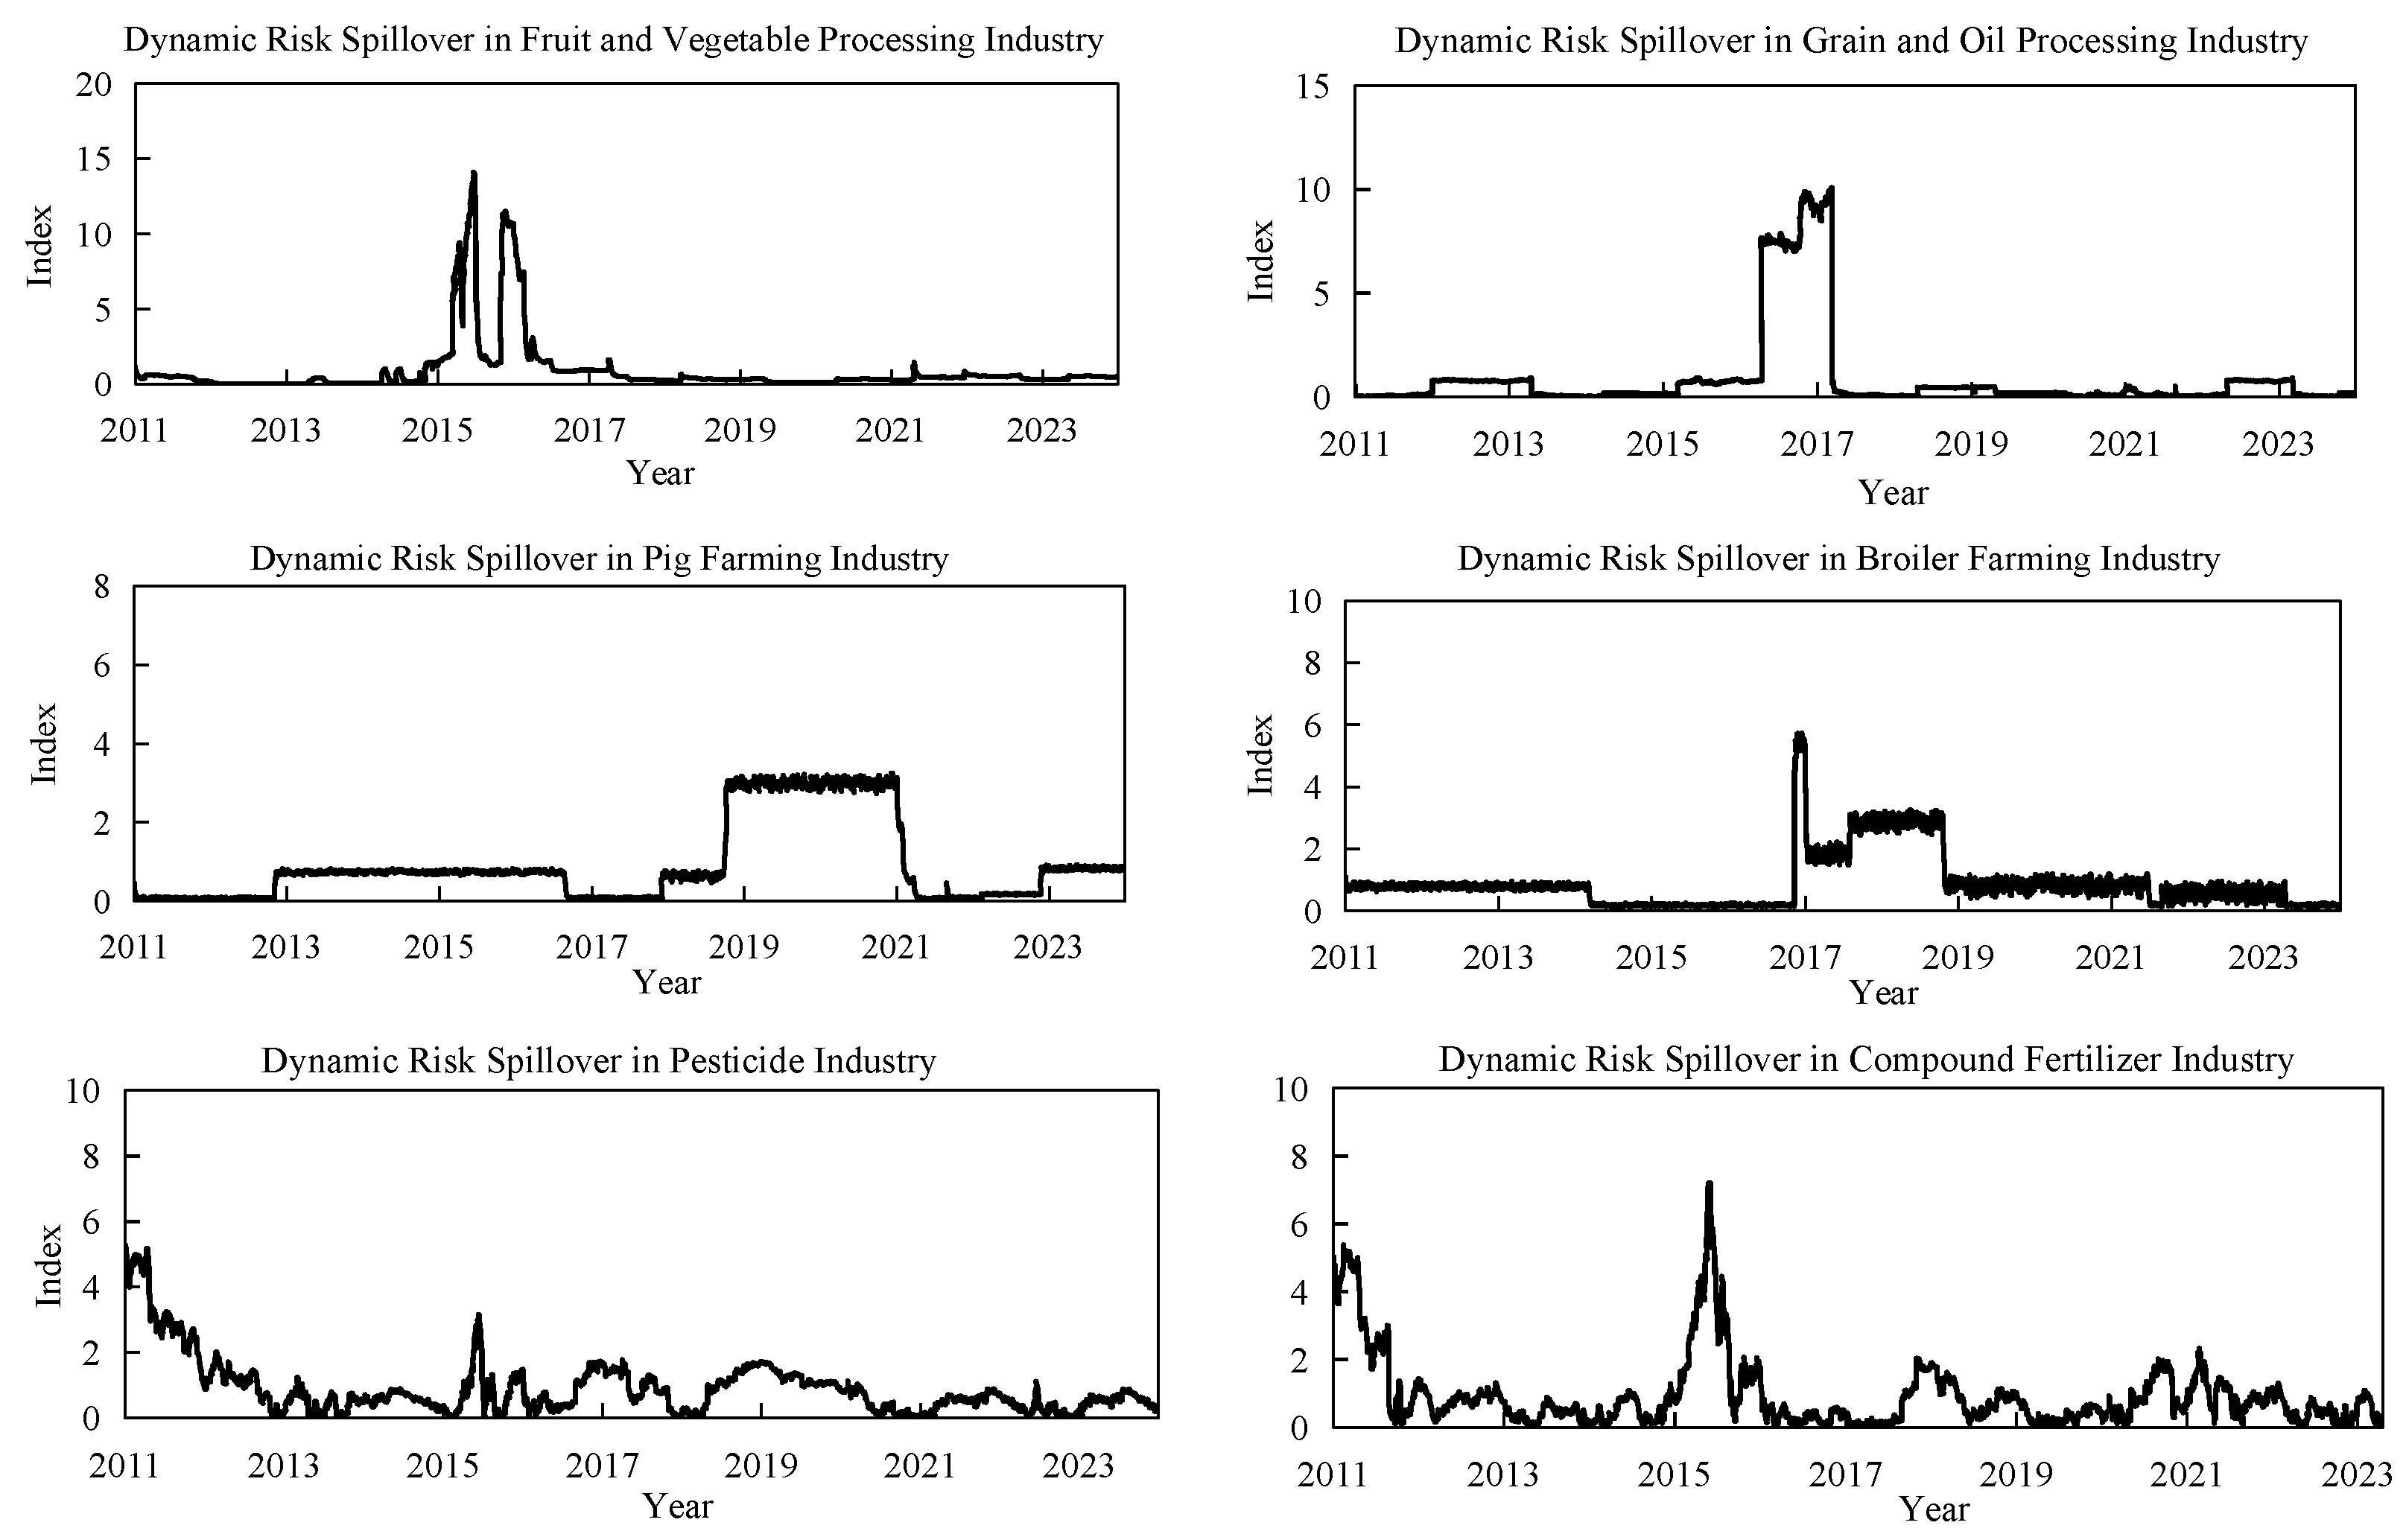
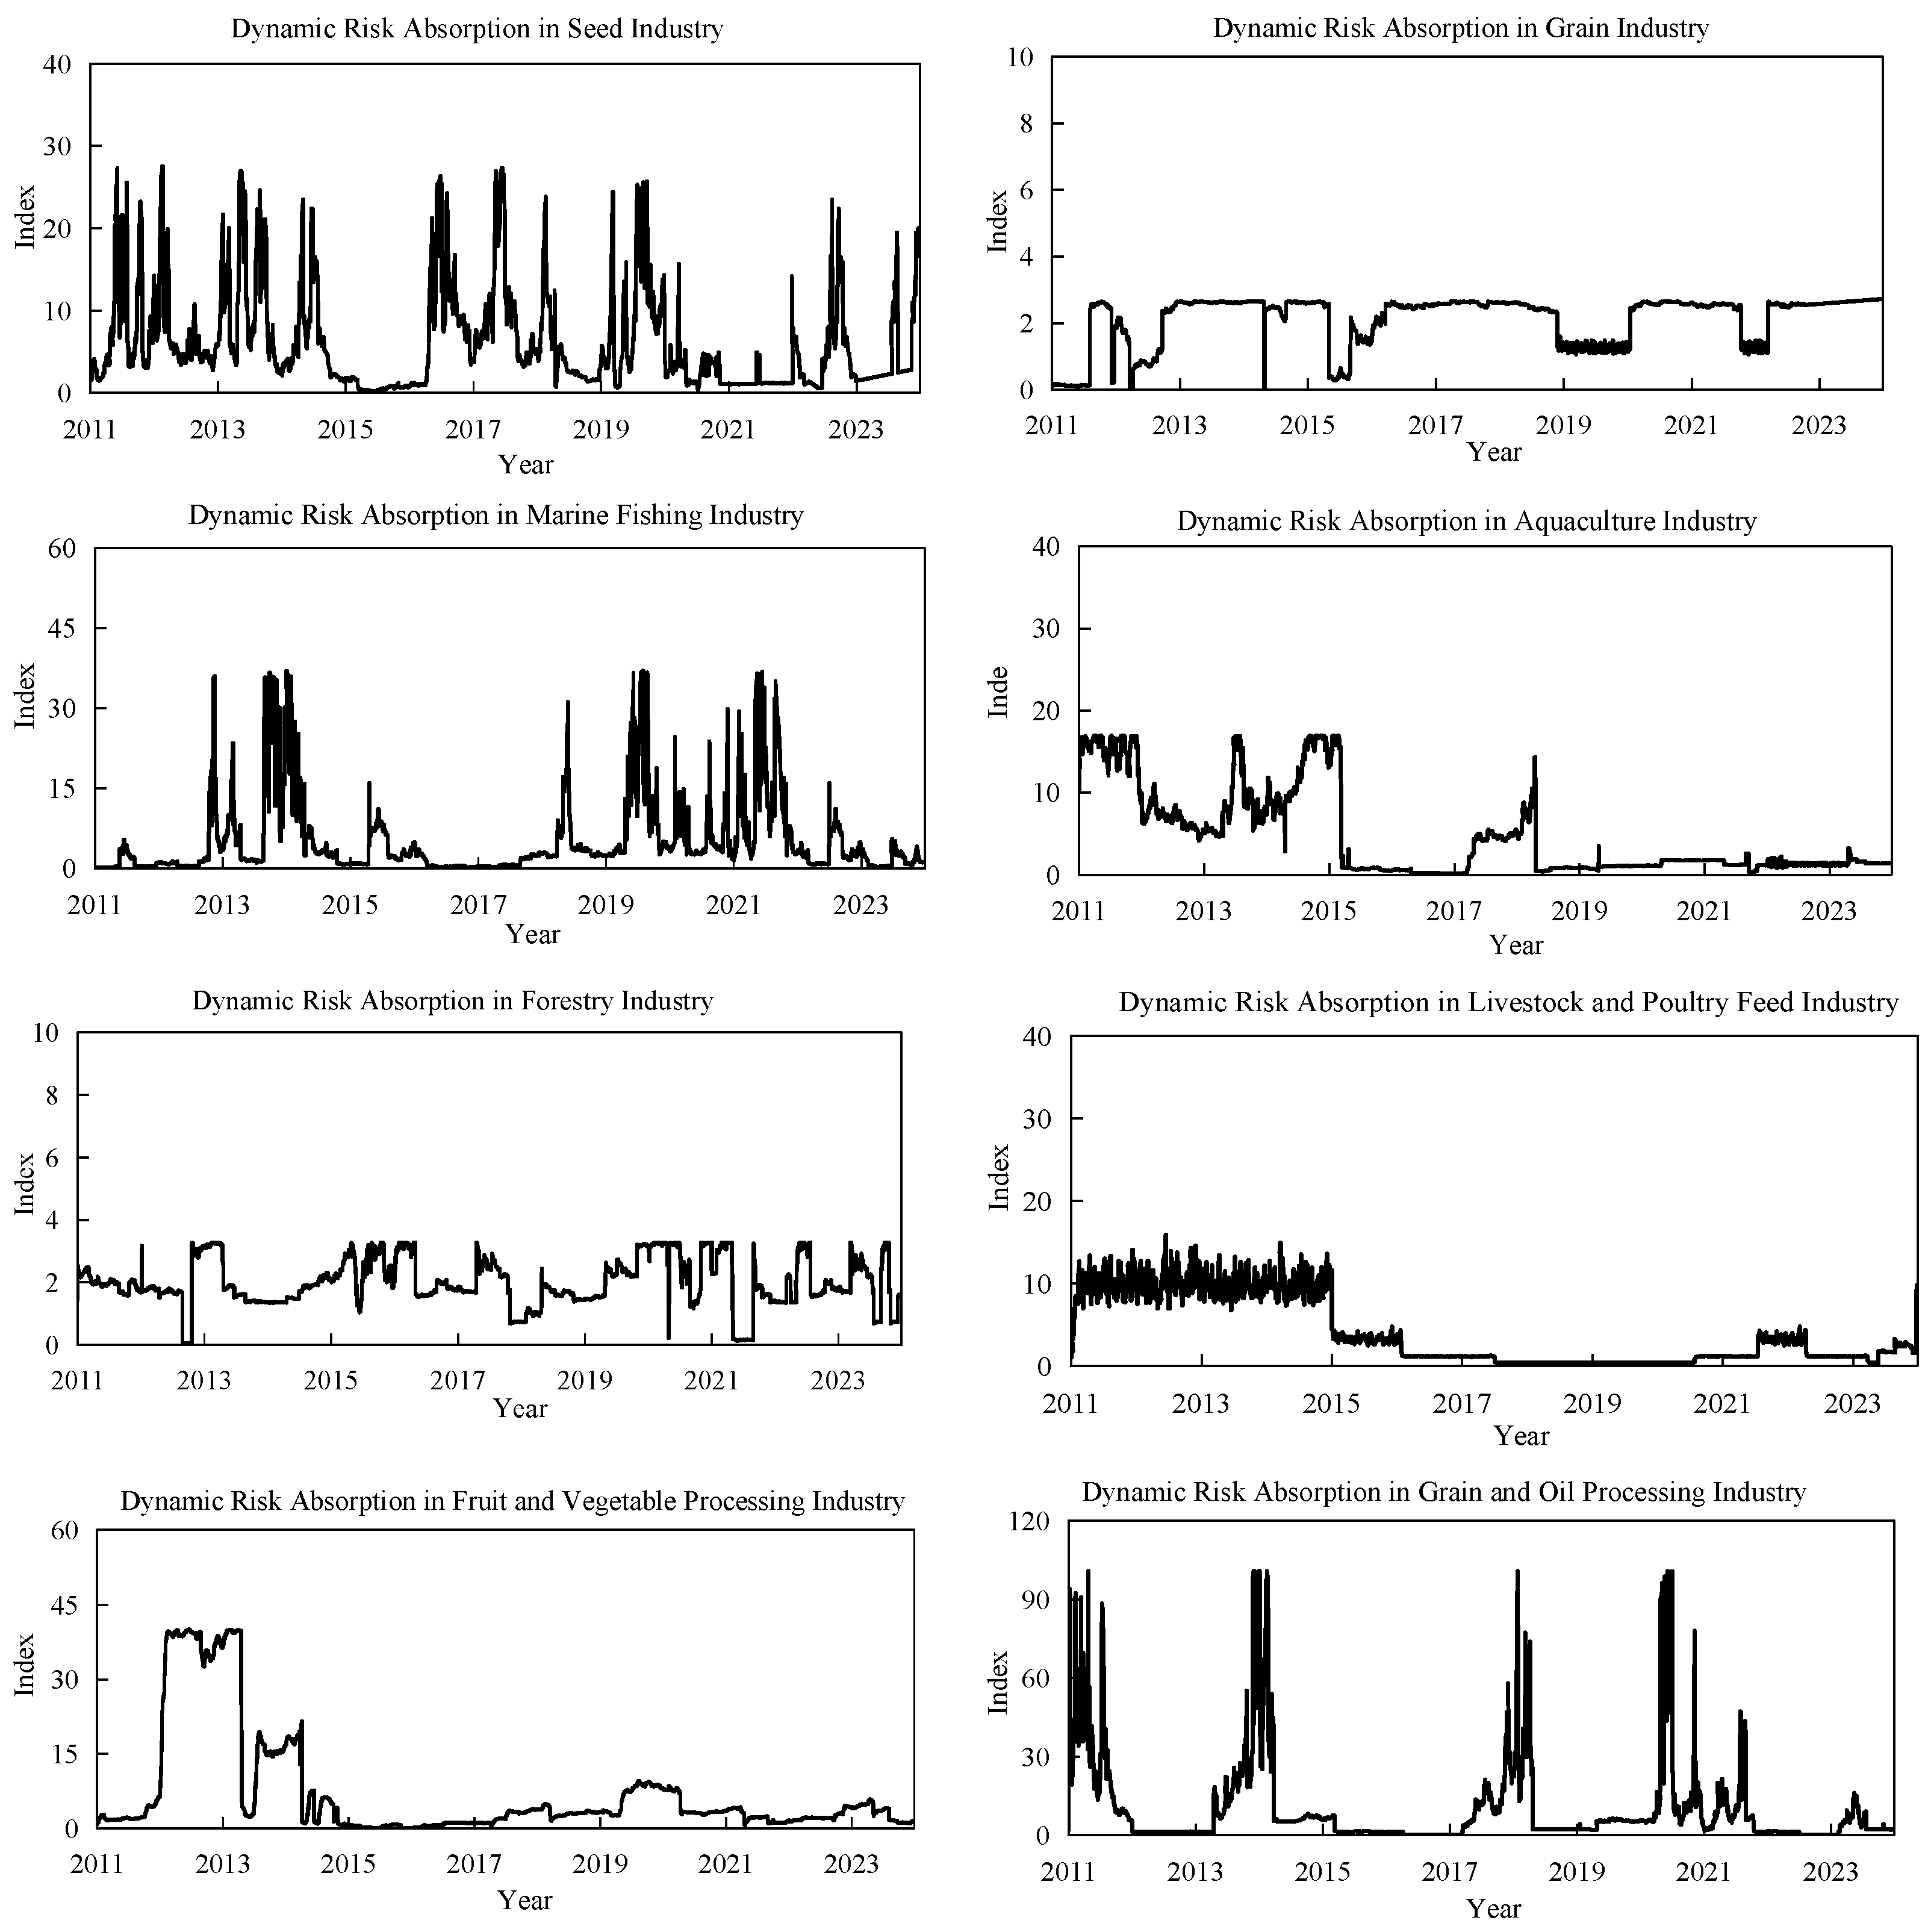
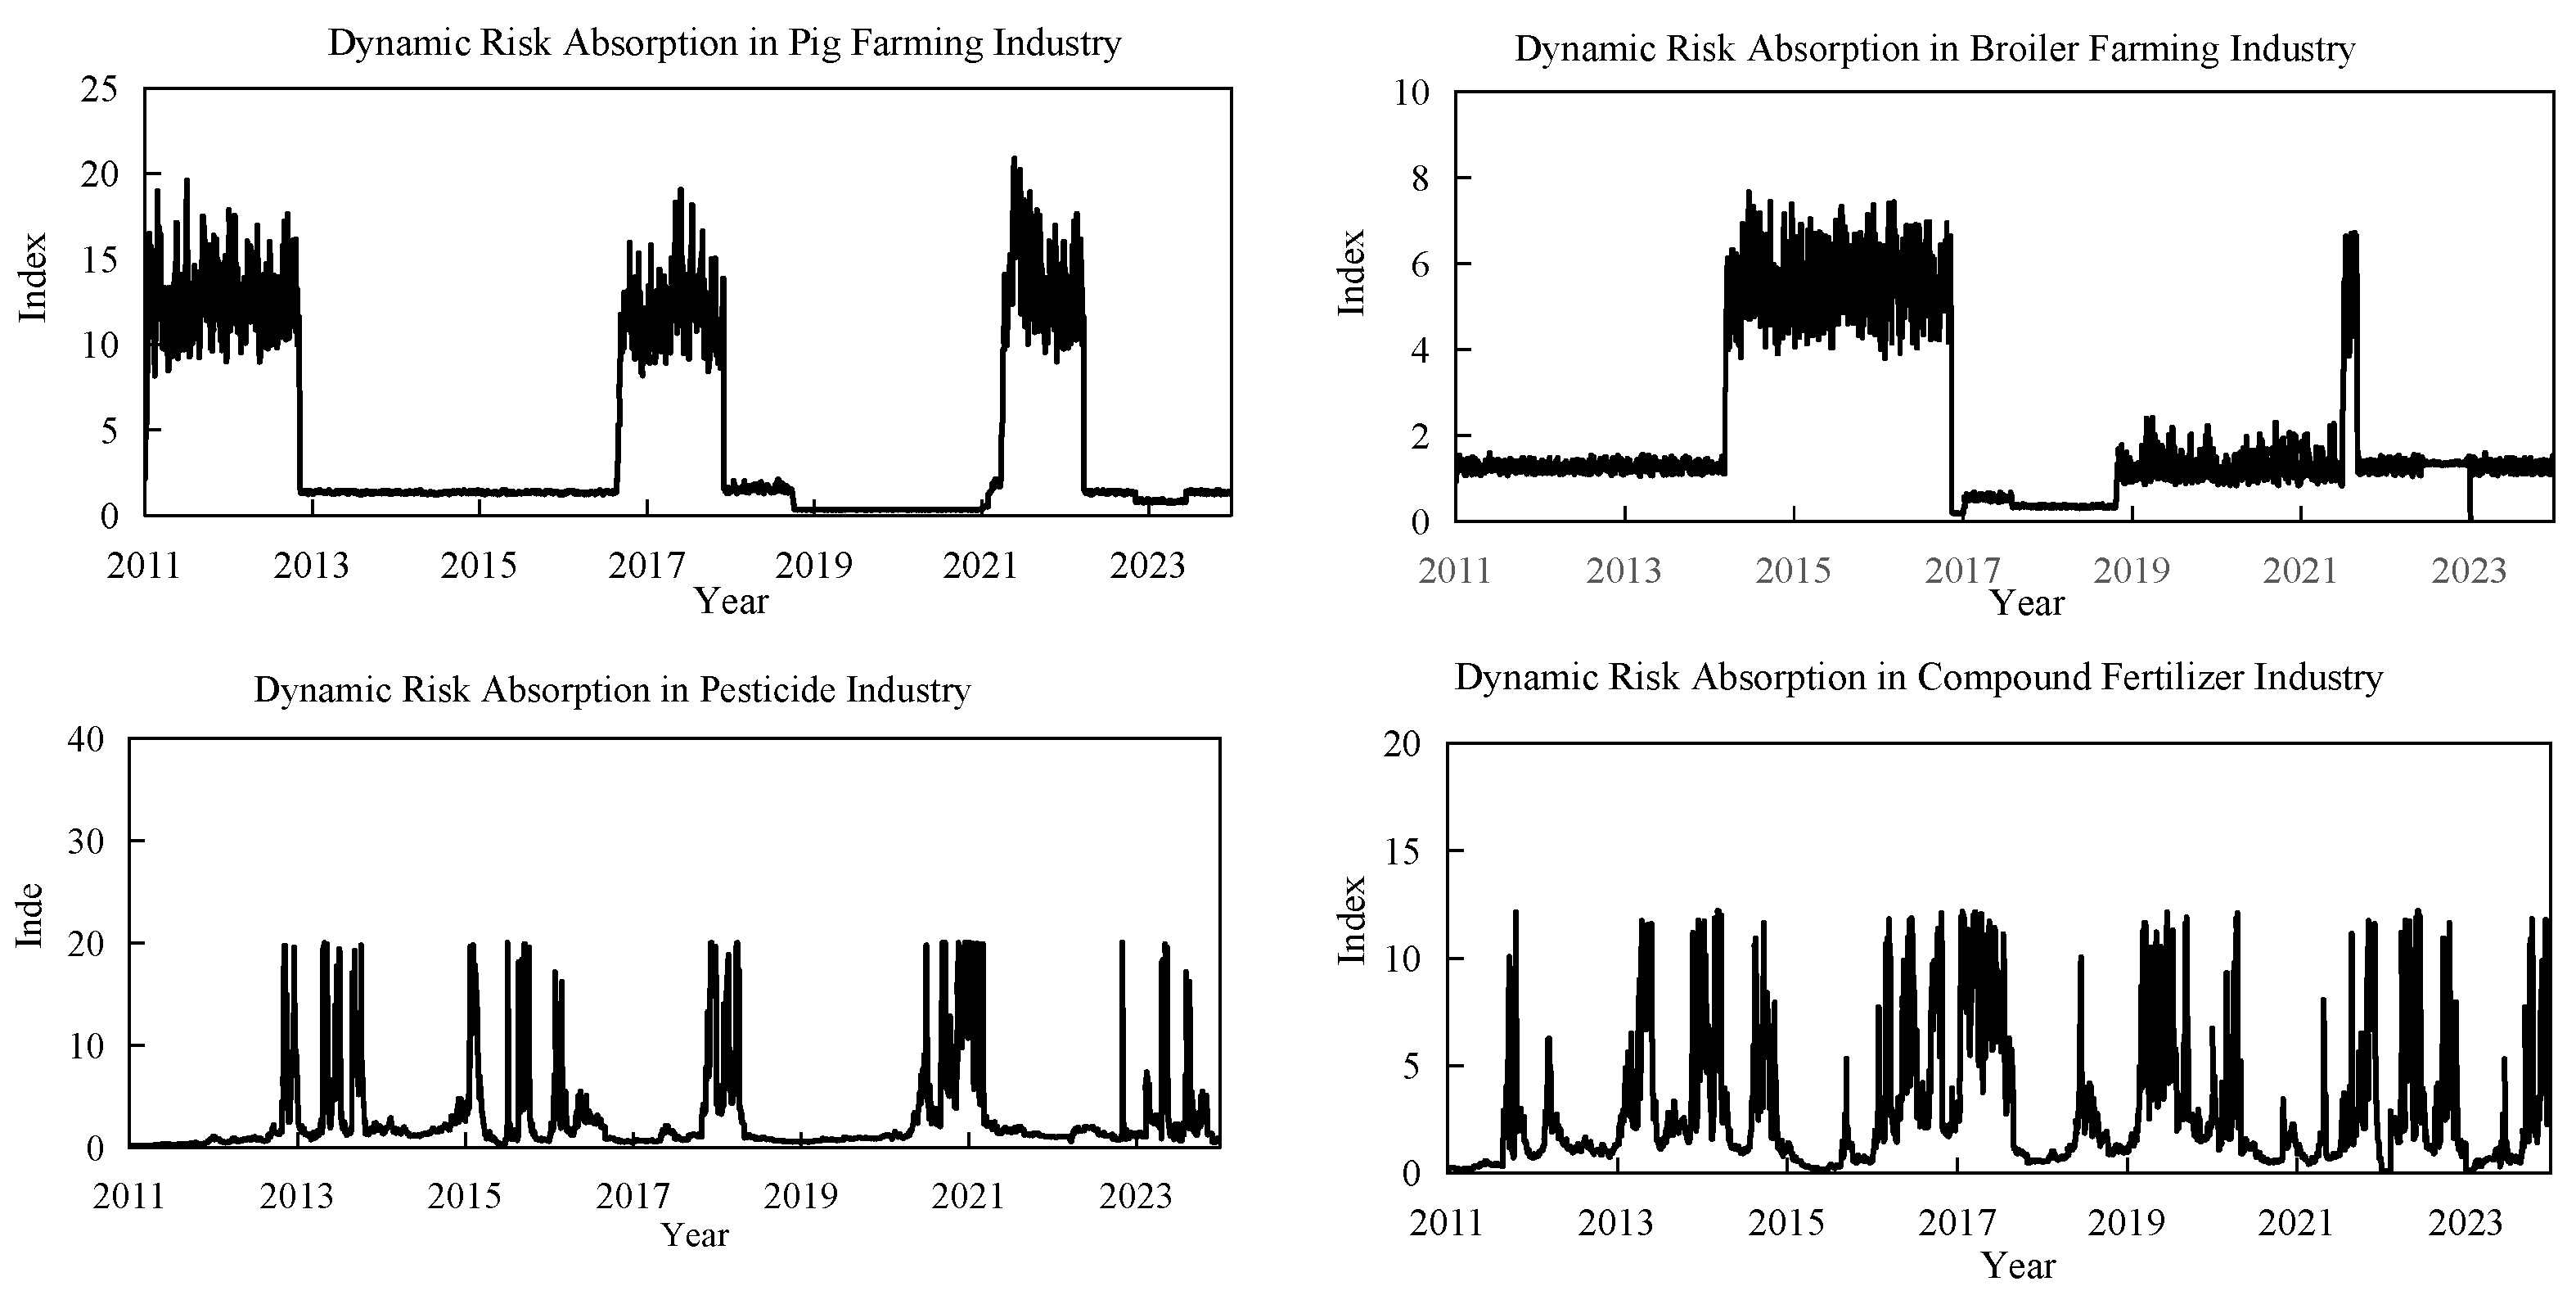
To accurately reflect the development status and market dynamics across various sectors within the agricultural system, this study selects the Shenwan Securities tertiary agricultural industry indices from the iFinD financial database as research indicators. These indices include the seed index, grain planting index, marine fishing index, aquaculture index, forestry index, livestock and poultry feed index, fruit and vegetable processing index, grain and oil processing index, hog farming index, broiler farming index, pesticide index, and compound fertilizer index. For ease of reference, they are sequentially labeled as indices 1 to 12. The sample period spans from 1 January 2010 to 31 December 2023. This timeframe encompasses major events such as the 2015 stock market volatility, the 2018 China–U.S. trade friction, and the 2020 COVID-19 pandemic, providing a robust basis for further analyzing risk transmission pathways and interconnected risk mechanisms among agricultural sectors. The findings offer empirical support for risk management and policy formulation in the agricultural supply chain. The logarithmic returns are derived by calculating the exponential series of daily closing prices, with the formula as follows:
Y i , t = l n Y i , t l n Y i , t + 1
In the formula, Y i , t represents the daily return rate of the industry index, where Y i , t and Y i , t + 1 denote the closing prices on consecutive trading days.
When examining the impact of multi-layer network structures on inter-industry risk linkages, the degree of risk spillover and absorption between industries at a quarterly frequency is selected as the dependent variable, while the nodes at a monthly frequency serve as the explanatory variables. Additionally, monthly industry transaction prices and price-to-earnings ratios are considered. Macro-level control variables encompass the quarterly economic year-over-year growth rate and the year-over-year growth rate of the money supply. The calculation formula is as follows:
Δ C o V a R i , t O U T = α + β C i , t + γ 1 W i , t + γ 2 H i , t + ε i , t
Δ C o V a R i , t I N = α + β C i , t + γ 1 W i , t + γ 2 H i , t + ε i , t
In this context, Δ C o V a R i , t O U T and Δ C o V a R i , t I N represent the indicators of risk spillover and risk absorption for industry i at time t, respectively. C i , t denotes the nodal importance indicator, W i , t refers to the micro-level control variables, H i , t signifies the macro-level control variables, and ε i , t is the stochastic error term.

3. Results

3.1. Measurement of Systemic Risk in Agriculture

The analysis revealed that the standardized residuals adhered to a SkewT distribution, a finding corroborated by the probability integral transform and the Kolmogorov–Smirnov (K-S) test. The confirmation that the residual series aligns with a (0,1) distribution demonstrates that using the Copula model is appropriate. By applying Equations (1) and (2), we measured the extent of risk transmission and absorption in different sectors. The resulting changes over time are depicted in Figure 1 and Figure 2, visually showcasing these patterns.

3.2. Measurement Model Analysis

Horizontally, the seed industry experienced notable risk spillover in 2016 and 2019, driven primarily by market volatility, trade disputes, and unexpected public events. The fruit and vegetable processing and grain processing industries saw increased risk spillover in 2017–2018, influenced heavily by trade tensions and the rising costs of raw materials. Meanwhile, the swine and poultry breeding industries were hit by more risk spillover between 2012–2015 and 2018–2020, mainly because of animal disease outbreaks and feed cost fluctuations. Throughout the entire period under review, the pesticide and compound fertilizer industries experienced risk spillover, though with less volatility, indicating a certain level of resilience to policy shifts and market dynamics. The structure of these industries and the nature of their products play a key role in stabilizing industry risks.

3.3. Multi-Layer Network Structure Analysis Across Industries

To align with the specific data frequency demands of our mixed-frequency model, we have chosen monthly data as the foundational period for constructing our multi-layer network structure. Taking August 2023’s data as a case in point, our network diagram visualizes each industry as a node. The relationships between these nodes are shown as lines, where the thickness of the lines indicates the intensity of the connections between industries. This indicates that a multi-layer network configuration can reveal more in-depth insights compared to a single-layer network, as demonstrated in Figure 3A.
Due to the inherent interconnectedness within the agricultural system, we utilized the Minimum Spanning Tree (MST) method to accurately identify the pathways of systemic risk transmission. This method enabled us to analyze the data and emphasize the main channels through which risks propagate, as shown in Figure 3B.
Delving into the multi-layer network structure of the agricultural system sheds light on several key aspects of industry risk transmission. Firstly, the risk spreads across industries through a multi-centric pathway, a pattern that persists over various time frames. This consistency underscores a certain level of stability in how risk is transmitted among industries, likely rooted in supply chain dependencies and economic interactions between industries.

3.4. Further Analysis

Using the seed industry as a case study, Figure 4 illustrates the fluctuations of various structural indicators within a narrow range from 1.0 to 1.1. A more in-depth analysis reveals a strong correlation between these variations, industry growth, and policy shifts. The seed industry’s ascent to prominence commenced with the implementation of the Seed Law in 2000, a pivotal moment that coincided with the initiation of the “Seed Project”. In 2015, the sector underwent a significant reorganization marked by substantial mergers and acquisitions, leading to a notable decrease in the number of seed companies from over 8700 to slightly above 5000. This consolidation reshaped the industry’s landscape, leading to a surge in the indicators. The “Southern Seed Valley” initiative, unveiled in 2019, marked a new era of technological advancements in the seed sector. The implementation of national strategies further accelerated the transfer of technology, culminating in a second indicator peak. A third peak emerged in 2020, as the COVID-19 pandemic exerted a profound influence on global agriculture, confronting the seed industry with challenges such as logistical snarls and barriers to international trade. China’s response, articulated in the No.1 Central Document and the Central Rural Work Conference of 2020, aimed at overcoming pivotal technological hurdles and revitalizing the seed industry.

3.5. Case Study

To delve deeper into the effects of trade policies, emergencies, and international conflicts on the agricultural system’s complex inter-industry network, three pivotal events were examined: the onset of the US–China trade war in March 2018, the national spread of COVID-19 in March 2020, and the Russia–Ukraine conflict in March 2022. These case studies provide a lens through which to observe the evolution of the agricultural system’s intricate multi-layered network structure.
As illustrated in Figure 5, the US–China trade war precipitated heightened risks across a broad spectrum of industries. The transmission of risk predominantly traced a path from the grain planting sector, moving through to the marine fishing industry, and ultimately impacting the swine breeding sector. Industries interlinked within the supply chain faced escalating costs and diminished market demand, a direct consequence of increased tariffs and a downturn in exports. This sequence of events facilitated risk diffusion along this trajectory, positioning the marine fishing and swine breeding industries as focal points for risk spillover. The advent of the COVID-19 pandemic across the nation further complicated matters. Alterations in transportation due to lockdowns and shifts in consumer behavior propagated risk along a new path: from the grain and oil processing industry to swine breeding, and subsequently, to the broiler chicken sector. The supply chain encountered significant disruptions in both production and distribution, catapulting the grain and oil processing and swine breeding industries into rapid centers of risk spillover. The escalation of the Russia–Ukraine conflict further amplified the risk spillover among industries, marking a notable diversification in the pathways of risk transmission. Given that Russia and Ukraine are pivotal global grain exporters, the conflict has posed substantial challenges to global food security. This scenario has led to heightened volatility in grain prices, adversely affecting downstream industries, especially those directly linked to grain production. Consequently, the grain and oil processing industry and the compound fertilizer industry have emerged as critical epicenters of risk spillover. Moreover, the analysis of network structures at various temporal stages revealed significant heterogeneity, underscoring that multi-layer network analysis is instrumental in uncovering the intricate web of risk connections between industries. It also accentuates the distinct edge characteristics unique to each layer, offering profound insights into the dynamic nature of industry interdependencies.

3.6. Industry Risk Spillover Perspective

The Hausman test results indicate a clear preference for the fixed effects model over its random effects counterpart. Based on the MIDAS model, four methods were selected for weighting: U-MIDAS, Step, Exponential Almon weighting, and Beta weighting. The results are shown in Table 1. A thorough evaluation, grounded in information criteria, log-likelihood estimations, and a suite of goodness-of-fit measures, highlights the Step model’s superior ability to account for variance. The Almon model’s performance is noteworthy, as it nestles between the Step and U-MIDAS models in terms of effectiveness. Despite not leading the pack in terms of the Akaike Information Criterion (AIC), Bayesian Information Criterion (BIC), and Hannan–Quinn (HQ) values, the Beta model boasts R-squared and Adjusted R-squared figures that eclipse those of both the U-MIDAS and Almon models. In light of these findings, the Step model emerges as the preferred choice for managing high-frequency variables. To pinpoint the optimal lag period, we employed rolling regression analysis, seeking out the configuration with the minimal root mean square error. This meticulous approach ensures that the selected model is finely tuned to deliver the most accurate and reliable forecasts.
Table 2 showcases the root mean square error (RMSE) values corresponding to various lag orders in the context of risk spillover analysis. Notably, the RMSE reaches its nadir at K = 5, clocking in at 74.53. This indicates that within the confines of the dataset at hand, an optimal lag order of 5 emerges as the most accurate predictor, enhancing the model’s precision. In light of this insight, we have crafted a mixed-frequency regression model that adopts the Step method for assigning weights and folds in high-frequency variables with a 5-period lag. The analytical progression of the model meticulously weaves in the pivotal variables from five critical nodes, culminating in a comprehensive consideration of all variables in unison.
As illustrated in Table 3, there is a notable positive correlation between degree centrality and risk spillover, which suggests a direct proportionality between the interconnectedness of industries and the magnitude of their spillover effects in the face of extreme risk. In particular, when pivotal industries within the agricultural sector encounter risk, it is more likely to ripple through their extensive connections, potentially giving rise to a systemic risk resonance. This is further corroborated by the significant positive values of closeness centrality, which imply that crises at the heart of risk spillover lead to a hastened transmission of risk, thereby impacting surrounding industries. These sectors are prone to swift risk dissemination due to their intricate trade networks, cohesive supply chains, and concentrated information flows. Their inherent structural properties enable rapid diffusion of risk along the supply chain, occasionally setting off secondary risk cascades. The positive figures for eigenvector centrality reveal that industries with strong ties to central industries are also pivotal in the diffusion of risk. Those with high-frequency business interactions and interdependencies may experience what is known as a risk resonance effect. However, the lack of significance in betweenness centrality indicates that the influence of risk wanes after its initial spread among industries, not potent enough to instigate a far-reaching chain reaction. Consequently, it is improbable for the risk of a single industry to extensively impact the entire system through indirect connections. It can be deduced, therefore, that significant risks within the agricultural system are more apt to arise from a concurrence of risks across various industries rather than from a chain reaction sparked by a solitary industry crisis.
Turning to the controlled variables, the significant equity attributable to the parent company in financial indicators is a testament to the fact that agricultural enterprises with robust profitability and operational prowess typically boast superior resource integration capabilities and market competitiveness, positioning them as industry frontrunners. Should these enterprises grapple with financial or operational setbacks, they could precipitate considerable disturbances throughout the supply chain or even the industry at large, inciting trust crises or price volatility within the sector. The significant positive year-over-year economic growth rate reflects that while rapid economic expansion is often paralleled by consumer upgrades and heightened market demand, it can also precipitate issues like overexpansion and speculative bubbles in agricultural product prices, thus becoming “unstable risk factors”. Conversely, the significant negative growth rate of the money supply highlights the necessity of judiciously managing the money supply to avert market overheating and to circumvent an over-restriction of funds, which is vital for the agricultural industry’s stable progression.

3.7. Industry Risk Absorption Perspective

Employing a fixed effects model paired with a Step weighting approach, we scrutinized the significance of various variables. As delineated in Table 4, there is a notable positive correlation between degree centrality and risk absorption capacity. This correlation underscores that industries occupying more central positions in the network exhibit a heightened ability to weather risks. It also hints at the possibility that industries with numerous direct connections may become hotbeds for risk concentration, potentially intensifying the propagation of risk due to their dense ties with other sectors. The importance of indirect centrality emerges here, suggesting that secondary connections within an industry serve as a cushion against the spread of risk, thereby diminishing the chances of an industry becoming a conduit for risk dissemination. The substantial positive link with closeness centrality reveals that industries situated at the nexus of the network are likely to encounter increased risk exposure, a byproduct of their close-knit interactions. An industry’s closeness centrality is indicative of its pivotal role in the network’s risk distribution, placing it at a higher propensity for risk bearing. Furthermore, the examination of eigenvector centrality unveils a latent risk-sharing dynamic among industries within the agricultural sector. This dynamic indicates that inter-industry connections may facilitate the diffusion of risks, thereby establishing a communal risk-sharing framework.
On the micro-level, control variables wield considerable influence, signifying that the operational prowess and frequency of market transactions of agricultural enterprises have a substantial bearing on their stock transaction prices. This relationship reflects, to a certain extent, the magnitude of risk these enterprises shoulder. Consequently, these factors necessitate that agricultural businesses maintain strong operational capabilities and adopt agile market response strategies to adeptly navigate potential risks.

4. Discussion

From a vertical perspective, analyzing the risk transmission pathways and intensities between upstream production industries—such as seeds, fertilizers, and pesticides—and downstream industries, including agricultural product processing and breeding, illuminates key areas for risk management. This differentiation often ties back to the unique characteristics of each industry, the structure of the market, and the surrounding policy environment. On a horizontal level, the analysis uncovers the variances in factors impacting different industries and the degree of risk variation. These differences may stem from market sensitivity, technological advancements, and the industry’s adaptability. The complex web of transmission pathways and the stability of risk propagation between industries, coupled with fluctuations in risk intensity at the same level across various time frames, reveal a dynamic risk linkage structure within the agricultural system. This dynamism is likely influenced by seasonal factors, shifts in market demand, and international trade policies. The transmissibility of risk and the vulnerability of inter-industry nodes, together with the observed positive correlation between connectivity and risk, underscore the critical role of regulatory bodies in risk prevention and control, as well as the importance of inter-industry collaboration.
From the standpoint of industry risk spillover, the positive correlation between the intensity of close inter-industry connections and the potential for extreme risk spillover effects signals that regulators and industry stakeholders must be vigilant about the interlinking effects between industries. In terms of risk absorption, the positive correlation between an industry’s centrality and its capacity to absorb risk, along with the buffering role of industries with high indirect centrality in mitigating risk transmission, opens new avenues for internal risk management strategies within industries. The discovery of eigenvector centrality, which suggests that inter-industry linkages aid in risk diversification, lays a theoretical foundation for establishing a collective risk-sharing mechanism.
Despite the fresh insights this study offers into the mechanisms of risk propagation within the agricultural system, it is not without its limitations. For instance, the model may not fully capture all the factors influencing risk propagation, particularly those that are challenging to quantify, like policy shifts and technological breakthroughs. Additionally, due to constraints in data availability, this study might not encompass all pertinent industries. Future research could broaden its scope to include more industries, providing a more comprehensive understanding of risk propagation.

5. Conclusions

This study employed the DCC-t-Copula-CoVaR model, multi-layer network structures, and the mixed-frequency regression MIDAS model to explore risk spillover, absorption effects, and transmission mechanisms within the agricultural sector from an industry standpoint. The key findings are as follows:
There is notable heterogeneity in risk spillover and absorption among different sectors within the agricultural system, with industries generally possessing a greater capacity to absorb risks than to generate spillovers. As a whole, the agricultural system demonstrates intrinsic risk-buffering traits. Vertically, the risk transmission pathways and intensity differ between industries involved in the production of seeds, fertilizers, and pesticides (upstream) and those engaged in agricultural product processing and breeding (downstream). Horizontally, varying factors influence industries, leading to different levels of risk fluctuation.
The transmission of risk between industries within the agricultural system features multi-centric pathways and maintains a degree of stability. The intensity of risk transmission among industries at the same level fluctuates over time. Inter-industry nodes exhibit both risk propagation and vulnerability, with stronger connections leading to higher risks.
Regarding industry risk spillover, the intensity of close inter-industry connections directly correlates with the magnitude of extreme risk spillover; risks can swiftly propagate through complex trading networks, with significant risks in the agricultural system mainly stemming from resonance across multiple industries. From the risk absorption perspective, an industry’s degree of centrality is positively linked to its capacity to absorb risks. Conversely, industries with high indirect centrality can mitigate risk transmission, while those with high closeness centrality are more exposed to risks. Eigenvector centrality suggests that inter-industry connections facilitate risk dispersion, creating a collective risk-sharing mechanism.
Limitations and recommendations for further study. Even with the deployment of sophisticated tools like the DCC-t-Copula-CoVaR model, multi-layer network structures, and the mixed-frequency regression MIDAS model in risk analysis, these instruments can encounter constraints due to their inherent model assumptions when applied in real-world scenarios. For example, the static nature of the CoVaR model might not adequately capture the dynamic aspects of risk evolution. Furthermore, the representativeness of research findings can be compromised by the scope and periodicity of the data employed, particularly if the data are predominantly sourced from specific locales or time frames. This limitation could render the identified patterns of risk dissemination and stability conclusions inapplicable in a broader global context. Concurrently, there is a tendency in the existing literature to concentrate on the interplay of risks across industries, while the influence of individual firms’ risk management and decision-making processes on the overall stability of the agricultural sector is often overlooked. To deepen and broaden the scope of research, future endeavors might consider several enhancements. Firstly, incorporating time-variant parameter models or nonlinear approaches could significantly improve the detection of risk dynamics. Secondly, broadening the data spectrum to include a wider array of international market information and varying data frequencies could bolster the robustness of the models and the generalizability of the findings. Thirdly, a closer examination of microeconomic entities and their role in risk interplay could yield more nuanced risk management strategies. Additionally, employing long-term data to scrutinize risk transmission mechanisms and stability would provide a more profound comprehension of these dynamics. Lastly, marrying quantitative methodologies with qualitative insights—gleaned from expert interviews and case studies—would offer a more holistic evaluation of the efficacy and socio-economic repercussions of risk management systems.

Author Contributions

Conceptualization, B.L.; methodology, S.Y.; software, M.Y.; data curation, G.L. All authors have read and agreed to the published version of the manuscript.

Funding

This research was funded by the National Natural Science Foundation of China Project (grant number 62103418) Basic Scientific Research Operating Expenses of Institute of Agricultural Information, Chinese Academy of Agricultural Sciences (grant number JBYW-AII-2024-30).

Institutional Review Board Statement

Not applicable.

Informed Consent Statement

Not applicable.

Data Availability Statement

The data that support the findings will be available in iFinD financial Data terminal at http://ft.10jqka.com.cn/ following an embargo from the date of publication to allow for commercialization of research findings.

Conflicts of Interest

The authors declare no conflicts of interest.

References

  1. Mergoni, A.; Dipierro, R.A.; Colamartino, C. European agricultural sector: The tortuous path across efficiency, sustainability and environmental risk. Socio-Econ. Plan. Sci. 2024, 92, 101848–101861. [Google Scholar] [CrossRef]
  2. Suriansyah; Nurliza; Dolorosa, E.; Rosyadi; Suswati, D. Intention to transition: Natural rubber smallholders navigating the risks of farming. Sustainability 2024, 16, 1765. [Google Scholar] [CrossRef]
  3. Vigani, M.; Khafagy, A.; Berry, R. Public spending for agricultural risk management: Land use, regional welfare and intra-subsidy substitution. Food Policy 2024, 123, 102603–102623. [Google Scholar] [CrossRef]
  4. He, B.J.; Liu, Y.L.; Zhang, H.M.; Feng, J.Y. Theoretical analysis and empirical study on the correlation between disaster risk and poverty in China. Arid Land Geogr. 2022, 45, 1649–1658. [Google Scholar]
  5. Chen, X.H.; He, L.; Liu, J. Research on risk control strategy of insurance policy loan under the model of “income insurance + futures + bank”. J. Zhongkai Univ. Agric. Eng. 2022, 35, 49–56. [Google Scholar]
  6. Soumik, D.; Kishor, G. Progress in agricultural vulnerability and risk research in India: A systematic review. Reg. Environ. Change 2021, 21, 24–42. [Google Scholar]
  7. Keshappa, K.; Usha, J. A study on farmers financial wellbeing and credit risk associated with the agro credit. Asian J. Manag. 2019, 10, 368–376. [Google Scholar] [CrossRef]
  8. Chen, Z.; Jing, Q.; Wang, R. Research on grain supply chain integration led by large grain merchants: An empirical analysis based on SIR Model. Jiangsu Agric. Sci. 2016, 44, 555–559. [Google Scholar]
  9. Tigini, V.; Franchino, M.; Bona, F.; Varese, G.C. Is digestate safe? A study on its ecotoxicity and environmental risk on a pig manure. Sci. Total Environ. 2016, 551–552, 127–132. [Google Scholar] [CrossRef]
  10. Wen, H.; Xin, Q. Risk measurement of large-scale return to poverty in the process of rural revitalization: Based on the impact of major public health emergencies on the household income of vulnerable rural households. J. Sichuan Univ. (Philos. Soc. Sci. Ed.) 2023, 6, 21–30+187. [Google Scholar]
  11. Jiang, M.J.; Shi, X.J.; Yang, Y.; Xun, D.Y.; Zhang, Z.Y. Key node identification of food supply chain network based on multi-attribute evaluation. Food Sci. Econ. 2023, 48, 83–89. (In Chinese) [Google Scholar]
  12. Qin, J.; Qiao, H. Study on the power law spillover effect of extreme risk in Chinese and American grain futures markets. World Agric. 2022, 9, 53–64. [Google Scholar]
  13. Huang, D.C.; Fang, Z.W.; Feng, T.Z. Research on food security risk assessment based on water resources—Energy input constraints. Agric. Econ. 2022, 7, 13–15. (In Chinese) [Google Scholar]
  14. Wei, C.; Luo, X.H. Research on risk measurement and economic capital measurement of Chinese specialized agricultural insurance companies. Agric. Outlook 2021, 17, 3–9. [Google Scholar]
  15. Zhou, Y.N.; Fu, G.H. Research on key risks of collective construction land market based on complex network analysis. Rural. Econ. Sci. Technol. 2021, 32, 24–28. (In Chinese) [Google Scholar]
  16. Zhou, M.Z.; Wang, J.Y. Evolution of global rice trade pattern based on complex networks and its implications. J. Nat. Resour. 2020, 35, 1055–1067. (In Chinese) [Google Scholar]
  17. Yang, Z.H.; Chen, L.X.; Chen, Y.T. The cross-market contagion of economic policy uncertainty and systemic financial risk: A study based on nonlinear network correlation. Econ. Res. 2020, 55, 65–81. [Google Scholar]
  18. Wang, X.; Qiang, W.L.; Niu, S.W.; Liu, A.M.; Cheng, S.K.; Li, Z. Analysis of global agricultural trade network and its evolution. J. Nat. Resour. 2018, 33, 940–953. (In Chinese) [Google Scholar]
  19. Liang, G.; Zhang, Z.; Wu, P.; Zhang, Z.; Shao, X. Analysis of business risk measurement and factors influencing plantation-based farming cooperatives: Evidence from Guizhou province, China. Sustainability 2024, 16, 2194. [Google Scholar] [CrossRef]
  20. Ye, W.Y.; Li, A.L.; Jiao, S.K. Research on soybean futures market risk spillover based on dynamic model averaging. China Manag. Sci. 2023, 31, 1–10. (In Chinese) [Google Scholar]
  21. Su, Z.W.; Chen, Z.T. Causal relationship between corn price and crude oil price in China based on transmission mechanism. J. Ocean. Univ. China (Soc. Sci. Ed.) 2017, 1, 70–76. [Google Scholar]
  22. Mastenbroek, A.; Gumucio, T.; Nakanwagi, J. Gender, agricultural risk perceptions, and maize seed systems: A case study of drought-tolerant maize varieties in Uganda. Agric. Syst. 2024, 217, 103912. [Google Scholar] [CrossRef]
  23. Savalkar, S.; Khan, A.R.M.; Singh, B.; Pruett, M.; Peters, R.T.; Stöckle, C.O.; Hill, S.E.; Rajagopalan, K. Errors in temporal disaggregation of temperature can lead to non-negligible biases in agroecosystem risk assessment. Agric. For. Meteorol. 2024, 349, 109952. [Google Scholar] [CrossRef]
  24. Martin, J.; Seward, T.; Mintas, D.; Wanke, R. Demeter—A risk mitigation tool for agriculture workers. J. Agromed. 2024, 29, 508–510. [Google Scholar] [CrossRef]
  25. Lishchuk, M.A.; Parfenyk, I.A.; Karachinska, V.N.; Topchii, N.M. Environmental risks in agrophytocoenoses under the influence of segetal phytobiota. Environ. Socio-Econ. Stud. 2024, 12, 23–34. [Google Scholar] [CrossRef]
  26. Xiao, H.; Liu, S.; Yang, C.H. Analysis of supply factors of rising agricultural prices: Based on the perspective of cost transmission capacity. Agric. Tech. Econ. 2014, 6, 80–91. [Google Scholar]
  27. Gu, Z.; Chu, B.J.; Ying, R.Y. Measurement of crop market risk based on wavelet method in Jiangsu. Acta Agric. Jiangxi 2008, 2, 125–128. [Google Scholar]
  28. Zhao, X.R.; Yang, C.; Long, X.F. Research progress and future prospect of animal husbandry risk in China. China Agric. Resour. Reg. Plan. 2024, 45, 247–260. [Google Scholar]
  29. Haas, J.R.; Calkin, D.E.; Thompson, M.P. Wildfire risk transmission in the Colorado Front Range, USA. Risk Anal. 2015, 35, 226–240. [Google Scholar] [CrossRef]
  30. Gavina, A.K.M.; Aoki, K.; Ichinose, G.; Rabajante, J.F.; Ito, H.; Morita, S.; Jansen, V.A.A.; Yoshimura, J. Long-term persistence of agricultural pest insects by risk-spreading dispersal. Ecol. Res. 2018, 33, 1031–1037. [Google Scholar] [CrossRef]
  31. Shi, K. Study on financial risk transmission mechanism based on industrial chain price—A case study of soybean industry chain. Times Financ. 2018, 27, 35–38+47. [Google Scholar]
  32. Li, Y. Supply chain system construction and risk management strategy of biological breeding and seed companies. Mol. Plant Breed. 2024, 22, 1337–1343. [Google Scholar]
  33. Subriadi, P.A.; Najwa, F.N. The consistency analysis of failure mode and effect analysis (FMEA) in information technology risk assessment. Heliyon 2020, 6, e03161. [Google Scholar] [CrossRef] [PubMed]
  34. Szerb, B.A.; Csonka, A. Regional trade agreements, globalization, and global maize exports. Agric. Econ. 2022, 68, 371–379. [Google Scholar] [CrossRef]
  35. Ahmadzai, H.; Malhotra, A.; Tutundjian, S. Assessing the impact of sand and dust storm on agriculture: Empirical evidence from Mongolia. PLoS ONE 2023, 1, e0269271. [Google Scholar] [CrossRef]
  36. Vrabcová, P.; Urbancová, H. Sustainable innovation in agriculture: Building a strategic management system to ensure competitiveness and business sustainability. Agric. Econ. 2023, 69, 1–12. [Google Scholar]
  37. Engle, R.F. Dynamic conditional correlation: A simple class of multivariate generalized autoregressive conditional heteroskedasticity models. J. Bus. Econ. Stat. 2002, 20, 339–350. [Google Scholar] [CrossRef]
  38. Adrian, T.; Brunnermeier, K. CoVar. Am. Econ. Rev. 2016, 106, 1705–1741. [Google Scholar] [CrossRef]
  39. Jondeau, E.; Rockinger, M. The Copula-GARCH model of conditional dependencies: An international stock market application. J. Int. Money Financ. 2006, 25, 827–853. [Google Scholar] [CrossRef]
  40. Shen, H.; Zhang, C.Y.; Liu, X.X. Research on inter-industry risk linkage mechanism based on multi-layer network structure. Chin. J. Manag. Sci. 2024, 32, 173–182. [Google Scholar]
  41. Bonaccolto, G.; Caporin, M.; Panzica, R. Estimation and model-based combination of causality networks among large US banks and insurance companies. J. Empir. Financ. 2019, 54, 1–21. [Google Scholar] [CrossRef]
  42. Hmimida, M.; Kanawati, R. Community detection in multiplex networks: A seed-centric approach. Netw. Heterog. Media 2015, 10, 71–85. [Google Scholar] [CrossRef]
  43. Ghysels, E.; Valkanov, R. The MIDAS touch: Mixed data sampling regression models. Cirano Work. Pap. 2004, 5, 512–517. [Google Scholar]
Figure 1. Dynamic risk spillover levels across industries.
Sustainability 17 04719 g001aSustainability 17 04719 g001b
Figure 2. Dynamic risk absorption levels across industries.
Sustainability 17 04719 g002aSustainability 17 04719 g002b
Figure 3. (A) Distance network structure in August 2023; (B) multi-layer network structure in August 2023. The numbers 1 to 12 in the figure represent in sequence: seed index, grain planting index, Marine fishery index, aquaculture index, forestry index, livestock and poultry feed index, fruit and vegetable processing index, grain and oil processing index, pig breeding index, broiler breeding index, pesticide index, and compound fertilizer index.
Sustainability 17 04719 g003
Figure 4. Trend of importance evolution in seed industry nodes.
Sustainability 17 04719 g004
Figure 5. Evolution trend of multi-layer network structure. The numbers 1 to 12 in the figure represent in sequence: seed index, grain planting index, Marine fishery index, aquaculture index, forestry index, livestock and poultry feed index, fruit and vegetable processing index, grain and oil processing index, pig breeding index, broiler breeding index, pesticide index, and compound fertilizer index.
Sustainability 17 04719 g005
Table 1. Determination of the optimal weighting method (risk spillover).
AICBICHQLLR2Adj R2
Step275530332671−13200.5640.544
Almon279029982727−13520.4660.448
Beta281930292755−13660.4870.469
U-MIDAS283229722638−13870.4380.425
Note: AIC, BIC, and HQ are information criteria, LL is the log-likelihood value, and R2 is the coefficient of determination (goodness of fit). Source: Author’s own elaboration.
Table 2. Selecting the optimal lag order (risk spillover).
KRMSEKRMSEKRMSEKRMSE
1184.67490.067186.6110196.13
2211.54574.538287.4311188.32
3127.126168.889400.3612120.36
Source: Author’s own elaboration.
Table 3. Estimation results of risk spillover effects.
(1)(2)(3)(4)(5)(6)
DEG_L1 28.162 **----13.242
(10.642)----(16.358)
BET_L1-−2.412---−3.503 *
-(2.136)---(2.059)
CLO_L1--27.456 **--3.347
--(11.968)--(19.102)
EIG_L1---17.836 *-4.174
---(9.236)-(11.361)
PAG_L1----82.106 **64.119
----(39.035)(42.036)
Control variableYESYESYESYESYESYES
R20.4560.4130.4360.4620.4680.523
Adj R20.4310.3860.4100.4370.4430.501
Note: * and ** indicate significance at the 10% and 5% levels respectively, and Standard errors are in parentheses. Source: Author’s own elaboration.
Table 4. Estimation results of risk absorption effects.
(1)(2)(3)(4)(5)(6)
DEG_L129.247 ** 17.236
(10.768) (16.589)
BET_L1 −4.836 ** −6.032 **
(2.108) (2.074)
CLO_L1 28.846 ** 3.567
(12.063) (19.075)
EIG_L1 14.027 −0.512
(9.263) (11.252)
PAG_L1 77.039 **66.389
(38.903)(42.068)
Control variableYESYESYESYESYESYES
R20.3840.3650.3710.3910.3970.464
Adj R20.3550.3350.3420.3630.3690.439
Note: ** indicate significance at the 5% levels, and Standard errors are in parentheses. Source: Author’s own elaboration.
Disclaimer/Publisher’s Note: The statements, opinions and data contained in all publications are solely those of the individual author(s) and contributor(s) and not of MDPI and/or the editor(s). MDPI and/or the editor(s) disclaim responsibility for any injury to people or property resulting from any ideas, methods, instructions or products referred to in the content.

