Abstract
The prediction of lithium-ion battery capacity degradation is crucial for enhancing the reliability, efficiency, and sustainability of energy storage systems. This study proposes a data-driven approach to model capacity degradation in 18650 lithium-ion cells, supporting the long-term performance and responsible management of battery technologies. A systematic search was conducted to identify publicly available experimental datasets reporting charge/discharge processes, leading to the selection of the MIT-BIT Battery Degradation Dataset (Fixed Current Profiles and Arbitrary Use Profiles). This dataset was chosen for its extensive degradation data, variability, and adaptability to real-world applications. Of the 77 tested cells, 73 were included after filtering data completeness; cells with missing critical information, such as temperature, were excluded. A subset of cells tested under a 1C–2C charge/discharge profile was analyzed, and cell 52 was selected for its comprehensive structure. Using this dataset, a predictive model was developed to estimate the battery capacity based on the current, voltage, and temperature, with capacity as the target variable. A neural network was implemented using TensorFlow and Keras, incorporating ReLU activation, Adam optimization, and multiple loss functions. The dataset was standardized using MinMaxScaler, StandardScaler, and RobustScaler, and the training–test split was 75–25%. The model achieved a prediction error of 3.35% during training and 3.48% during validation, demonstrating robustness and efficiency. These results highlight the potential of data-driven models in accurately predicting lithium-ion battery degradation and underscore their relevance for promoting sustainable energy systems through improved battery health forecasting, optimized second-life use, and extended operational lifetimes of storage technologies.
1. Introduction
The global transition toward sustainable energy systems has gained momentum in recent years due to the increasing urgency of mitigating climate change and reducing greenhouse gas emissions. In accordance with the objectives established by the Paris Climate Agreement (COP21), numerous countries and organizations have committed to reducing their carbon footprints and promoting the integration of clean energy technologies into their economies and infrastructures [1]. Within this context, the electric power sector plays a central role in achieving sustainability targets, particularly those aligned with Sustainable Development Goal 7 (SDG 7), which advocates universal access to affordable, reliable, and modern energy services [2].
The decarbonization of electricity generation, especially through the deployment of photovoltaic (PV) and wind energy systems, has emerged as a cornerstone of climate mitigation strategies proposed by the Intergovernmental Panel on Climate Change (IPCC) [3]. However, the variability of renewable energy sources introduces challenges for grid stability and energy availability. As a result, energy storage systems—particularly those based on lithium-ion battery (LIB) technology—have become essential components in modern renewable energy infrastructures [4].
Lithium-ion batteries are widely adopted due to their high energy density, extended cycle life, and favorable energy efficiency [5]. They are utilized across multiple sectors, including electric mobility, grid storage, and backup power applications. Nevertheless, compared to renewable generation technologies like PV panels, which typically exhibit a service life of 25 to 30 years [6], LIBs demonstrate more rapid performance degradation, with life expectancies ranging from 8 to 10 years or up to 4000 charge–discharge cycles [7]. These limitations arise from internal degradation mechanisms influenced by electrochemical reactions, operational conditions, and thermal and electrical stress [8].
A significant challenge in the sustainable management of LIBs lies in accurately estimating key performance indicators, such as capacity, State of Health (SoH), and Remaining Useful Life (RUL). This is particularly relevant for 18650-type cells, which are extensively reused in second-life battery applications. Their widespread availability from consumer electronics and electric vehicles has positioned them as strategic resources for energy storage repurposing. A comprehensive dataset compiling 137 commercial models of 18650 lithium-ion cells from different manufacturers highlights the diversity and complexity within this cell category [9]. Despite this breadth of information, establishing consistent correlations between their behavior under varying charge and discharge conditions remains a challenging task. Accurate modeling of their performance—whether at the cell, pack, or module level—requires high-quality experimental data that capture degradation patterns across a wide range of operational scenarios.
In this context, data-driven approaches based on machine learning (ML) techniques have gained traction due to their ability to capture complex, nonlinear relationships between battery operational variables and degradation phenomena. ML-based models are particularly well-suited for applications where physical modeling becomes cumbersome due to the variability in operating conditions or the lack of detailed electrochemical parameters [10,11,12]. As a result, recent research has explored the application of neural network architectures—including Long Short-Term Memory (LSTM), Convolutional Neural Networks (CNNs), and hybrid ensemble methods—for battery health estimations and capacity forecasting.
Table 1 provides a comparative summary of recent studies employing neural network-based models for lithium-ion battery capacity estimation, highlighting the modeling techniques, input strategies, and accuracy metrics achieved.

Table 1.
Summary of recent machine learning approaches for capacity estimations in lithium-ion batteries.
Although many of these approaches demonstrate remarkable accuracy, they frequently rely on complex network configurations, high computational demands, or extensive feature engineering. In contrast, the present study focuses on the implementation of a Multi-Layer Perceptron (MLP) model—an architecture that offers a balance between simplicity and performance. MLPs have been proven to effectively approximate nonlinear functions with a reduced computational cost and easier deployment in practical applications, such as predictive maintenance or second-life battery repurposing.
Accordingly, the objective of this work was to develop a data-driven model based on MLPs for the capacity estimation of 18650 lithium-ion cells using experimental electrical measurements. By benchmarking the proposed model against the state of the art, this study contributes to the broader goal of improving battery lifespan predictions, facilitating second-life battery applications and promoting more sustainable energy storage strategies.
In light of the research challenge, this study provides a comprehensive review of relevant scientific contributions and experimental datasets to support the modeling of lithium-ion battery degradation. The proposed methodology relies on data-driven modeling supported by advanced machine learning algorithms, which are particularly well-suited for capturing the nonlinear dynamics associated with battery charging and discharging processes. This approach contributes not only to a more accurate understanding of degradation mechanisms but also to the development of strategies aimed at improving the performance of batteries and extending their service life, which are critical for sustainable energy storage applications.
2. Materials and Methods
2.1. Systematic Database Search
Online, public, and open-access databases have gained significant relevance in the information age and the era of data science. Today, access to data across all disciplines and fields of knowledge is considered essential for ensuring that scientific and technological advances are accessible worldwide. The Organisation for Economic Co-operation and Development (OECD) has recognized that databases are rapidly becoming an integral part of the global scientific system; consequently, it has established principles and guidelines to foster academic exchange among communities, thereby ensuring wide dissemination of information [20]. Moreover, digitization has facilitated open access to publications and scientific data, improved access to research findings, and promoted collaborative work within the framework of what is known as open science [21].
In the search for publicly available, open, and structured experimental data reporting the charging and discharging processes of lithium-ion batteries, a total of 31 databases were identified from various authors and institutions worldwide. Additionally, it was determined that this type of search and synthesis of relevant data sources for the study and modeling of lithium-ion batteries is a contemporary and emerging topic, as reported in [9,22].
Between 2008 and 2022, databases reporting experimental data for lithium-based energy storage systems at both the cell level (the minimum storage unit) and the pack level (an interconnection of cells with an enhanced storage capacity) have been published. As a comprehensive compilation of information gathered from online repositories [23,24], database repositories [25,26], and institutional repositories [27,28,29,30,31], the data are presented in a DataFrame that can be accessed in the Supplementary Materials (Table S1: bat_data_collection). The most observed characteristics in the analysis include the cell type and capacity and the form factor of the energy storage device, the number of cells and the number of variables associated with the type of experimentation, the citation count reported in Scopus or Google Scholar, as well as the application and the type of estimation developed. Figure 1 illustrates some key characteristics of the numerical variables reported in the Supplementary Materials (Table S1: bat_data_collection).
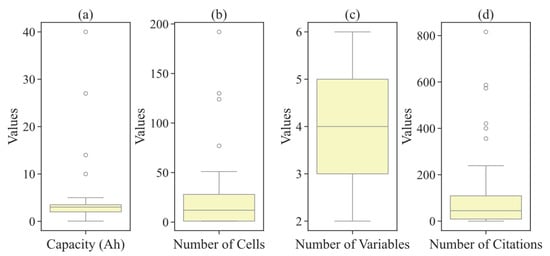
Figure 1.
Numerical variables from the database search. (a) Distribution of cell capacities (b) Number of cells. (c) Number of variables used in models. (d) Number of citations.
A total of 18650 cells were reported across multiple databases, albeit in various types or chemistries, as illustrated in Figure 2.
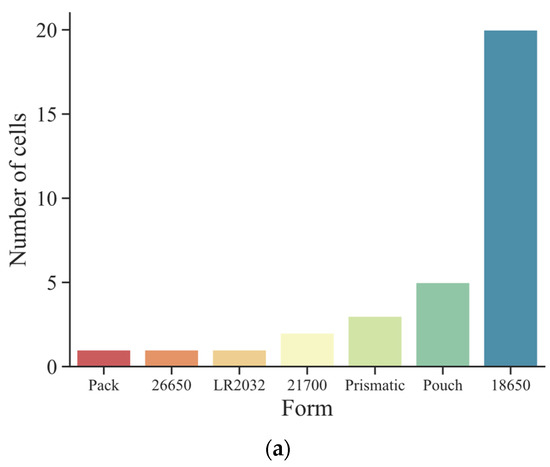
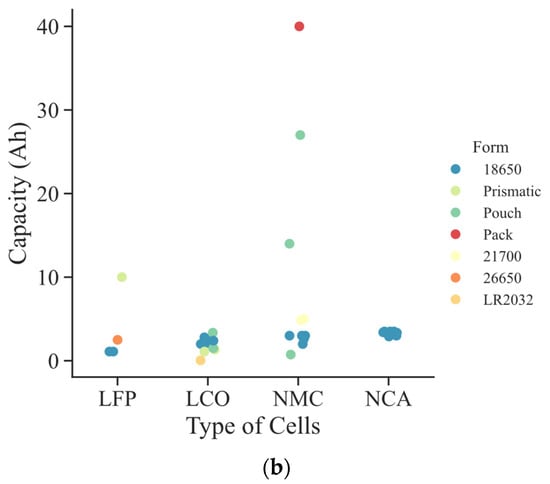
Figure 2.
Number of cells reported according to (a) form factor; (b) type.
In terms of authors, the sources were predominantly identified as coming from renowned technological development centers, such as the National Aeronautics and Space Administration (NASA) or the Toyota Research Institute (TRI); research centers, like the Center for Advanced Life Cycle Engineering (CALCE); research laboratories, including Sandia National Laboratories or the Cavendish Laboratory; and universities primarily located in North America, Europe, and Asia. One of the features extracted during the search for these information sources was the number of citations. It is noteworthy that the TRI-MIT database emerged as the most frequently reported in various articles indexed in Scopus.
The investigation revealed substantial disparities in citation counts among various institutions actively involved in battery research. Notably, research affiliated with TRI-MIT achieved the highest recognition, surpassing 800 citations and underscoring its considerable influence and importance within the scientific community. Similarly, studies originating from UW-MAC and PCoE-NASA exhibited a significant impact, reflected by high citation numbers. Conversely, contributions from institutions such as RWTH, UCB, and VITO demonstrated comparatively lower citation frequencies. These findings emphasize the uneven distribution of academic recognition among institutions engaged in battery-related studies, highlighting particular affiliations whose work has profoundly shaped and guided current research trends and advancements in battery technology and its applications.
Figure 3 presents a bar chart that illustrates the frequency of various applications in lithium-ion battery studies. The x-axis categorizes distinct research focuses, such as State of Health (SoH), Remaining Useful Life (RUL), Electrochemical Impedance Spectroscopy (EIS), and Degradation, while the y-axis indicates the number of occurrences reported across multiple data sources. Interestingly, the “Degradation” category exhibits the highest count, reflecting the significant attention devoted to understanding battery deterioration mechanisms and their impact on performance. Another prominent category, Depth of Discharge (DoD), underscores the importance of operational parameters in influencing both battery longevity and reliability. Furthermore, the SoC category highlights the necessity of precise monitoring and control strategies for optimizing battery performance. Overall, Figure 3 underscores the multifaceted nature of battery research, emphasizing the critical role of investigating degradation, operational conditions, and health parameters to enhance the effectiveness and sustainability of advanced energy storage systems worldwide.
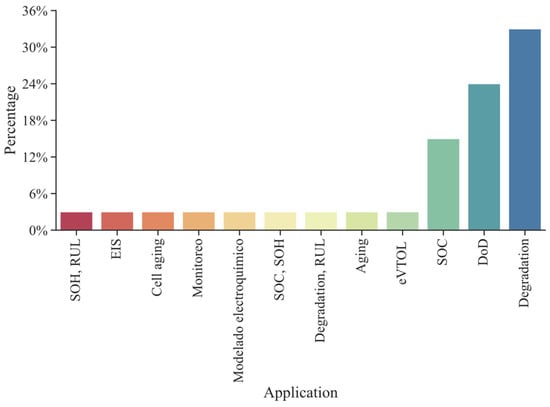
Figure 3.
Estimations reported in the databases.
Although some authors reported on the creation of synthetic data to develop simulation processes, the reported databases primarily contain experimental data derived from laboratory equipment such as the Arbin BT-I (Arbin Instruments, College Station, TX, USA) and Neware BTS4000 (Neware Technology Limited, Shenzhen, China). This type of equipment facilitates the testing and recording of voltage, current, temperature, energy, and capacity data in controlled environments using various charge/discharge profiles, fast charging, electric vehicle driving cycles, among others. Regarding the estimations derived from the data, it was found that 33% correspond to degradation studies, 23% to discharge profiles, and 15% to state-of-charge estimations, as illustrated in Figure 3, which reports the number of estimations provided.
2.2. Database Selection for Study
Open datasets such as these will be essential for the battery community to develop and validate methods for predicting aging. A total of 77 nominally identical, high-energy 18650 cells were tested under both fixed and random charge/discharge profiles at rates of 1C, 2C, and 3C. According to the authors, this is the first dataset to offer an extensive collection of battery degradation data (2.2 GB), characterized by high variability and adaptability to different types of applications. Additionally, compared to the other available databases, this dataset provides a greater number of features and includes detailed information regarding the specific test performed on each cell.
Thus, the dataset selected to implement a data-driven model for 18650 cells was designated “Battery Degradation Dataset (Fixed Current Profiles and Arbitrary Uses Profiles)” and was published in 2022 by researchers from the Massachusetts Institute of Technology (MIT) and Beijing Institute of Technology (BIT), identified in this study’s DataFrame as MIT-BIT. In addition to recording the experimental development time, this dataset provides comprehensive information including the current (A), capacity (Ah), voltage (V), energy (Wh), temperature (°C), and number of cycles.
The experimental subject utilized in this study was the LISHEN 2400 mAh cell, featuring a positive electrode composed of LiCoO2 + LiNi0.5Co0.2Mn0.3O2 and a negative electrode made of graphite. The cell has a nominal capacity of 2.4 Ah and a nominal voltage of 3.7 V, with operating voltages ranging from 4.2 V to 3 V. For each cell, two datasets are reported: one corresponding to an initial test comprising 20 cycles and another to a subsequent test of 100 cycles. Table 2 details the various tests conducted for each cell, organized according to the applied charge and discharge profiles. It is important to note that although the authors indicated that 77 cells were tested, the supplied dataset includes data for only 73 cells—18 under fixed profiles and 55 under random profiles. Figure 4 shows the constant current and constant voltage strategy to charge Li-ion cells [32].

Table 2.
Charge/discharge ratios applied to cells.
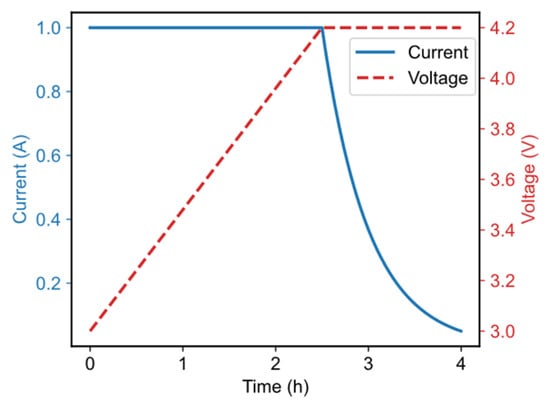
Figure 4.
Constant current–constant voltage (CC-CV) algorithm.
For the development of this research, fixed or constant charge and discharge profiles (1C, 2C, and 3C), as recently presented, were reviewed and selected. Additionally, an examination of this subset of cells revealed that certain cells—specifically cells 2, 6, 22, 29, 32, and 38—did not record critical information, such as temperature. Consequently, these cells were excluded from further analysis.
Thus, the dataset from which a data-driven model is proposed to perform predictions or estimations for a lithium-ion cell was tested under a 1C–2C profile and comprises 44, 48, 52, and 57 [33,34,35]. For the purposes of this study, cell 52 was selected, as its dataset consists of two subsets without any missing data, as detailed in Table 3.

Table 3.
Number of variables and data points for cell 52.
2.3. LISHEN 18650 Cell Specifications
Table 4 provides the technical specifications of the LISHEN LR1865SZ lithium-ion cell used in this study. This cylindrical cell follows the 18650 format, with a diameter of 18.5 mm, a height of 65.2 mm, and a weight of 48 g. It is composed of a hybrid cathode material combining LiCoO2 and LiNi0.5Co0.2Mn0.3O2 (NMC/C), offering a nominal capacity of 2.4 Ah at 0.2C and a nominal voltage of 3.6 V. Charging is performed up to 4.2 V at rates of 0.5C to 1C, while discharging occurs down to 3.0 V and supports higher rates of up to 3C. The cell is designed to operate safely within a temperature range of 0 °C to 45 °C during charging and −20 °C to 60 °C during discharging.

Table 4.
LISHEN 18650 LR1865SZ lithium-ion cell specifications.
All cells described in the dataset are identical in form, model, and reference (LR1865SZ), ensuring consistency in geometry, electrochemical behavior, and thermal response throughout the experimental analysis. This uniformity supports the reliability of the comparative assessments and model training processes conducted in this work.
2.4. Capacity Prediction Model
Based on the selected dataset, it is possible to develop a modeling process that captures the behavior of one of the electrical characteristics of 18650 lithium-ion cells. Lithium-based batteries can be modeled using various strategies, including empirical models, electrochemical models, equivalent circuit models, and data-driven models [36].
The capacity of a cell or battery represents the amount of current that can be stored in the device, expressed in ampere-hours (Ah) and provided as a nominal value; in this case, the 18650 cell has a capacity of 2400 mAh or 2.4 Ah. Moreover, data-driven models typically employ machine learning algorithms to capture the behavior of a battery and the relationship among its electrical variables, which is inherently nonlinear.
The selected dataset comprises six variables: current (A), voltage (V), temperature (°C), energy (Wh), capacity (Ah), and number of cycles. Upon exploring these variables, it was observed that energy and capacity exhibit similar behavior due to their electrical interrelation. Consequently, current, voltage, and temperature were chosen as the model’s input features, while capacity was designated as the target variable to be predicted using various regression algorithms. Although the number of cycles was not included as an input feature, it was noted that the initial and final cycles in the dataset do not contain complete information regarding the charging and discharging process of the lithium cell.
The following figures illustrate the variables included in this study. Figure 5 presents statistical information for each of the battery’s electrical characteristics, while Figure 6 displays the representation of each variable during a complete charge and discharge cycle. Additionally, Figure 7 presents the data distribution as part of the initial exploration for data-driven modeling. The distributions indicate controlled experimental conditions, including rest and charge/discharge phases, and suggest early stages of cell degradation, as evidenced by the consistent capacity values across the analyzed cycles.
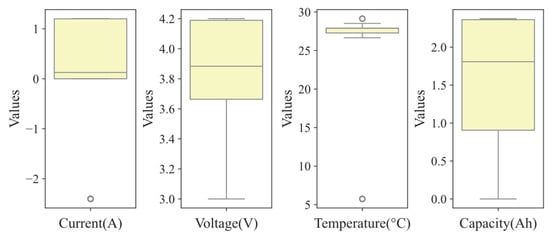
Figure 5.
Numerical variables of the dataset under study.
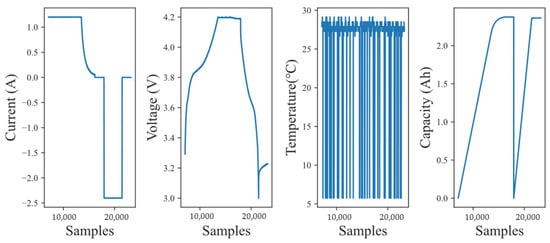
Figure 6.
Features of the data-driven model (current, voltage, temperature, and capacity).
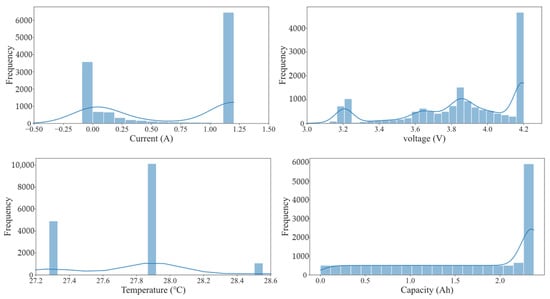
Figure 7.
Distribution of the electrical variables in the dataset.
One of the most critical aspects for applying a data-driven model to predict the capacity of a lithium-ion cell lies in understanding the correlation among its features. In this study, the relationships among the model’s input variables were evaluated using Pearson’s correlation, as presented in Figure 8. The results reveal that the charge/discharge current is correlated with the cell’s terminal voltage, whereas these two variables do not exhibit a strong association with the cell temperature. Nonetheless, temperature plays a pivotal role in the capacity degradation process of lithium-ion cells, as it significantly accelerates the aging of the battery. Although temperature does not exhibit strong statistical correlations with the measured variables, it plays a fundamental physical role in lithium-ion cell capacity degradation. This highlights the fact that certain variables, such as temperature in the context of aging, may be critical to system behavior, even when their statistical correlation appears weak.
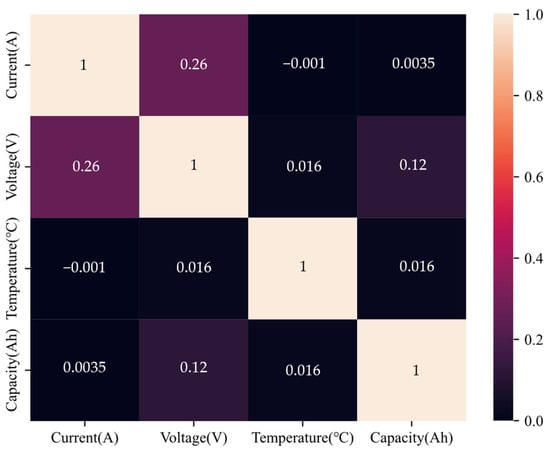
Figure 8.
Statistical correlation of key variables affecting battery behavior.
In this study, the experimental setup—including a LANHE CT2001B battery tester and a GDBELL thermal chamber—allowed for precise temperature regulation. Consequently, all data in the selected dataset were obtained under controlled conditions at 25 °C [34,35].
Consider a fully connected feed-forward neural network defined as follows. Given an input vector , where is the number of input features, the neural network implements the mapping :
where
- and represent the weight matrix and bias vector for the hidden layer, respectively.
- denotes the Rectified Linear Unit (ReLU) activation function, defined as .
- and correspond to the weight vector and bias scalar of the output layer, respectively.
The network parameters are optimized using the Adam optimization algorithm to minimize the mean absolute error (MAE) loss function:
where represents the true output, and is the number of samples in the training dataset.
To ensure an efficient and systematic implementation of the proposed neural network model, Algorithm 1 outlines the structured workflow followed in this study. This algorithm details the process of defining the input shape, constructing the model architecture, selecting the appropriate optimization and loss functions, and training the model using early stopping to prevent overfitting. The training history is subsequently analyzed by plotting the loss and validation loss across epochs, allowing for the evaluation of model performance. The minimum validation loss is also recorded as an indicator of the model’s generalization ability. This structured approach ensures the reproducibility and scalability of the model for further experimentation and comparative analysis. The pseudocode presented below provides a clear and formal representation of the implemented methodology.
| Algorithm 1 Training a neural network model for regression. |
| Input: Training dataset (X_train, y_train), Test dataset (X_test, y_test) Output: Trained neural network model, Minimum validation loss 1: Define input shape as the number of features in X_train 2: Print “Input shape:”, input_shape 3: Initialize a sequential neural network model 4: Add a dense layer with 50 neurons, ReLU activation, and input_shape 5: Add a dense output layer with 1 neuron (linear activation) 6: Compile the model with: - Optimizer: Adam - Loss function: mean absolute error (MAE) 7: Train the model using: - Training data: (X_train, y_train) - Validation data: (X_test, y_test) - Batch size: 32 - Epochs: 100 - Early stopping callback 8: Store training history in a DataFrame 9: Plot training loss and validation loss over epochs 10: Print the minimum validation loss: min (history [‘val_loss’]) |
Data scaling methods play a crucial role in enhancing the performance and stability of machine learning algorithms by ensuring that input features are uniformly scaled, thus preventing biases due to varying magnitudes or units. In this context, scaling techniques such as MinMaxScaler, StandardScaler, and RobustScaler are widely employed. MinMaxScaler normalizes data into a fixed range (usually [0, 1]), thereby retaining the original distribution shape while reducing the influence of extreme values. StandardScaler standardizes features by removing the mean and scaling to unit variance, assuming a Gaussian distribution to mitigate biases arising from differing feature variances. RobustScaler, particularly advantageous for datasets with significant outliers or non-normal distributions, employs median and interquartile ranges, ensuring robustness against extreme data points. A formal mathematical description of each scaling method is provided below to enhance clarity and reproducibility.
Let be a dataset consisting of samples of a given feature. The MinMaxScaler transformation rescales each original feature to a new scaled feature within a predefined range, typically , as follows:
where
- is the original feature value.
- is the scaled feature value.
- and represent the minimum and maximum values of the feature in the original dataset, respectively.
The StandardScaler transformation standardizes each original feature by subtracting the mean and scaling by the standard deviation , as described mathematically by the following:
- is the original feature value.
- is the scaled feature value.
- is the arithmetic mean of the dataset.
- is the standard deviation of the dataset.
The RobustScaler method rescales the feature by removing the median and scaling according to the interquartile range (IQR). Mathematically, each original feature is transformed into a scaled feature as follows:
- is the original feature value.
- is the scaled feature value.
- and correspond to the first quartile (25th percentile) and third quartile (75th percentile), respectively.
- defines the interquartile range (IQR).
These transformations ensure that all features share a common scale, effectively eliminating biases introduced by differing ranges and magnitudes, thereby improving the stability and performance of subsequent machine learning models. Specifically, standardization methods that yield a mean of zero and unit variance facilitate algorithmic stability and enhance the effectiveness of algorithms sensitive to feature scaling. Moreover, robust scaling methods provide resilience against outliers and are particularly beneficial when working with datasets containing extreme values or non-normally distributed features, further enhancing the reliability and robustness of the analyses.
With the model’s predictors defined for the charging and discharging of an 18650 lithium-ion cell under a 1C–2C profile, the lithium-ion cells were operated under defined charge and discharge profiles, specifically, 1C for charging and 2C for discharging. This corresponds to a charge current of 2.4 A and a discharge current of 4.8 A, based on the nominal capacity of 2400 mAh used in the experimental setup. The implementation of a neural network is proposed using the TensorFlow library (version 2.16.1) and Keras API (version 3.7.0), with a workflow configured as outlined below in Figure 9.
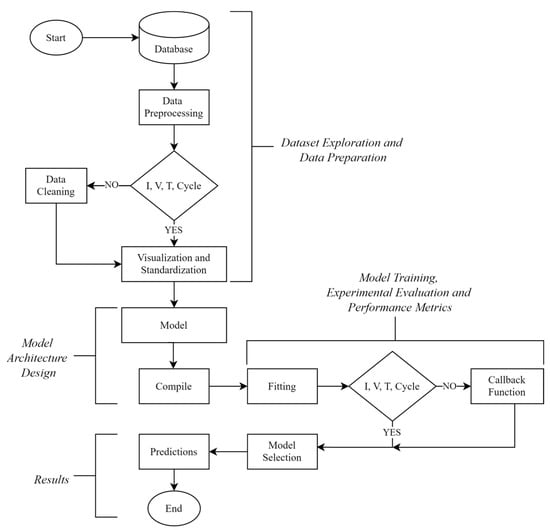
Figure 9.
Flow diagram for the implementation of the data-driven model.
The neural network consists of an input layer with 10 neurons, a ReLU activation function, and an output layer. The defined hyperparameters include the Adam algorithm as the optimization function, and for the loss function, options such as MAE, mean squared error (MSE), and Huber—among other metrics—can be selected depending on the type of regression problem, resulting in highly adjustable topologies. For data standardization, three methods available in the scikit-learn library are proposed: MinMaxScaler, StandardScaler, and RobustScaler. This step is fundamental prior to splitting the dataset into training and testing sets, with a ratio of 75% for training and 25% for testing.
3. Results
The results of the analysis and modeling process using a neural network are presented based on a set of experimental data recorded from the charging/discharging (1C–2C) of a high-energy 18650 lithium-ion cell with a nominal capacity of 2.4 Ah. Figure 10 illustrates the process of selecting an operating cycle from the full dataset of lithium-ion cell measurements. Panel (a) displays the complete sequence of capacity measurements in ampere-hours (Ah), where the repetitive charge–discharge behavior characteristic of cycling tests can be observed. To ensure consistent and representative model inputs, a specific cycle was extracted from the dataset for training purposes. Panel (b) provides a zoomed-in view of the selected segment, clearly showing one complete charge and discharge process. This step was critical for isolating usable patterns and minimizing the influence of transitional or unstable periods that could introduce noise or variability in the learning phase. By focusing on stable, repetitive behavior, the selected cycle ensures a robust foundation for the development and evaluation of data-driven models.
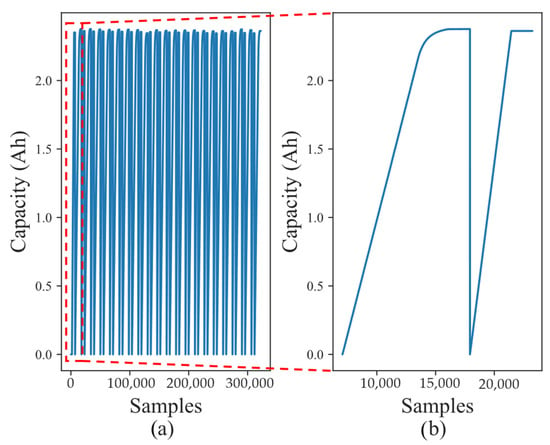
Figure 10.
Selection of the operating cycle: (a) complete cycles in dataset; (b) complete charge and discharge cycle.
For the selection of the operating cycles, exploration and visualization of the data were conducted, and it was necessary to discard cycles 1 and 21, as they do not correspond to full charge and discharge cycles.
Figure 11 compares the performance of three data scaling techniques—StandardScaler, MinMaxScaler, and RobustScaler—evaluated across four different operating cycles using two key error metrics: mean squared error (MSE) and mean absolute error (MAE). The results show that MinMaxScaler consistently achieves the lowest MSE values in all cycles, indicating its effectiveness in reducing large deviations during predictions. However, contrary to what was previously stated, MinMaxScaler only outperforms the other scalers in terms of MAE during cycles 10 and 15. In the remaining cycles (5 and 20), StandardScaler yields the lowest MAE values. RobustScaler shows stable, moderate performance across all metrics but does not achieve minimum values in either MAE or MSE. These findings suggest that while MinMaxScaler offers advantages in controlling error variances, its absolute predictive accuracy is cycle-dependent. Therefore, the choice of scaler should consider not only the error type but also the temporal behavior of the dataset.
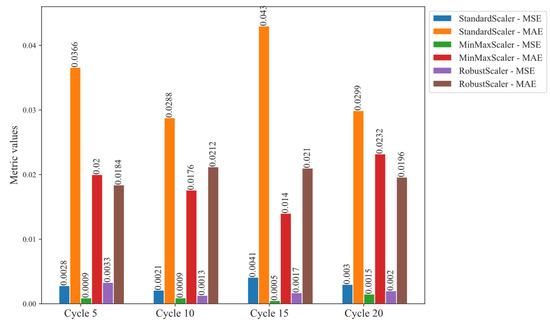
Figure 11.
Performance evaluation of scalers across multiple cycles using MSE and MAE.
On the other hand, while a neural network model may require many parameters and hyperparameters—and the number of neurons and layers can be scaled accordingly—in this work, we opted to implement it with the minimum configurations necessary to achieve satisfactory results. In this regard, two training configurations were developed: one with 100 epochs and another in which the algorithm’s workflow includes an early stopping mechanism, halting iterations when no further improvement is observed in the defined metrics, thereby preventing model overfitting. The comparison between the two training curves in Figure 12 highlights the impact of hyperparameter tuning and the application of early stopping criteria. The left panel, corresponding to the initial training stage, shows a relatively unstable learning process, with fluctuations in both the training and validation MAEs across epochs. This variability suggests a sensitivity to the learning rate and batch size and a lack of control mechanisms to prevent overfitting or oscillatory convergence. In contrast, the right panel reflects a more stable and consistent training behavior, achieved after optimizing the hyperparameters and implementing early stopping. The resulting curve is significantly smoother, indicating that the model converged more efficiently, with reduced noise in the loss landscape and improved generalizability. The use of early stopping helped to prevent overtraining, while the improved hyperparameters facilitated a more gradual and controlled descent of the loss function. This reinforces the importance of optimization strategies in ensuring robust and efficient learning.
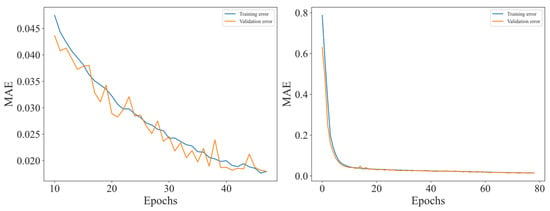
Figure 12.
Training and validation of the neural network.
Table 5 displays the error metric results (loss) for the final iterations of the neural network.

Table 5.
Error metrics (MAEs) for the last 4 iterations of the algorithm.
Finally, predictions for the capacity of the lithium-ion cell were obtained from the neural network and compared with the actual data available in the dataset, as shown in Figure 13. The capacity values reported in the dataset have a mean of 1.5870 Ah, while the predictions exhibit a mean of 1.5899 Ah, with training and validation errors of 3.35% and 3.48%, respectively.
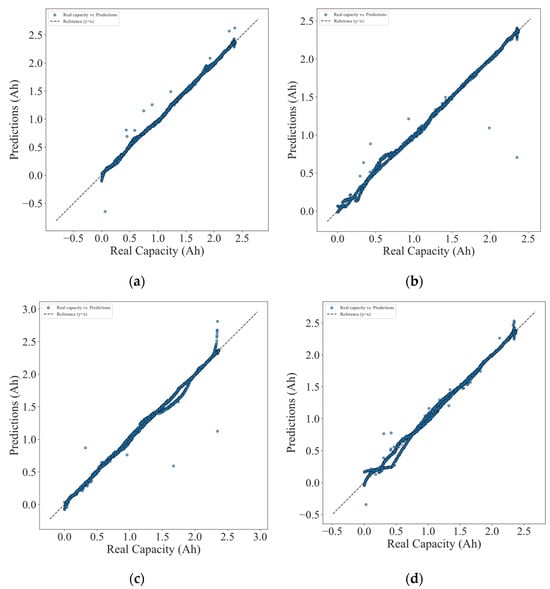
Figure 13.
Model results for (a) cycle 5; (b) cycle 10; (c) cycle 15; (d) cycle 20.
The experimental evaluation of different neural network configurations, varying both the number of neurons and the activation function, revealed important trade-offs between accuracy, computational cost, and architectural complexity. A series of graphical analyses, including heatmaps, scatter plots, and efficiency scores, facilitated a comparative assessment across all tested configurations.
The heatmap of the mean absolute error (MAE) demonstrated that the architecture using the ReLU activation function with 10 neurons achieved the lowest overall error (MAE = 0.0349), outperforming all other configurations regardless of the activation function. This is further corroborated by its high coefficient of determination (R2 = 0.9766), indicating a strong predictive alignment with actual values. To assess model performance across different neural network configurations, Figure 14 presents heatmaps comparing the mean absolute error (MAE) and training time (in seconds) for combinations of activation functions and neuron counts. This visual representation highlights the architectures with the lowest prediction error and those requiring the least computational effort.
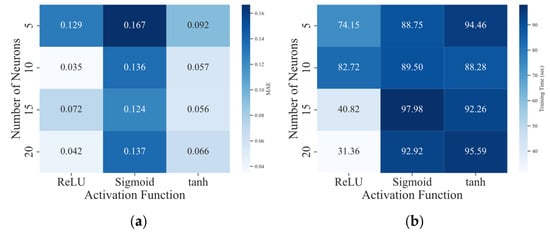
Figure 14.
Model performance: (a) MAE; (b) training time (s) by activation function and number of neurons.
From a computational standpoint, although this configuration did not yield the shortest training time, its time-to-accuracy trade-off remained favorable, as seen in the MAE vs. training time scatter plot. While other configurations, such as ReLU with 20 neurons, required less time, they did not surpass ReLU-10 in accuracy or parameter efficiency. Figure 15 illustrates the trade-off between model accuracy and training time. Each point corresponds to a specific configuration of activation function and number of neurons, while the size of each marker reflects the number of trainable parameters. This plot enables the identification of models that offer optimal performance with minimal computational overhead.
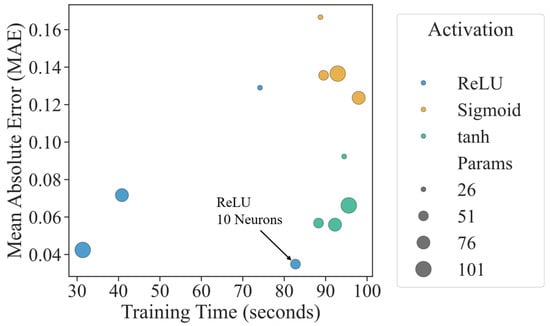
Figure 15.
MAE vs. training time with activation functions and model complexity.
Additionally, the efficiency score, computed as the inverse product of MAE, training time, and number of parameters, ranked ReLU with 10 neurons as the most efficient architecture overall. This highlights its balanced performance in terms of prediction quality and computational demand. Figure 16 displays the efficiency score calculated for each configuration, defined as the inverse product of MAE, training time, and parameter count. This metric integrates both accuracy and computational cost into a single indicator, providing a comprehensive criterion for selecting the most balanced and sustainable model architecture.
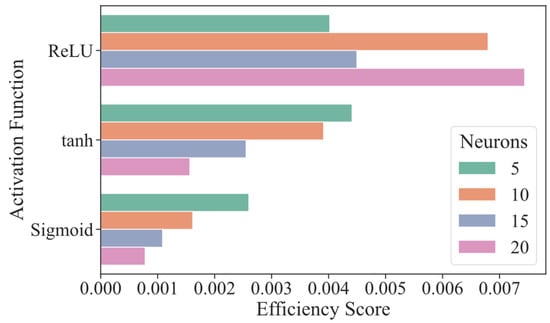
Figure 16.
Efficiency score for different ANN architectures.
To support a comprehensive evaluation of model performance from both predictive and computational perspectives, an efficiency score was defined as the inverse product of the mean absolute error (MAE), training time, and total number of trainable parameters. This metric is expressed as follows:
where T represents the training time in seconds, and P denotes the number of parameters. The efficiency score penalizes models that are either less accurate, slower to train, or computationally more complex. As such, it provides a single-valued criterion that integrates accuracy and resource consumption, aligning with the principles of sustainable computing and enabling a fair comparison across different neural network architectures.
In light of these results, the architecture employing ReLU activation with 10 neurons represents the most effective compromise between predictive performance and computational resource usage. Its selection is therefore justified not only by its superior accuracy but also by its stability across multiple evaluation metrics, aligning with sustainability principles in computational design and energy efficiency.
The evaluation of artificial neural network (ANN) performance was based on a systematic variation of two key architectural parameters: the number of neurons in the hidden layer (5, 10, 15, and 20) and the activation function (ReLU, Sigmoid, and tanh). Each configuration was assessed in terms of its mean absolute error (MAE), coefficient of determination (R2), training time (in seconds), and total number of trainable parameters. Table 6 summarizes the numerical results obtained from these experiments. Notably, the architecture with ReLU activation and 10 neurons yielded the lowest MAE (0.0349) with a high R2 (0.9766), while also maintaining a reasonable training time (82.72 s). These values formed the basis for the visual analyses presented in Figure 14, Figure 15 and Figure 16, enabling a comparative study of model accuracy, computational efficiency, and architectural complexity.

Table 6.
Performance summary and computational metrics for different ANN configurations.
4. Discussion
The development of energy storage systems requires the integration of advanced techniques for state and parameter estimations to ensure reliability, scalability, and security in their implementation. A key factor in achieving these objectives is the availability of robust experimental data encompassing multiple variables, enabling the identification of new correlations or the extraction of relevant insights from complex datasets. In this context, rigorous research on energy storage devices, such as lithium-ion batteries, must rely not only on the existing scientific literature but also on the extensive collection and thorough analysis of available databases. The traceability, quality, and applicability of these datasets are fundamental for their validation in the scientific domain, thereby facilitating the development of more accurate models and optimizing strategies for managing these systems.
One of the most significant aspects of this study lies in the meticulous collection and analysis of information related to lithium-ion cells and batteries. Throughout this process, various datasets were reviewed, recorded, and classified based on their utility and relevance to the study’s objectives. While certain datasets have gained prominence due to their origin or institutional affiliation, the selection of experimental data should consider not only their availability but also their alignment with the original purpose for which they were collected. In this regard, although it is common to find records of electrical and physical variables, such as voltage, current, temperature, or capacity, this study identified additional aspects that provide valuable insights into a more comprehensive understanding of cell behavior across different contexts and applications.
In real-world energy storage systems, data acquisition may be subject to uncertainty and incompleteness due to sensor failures or limitations in measurement infrastructures. Although in this study, cells with missing critical variables, such as temperature, were excluded to preserve dataset consistency, future research will address this limitation by incorporating strategies for handling incomplete data. In particular, data-driven modeling approaches combined with state estimation techniques will be explored to manage missing values and improve model robustness under real-world operating conditions.
Lithium-ion batteries were commercially introduced in the 1990s following the development of essential materials and prototypes by John B. Goodenough, M. Stanley Whittingham, and Akira Yoshino, a contribution that earned them the 2019 Nobel Prize in Chemistry. However, the first open-access experimental datasets on battery performance only became available in 2008 through an initiative led by the Prognostics Center of Excellence (PCoE) at NASA’s Ames Research Center. Since then, multiple institutions and laboratories have published numerous experimental databases. Between 2008 and 2022, a total of 23 databases and 33 derived variations have been documented, primarily distinguished by differences in cell chemistry or by studies conducted within the same research group. This growing availability of data has significantly advanced the modeling and management of the performance of lithium-ion batteries, facilitating their integration into various technological applications.
The identification and selection of a reliable dataset served as the foundation for the data-driven modeling approach proposed in this study, aimed at estimating the capacity of 18650 lithium-ion cells. To this end, key experimental variables, such as voltage, current, and capacity, were considered, obtained from CCCV charge and discharge profiles under different current rates. A neural network-based modeling approach was chosen due to its robustness and versatility in capturing the nonlinear behavior inherent in the charge and discharge processes of these cells.
The modeling process involved multiple iterations to achieve a more compact and efficient structure. Initially, a model with a single hidden layer of 10 neurons and a ReLU activation function was evaluated. This simple architecture offers significant computational advantages, including faster training times, a lower number of parameters, and the reduced risk of overfitting. However, its limited capacity may hinder the representation of complex patterns, increasing the likelihood of underfitting. In contrast, the final reported model enhances its representational capacity by increasing the number of neurons to 50, enabling the capture of more intricate relationships within the data and potentially improving predictive performance. Nonetheless, this increased complexity leads to a higher number of model parameters, which may moderately elevate computational costs and the risk of overfitting.
The main contributions of this study can be summarized as follows:
- Review and identification of data sources: a comprehensive analysis was conducted on various databases developed by research groups and centers, which serve as essential inputs for the construction of data-driven models applied to lithium-ion cells and batteries.
- Analysis of nonlinear relationships: This study explored the nonlinear interdependencies among electrical and physical variables involved in the charge and discharge cycles of lithium-ion cells. This analysis enhances our understanding of the underlying phenomena that influence battery performance and degradation.
- An Evaluation of the impact of scaling methods: The effects of different normalization and scaling techniques were assessed to determine their influence on improving the performance of data-driven models, with a particular focus on their impact on neural networks and predictive accuracy. The scaling methods used reflect both general preprocessing needs and signal-specific behaviors in lithium-ion systems. In practical applications, these techniques can also be implemented in embedded or real-time systems, enhancing model performance and computational efficiency by ensuring consistent variable treatments during parameter estimations and system modeling.
- Optimization of neural network convergence: Strategies were implemented to accelerate the convergence of neural network algorithms, with a notable emphasis on the use of the early stopping method. This approach contributes to the development of more efficient, faster models with improved generalization capabilities.
While this study focused on neural networks, future research should explore alternative architectures or hybrid approaches to improve prediction accuracy. Combining data-driven models with other techniques could enhance performance, though this may involve higher computational costs that must be evaluated for practical implementation in lithium-ion battery systems. Additionally, although the proposed methodology showed strong performance using NMC- and LCO-based lithium-ion cells, its generalization to other chemistries, such as LFP, LTO, or solid-state batteries, requires further investigation. These technologies exhibit different electrochemical behaviors and aging patterns, which may affect model applicability. Furthermore, since the dataset used in this work was obtained under controlled laboratory conditions, its representativeness for real-world applications may be limited. Future studies should consider evaluating the model under diverse chemistries and usage scenarios to assess its robustness and adaptability across a broader range of battery technologies.
Different authors have reported the implementation of various neural network architectures for battery capacity estimations, motivating a comparative analysis between their results and those obtained in this study. Wang et al. [13] combined exponential models with LSTM and Gaussian Process Regression, achieving RMSE and MAE values of 7.81% and 7.17%, respectively. El Fallah et al. [14] compared DNN, GRU, and LSTM models for SoC estimations, reporting a maximum error below 2.5%, with DNN outperforming the rest. Tang et al. [15] used a deep encoder–decoder with transfer learning on short-term relaxation voltages, reaching RMSEs below 0.03 Ah. Similarly, Wang et al. [16] fused Bi-LSTM with incremental capacity curves and BP networks, achieving a maximum relative error of 1.67% and an RMSE of 0.43%. Shen et al. [17] proposed a DCNN with transfer and ensemble learning, attaining an RMSE of 1.503%. Jiao et al. [18] introduced a CNN-LSTM-ATT model under short-time working conditions, using K-means and PCA to segment voltage ranges, with estimation errors under 3%. Most recently, Wang et al. [19] optimized a BiLSTM network using an adaptive Gold Rush Optimizer, achieving the best performance with an RMSE of 0.011, an MAE of 0.0084, and an MAPE of 0.55%. These findings highlight that although the reported models—such as those based on hybrid architectures and metaheuristic optimization—are of higher complexity, their results do not differ significantly from those presented in this work. This supports the growing relevance of neural network-based modeling as a topic of interest and reinforces the soundness of the methodology employed in our study.
5. Conclusions
The degradation modeling of lithium-ion cells depends on the specific processes under study, but the availability and quality of experimental data are critical factors. This study conducted a thorough selection and analysis of experimental data from 18650 lithium-ion cells, enabling the development of a neural network model to predict capacity behavior. The nonlinear relationships among key variables—voltage, current, temperature, and cycle number—necessitated the use of machine learning techniques over traditional methods.
The analysis revealed weak linear correlations between variables, justifying the adoption of neural networks for accurate capacity estimation. Multiple model configurations were explored, with an emphasis on optimization strategies such as data normalization and early stopping. The evaluation of different scaling methods showed that MinMaxScaler provided the lowest error values, significantly improving model performance. Additionally, early stopping reduced computational costs while preventing overfitting, contributing to a 3.35% improvement in training accuracy and 3.48% in validation accuracy.
Overall, this research underscores the importance of robust dataset selection, advanced data preprocessing, and optimization techniques in predictive modeling for energy storage systems. The findings contribute to enhancing lithium-ion battery management by providing a scalable and efficient approach to capacity estimations across charge and discharge cycles.
Future studies could expand this research by integrating additional variables, such as internal resistance, impedance spectroscopy data, or environmental factors, to refine capacity predictions. Exploring alternative machine learning models, such as recurrent neural networks or transformer-based architectures, may further improve predictive accuracy. Additionally, the implementation of transfer learning techniques could enable model adaptation across different battery chemistries and operational conditions. Another promising direction involves real-time deployment of the trained models in battery management systems to enhance state-of-health monitoring and predictive maintenance. Finally, expanding the dataset with large-scale experimental data from different battery manufacturers and usage scenarios could improve the model’s generalizability and robustness.
Supplementary Materials
The following supporting information can be downloaded at: https://gitlab.com/magma-ingenieria/data-driven-cap-modeling-18650-lithium-ion-cells-from-experimental-electrical-measurements (accessed on 28 April 2025), Table S1: bat_data_collection.xlsx.
Author Contributions
Conceptualization, V.O.-O. and C.R.-A.; formal analysis, V.O.-O.; funding acquisition, I.O.P.; investigation, I.O.P. and C.R.-A.; methodology, V.O.-O., I.O.P. and C.R.-A.; software, V.O.-O.; supervision, I.O.P. and C.R.-A.; validation, V.O.-O. and I.O.P.; visualization, V.O.-O.; writing—original draft, V.O.-O.; writing—review and editing, C.R.-A. All authors have read and agreed to the published version of the manuscript.
Funding
This research was funded by Vicerrectoría de Investigación of the Universidad del Magdalena. The APC was funded by Universidad del Norte.
Institutional Review Board Statement
Not applicable.
Informed Consent Statement
Not applicable.
Data Availability Statement
The data presented in this study are available in Mendeley Data at https://doi.org/10.17632/kw34hhw7xg.3. These data were derived from the following resources available in the public domain: https://data.mendeley.com/datasets/kw34hhw7xg/3 (accessed on 28 April 2025).
Conflicts of Interest
The authors declare no conflicts of interest.
Abbreviations
The following abbreviations are used in this manuscript:
| API | Application programming interface |
| BIT | Beijing Institute of Technology |
| CALCE | Center for Advanced Life Cycle Engineering |
| CCCV | Constant current–constant voltage |
| DoD | Depth of discharge |
| EIS | Electrochemical impedance spectroscopy |
| IPCC | The Intergovernmental Panel on Climate Change |
| IQR | Interquartile range |
| Li-ion | Lithium-ion cell |
| MAE | Mean absolute error |
| MIT | Massachusetts Institute of Technology |
| MSE | Mean squared error |
| NASA | National Aeronautics and Space Administration |
| OECD | Organisation For Economic Co-operation and Development |
| ReLU | Rectified linear activation function |
| RUL | Remaining useful life |
| SDGs | United Nations Under the Sustainable Development Goals |
| SoC | State of charge |
| SOH | State of health |
| TRI | Toyota Research Institute |
References
- Glanemann, N.; Willner, S.N.; Levermann, A. Paris Climate Agreement Passes the Cost-Benefit Test. Nat. Commun. 2020, 11, 110. [Google Scholar] [CrossRef] [PubMed]
- Sorooshian, S. The Sustainable Development Goals of the United Nations: A Comparative Midterm Research Review. J. Clean. Prod. 2024, 453, 142272. [Google Scholar] [CrossRef]
- Calvin, K.; Dasgupta, D.; Krinner, G.; Mukherji, A.; Thorne, P.W.; Trisos, C.; Romero, J.; Aldunce, P.; Barrett, K.; Blanco, G.; et al. IPCC, 2023: Climate Change 2023: Synthesis Report. Contribution of Working Groups I, II and III to the Sixth Assessment Report of the Intergovernmental Panel on Climate Change; Core Writing Team, Lee, H., Romero, J., Eds.; IPCC: Geneva, Switzerland, 2023. [Google Scholar]
- Hesse, H.; Schimpe, M.; Kucevic, D.; Jossen, A. Lithium-Ion Battery Storage for the Grid—A Review of Stationary Battery Storage System Design Tailored for Applications in Modern Power Grids. Energies 2017, 10, 2107. [Google Scholar] [CrossRef]
- Zubi, G.; Dufo-López, R.; Carvalho, M.; Pasaoglu, G. The Lithium-Ion Battery: State of the Art and Future Perspectives. Renew. Sustain. Energy Rev. 2018, 89, 292–308. [Google Scholar] [CrossRef]
- IRENA and IEA-PVPS. End-of-Life Management: Solar Photovoltaic Panels; International Renewable Energy Agency and International Energy Agency Photovoltaic Power Systems: Redfer, Australia, 2016; Available online: https://iea-pvps.org/wp-content/uploads/2020/01/IRENA_IEAPVPS_End-of-Life_Solar_PV_Panels_2016.pdf (accessed on 11 May 2025).
- Diouf, B.; Pode, R. Potential of Lithium-Ion Batteries in Renewable Energy. Renew. Energy 2015, 76, 375–380. [Google Scholar] [CrossRef]
- Hu, X.; Xu, L.; Lin, X.; Pecht, M. Battery Lifetime Prognostics. Joule 2020, 4, 310–346. [Google Scholar] [CrossRef]
- dos Reis, G.; Strange, C.; Yadav, M.; Li, S. Lithium-Ion Battery Data and Where to Find It. Energy AI 2021, 5, 100081. [Google Scholar] [CrossRef]
- Barcellona, S.; Piegari, L. Effect of Current on Cycle Aging of Lithium Ion Batteries. J. Energy Storage 2020, 29, 101310. [Google Scholar] [CrossRef]
- Dufo-López, R.; Cortés-Arcos, T.; Artal-Sevil, J.S.; Bernal-Agustín, J.L. Comparison of Lead-Acid and Li-Ion Batteries Lifetime Prediction Models in Stand-Alone Photovoltaic Systems. Appl. Sci. 2021, 11, 1099. [Google Scholar] [CrossRef]
- Deng, J.; Bae, C.; Denlinger, A.; Miller, T. Electric Vehicles Batteries: Requirements and Challenges. Joule 2020, 4, 511–515. [Google Scholar] [CrossRef]
- Wang, J.; Deng, Z.; Peng, K.; Deng, X.; Xu, L.; Guan, G.; Abudula, A. Early Prognostics of Lithium-Ion Battery Pack Health. Sustainability 2022, 14, 2313. [Google Scholar] [CrossRef]
- El Fallah, S.; Kharbach, J.; Vanagas, J.; Vilkelytė, Ž.; Tolvaišienė, S.; Gudžius, S.; Kalvaitis, A.; Lehmam, O.; Masrour, R.; Hammouch, Z.; et al. Advanced State of Charge Estimation Using Deep Neural Network, Gated Recurrent Unit, and Long Short-Term Memory Models for Lithium-Ion Batteries Under Aging and Temperature Conditions. Appl. Sci. 2024, 14, 6648. [Google Scholar] [CrossRef]
- Tang, A.; Xu, Y.; Liu, P.; Tian, J.; Wu, Z.; Hu, Y.; Yu, Q. Deep Learning Driven Battery Voltage-Capacity Curve Prediction Utilizing Short-Term Relaxation Voltage. eTransportation 2024, 22, 100378. [Google Scholar] [CrossRef]
- Wang, F.; Tang, S.; Han, X.; Yu, C.; Sun, X.; Lu, L.; Ouyang, M. Capacity Prediction of Lithium-Ion Batteries with Fusing Aging Information. Energy 2024, 293, 130743. [Google Scholar] [CrossRef]
- Shen, S.; Sadoughi, M.; Li, M.; Wang, Z.; Hu, C. Deep Convolutional Neural Networks with Ensemble Learning and Transfer Learning for Capacity Estimation of Lithium-Ion Batteries. Appl. Energy 2020, 260, 114296. [Google Scholar] [CrossRef]
- Jiao, Z.; Ma, J.; Zhao, X.; Zhang, K.; Han, Q.; Zhang, Z. Capacity Estimation for Lithium-Ion Batteries with Short-Time Working Condition in Specific Voltage Ranges. J. Energy Storage 2024, 75, 109603. [Google Scholar] [CrossRef]
- Wang, X.T.; Wang, J.S.; Zhang, S.B.; Liu, X.; Sun, Y.C.; Shang-Guan, Y.P. Capacity Prediction Model for Lithium-Ion Batteries Based on Bi-Directional LSTM Neural Network Optimized by Adaptive Convergence Factor Gold Rush Optimizer. Evol. Intell. 2025, 18, 35. [Google Scholar] [CrossRef]
- Pilat, D.; Fukasaku, Y. OECD Principles and Guidelines for Access to Research Data from Public Funding. Data Sci. J. 2007, 6, OD4–OD11. [Google Scholar] [CrossRef]
- Guellec, D.; Paunov, C. Innovation Policies in the Digital Age; OECD: Paris, France, 2018. [Google Scholar] [CrossRef]
- Hasib, S.A.; Islam, S.; Chakrabortty, R.K.; Ryan, M.J.; Saha, D.K.; Ahamed, M.H.; Moyeen, S.I.; Das, S.K.; Ali, M.F.; Islam, M.R.; et al. A Comprehensive Review of Available Battery Datasets, RUL Prediction Approaches, and Advanced Battery Management. IEEE Access 2021, 9, 86166–86193. [Google Scholar] [CrossRef]
- Zhu, J.; Wang, Y.; Huang, Y.; Bhushan Gopalun, R.; Cao, Y.; Heere, M.; Mühlbauer, M.J.; Mereacre, L.; Dai, H.; Liu, X.; et al. Data-Driven Capacity Estimation of Commercial Lithium-Ion Batteries from Voltage Relaxation. Nat. Commun. 2022, 13, 2261. [Google Scholar] [CrossRef]
- NASA. Li-Ion Battery Aging Datasets. Available online: https://data.nasa.gov/dataset/li-ion-battery-aging-datasets (accessed on 11 May 2025).
- Kwon, K. Li-Ion Battery Cycle Performance Data Including Temperature. Available online: https://data.mendeley.com/datasets/2wvf2xnhdd/1 (accessed on 6 March 2025).
- Chen, Y.; NASA. Lithium Ion Battery Dataset. Available online: https://ieee-dataport.org/documents/nasa-lithium-ion-battery-dataset (accessed on 6 March 2025).
- Christopher Teubert Randomized Battery Usage 1: Random Walk. Available online: https://data.nasa.gov/dataset/randomized-battery-usage-1-random-walk (accessed on 11 May 2025).
- CALCE Center for Advanced Life Cycle Engineering Battery Data. Available online: https://calce.umd.edu/battery-data (accessed on 6 March 2025).
- Birkl, C.R. Oxford Battery Degradation Dataset 1; University of Oxford: Oxford, UK, 2017. [Google Scholar]
- Heenan, T.; Jnawali, A.; Kok, M. Lithium-Ion Battery INR18650 MJ1 Data. Available online: https://rdr.ucl.ac.uk/articles/dataset/Lithium-ion_Battery_INR18650_MJ1_Data_400_Electrochemical_Cycles_EIL-015_/12159462?file=23140433 (accessed on 10 March 2025).
- Severson, K.A.; Attia, P.M.; Jin, N.; Perkins, N.; Jiang, B.; Yang, Z.; Chen, M.H.; Aykol, M.; Herring, P.K.; Fraggedakis, D.; et al. Data-Driven Prediction of Battery Cycle Life Before Capacity Degradation. 2019. Available online: https://www.tri.global/research/data-driven-prediction-battery-cycle-life-capacity-degradation (accessed on 6 March 2025).
- Chen, G.-J.; Chung, W.-H. Evaluation of Charging Methods for Lithium-Ion Batteries. Electronics 2023, 12, 4095. [Google Scholar] [CrossRef]
- Lu, J.; Xiong, R.; Tian, J.; Wang, C. Battery Degradation Dataset (Fixed Current Profiles & Arbitrary Uses Profiles). Available online: https://data.mendeley.com/datasets/kw34hhw7xg/3 (accessed on 10 March 2025).
- Lu, J.; Xiong, R.; Tian, J.; Wang, C.; Hsu, C.-W.; Tsou, N.-T.; Sun, F.; Li, J. Battery Degradation Prediction against Uncertain Future Conditions with Recurrent Neural Network Enabled Deep Learning. Energy Storage Mater. 2022, 50, 139–151. [Google Scholar] [CrossRef]
- Tian, J.; Xiong, R.; Shen, W.; Lu, J.; Yang, X.-G. Deep Neural Network Battery Charging Curve Prediction Using 30 Points Collected in 10 Min. Joule 2021, 5, 1521–1534. [Google Scholar] [CrossRef]
- Meng, J.; Luo, G.; Ricco, M.; Swierczynski, M.; Stroe, D.-I.; Teodorescu, R. Overview of Lithium-Ion Battery Modeling Methods for State-of-Charge Estimation in Electrical Vehicles. Appl. Sci. 2018, 8, 659. [Google Scholar] [CrossRef]
Disclaimer/Publisher’s Note: The statements, opinions and data contained in all publications are solely those of the individual author(s) and contributor(s) and not of MDPI and/or the editor(s). MDPI and/or the editor(s) disclaim responsibility for any injury to people or property resulting from any ideas, methods, instructions or products referred to in the content. |
© 2025 by the authors. Licensee MDPI, Basel, Switzerland. This article is an open access article distributed under the terms and conditions of the Creative Commons Attribution (CC BY) license (https://creativecommons.org/licenses/by/4.0/).