Abstract
Ecological networks (ENs) offer a proactive, spatially explicit strategy for safeguarding the integrity, functionality, and sustainability of ecological spaces. With land and financial resources increasingly constrained, conventional approaches to expanding ecological spaces are often infeasible. ENs have emerged as a robust solution to address challenges effectively. This study combined bibliometric analysis with a traditional literature review to examine keyword co-occurrence in EN-related publications from the Web of Science Core Collection (1991–2024). The results showed a significant increase in publication volume and identified three main research themes: (i) theoretical foundations of ENs, focusing on conceptual frameworks and principles; (ii) construction methodologies of ENs, emphasizing the design and optimization through tools such as graph theory, circuit theory, the Minimum Cumulative Resistance model, and the Patch-generating Land Use Simulation model; and (iii) EN and ecosystem services, highlighting contributions to green infrastructure and forest management. The evolution of research frontiers unfolds across three distinct stages: establishing theoretical foundations (1991–2009), advancing methodologies (2010–2021), and integrating interdisciplinary approaches (2022–2024). Four future priorities guiding EN studies include advancing ecosystem service quantification and integration, enhancing climate change adaptation and resilience, strengthening socioeconomic integration for sustainable development, and leveraging interdisciplinary collaboration and technological innovation.
1. Introduction
Global urbanization is accelerating at an unprecedented rate, transforming landscapes by converting ecological spaces (e.g., woodlands, grasslands, and wetlands) into built environments. This process fragments and isolates ecological spaces, disrupting landscape connectivity and impairing ecosystem service delivery [1,2,3]. These changes precipitate regional ecological security challenges, including habitat degradation, biodiversity loss, and the diminishing of ecosystem resilience. Given the constraints of limited land and financial resources, expanding ecological spaces to mitigate these threats is often infeasible. Consequently, a critical question emerges: how can spatial configurations be optimized to enhance ecological security within constrained ecological spaces? This challenge has elevated the optimization of landscape patterns as a central focus in landscape ecology [4].
In this context, the ecological network (EN) emerged in the 1980s as a spatially explicit strategy for proactively safeguarding the integrity, functionality, and sustainability of ecological spaces. ENs systematically identify and optimize critical landscape components (e.g., ecological sources, corridors, and nodes) to establish an interconnected, multi-tiered network that sustains essential ecological processes and functions. This approach has facilitated targeted conservation and restoration, particularly in resource-limited settings [5,6]. Complementing ENs, ecological security patterns (ESPs) provide a macro-scale framework that integrates ecological processes with regional security objectives [7]. Both approaches share theoretical roots in landscape connectivity and exhibit methodological convergence in spatial construction strategies [8,9]. To reflect their conceptual and methodological alignment, this study integrates EN and ESP research into a unified analytical framework (collectively referred to as EN research).
Recent reviews have synthesized progress in EN construction, optimization, and application, aiding researchers in tracking advancements and addressing key challenges [6,10,11,12,13,14]. However, the rapid proliferation of EN studies has led to knowledge fragmentation, heterogeneity, and complexity. Traditional narrative reviews struggle to address these issues due to (i) time-intensive and inefficient analysis that is unable to keep pace with rapidly evolving knowledge, (ii) a limited scope that hinders a comprehensive understanding of the field’s intellectual landscape, and (iii) subjective qualitative interpretations that lack objective insights into knowledge structures and trends. A more systematic, objective, and scalable approach is needed to map the knowledge landscape and developmental trajectories of EN research.
Bibliometric analysis, leveraging large-scale datasets, advanced analytical techniques, and visualization tools, offers a robust alternative to traditional reviews [15,16]. By analyzing hundreds or thousands of publications, bibliometrics elucidates intellectual structure, tracks developmental pathways, and forecasts future research directions [17,18]. While bibliometric analysis has been applied to EN research [19,20,21], it often exhibits limitations, including narrow literature retrieval strategies that focus solely on ENs or ESPs [20,22], or a certain method such as graph theory [11], and overemphasis on descriptive metrics such as author output, journal distributions, and keyword frequencies at the expense of temporal dynamics and paradigm shifts. These shortcomings obscure the field’s evolution and constrain anticipatory insights.
To address these gaps, this study involved a combination of bibliometric analysis and a traditional literature review to examine the development of EN research from 1900 to 2024. We adopted an inclusive retrieval strategy encompassing both EN and ESP literature to provide a holistic perspective. We pursued three objectives: (i) mapping the global intellectual landscape of EN research, (ii) identifying emerging research hotspots and their developmental trajectories, and (iii) uncovering trends and future priorities. By achieving these aims, we sought to provide a robust foundation for advancing the science and practice of EN planning and design.
This paper is structured as follows: Section 2 concisely reviews the historical evolution of EN research. Section 3 describes the data sources and methods employed in this study. Section 4 presents a multidimensional overview of EN research, including publication output, disciplinary distribution, journal characteristics, and country/institution/author contributions. Using keyword co-occurrence analysis, cluster analysis, timeline analysis, and burst detection, it further explores research themes, frontiers, and evolution. Section 5 synthesizes these findings to propose future research directions and discusses the study’s limitations, offering insights for subsequent investigations.
2. Mini-Review of EN Research
In landscape ecology, an EN is defined as a spatially interconnected system of habitat patches (nodes) and ecological corridors (edges) that integrates fragmented ecological components into a cohesive framework. The primary function of an EN is to maintain landscape connectivity, ensure the continuity of ecosystem services, and enhance ecological integrity [7].
The EN concept originated in European landscape planning during the 1980s, initially applied to open space and territorial planning to mitigate habitat fragmentation and biodiversity loss [23,24,25]. Since the 1990s, EN research has expanded to encompass biodiversity conservation, ecosystem service maintenance, and ecological restoration. In 1995, the ESP theory, introduced by Kongjian Yu, enriched the EN concept by emphasizing the identification of critical ecological sources, corridors, and nodes to construct a multi-level, spatially continuous network [26]. While ENs focus on connectivity among organisms and ecological processes, ESPs adopt a macro-scale perspective to build comprehensive ecological security frameworks [5,6]. These complementary approaches share a theoretical foundation in landscape connectivity and provide integrated solutions for regional ecological security, from element identification to spatial implementation [8].
EN research has progressed significantly across spatial, thematic, and methodological dimensions [3,5,8,27,28,29,30,31,32,33,34,35,36,37,38,39]. Spatially, studies span urbanized regions, agro-pastoral transitional zones, arid/semi-arid regions, and protected areas. Thematically, research has shifted from single-objective conservation to multi-objective frameworks that balance ecological functions with socioeconomic benefits. Methodologically, approaches have evolved from static assessments to dynamic simulations and multi-scenario analyses, supported by diverse analytical tools.
EN construction typically follows a standardized workflow: (i) ecological source identification, targeting habitat patches with high ecological functionality; (ii) resistance surface modeling, quantifying impediments to species dispersal and ecological flows; (iii) corridor extraction, ensuring connectivity for energy, material, and information flows; and (iv) node optimization, enhancing the functionality of key network locations [36,40,41]. Key methods include landscape connectivity analysis, morphological spatial pattern analysis (MSPA), Minimum Cumulative Resistance (MCR) models, gravity models, and circuit theory, which facilitate the spatial design and optimization of ENs [24,39,42]. Recent advancements incorporate machine learning algorithms, improving the precision and efficiency of EN planning [40,43,44,45].
3. Data and Methods
3.1. Data Collection
This study utilized the Web of Science Core Collection (WOSCC) as its data source. The WOSCC is a premier citation index database that is widely used in bibliometric analyses due to its comprehensive yet selective coverage, underpinned by standardized and robust metadata [15,16,46]. It prioritizes high-impact, rigorously peer-reviewed scholarly outputs, curating a selective collection of globally influential publications. Another frequently used database, Scopus, which offers broader coverage of sources, may include less rigorously peer-reviewed or lower-impact publications, potentially introducing analytical noise. Consequently, the WOSCC’s rigorous indexing criteria largely ensure greater reliability, consistency, and precision of bibliometric studies.
The reliability of bibliometric findings depends on the quality and relevance of the retrieved data, necessitating a rigorous and systematic retrieval strategy to ensure representativeness. A topic search was conducted in the WOSCC using the following query: TS = (((landscape OR urban OR regional) AND (“ecological network*” OR “habitat network*”)) OR (“ecological security pattern*” OR “landscape security pattern*”) OR (“ecological source*” AND corridor*)). This query was designed to capture two complementary dimensions: conceptual frameworks of EN and ESP and their structural components (e.g., ecological sources and corridors). The search covered publications from 1900 to 2024, with data retrieved on 24 September 2024. Publication types were restricted to peer-reviewed articles and reviews, and the language was limited to English based on three considerations: peer-reviewed articles ensure high scientific rigor and credibility; reviews synthesize current knowledge and emerging trends; and English, as the dominant language of global scholarship, could ensure global representativeness and comparability. Records were exported in “Full Record and Cited References” format and saved as plain text files. All downloads were completed within a single day to avoid inconsistencies from database updates.
To ensure data quality, raw records were processed to address potential issues such as duplicates, early-access publications, or irrelevant studies. Duplicate entries and early-access records were removed, followed by the manual screening of titles, abstracts, and keywords to exclude studies unrelated to EN or ESP themes. This process yielded 1806 relevant records, with the earliest publication from 1991. The absence of earlier records, despite the EN concept emerging in the 1980s, reflects limitations in the WOSCC’s metadata coverage before 1990, particularly the incomplete collection of abstracts, author keywords, and other metadata [47]. This data constraint is often referred to as the “1991 watershed phenomenon” in bibliometric studies.
3.2. Methods
This study employed HistCite Pro 2.1and CiteSpace 6.3R3 as complementary tools for the bibliometric analysis. HistCite, a citation historiography tool [48], enables the descriptive statistical analysis of bibliometric indicators (e.g., authors, institutions, countries, journals, keywords, references, and citation frequencies) and the visualization of direct citation networks. CiteSpace, grounded in bibliometric theory and information visualization [49], supports multivariate, time-segmented, and dynamic analyses, generating knowledge maps that reveal the structure, thematic distribution, and evolution of scientific fields.
Using HistCite, we analyzed temporal trends in annual publication output to evaluate the growth trajectory of EN research. We also examined the research productivity across countries, institutions, authors, disciplines, and journals to identify geographic, institutional, and thematic patterns. While descriptive analyses provide a foundational overview, they are limited in capturing the intellectual dynamics and emerging priorities of the field. To address this, CiteSpace 6.3.R3 was employed to construct a keyword co-occurrence network, identifying high-frequency terms and their interconnections. A clustering analysis of this network delineated major research themes and their relationships, offering insights into the conceptual landscape of EN research. Additionally, burst detection analysis traced the temporal evolution of research hotspots, highlighting shifts in focus and emerging frontiers from 1991 to 2024.
While bibliometric analysis offers a macro-level perspective on research themes, trends, and paradigm shifts, it risks oversimplification without contextual validation. To enhance the robustness of the quantitative findings, we conducted a qualitative review of primary literature associated with high-frequency keywords, clustered themes, and burst terms. By combining statistical rigor with qualitative depth, this hybrid methodology mitigates the limitations of purely quantitative or narrative approaches, providing a comprehensive and reliable analysis of EN research.
4. Results
4.1. Analysis of Publication Output
The volume of publications in a research field reflects its scholarly attention and developmental trajectory [50,51]. Figure 1 illustrates the temporal dynamics in annual publications of EN research from 1991 to 2024, showing a pattern of accelerating growth from one article in 1991 to 292 articles in 2024 (estimated using Price’s exponential growth curve because the data for 2024 are only available up to September). According to the publication growth theory in bibliometrics [18] and observed publication patterns, the development of EN research can be divided into three distinct stages.
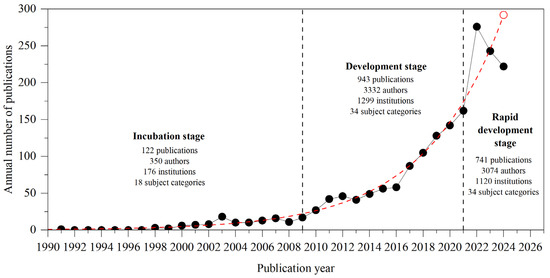
Figure 1.
Temporal dynamics in annual publications of ecological network research (1991–2024). As data for 2024 are only available up to September, the publication volume for 2024 is estimated at 292 publications (red circle) using Price’s exponential growth curve (dashed curve).
- Incubation stage (1991–2009). This period was characterized by limited output, with 122 articles published. Contributions involved 350 authors from 176 institutions across 18 WOSCC subject categories. This stage reflects an emerging field focused on establishing foundational concepts and methodologies.
- Development stage (2010–2021). This period witnessed a significant increase in activity, with 943 articles published—approximately 7.7 times the output of the incubation stage. The number of contributing authors grew to 3332, affiliated with 1299 institutions, and disciplinary coverage expanded to 34 subject categories. This surge indicates rapid growth, diversification, and increasing interdisciplinary engagement.
- Rapid development stage (2022–2024). By September 2024, 741 publications had been recorded in this period, involving 3074 authors and 1120 institutions. The number of subject categories stabilized at 34. The accelerated growth during this period can be attributed to (i) heightened global emphasis on ecological security and sustainable development, particularly within the framework of the United Nations Sustainable Development Goals, driving academic interest in EN and ESP applications, and (ii) expanded coverage and publication efficiency in the WOSCC, including the rise in open-access journals, which increased the visibility and volume of EN-related literature [52].
EN research demonstrates a multidisciplinary scope, spanning 34 subject categories (Table 1). The top 10 categories by total publications are Environmental Sciences (772), Ecology (692), Biodiversity Conservation (395), Environmental Studies (318), Green Sustainable Science Technology (169), Physical Geography (154), Multidisciplinary Geosciences (121), Environmental Engineering (111), Urban Studies (102), and Geography (86). This distribution reflects broad but uneven disciplinary engagement. Leading journals such as Ecological Indicators (190), Sustainability (126), and Landscape Ecology (91) serve as primary venues for disseminating EN research, underscoring their role in shaping the field’s discourse.

Table 1.
Top 10 subject categories, journals, countries, and institutions by total publications.
Geographically, contributions from 87 countries highlight the global reach of EN research, with China (902), the USA (244), and the UK (148) leading in publication output. This distribution likely reflects variations in research funding, institutional capacity, and publication incentives. China’s dominance may be attributed to significant investments in ecological research and restoration, an expanding researcher base, and policies incentivizing SCI-indexed publications, consistent with its broader rise in global scientific output [53,54]. In contrast, the USA and UK exhibit strong but comparatively lower output, potentially due to differences in funding structures or publication priorities [55].
Key institutions driving EN research include the Chinese Academy of Sciences (154), Beijing Normal University (144), and Peking University (39). Prolific authors such as Michael J. Samways (19; Stellenbosch University, South Africa), Qiang Yu (18; Beijing Forestry University, China), and Santiago Saura (15; Universidad Politécnica de Madrid, Spain) further contribute to the field’s productivity (Table 2). These institutional and individual contributions reflect concentrated expertise and research capacity in specific regions and disciplines.
Table 2.
Top 10 authors by total publications.
4.2. Analysis of Research Hotspots
In bibliometric research, hotspots are clusters of interrelated topics that attract sustained scholarly attention within a field over a specific period. Keywords, as concise summaries of a study’s core focus, capture critical aspects such as research subjects, theoretical perspectives, and methodologies [56,57]. Analyzing keyword co-occurrence patterns reveals the knowledge structure and thematic interconnections within a discipline, highlighting research hotspots and their evolutionary trends [58].
To identify hotspots in EN research, in this study, a keyword co-occurrence analysis was conducted using CiteSpace 6.3.R3. Synonymous keywords and grammatical variants (e.g., “Guangdong” vs. “Guangdong Province”, “ecological network” vs. “ecological networks”) were standardized to ensure consistency. The analysis parameters were set as follows: a time span of 1991–2024, a time slice of one year, and node type as keywords. A dynamic threshold strategy was applied for data filtering, with parameter sets of (2, 2, 20), (4, 3, 20), and (4, 3, 20), determined through iterative testing to balance coverage and prevent data overload. The Pathfinder algorithm was used to prune redundant connections, yielding a co-occurrence network of 195 keyword nodes and 236 links, with a density of 0.0125 (Figure 2).
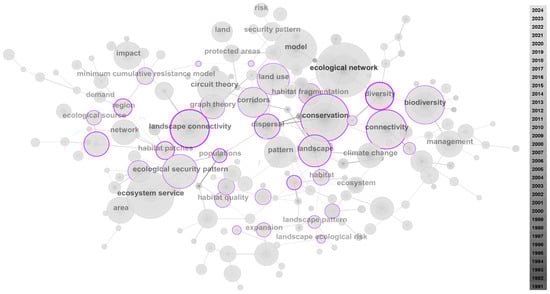
Figure 2.
Keyword co-occurrence network of ecological network research (1991–2024). The network comprises 195 nodes and 236 links, with a density of 0.0125. Node size reflects keyword frequency, and purple-ringed nodes denote high betweenness centrality (≥0.1), indicating their role as thematic connectors.
In this network, nodes represent keywords, with node size proportional to occurrence frequency and link thickness indicating co-occurrence strength (Figure 2). High-frequency keywords signify prominent research hotspots, while keywords with high betweenness centrality (≥0.1, denoted by purple rings) act as critical connectors across thematic clusters, reflecting their influence on the field’s intellectual structure.
To mitigate bias from the retrieval strategy, which emphasized “ecological network” (510 occurrences) and “ecological security pattern” (185 occurrences), these terms were excluded from hotspot identification due to their inflated frequencies reflecting search design rather than organic prominence. The top 10 most frequent keywords were identified: conservation, ecosystem service, model, biodiversity, connectivity, landscape connectivity, circuit theory, pattern, landscape, and land use (Figure 2). These keywords were categorized into four research hotspots:
- Ecological protection and biodiversity conservation. Anchored by “conservation” (376 occurrences, betweenness centrality 0.26) and “biodiversity” (266, 0.17), this hotspot emerged around 2002 and remains central to EN research. Studies focus on EN’s role in supporting species migration corridors [59] and mitigating habitat fragmentation [25]. Its persistence underscores the ongoing challenge of sustaining biodiversity amid increasing landscape pressures.
- Ecosystem service assessment and spatial optimization. Defined by “ecosystem service” (notable frequency post-2013) and “land use”, this hotspot examines the impacts of land use change on regulating and provisioning services [5,8]. Research emphasizes spatial optimization to enhance service delivery but faces challenges in standardizing valuation methods and balancing trade-offs in human-modified landscapes.
- Landscape connectivity theory and modeling. Centered on “connectivity”, “landscape connectivity” (betweenness centrality 0.41), and “circuit theory”, this hotspot employs advanced tools such as circuit theory [8] and MSPA [60] to model ecological flow resistance and map corridors and nodes.
- Multi-scale landscape structure evolution. Focused on “landscape” and “pattern”, this hotspot investigates the interplay between multi-scale landscape configurations and ecological processes [61]. It provides a topological framework for optimizing ESPs, linking spatial patterns to ecological functionality.
These hotspots are interconnected through modeling techniques (“model”), forming a cohesive research framework: landscape pattern analysis, ecological process simulation, ecosystem service assessment, and conservation decision-making.
4.3. Analysis of Research Themes
Keyword co-occurrence analysis identifies research hotspots but is limited in capturing the complex interplay and mutual influences among studies within a field. Individual keywords, while highlighting focal topics, lack the depth required to reveal broader thematic structures. Keyword clustering analysis, built upon the co-occurrence network, addresses this by grouping related terms into cohesive clusters, providing a robust framework for identifying predominant research themes and their developmental trajectories [62].
Keyword clustering was performed using the log-likelihood ratio algorithm in CiteSpace 6.3.R3, generating a thematic map for EN research (1991–2024) (Figure 3). Clustering quality was assessed using modularity (Q) and silhouette (S) metrics [63]. A Q value > 0.3 indicates a significant clustering structure, while S > 0.5 suggests reasonable homogeneity in a cluster, and S > 0.7 denotes high reliability [64]. The analysis yielded a significant and reliable structure (Q = 0.78 and mean S = 0.93). A total of 12 clusters were identified, each representing a distinct research theme: Cluster #0 (Ecological Network Analysis), #1 (Ecological Network), #2 (Graph Theory), #3 (Landscape Pattern), #4 (Green Infrastructure), #5 (Forest Management), #6 (Circuit Theory), #7 (Minimum Cumulative Resistance), #8 (PLUS Model), #9 (Ecological Corridors), #10 (Urban Ecology), and #11 (Ecological Security Pattern). Clusters with smaller numerical labels contain more keywords. The characteristics of each cluster are presented in Table 3, including cluster size, S value, temporal duration, mean publication year, activeness, and research theme.
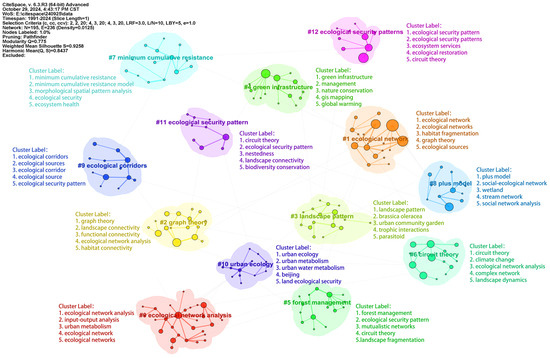
Figure 3.
Keyword clusters of ecological network research (1991–2024). These clusters were generated via the log-likelihood ratio algorithm, and their characteristics are detailed in Table 3.
Table 3.
Characteristics of keyword clusters in ecological network research (1991–2024).
The majority of the clusters exhibited high homogeneity (S > 0.9). However, Cluster #8 displayed a notably lower S value (S = 0.27), likely due to its interdisciplinary nature, which may reduce thematic cohesion by integrating diverse research perspectives. Temporally, Cluster #8 showed the longest persistence (25 years), followed by Clusters #5, #6, and #1 (22, 22, and 21 years, respectively). This prolonged activity underscores the enduring relevance of foundational themes, such as corridor design and landscape connectivity. There was ongoing research vitality across all clusters, evidenced by the presence of new publications between 2022 and 2024.
The keyword clustering timeline map (Figure 4), integrated with a literature review, clarified the thematic focus and scientific contributions of each cluster.
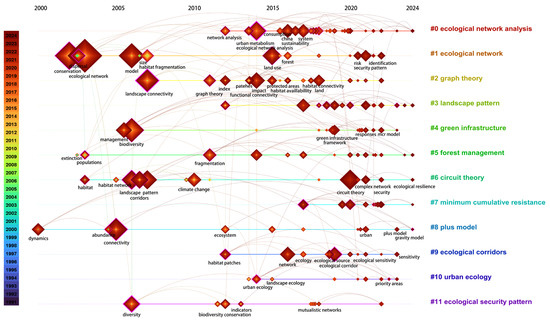
Figure 4.
Keyword clustering timeline map of ecological network research (1991–2024). Clusters with smaller numerical labels contain more keywords.
- Cluster #0: Ecological Network Analysis (2012–2024, 27 keywords). This theme focuses on landscape-scale spatial structures and ecological processes, utilizing graph theory and circuit theory to model node–corridor topologies and least-cost paths. It examines how landscape configurations influence species dispersal, gene flow, and ecological functions. Recent advancements include the MCR model and ecological node optimization strategies. For example, Yu et al. [65] refined the MCR model using energy flow principles to optimize ecological node layouts in Dengkou County, Inner Mongolia, increasing network connectivity robustness from 0.73 to 1.00. Similarly, Zhao et al. [66] applied the DPSIR (Drivers–Pressures–State–Impacts–Response) framework to evaluate ecological network resilience across 35 Chinese cities, revealing higher resilience in coastal cities compared to inland regions.
- Cluster #1: Ecological Network (2002–2022, 18 keywords). This cluster emphasizes the conceptual development, construction, and evaluation of EN, prioritizing biodiversity conservation and ecosystem service provision. It addresses challenges such as habitat fragmentation and ecological source identification. EN frameworks support regional conservation planning. For instance, Saura et al. [67,68] introduced the Probability of Connectivity (PC) index to quantify habitat connectivity in landscape planning. Kong et al. [24] optimized the greenspace network in Jinan City, China, using least-cost paths and gravity models. However, subjectivity in ecological source identification remains a challenge. Peng et al. [8] addressed this by integrating ecosystem service assessments to identify ecological sources in Yunnan Province.
- Cluster #2: Graph Theory (2007–2022, 16 keywords). This cluster employs graph theory to analyze landscape and functional connectivity, identifying critical nodes and corridors essential for an EN. Graph-based approaches represent the EN as nodes and edges, and enhance the understanding of EN dynamics. Saura et al. [60] advanced stepping-stone theory, demonstrating the critical role of small and medium-sized habitat patches in facilitating long-distance dispersal. Rayfield et al. [69] developed a network metric classification framework, distinguishing path-specific flux and path redundancy. However, graph theory’s oversight of nonlinear ecological processes and computational complexity may limit its adoption in management practices. Ayram et al. [70] advocated for the development of user-friendly software, for example, Guidos Toolbox (current version: 3.3, available at https://forest.jrc.ec.europa.eu/, accessed on 15 May 2025).
- Cluster #3: Landscape Pattern (2012–2024, 16 keywords). This theme investigates the formation, evolution, and ecological impacts of landscape patterns. Landscape pattern research quantifies spatial heterogeneity to reveal ecological process drivers. Cui et al. [40] applied the MSPA and least-cost distance methods to construct a greenspace ecological network in Tongzhou District, Beijing, reducing landscape fragmentation through optimized corridors. Kang et al. [71] identified better ESPs in the Jiaodong Peninsula using multi-scenario simulations. Shi et al. [72] employed structural equation modeling to analyze landscape heterogeneity in the Yellow River Basin’s agro-pastoral zone, identifying grazing and agriculture as primary drivers of spatial patterns.
- Cluster #4: Green Infrastructure (2006–2023, 15 keywords). Green infrastructure integrates natural and anthropogenic systems to enhance ecological services and human well-being. This cluster focuses on designing and managing green infrastructure to mitigate environmental stressors, such as climate change and urbanization. For example, Cunha et al. [30] constructed Portugal’s national EN through multi-level ecological assessments, covering 67% of the country’s area, but only 25% was protected, revealing significant conservation gaps. Wu et al. [73] developed a source–sink-theory-based green infrastructure framework for Wu’an County, a resource-based city, highlighting ecological corridors’ role in enhancing resilience.
- Cluster #5: Forest Management (2003–2024, 15 keywords). This theme targets sustainable forest ecosystem management, leveraging ESP and circuit theory to optimize spatial patterns. It navigates trade-offs between conservation and resource utilization. For example, Saura et al. [59] assessed European forest connectivity from 1990 to 2000 using the Equivalent Connected Area index. Emer et al. [74] studied seed dispersal networks in the Atlantic Forest, underscoring the critical role of small birds and plants in fragmented landscapes. Fu et al. [5] optimized ecological sources on the Loess Plateau via hotspot analysis, proposing a “two-axis, four-core, six-belt, eight-zone” framework that enhanced internal connectivity.
- Cluster #6: Circuit Theory (2003–2024, 14 keywords). Circuit theory simulates ecological flows by quantifying landscape resistance and currents. This cluster applies circuit theory to model EN structure and resilience against disturbances. For example, Wang et al. [75] validated the resilience of EN for Nanchang City through scenario simulations. An et al. [28] optimized an EN for tropical southwest China by incorporating stepping stones. Dai et al. [76] constructed an EN for the Poyang Lake urban agglomeration to mitigate industrial impacts.
- Cluster #7: Minimum Cumulative Resistance (2017–2024, 14 keywords). The MCR model identifies corridors and nodes by quantifying ecological resistance. This theme centers on the MCR model, usually integrated with MSPA, to assess ecosystem integrity in EN planning. For example, Nie et al. [77] constructed an EN in Anji County using MCR and network analysis. Xu et al. [78] optimized EN in the Pingshuo open-pit mining area using landscape ecological risk assessments and MCR.
- Cluster #8: PLUS Model (2000–2024, 12 keywords). The low S value of this cluster reflects thematic heterogeneity due to its interdisciplinary scope. The PLUS (Patch-generating Land Use Simulation) model optimizes land use planning by coupling EN and multi-scenario simulations. For example, Peng et al. [8] combined circuit theory and the PLUS model to identify ecological corridors in Yunnan Province. Lin et al. [79] integrated landscape ecological risk assessments with the PLUS model in Guiyang City to predict 2030 risk changes, validating the ecological priority scenario’s superior protection efficacy. Nie et al. [80] simulated 2034 land use scenarios in Anji County using the ESP-MS-PLUS model.
- Cluster #9: Ecological Corridors (2012–2023, 12 keywords). Ecological corridors facilitate species movement and ecosystem connectivity. This theme prioritized the planning, construction and preservation of ecological corridors to support biodiversity and ecological flows. For instance, Li et al. [81] optimized an ESP in a northern mining area using a multi-process MCR model, constructing a “three-horizontal, two-vertical, two-ring” corridor pattern. Wang et al. [82] identified ecological corridors and nodes to enhance landscape connectivity. Wei et al. [83] extracted ecological corridors in the Ebinur Lake Basin to construct a “four-zone, two-belt” ecological pattern.
- Cluster #10 Urban Ecology (2014–2023, 12 keywords). Urban ecology addresses ecological challenges from urbanization through network design. This cluster explores multi-scale ENs in urban environments. For example, Shi et al. [84] proposed a landscape-based resource assessment method in Shenzhen City, prioritizing ecological core areas. Ran et al. [85] integrated ecosystem service supply–demand perspectives to identify ecological demand corridors in central Yunnan’s urban agglomeration. Chen et al. [86] identified ecological sources and corridors in Tianjin City to propose targeted restoration strategies.
- Cluster #11: Ecological Security Pattern (2006–2022, nine keywords). This theme focuses on the construction, assessment, and conservation of ESP. It emphasizes biodiversity conservation, ecosystem service maintenance, and ecological restoration, with key concepts including nestedness, landscape connectivity, and biodiversity maintenance. For example, Peng et al. [36] employed ant colony algorithms and kernel density estimation to identify ecological sources and corridors in Beijing. Wang et al. [61] reconstructed Gansu Prefecture’s ESP to develop a continuous ecological barrier system. Fu et al. [5] constructed an ESP in the Loess Plateau to optimize the ecological source area.
4.4. Analysis of Research Directions
To address the complexity and thematic overlaps among the 12 clusters, we consolidated them into three overarching research directions. Below, each direction is described in detail, highlighting key methodologies, contributions, and their role in sustainable ecosystem management.
- EN theoretical research
This research direction, encompassing Clusters #1 (Ecological Network), #3 (Landscape Pattern), #10 (Urban Ecology), and #11 (Ecological Security Pattern), focuses on developing and refining the conceptual and methodological foundations of ENs and ESPs. It investigates the interplay of ecosystem structure, function, and dynamics to support biodiversity conservation, ecosystem service provision, and urban sustainability. By integrating theoretical frameworks such as landscape connectivity, nestedness, and spatial heterogeneity, this direction provides the scientific underpinnings for ecological conservation and management.
Key research themes include the conceptualization of ENs as frameworks for mitigating habitat fragmentation and enhancing biodiversity. For instance, Saura et al. [67,68] introduced the Probability of Connectivity (PC) index, a robust metric for quantifying habitat connectivity in landscape planning, which has been widely adopted to assess functional connectivity across diverse ecosystems. Similarly, Cluster #3’s focus on landscape patterns employs quantitative methods such as MSPA and structural equation modeling to elucidate how spatial heterogeneity drives ecological processes. Cui et al. [40] demonstrated this by reducing landscape fragmentation in Beijing’s Tongzhou District through optimized greenspace networks.
In urban contexts (Cluster #10), theoretical advancements address ecological challenges posed by urbanization. Shi et al. [84] proposed a landscape-based resource assessment method in Shenzhen City, prioritizing ecological core areas to guide urban planning. Cluster #11 further strengthens this direction by developing ESPs that balance biodiversity conservation with ecosystem service maintenance. Peng et al. [36] utilized ant colony algorithms and kernel density estimation to identify ecological sources and corridors in Beijing, enhancing the nestedness of ecological systems.
This direction tackles methodological challenges, such as subjectivity in ecological source identification, by integrating ecosystem service assessments and multi-scale analyses. For example, Peng et al. [8] combined ecosystem service valuations with EN frameworks in Yunnan Province to improve source identification accuracy. Collectively, EN theoretical research not only enriches the academic understanding of ecosystem dynamics, but also provides robust frameworks for designing resilient ecological networks that support human well-being and environmental sustainability.
- 2.
- EN construction methodology
Encompassing Clusters #0 (Ecological Network Analysis), #2 (Graph Theory), #6 (Circuit Theory), #7 (Minimum Cumulative Resistance), #8 (PLUS Model), and #9 (Ecological Corridors), this direction focuses on the development and application of advanced methods for designing, optimizing, and evaluating ENs. By leveraging mathematical models, spatial analysis, and simulation tools, these methods translate theoretical insights into actionable EN designs, enabling the creation of robust and resilient ecological networks.
Graph theory (Cluster #2) and circuit theory (Cluster #6) are central to this direction, providing quantitative frameworks for modeling landscape connectivity. Saura et al. [60] advanced stepping-stone theory within graph-based approaches, highlighting the role of small and medium-sized habitat patches in facilitating long-distance species dispersal. Circuit theory complements this by simulating ecological flows through landscape resistance and current analyses. Wang et al. [75] applied circuit theory to validate EN resilience in Nanchang City.
The MCR model (Cluster #7) and the PLUS model (Cluster #8) further enhance EN construction by integrating spatial and ecological data. Nie et al. [77] combined MCR with network analysis to construct an EN in Anji County, optimizing corridor layouts to minimize ecological resistance. Similarly, Lin et al. [79] integrated the PLUS model with landscape ecological risk assessments in Guiyang City to predict land use scenarios for 2030. Cluster #0’s advancements, such as Yu et al.’s [65] refinement of the MCR model using energy flow principles, increased network connectivity robustness.
Ecological corridor planning (Cluster #9) bridges these methods by operationalizing connectivity designs. Li et al. [81] developed a “three-horizontal, two-vertical, two-ring” corridor pattern in a northern mining area using a multi-process MCR model, enhancing landscape connectivity. Despite these advances, challenges remain, such as graph theory’s computational complexity and the need for user-friendly tools, as noted by Ayram et al. [70]. This direction addresses these by promoting software development (e.g., Guidos Toolbox) and interdisciplinary approaches, ensuring methods are both scientifically rigorous and practically implementable.
- 3.
- EN and ecosystem services
This applied research direction, spanning Clusters #4 (Green Infrastructure) and #5 (Forest Management), leverages ENs to enhance ecosystem services through integrated management strategies. By focusing on green infrastructure and sustainable forest management, this direction translates theoretical and methodological insights into tangible ecological and socioeconomic benefits, addressing environmental stressors such as climate change, urbanization, and resource exploitation.
Green infrastructure (Cluster #4) integrates natural and anthropogenic systems to enhance ecological resilience and human well-being. Cunha et al. [30] constructed Portugal’s national EN but highlighted conservation gaps, with only 25% under protection. Wu et al. [73] developed a source–sink-theory-based framework in Wu’an County, emphasizing ecological corridors’ role in mitigating urbanization impacts. These approaches underscore green infrastructure’s capacity to deliver ecosystem services such as flood regulation, carbon sequestration, and urban heat island mitigation.
Forest management (Cluster #5) navigates trade-offs between conservation and resource utilization to optimize ecosystem services. Saura et al. [59] assessed European forest connectivity from 1990 to 2000 using the Equivalent Connected Area index. Fu et al. [5] proposed a “two-axis, four-core, six-belt, eight-zone” framework on the Loess Plateau. Emer et al. [74] further highlighted the role of small birds and plants in seed dispersal networks within fragmented Atlantic Forest landscapes.
This direction emphasizes the practical application of ENs in real-world management, aligning conservation goals with socioeconomic priorities. By integrating tools such as circuit theory and ESP frameworks, it ensures that ecosystem services are maintained across diverse landscapes, from urban centers to forested regions. Its focus on measurable outcomes, such as enhanced resilience and service provision, makes it a critical link between theoretical research and on-the-ground implementation.
These three research directions form a cohesive and interconnected system. EN theoretical research establishes a conceptual and scientific foundation, providing frameworks for understanding ecosystem dynamics and connectivity. EN construction methodology operationalizes these frameworks through rigorous, data-driven tools, enabling the design of resilient ENs. EN and ecosystem services translate these designs into practical management strategies, delivering tangible benefits for ecosystems and human communities. Together, this multidimensional framework not only enriches the academic scope of EN research, but also provides scientifically grounded, actionable solutions for sustainable ecosystem management, addressing global challenges such as biodiversity loss and urbanization.
4.5. Analysis of Research Frontier Evolution
Research frontiers encapsulate the most dynamic and innovative trajectories within a scientific field, providing critical insights into current advancements and future directions. Keyword burst analysis, a bibliometric technique grounded in frequency growth algorithms, identifies terms exhibiting rapid and significant increases in citation frequency over a defined period. This method captures the evolving intellectual pulse of a discipline by highlighting emerging trends, shifting priorities, and paradigm shifts [87].
To delineate the evolution of research frontiers in EN research, keyword burst analysis was employed following co-occurrence and clustering analyses in this study. The top 20 keywords, ranked by burst strength, were extracted (Table 4). Based on their temporal patterns, the evolution of research frontiers was divided into three stages: 1991–2009, 2010–2021, and 2022–2024.
Table 4.
Top 20 keywords with the highest citation bursts. Strength denotes the intensity of a keyword’s burst; begin and end years denote the duration of the burst.
- Stage I: Theoretical foundation (1991–2009). This initial stage established the conceptual foundations of EN research, characterized by keywords such as conservation (burst strength: 34.69; burst duration: 2002–2015), habitat fragmentation (23.29, 2007–2018), and ecological network (17.40, 2003–2012). The research focused on elucidating the mechanisms underpinning EN design and their effectiveness in mitigating habitat fragmentation while supporting ecosystem services. Theoretical frameworks, including island biogeography and landscape connectivity, provided the intellectual scaffolding for understanding spatial configurations and ecological processes during this period.
- Stage II: Technological transition (2010–2021). The second stage marked a shift toward quantitative and analytical rigor, with prominent keywords including biodiversity (20.38; 2011–2019), graph theory (18.74; 2011–2018), and climate change (15.63; 2010–2016). Research transitioned from descriptive to predictive approaches, leveraging graph theory to quantify the structural properties of ENs, such as node connectivity and network robustness. The integration of climate change as a research focus prompted the development of dynamic models to capture ecological processes under changing environmental conditions. This period represented a methodological advancement, enhancing the precision and predictive power of EN studies through computational and statistical tools.
- Stage III: Technological integration (2022–2024). The current phase reflects an interdisciplinary synthesis, driven by keywords such as circuit theory (20.19; 2023–2024), ecological security pattern (10.60; 2022–2024), and construction (6.86; 2023–2024). The research emphasizes the design, restoration, and risk assessment of corridor systems to enhance ecological security. Circuit theory, combined with remote sensing, geographic information systems, and machine learning, enables the development of multi-scale simulations of ecological flows and the precise identification of connective corridors. This stage integrates a pattern–process–service–risk framework, fostering data-driven, intelligent decision-making for resilient landscape planning and management.
5. Conclusions and Outlook
5.1. Conclusions
In this study, we systematically traced the evolution of EN research, including ESPs, from 1991 to 2024. The research hotspots centered on ecological protection and biodiversity, ecosystem service assessment, landscape connectivity theory, and the multi-scale dynamics of landscape structure. These research areas collectively underpin an integrated pattern–process–service–risk framework that guides contemporary EN scholarship. Keyword clustering analysis identified 12 thematic clusters, including ecological network analysis, graph theory, green infrastructure, and related topics, highlighting the field’s interdisciplinary breadth and conceptual depth. Burst analysis delineated three distinct frontier stages: theoretical foundation (1991–2009), technological transition (2010–2021), and technological integration (2022–2024), with the current stage advancing toward the design and management of resilient ENs.
5.2. Outlook
The escalating global emphasis on ecological civilization and sustainable development underscores the pivotal role of EN research in shaping resilient regional ecological management strategies. As environmental pressures intensify due to urbanization, climate change, and biodiversity loss, EN research must evolve to address complex socioecological challenges. Drawing on current research frontiers and methodological advancements, the following four outlooks are proposed to guide future EN studies.
- Advancing ecosystem service quantification and integration. Ecosystem services are fundamental to the functionality of ENs, yet their quantitative assessment remains underexplored in many EN frameworks. Future research should prioritize the development and application of standardized, spatially explicit models to evaluate the contributions of ENs to provisioning (e.g., food and water supply), regulating (e.g., flood control and carbon sequestration), supporting (e.g., nutrient cycling and habitat provision), and cultural (e.g., recreational and aesthetic value) services. By integrating tools such as InVEST (Integrated Valuation of Ecosystem Services and Tradeoffs) and circuit-theory-based resistance models, researchers can map ecosystem service flows across ENs. Such efforts will provide a rigorous scientific foundation for prioritizing ecological protection and restoration initiatives, ensuring alignment with regional conservation goals and global frameworks such as the UN Sustainable Development Goals.
- Enhancing climate change adaptation and resilience. Climate change poses significant threats to EN integrity through increased frequency of extreme weather events, shifting species distributions, and altered ecological processes. Future research must deepen the understanding of ENs’ adaptive capacity by modeling their responses to climate-induced stressors, such as drought, flooding, and habitat fragmentation. This involves integrating dynamic climate models with EN simulations to predict changes in connectivity and ecosystem functionality under various climate scenarios (e.g., RCP 4.5 and 8.5). For example, circuit-theory- and graph-based approaches can be used to identify climate-resilient corridors that facilitate species migration and gene flow in fragmented landscapes. Additionally, research should explore nature-based solutions, such as green infrastructure enhancements, to bolster EN resilience against climate impacts. These insights will inform adaptive management strategies, enabling policymakers to design ENs that maintain ecological stability, and support biodiversity conservation amidst climatic uncertainties.
- Strengthening socioeconomic integration for sustainable development. The interplay between ENs and socioeconomic systems is critical for achieving sustainable development, particularly in rapidly urbanizing regions. Future research should focus on elucidating how ENs can optimize ecological spatial configurations to balance conservation objectives with socioeconomic demands, such as agricultural productivity and urban expansion. Special attention should be given to stakeholder engagement and participatory planning to ensure that EN designs reflect local socioeconomic priorities. These efforts will enhance the applicability of ENs in supporting regional sustainable development and fostering resilient human–nature interactions.
- Leveraging interdisciplinary collaboration and technological innovation. The complexity of EN research necessitates interdisciplinary collaboration and the adoption of cutting-edge technologies to advance dynamic monitoring, simulation, and optimization. Future studies should harness emerging tools, such as big data analytics, artificial intelligence, and unmanned aerial vehicles, to enhance the precision of EN research. Furthermore, fostering collaboration across disciplines will drive the development of user-friendly software platforms, for example, Guidos Toolbox or Conefor Sensinode (current version: 2.6, available at http://conefor.org/gisextensions.html, accessed on 15 May 2025) that bridge the gap between research and management. These advancements will facilitate data-driven, intelligent decision-making, enabling the design of adaptive and resilient ENs.
5.3. Limitations
This study provides valuable insights into the evolutionary trajectory and research hotspots of EN research through bibliometric analysis, contributing to ecological governance and sustainable landscape planning. However, methodological and data-related constraints introduce limitations that necessitate further refinement in future research. These limitations are outlined below.
- Selection of data source. The study exclusively utilized the WOSCC as its data source. To investigate the implications of database selection, we compared publication outputs between the WOSCC and Scopus (Figure 5). The analysis revealed notable differences in publication volume, largely due to Scopus’s broader indexing of scholarly content compared to the WOSCC’s more selective inclusion of high-impact, rigorously peer-reviewed publications. Some researchers argue that larger publication volumes do not necessarily enhance the robustness of bibliometric analyses [88], while others advocate for integrating multiple databases to achieve a more comprehensive assessment [15]. Although both databases offer important scientific merits, further systematic comparisons are required to determine their optimal use—either individually or in combination—for specific research objectives.
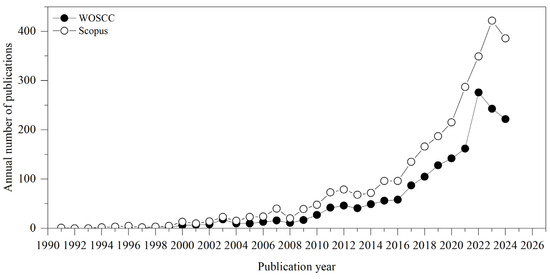 Figure 5. Comparison of annual publications between the WOSCC and Scopus. The search period for Scopus is from January 1991 to September 2024, which is the same as that for the WOSCC.
 - Reliance on a single data source. The study exclusively utilized the WOSCC as its data source. While the WOSCC is an authoritative database for bibliometric analyses due to its rigorous indexing standards, there are still limitations in its nature. First, the WOSCC exhibits regional bias to some extent, with publications from regions such as Africa and Asia being underrepresented [89]. This may skew the global geographical distribution of EN research, potentially marginalizing contributions from non-English-speaking countries. Second, the WOSCC’s focus on English-language publications excludes substantial non-English literature available in databases such as Scopus, Google Scholar, or the China National Knowledge Infrastructure (CNKI) [90]. The non-English literature also provides unique insights into localized ecological issues and application-oriented research.
- Challenges in keyword semantics and retrieval consistency. The quantitative nature of bibliometric analysis is sensitive to semantic variations in keywords. The same terms may carry different meanings across disciplines, languages, or regional contexts, leading to incomplete or inconsistent retrieval results. Such semantic heterogeneity can obscure the accurate identification of research hotspots, especially in interdisciplinary or cross-cultural studies. To address this, future studies could adopt advanced retrieval strategies, such as synonym expansion, and natural language processing (NLP) techniques.
In addition, given that this study focuses on the structural patterns of knowledge production in EN research, it does not utilize citation metrics (e.g., citation counts, h-index) to conduct a detailed analysis of academic influence or knowledge dissemination. Similarly, it excludes funding analysis, which could elucidate trends in research resource allocation across regions or institutions. To deepen the understanding of knowledge flow dynamics and the evolution of scholarly communities within the EN domain, future studies could integrate citation network analysis, co-authorship networks, and funding analyses. These approaches would provide a more comprehensive perspective on the mechanisms driving knowledge production and collaboration in EN research.
Author Contributions
Conceptualization, Y.L.; Methodology, J.W., H.T. and Y.L.; Data Curation, J.W.; Software, J.W. and H.T.; Formal Analysis, J.W. and H.T.; Writing—Original Draft, J.W.; Writing—Review and Editing, Y.L., W.G. and W.Y. All authors have read and agreed to the published version of the manuscript.
Funding
This work was supported by the Special Financial Grant of the Institute of Grand Canal Cultural Belt Construction (DYH22ZL08) and the Yangzhou University Startup Research Funding (137010806). Y.L. appreciates the support from the China Scholarship Council for Overseas Study (202008320150).
Institutional Review Board Statement
Not applicable.
Informed Consent Statement
Not applicable.
Data Availability Statement
Data are available upon request from J.W. and Y.L.
Conflicts of Interest
The authors declare no conflicts of interest.
References
- Su, J.; Yin, H.; Kong, F. Ecological networks in response to climate change and the human footprint in the Yangtze River Delta urban agglomeration, China. Landsc. Ecol. 2021, 36, 2095–2112. [Google Scholar] [CrossRef]
- Yang, J.; Zeng, C.; Cheng, Y. Spatial influence of ecological networks on land use intensity. Sci. Total Environ. 2020, 717, 137151. [Google Scholar] [CrossRef] [PubMed]
- Zhang, L.Q.; Peng, J.; Liu, Y.X.; Wu, J.S. Coupling ecosystem services supply and human ecological demand to identify landscape ecological security pattern: A case study in Beijing-Tianjin-Hebei region, China. Urban Ecosyst. 2017, 20, 701–714. [Google Scholar] [CrossRef]
- Dong, J.; Jiang, H.; Gu, T.; Liu, Y.; Peng, J. Sustainable landscape pattern: A landscape approach to serving spatial planning. Landsc. Ecol. 2022, 37, 31–42. [Google Scholar] [CrossRef]
- Fu, Y.J.; Shi, X.Y.; He, J.; Yuan, Y.; Qu, L.L. Identification and optimization strategy of county ecological security pattern: A case study in the Loess Plateau, China. Ecol. Indic. 2020, 112, 106030. [Google Scholar] [CrossRef]
- Sutton-Grier, A.E.; Wowk, K.; Bamford, H. Future of our coasts: The potential for natural and hybrid infrastructure to enhance the resilience of our coastal communities, economies and ecosystems. Environ. Sci. Policy 2015, 51, 137–148. [Google Scholar] [CrossRef]
- Peng, J.; Zhao, H.J.; Liu, Y.X.; Wu, J.S. Research progress and prospect on regional ecological security pattern construction. Geogr. Res. 2017, 36, 407–419. [Google Scholar]
- Peng, J.; Yang, Y.; Liu, Y.X.; Hu, Y.N.; Du, Y.Y.; Meersmans, J.; Qiu, S.J. Linking ecosystem services and circuit theory to identify ecological security patterns. Sci. Total Environ. 2018, 644, 781–790. [Google Scholar] [CrossRef]
- Zhou, Y.; Yao, J.; Li, P.; Li, B.; Luo, Y.; Ning, S. Multilevel green space ecological network collaborative optimization from the perspective of scale effect. Ecol. Indic. 2024, 166, 112562. [Google Scholar] [CrossRef]
- Gonzalez, A.; Thompson, P.; Loreau, M. Spatial ecological networks: Planning for sustainability in the long-term. Curr. Opin. Environ. Sustain. 2017, 29, 187–197. [Google Scholar] [CrossRef]
- Hashemi, R.; Darabi, H. The review of ecological network indicators in graph theory context: 2014–2021. Int. J. Environ. Res. 2022, 16, 24. [Google Scholar] [CrossRef]
- Liu, S.L.; Hou, X.Y.; Yin, Y.J.; Cheng, F.Y.; Zhang, Y.Q.; Dong, S.K. Research progress on landscape ecological networks. Acta Ecol. Sin. 2017, 37, 3947–3956. [Google Scholar]
- Yu, Q.; Zang, Q.B.; Niu, T.; Wang, G.; Ma, J.; Yang, L.Z. Research progress and prospect of green ecological space network. Trans. Chin. Soc. Agric. Mach. 2021, 52, 1–15. [Google Scholar]
- Yue, D.P.; Yu, Q.; Zhang, Q.B.; Su, K.; Huang, Y.; Ma, H. Progress in research on regional ecological security pattern optimization. Trans. Chin. Soc. Agric. Mach. 2017, 48, 1–10. [Google Scholar]
- Lim, W.M.; Kumar, S.; Donthu, N. How to combine and clean bibliometric data and use bibliometric tools synergistically: Guidelines using metaverse research. J. Bus. Res. 2024, 182, 114760. [Google Scholar] [CrossRef]
- Mukherjee, D.; Lim, W.M.; Kumar, S.; Donthu, N. Guidelines for advancing theory and practice through bibliometric research. J. Bus. Res. 2022, 148, 101–115. [Google Scholar] [CrossRef]
- Chen, C. Turning Points: The Nature of Creativity; Springer Science & Business Media: Berlin/Heidelberg, Germany, 2012. [Google Scholar]
- Li, J. Scientometrics and Knowledge Networks; Capital University of Economics & Business Press: Beijing, China, 2018. [Google Scholar]
- Cai, G.J.; Yuan, G.X.; Fu, H. Status and trends on ecological networks research: A review based on bibliometric analysis. J. Environ. Sci. 2022, 31, 1690–1699. [Google Scholar]
- Lu, Z.; Li, W.; Wang, Y.; Zhou, S. Bibliometric analysis of global research on ecological networks in nature conservation from 1990 to 2020. Sustainability 2022, 14, 4925. [Google Scholar] [CrossRef]
- Wei, J.B.; Zheng, H.; Cheng, Y.L.; Wang, Y. Advances in research of ecological security patterns, based on CiteSpace. Ecol. Environ. Sci. 2022, 31, 835–844. [Google Scholar]
- Shu, R.; Ma, G.; Zou, Y.; Guo, N.; Su, H.; Zhang, G. Bibliometric analysis of ecological security pattern construction: Current status, evolution, and development trends. Ecol. Indic. 2024, 169, 112754. [Google Scholar] [CrossRef]
- Esbah, H.; Cook, E.A.; Ewan, J. Effects of increasing urbanization on the ecological integrity of open space preserves. Environ. Manag. 2009, 43, 846–862. [Google Scholar] [CrossRef] [PubMed]
- Kong, F.; Yin, H.; Nakagoshi, N.; Zong, Y.; Aalders, I. Urban green space network development for biodiversity conservation: Identification based on graph theory and gravity modeling. Landsc. Urban Plan. 2010, 95, 16–27. [Google Scholar] [CrossRef]
- Opdam, P.; Steingröver, E.; Rooij, S.V. Ecological networks: A spatial concept for multi-actor planning of sustainable landscapes. Landsc. Urban Plan. 2006, 75, 322–332. [Google Scholar] [CrossRef]
- Yu, K. Security patterns and surface model in landscape ecological planning. Landsc. Urban Plan. 1996, 36, 1–17. [Google Scholar] [CrossRef]
- An, L.; Shen, L.; Zhong, S.; Li, D.L. Transboundary ecological network identification for addressing conservation priorities and landscape ecological risks: Insights from the Altai Mountains. Ecol. Indic. 2023, 156, 111159. [Google Scholar] [CrossRef]
- An, Y.; Liu, S.L.; Sun, Y.X.; Shi, F.N.; Beazley, R. Construction and optimization of an ecological network based on morphological spatial pattern analysis and circuit theory. Landsc. Ecol. 2021, 36, 2059–2076. [Google Scholar] [CrossRef]
- Chen, X.Y.; Zhu, B.C.; Liu, Y.F.; Li, T.S. Ecological and risk networks: Modeling positive versus negative ecological linkages. Ecol. Indic. 2024, 166, 112362. [Google Scholar] [CrossRef]
- Cunha, N.S.; Magalhães, M.R. Methodology for mapping the national ecological network to mainland Portugal: A planning tool towards a green infrastructure. Ecol. Indic. 2019, 104, 802–818. [Google Scholar] [CrossRef]
- Jongman, R. Nature conservation planning in Europe: Developing ecological networks. Landsc. Urban Plan. 1995, 32, 169–183. [Google Scholar] [CrossRef]
- Kohler, Y.; Plassmann, G.; Ullrich, A.; Götz, A.; Scheurer, T.; Hölscher, S.; Savoia, S. The continuum project: Establishing ecological networks throughout the European Alps. Mt. Res. Dev. 2008, 28, 168–172. [Google Scholar] [CrossRef]
- Li, F.; Wang, R.S.; Paulussen, J.; Liu, X.S. Comprehensive concept planning of urban greening based on ecological principles: A case study in Beijing, China. Landsc. Urban Plan. 2005, 72, 325–336. [Google Scholar] [CrossRef]
- Liu, Q.Q.; Hang, T.; Wu, Y.F.; Song, Y.K.; Tang, X.L. Unveiling differences in biodiversity conservation efficiency across multi-level ecological networks under future climate change scenarios. Ecol. Indic. 2024, 169, 112933. [Google Scholar] [CrossRef]
- Niemelä, J.; Saarela, S.R.; Soderman, T.; Kopperoinen, L.; Yli-Pelkonen, V.; Väre, S.; Kotze, D.J. Using the ecosystem services approach for better planning and conservation of urban green spaces: A Finland case study. Biodivers. Conserv. 2010, 19, 3225–3243. [Google Scholar] [CrossRef]
- Peng, J.; Zhao, S.Q.; Dong, J.Q.; Liu, Y.X.; Meersmans, J.; Li, H.L.; Wu, J.S. Applying ant colony algorithm to identify ecological security patterns in megacities. Environ. Model. Softw. 2019, 117, 214–222. [Google Scholar] [CrossRef]
- Yang, L.J.; Zhang, F.N.; Qin, L.S. Construction and stability evaluation of ecological networks in the Loess Plateau. Ecol. Indic. 2024, 159, 111697. [Google Scholar] [CrossRef]
- Zhang, Y. Establishment of management and evaluation system of sustainable development planning of green infrastructure. Int. J. Environ. Technol. 2020, 23, 197–209. [Google Scholar] [CrossRef]
- Zhou, Y.; Yao, J.; Chen, M.; Tang, M. Optimizing an urban green space ecological network by coupling structural and functional connectivity: A case for biodiversity conservation planning. Sustainability 2023, 15, 15818. [Google Scholar] [CrossRef]
- Cui, L.; Wang, J.; Sun, L.; Lv, C.D. Construction and optimization of green space ecological networks in urban fringe areas: A case study with the urban fringe area of Tongzhou district in Beijing. J. Clean. Prod. 2020, 276, 124266. [Google Scholar] [CrossRef]
- Huang, L.; Wang, J.; Fang, Y.; Zhai, T.; Cheng, H. An integrated approach towards spatial identification of restored and conserved priority areas of ecological network for implementation planning in metropolitan region. Sustain. Cities Soc. 2021, 69, 102865. [Google Scholar] [CrossRef]
- Jiang, C.; Nath, R.; Labzovskii, L.; Wang, D. Integrating ecosystem services into effectiveness assessment of ecological restoration program in northern China’s arid areas: Insights from the Beijing-Tianjin Sandstorm Source Region. Land Use Policy 2018, 75, 201–214. [Google Scholar] [CrossRef]
- Gurrutxaga, M.; Lozano, P.J.; Del Barrio, G. GIS-based approach for incorporating the connectivity of ecological networks into regional planning. J. Nat. Conserv. 2010, 18, 318–326. [Google Scholar] [CrossRef]
- Su, Y.X.; Chen, X.Z.; Liao, J.S.; Zhang, H.O.; Wang, C.J.; Ye, Y.Y.; Wang, Y. Modeling the optimal ecological security pattern for guiding the urban constructed land expansions. Urban For. Urban Green. 2016, 19, 35–46. [Google Scholar] [CrossRef]
- Teng, M.J.; Wu, C.G.; Zhou, Z.X.; Lord, E.; Zheng, Z.M. Multipurpose greenway planning for changing cities: A framework integrating priorities and a least-cost path model. Landsc. Urban Plan. 2011, 103, 1–14. [Google Scholar] [CrossRef]
- Mongeon, P.; Paul-Hus, A. The journal coverage of Web of Science and Scopus: A comparative analysis. Scientometrics 2016, 106, 213–228. [Google Scholar] [CrossRef]
- Liu, W. Caveats for the use of Web of Science Core Collection in old literature retrieval and historical bibliometric analysis. Technol. Forecast. Soc. 2021, 172, 121023. [Google Scholar] [CrossRef]
- Garfield, E. From the science of science to Scientometrics visualizing the history of science with HistCite software. J. Inf. 2009, 3, 173–179. [Google Scholar] [CrossRef]
- Chen, C. CiteSpace II: Detecting and visualizing emerging trends and transient patterns in scientific literature. J. Am. Soc. Inf. Sci. Technol. 2006, 57, 359–377. [Google Scholar] [CrossRef]
- Tsolakis, N.; Anthopoulos, L. Eco-cities: An integrated system dynamics framework and a concise research taxonomy. Sustain. Cities Soc. 2015, 17, 1–14. [Google Scholar] [CrossRef]
- Dong, H.; Liu, S.; Damdinsuren, B.; Hou, X. Knowledge map and visualization analysis of domestic ecological compensation research based on CiteSpace. Acta Ecol. Sin. 2022, 42, 8521–8529. [Google Scholar]
- Liu, W.; Ni, R.; Hu, G. Web of Science Core Collection’s coverage expansion: The forgotten Arts & Humanities Citation Index? Scientometrics 2024, 129, 933–955. [Google Scholar]
- Yang, W. National natural science foundation of China: Funding excellent basic research for 30 years. Nature 2016, 537, 1–5. [Google Scholar]
- Hu, A.G. Public funding and the ascent of Chinese science: Evidence from the national natural science foundation of China. Res. Policy 2020, 49, 103983. [Google Scholar] [CrossRef]
- Liu, W. China’s SCI-indexed publications: Facts, feelings, and future directions. Ecnu Rev. Educ. 2020, 3, 562–569. [Google Scholar] [CrossRef]
- Tian, X.; Geng, Y.; Sarkis, J.; Zhong, S. Trends and features of embodied flows associated with international trade based on bibliometric analysis. Resour. Conserv. Recycl. 2018, 131, 148–157. [Google Scholar] [CrossRef]
- Xie, H.; Zhang, Y.; Wu, Z.; Lv, T. A bibliometric analysis on land degradation: Current status, development, and future directions. Land 2020, 9, 28. [Google Scholar] [CrossRef]
- Wang, Z.; Zhao, Y.; Wang, B. A bibliometric analysis of climate change adaptation based on massive research literature data. J. Clean. Prod. 2018, 199, 1072–1082. [Google Scholar] [CrossRef]
- Saura, S.; Estreguil, C.; Mouton, C.; Rodríguez-Freire, M. Network analysis to assess landscape connectivity trends: Application to European forests (1990–2000). Ecol. Indic. 2011, 11, 407–416. [Google Scholar] [CrossRef]
- Saura, S.; Bodin, Ö.; Fortin, M.J. EDITOR’S CHOICE: Stepping stones are crucial for species’ long-distance dispersal and range expansion through habitat networks. J. Appl. Ecol. 2014, 51, 171–182. [Google Scholar] [CrossRef]
- Wang, Y.; Pan, J. Building ecological security patterns based on ecosystem services value reconstruction in an arid inland basin: A case study in Ganzhou District, NW China. J. Clean. Prod. 2019, 241, 118337. [Google Scholar] [CrossRef]
- Zhao, F.; Shi, B.; Liu, R.; Zhou, W.; Shi, D.; Zhang, J. Theme trends and knowledge structure on choroidal neovascularization: A quantitative and co-word analysis. BMC Ophthalmol. 2018, 18, 86. [Google Scholar] [CrossRef]
- Liang, K.Y.; Jin, X.B.; Zhang, X.L.; Song, J.P.; Li, Q.Q.; Ying, S.C.; Qi, Z.; Zhou, Y.K. Construction of ecological security patterns coupling supply and demand of ecosystem services: Case study of Southern Jiangsu Privince. Acta Ecol. Sin. 2024, 44, 3880–3896. [Google Scholar]
- Chen, Y.; Chen, C.M.; Liu, Z.Y.; Hu, Z.G.; Wang, X.W. The methodology function of Cite Space mapping knowledge domains. Stud. Sci. Sci. 2015, 33, 242–253. [Google Scholar]
- Yu, Q.; Yue, D.; Wang, Y.; Kai, S.; Fang, M.; Ma, H.; Zhang, Q.; Huang, Y. Optimization of ecological node layout and stability analysis of ecological network in desert oasis: A typical case study of ecological fragile zone located at Dengkou County (Inner Mongolia). Ecol. Indic. 2018, 84, 304–318. [Google Scholar] [CrossRef]
- Zhao, R.; Fang, C.; Liu, H.; Liu, X. Evaluating urban ecosystem resilience using the DPSIR framework and the ENA model: A case study of 35 cities in China. Sustain. Cities Soc. 2021, 72, 102997. [Google Scholar] [CrossRef]
- Saura, S.; Pascual-Hortal, L. A new habitat availability index to integrate connectivity in landscape conservation planning: Comparison with existing indices and application to a case study. Landsc. Urban Plan. 2007, 83, 91–103. [Google Scholar] [CrossRef]
- Saura, S.; Torné, J. Conefor Sensinode 2.2: A software package for quantifying the importance of habitat patches for landscape connectivity. Environ. Modell. Softw. 2009, 24, 135–139. [Google Scholar] [CrossRef]
- Rayfield, B.; Fortin, M.; Fall, A. Connectivity for conservation: A framework to classify network measures. Ecology 2011, 92, 847–858. [Google Scholar] [CrossRef]
- Correa Ayram, C.A.; Mendoza, M.E.; Etter, A.; Salicrup, D.R.P. Habitat connectivity in biodiversity conservation: A review of recent studies and applications. Progress. Phys. Geogr. 2015, 40, 7–37. [Google Scholar] [CrossRef]
- Kang, J.; Zhang, X.; Zhu, X.; Zhang, B. Ecological security pattern: A new idea for balancing regional development and ecological protection. A case study of the Jiaodong Peninsula, China. Glob. Ecol. Conserv. 2021, 26, e1472. [Google Scholar] [CrossRef]
- Shi, F.N.; Liu, S.L.; Sun, Y.X.; An, Y.; Zhao, S.; Liu, Y.X.; Li, M.Q. Ecological network construction of the heterogeneous agro-pastoral areas in the upper Yellow River basin. Agric. Ecosyst. Environ. 2020, 302, 107069. [Google Scholar] [CrossRef]
- Wu, X.; Zhang, J.; Geng, X.; Wang, T.; Wang, K.; Liu, S. Increasing green infrastructure-based ecological resilience in urban systems: A perspective from locating ecological and disturbance sources in a resource-based city. Sustain. Cities Soc. 2020, 61, 102354. [Google Scholar] [CrossRef]
- Emer, C.; Galetti, M.; Pizo, M.A.; Guimar Es, P.R.; Moraes, S.; Piratelli, A.; Jordano, P.; Saavedra, S. Seed-dispersal interactions in fragmented landscapes: A meta-network approach. Ecol. Lett. 2018, 21, 484–493. [Google Scholar] [CrossRef] [PubMed]
- Wang, C.; Yu, C.; Chen, T.; Feng, Z.; Hu, Y.; Wu, K. Can the establishment of ecological security patterns improve ecological protection? An example of Nanchang, China. Sci. Total Environ. 2020, 740, 140051. [Google Scholar] [CrossRef]
- Dai, L.; Liu, Y.; Luo, X. Integrating the MCR and DOI models to construct an ecological security network for the urban agglomeration around Poyang Lake, China. Sci. Total Environ. 2021, 754, 141868. [Google Scholar] [CrossRef]
- Nie, W.; Shi, Y.; Siaw, M.J.; Yang, F.; Wu, R.; Wu, X.; Zheng, X.; Bao, Z. Constructing and optimizing ecological network at county and town Scale: The case of Anji County, China. Ecol. Indic. 2021, 132, 108294. [Google Scholar] [CrossRef]
- Xu, W.; Wang, J.; Zhang, M.; Li, S. Construction of landscape ecological network based on landscape ecological risk assessment in a large-scale opencast coal mine area. J. Clean. Prod. 2021, 286, 125523. [Google Scholar] [CrossRef]
- Lin, X.; Wang, Z. Landscape ecological risk assessment and its driving factors of multi-mountainous city. Ecol. Indic. 2023, 146, 109823. [Google Scholar] [CrossRef]
- Nie, W.; Xu, B.; Yang, F.; Shi, Y.; Liu, B.; Wu, R.; Lin, W.; Pei, H.; Bao, Z. Simulating future land use by coupling ecological security patterns and multiple scenarios. Sci. Total Environ. 2023, 859, 160262. [Google Scholar] [CrossRef]
- Li, S.; Xiao, W.; Zhao, Y.; Lv, X. Incorporating ecological risk index in the multi-process MCRE model to optimize the ecological security pattern in a semi-arid area with intensive coal mining: A case study in northern China. J. Clean. Prod. 2020, 247, 119143. [Google Scholar] [CrossRef]
- Wang, S.; Wu, M.; Hu, M.; Fan, C.; Wang, T.; Xia, B. Promoting landscape connectivity of highly urbanized area: An ecological network approach. Ecol. Indic. 2021, 125, 107487. [Google Scholar] [CrossRef]
- Wei, Q.; Halike, A.; Yao, K.; Chen, L.; Balati, M. Construction and optimization of ecological security pattern in Ebinur Lake Basin based on MSPA-MCR models. Ecol. Indic. 2022, 138, 108857. [Google Scholar] [CrossRef]
- Shi, P.; Yu, D. Assessing urban environmental resources and services of Shenzhen, China: A landscape-based approach for urban planning and sustainability. Landsc. Urban Plan. 2014, 125, 290–297. [Google Scholar] [CrossRef]
- Ran, Y.; Lei, D.; Li, J.; Gao, L.; Mo, J.; Liu, X. Identification of crucial areas of territorial ecological restoration based on ecological security pattern: A case study of the central Yunnan urban agglomeration, China. Ecol. Indic. 2022, 143, 109318. [Google Scholar] [CrossRef]
- Chen, X.; Kang, B.; Li, M.; Du, Z.; Zhang, L.; Li, H. Identification of priority areas for territorial ecological conservation and restoration based on ecological networks: A case study of Tianjin City, China. Ecol. Indic. 2023, 146, 109809. [Google Scholar] [CrossRef]
- Kim, M.C.; Chen, C. A scientometric review of emerging trends and new developments in recommendation systems. Scientometrics 2015, 104, 239–263. [Google Scholar] [CrossRef]
- Kraus, S.; Breier, M.; Lim, W.M.; Dabić, M.; Kumar, S.; Kanbach, D.; Ferreira, J.J. Literature reviews as independent studies: Guidelines for academic practice. Rev. Manag. Sci. 2022, 16, 2577–2595. [Google Scholar] [CrossRef]
- Asubiaro, T.; Onaolapo, S.; Mills, D. Regional disparities in Web of Science and Scopus journal coverage. Scientometrics 2024, 129, 1469–1491. [Google Scholar] [CrossRef]
- Chen, D.; Zhang, G.; Wang, J.; Chen, S.; Wang, J.; Nie, H.; Tang, Z. Mapping trends in moyamoya angiopathy research: A 10-year bibliometric and visualization-based analyses of the web of science core collection (WoSCC). Front. Neurol. 2021, 12, 637310. [Google Scholar] [CrossRef]
Disclaimer/Publisher’s Note: The statements, opinions and data contained in all publications are solely those of the individual author(s) and contributor(s) and not of MDPI and/or the editor(s). MDPI and/or the editor(s) disclaim responsibility for any injury to people or property resulting from any ideas, methods, instructions or products referred to in the content. |
© 2025 by the authors. Licensee MDPI, Basel, Switzerland. This article is an open access article distributed under the terms and conditions of the Creative Commons Attribution (CC BY) license (https://creativecommons.org/licenses/by/4.0/).