Abstract
Enclosed courtyards with partially ground floor pilotis represent a prevalent architectural spatial configuration in hot-humid regions, where the shaded outdoor areas serve as frequently utilized spaces for heat avoidance and rest. This study employed a combined approach of ENVI-met simulations and field measurements to investigate the wind and thermal environment in the shaded areas of courtyards under 40 different pilotis width configurations. The Comfortable Wind Zone Ratio (CWZR) and Physiological Equivalent Temperature (PET) were used as primary evaluation metrics to systematically investigate the influence of varying inlet/outlet width ratios in building pilotis on the wind-thermal environment within courtyard-shaded zones. The results demonstrate that: (1) Under a fixed outlet size, enlarging the inlet significantly enhances the CWZR in the shaded area, with a 28.66% difference observed between inlet sizes of L/4 and L. In contrast, under a fixed inlet size, expanding the outlet has a negligible effect on CWZR improvement. (2) Under a fixed outlet size, increasing the inlet width substantially reduces PET in the shaded zone, showing a 2.46 °C difference between inlet sizes of L/4 and L. Conversely, under a fixed inlet size, widening the outlet has a minimal impact on PET reduction. (3) A negative correlation exists between CWZR and PET in the shaded area, indicating that an increase in CWZR leads to a decrease in PET values. The findings provide bioclimatically quantified guidelines for the spatial design of courtyard pilotis in hot-humid regions, offering practical insights for optimizing thermal comfort in shaded outdoor environments.
1. Introduction
Hot-humid regions are characterized by high temperature and humidity, presenting significant challenges to the outdoor built environment. Enclosed courtyards are widely utilized due to their efficient spatial utilization and capacity for microclimate regulation. However, their enclosed form may also lead to excessive humidity and reduce wind speed, which compromise thermal comfort. Integrating natural ventilation through the strategic pilotis of a building’s ground floor has been shown to improve the thermal comfort environment in the courtyard, particularly in the building’s shaded areas, which are used more frequently.
Relevant studies have demonstrated that variations in air temperature within shaded areas of buildings indicate that shadows cast by the building effectively lower air temperatures in these regions [1]. Furthermore, the difference in mean radiant temperature (Tmrt) between sunlit and shaded pedestrian areas exceeds 3 °C [2]. During the hot season, the attendance rate in shaded areas is significantly higher than in sunlit spaces, and the comfort levels of air temperature, Tmrt, and PET in shaded areas are positively correlated with crowd density [3]. Pedestrians tend to migrate from sunlit areas to shaded zones to avoid the discomfort caused by direct solar exposure [4]. These findings demonstrate that the shadows cast by buildings and other structures can create more favorable conditions for outdoor activities.
Courtyards are defined as enclosed or semi-enclosed spaces that are exposed to the sky and surrounded by buildings or walls [5]. The thermal environment is one of the key factors influencing the usage rate of courtyards that possess microclimatic regulation functions, with 80% of courtyards exhibiting cooling effects [6]. The orientation is an significant factor affecting the microclimate of courtyards, and the orientation of a courtyard must consider the local solar trajectory and prevailing wind direction [7]. Another significant factor influencing the microclimate of courtyards is ventilation. Wind conditions play a crucial role in the microclimate of courtyards, affecting pollutant dispersion, thermal comfort, and other aspects. The natural ventilation of courtyards benefits from appropriate openings on the ground, which can reduce heat accumulation during the day and mitigate overheating at night. Increased wind speeds can enhance the thermal comfort of the environment [8]. In-campus raised floor designs can effectively improve the wind environment and thermal comfort at the pedestrian level. By incorporating openings and raised designs, the area of comfortable wind zones in university campuses can be increased from 20% to 50% [9,10]. Jiang et al. quantitatively analyzed the impact of different opening locations, sizes, and wind angles on the wind environment of enclosed courtyards, using a quadrangle courtyard building in Hangzhou as a prototype. They established a model for the comfortable wind zone ratio and summarized the optimal opening position, size, and wind angle [11]. Chen studied the impact of raised heights and forms on the outdoor thermal environment of educational building clusters in hot-humid regions, finding that as the raised floor ratio increases, the thermal environment improves significantly, but a threshold exists. Beyond this threshold, further increases in the elevated ratio result in diminishing improvements in the thermal environment [12].
In the field of wind-thermal environment analysis and simulation, commonly used indicators for evaluating outdoor wind environments include the relative comfort level (Beaufort) evaluation standard, mean wind speed, wind speed ratio, and thermal comfort-based evaluation methods [13,14,15,16,17]. Ma et al. employed mean wind speed, calm-wind zone area ratio, and wind speed variability as indicators for pedestrian wind environment evaluation in residential communities of Tianjin [18]. In exploring the coupling relationship between urban texture parameters and wind environment in university campuses in Guangzhou, Hu used mean wind speed, calm zone area ratio, and comfortable zone area ratio for wind environment evaluation [19]. Ye used the calm-wind area ratio to assess the outdoor wind environment in residential areas in Guangzhou [20]. Computational Fluid Dynamics (CFD) provides detailed and accurate information on thermal fields, velocity fields, and radiation fields, making it a powerful tool for microclimate-scale analysis of building energy consumption and outdoor thermal comfort [21]. Currently, CFD-based simulation software includes Fluent 6 [22,23], Phoenics 2019 [24,25], and ENVI-met 3.1 [26,27]. Among all CFD-based models, ENVI-met is one of the most widely used tools across various climatic contexts, and is suitable for different urban forms with diverse characteristics, such as buildings and vegetation [28]. ENVI-met has been extensively applied in studies on the impact of vegetation [28,29,30,31], building density, and urban form [32] on urban microclimates, as well as in the assessment of strategies for mitigating the urban heat island effect [33,34,35] and outdoor thermal comfort [36,37]. This study will utilize ENVI-met to conduct simulation analyses under various operational conditions.
Current research on thermal comfort in building-shaded areas has primarily focused on the macro-scale analyses, such as at the district level [38,39], while micro-scale investigations remain relatively scarce. In terms of applied indicators and research perspectives, existing studies typically use relatively macroscopic parameters such as surface temperature, mean radiant temperature, and air temperature [40,41,42,43] to analyze thermal comfort climatic factors. Fewer studies have adopted an integrated approach examining both wind and thermal environments at micro-scale levels, with particularly limited reports addressing the impact of pilotis opening dimensions on thermal comfort in courtyard building-shaded areas. The main objectives of this study are: (1) to investigate the impact of courtyard building pilotis ratios on wind-thermal environments in shaded areas; (2) to analyze quantitative relationships between pilotis ratios and both comfortable wind zone ratios and Physiological Equivalent Temperature (PET) values in building-shaded areas; (3) to propose courtyard optimization strategies for activity periods based on spatial-temporal heterogeneity analysis. The findings will further enrich the theoretical framework for outdoor thermal comfort environments in enclosed courtyard buildings in hot-humid regions and provide scientific evidence and design references for spatial design and renovation of such environments.
2. Research Methods
2.1. Study Area and Climatic Characteristics
Guangzhou is located in southern China (23°13′ N, 113°26′ E) and falls within the subtropical monsoon maritime climate zone. The region experiences prolonged summers with hot and humid conditions, making this season particularly critical for urban thermal environment studies. This research primarily focuses on summer thermal conditions. According to the Building Climate Zoning Standard (GB 50178) [44], Guangzhou is classified as a hot-summer and warm-winter region. The summer season (June to September) is particularly hot and humid, with July and August being the hottest months, where the average maximum temperature can reach 36 °C. The prevailing winds during summer are predominantly southeasterly and southerly, with an average wind speed of 1.9 m/s. Meteorological data from August—including mean temperature, relative humidity, wind speed, and wind direction—are presented in Figure 1.
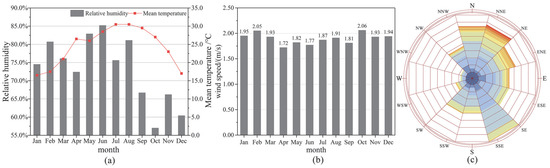
Figure 1.
(a) Monthly average temperature and humidity; (b) Monthly average wind speed; (c) Wind direction in August.
This study adopts the School of Life Sciences building in the teaching area of Guangzhou University as the architectural prototype (Figure 2c). The building features an enclosed courtyard design with overall dimensions of 94 × 75 m and a courtyard measuring 64 × 35 m. The six-story structure (height: 24.3 m) employs conventional concrete walls, with a 4.8 m elevated pilotis on the southwest side of the ground floor.
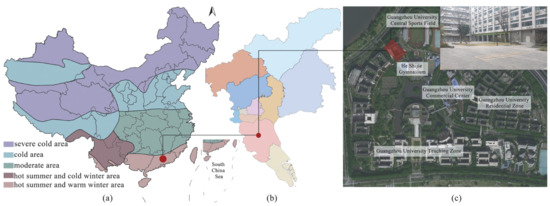
Figure 2.
(a) China building climate areas map; (b) Administrative division map of Guangzhou; (c) Guangzhou University map.
Courtyards can be categorized into fully enclosed and semi-enclosed types based on their form of enclosure. Semi-enclosed courtyards are further classified into three subtypes: three-sided enclosed, parallel two-sided enclosed, and L-shaped configurations [45,46,47]. Field investigations reveal that ground-level elevated teaching buildings in Guangzhou Higher Education Mega Center predominantly adopt either four-sided or three-sided enclosed forms, with primary orientations along north-south and southeast-northwest axes. This study specifically focuses on a north-south oriented, four-sided enclosed courtyard configuration (Figure 2c).
2.2. Evaluation Metrics
2.2.1. Wind Environment Evaluation Metrics
Previous studies have demonstrated that near-ground wind speeds in Guangzhou’s urban areas are generally weak, with prevalent low-wind zones (0.1–0.71 m/s) and an average wind speed of approximately 0.25 m/s, resulting in poor overall wind comfort [48]. Given the typically low wind speeds during Guangzhou’s summer months and minimal spatial variation in wind speed across the study area, conventional evaluation metrics such as comfortable wind occurrence frequency and high-wind zone ratio are deemed unsuitable for this investigation. Instead, this study adopts the Comfortable Wind Zone Ratio (CWZR) to assess wind conditions in courtyard-shaded spaces, defined as:
where the comfortable wind zone is characterized by wind speeds between 0.7–1.7 m/s, a range established as optimal for thermal comfort in hot-humid regions [49].
CWZR = Area of Comfortable Wind Zone/Total Study Area
2.2.2. Thermal Environment Evaluation Index
In thermal comfort assessment, commonly used Indicators include PMV-PPD, SET*, PET, and UTCI. The core temperature and skin temperature in PET are calculated using the Munich Energy-balance Model for Individuals (MEMI), which is based on human body heat balance [50]. Previous thermal Indicators were predominantly developed based on meteorological parameters such as effective temperature and standard effective temperature, yet these Indicators lack thermo-physiological relevance—a limitation addressed by PET. This Indicator incorporates not only meteorological parameters (air temperature, relative humidity, wind speed, and mean radiant temperature) but also individual factors including heat production from human activity, metabolic rate, and clothing insulation [51].
Considering these comprehensive factors, this study employs PET to evaluate the thermal comfort of static activities in summer courtyard-shaded spaces. Different PET value ranges correspond to distinct thermal/cold stresses and thermal perceptions. Due to the similar latitudes of Guangzhou and Taiwan Province, both of which are located in regions characterized by hot summers and mild winters (Figure 2a), Guangzhou closely resembles humid-hot climatic conditions with Taiwan Province. Consequently, this study adopts Taiwan’s modified PET classification for thermal sensation and corresponding physiological stress [52] (Table 1). Previous studies have validated the applicability of this modified PET index in hot-summer and warm-winter regions of China [53,54,55]. The PET calculations are performed using ENVI-met software.

Table 1.
PET range and thermal sensations.
2.3. ENVI-Met Validation
ENVI-met is a three-dimensional computational fluid dynamics (CFD) model capable of simulating the interactions between architectural physical factors and surrounding microclimates. The model comprises five core components: atmosphere, radiation, soil, vegetation, and buildings. Based on thermodynamic principles and computational fluid dynamics, it simulates heat and vapor exchange between surfaces, atmosphere, vegetation, and buildings, along with radiation balance calculations. Extensive studies have validated ENVI-met as a reliable tool for microclimate simulation, employing the standard κ-ε turbulence model and Reynolds-averaged Navier-Stokes (RANS) equations to accurately model system dynamics. With a fine resolution ranging from 0.5 to 10 m [56], the model meets the precision requirements for microclimate simulations. This level of precision confirms the model’s suitability for microclimate simulations. This study utilizes ENVI-met version 5.6.1 (ENVI-met GmbH, Essen, Germany) to simulate microclimate variation processes in courtyard-shaded spaces. On 3 September 2024, our research team conducted field measurements at the School of Life Sciences within Guangzhou University’s teaching area to validate ENVI-met’s reliability (Figure 3). The experimental setup included:
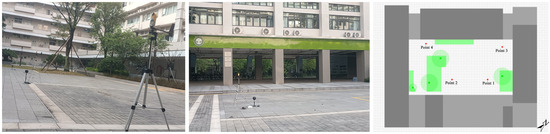
Figure 3.
Site survey and point layout plan for the courtyard of the pilotis building.
- Four Kestrel 5500 meteorological stations deployed at different measurement points
- Black globe thermometers
- Solar radiometers
Data collection parameters:
- Measurement interval: 30 min
- Temperature accuracy: ±0.1 °C
- Wind speed accuracy: ±0.1 m/s
The simulation was conducted using the simple forcing mode for validation. According to weather forecasts, the reference wind speed at 10 m height ranged from 0.8 to 4.7 m/s during daytime. In the ENVI-met model, the input wind speed was set to 2.1 m/s at 236° wind direction. Hourly air temperature (Ta) and relative humidity (RH) data were derived from meteorological station records and incorporated accordingly. The parameter settings related to model validation are presented in Table 2 and Table 3.
Table 2.
Model verification setting parameters.
Table 3.
Ta and RH data from Panyu Meteorological Station on 3 September 2024.
The temperature and wind speed data collected on-site at each measurement point were compared with the corresponding ENVI-met simulation outputs (Figure 4). The analysis indicates that the simulated and measured trends of temperature and wind speed are generally consistent, with good agreement observed between the measured values at each point and the corresponding simulation results. Model accuracy was quantitatively evaluated using root mean square error (RMSE), with temperature RMSE values below 1.6 °C and wind speed RMSE values under 0.3 m/s at all four monitoring points (Table 4). They were all within acceptable ranges for microclimate studies [37,57,58,59]. Furthermore, Liu et al. [37] evaluated model accuracy under different configurations in ENVI-met 5 when simulating courtyards in hot and humid climates, further validating the reliability of the ENVI-met software implementation in this study.
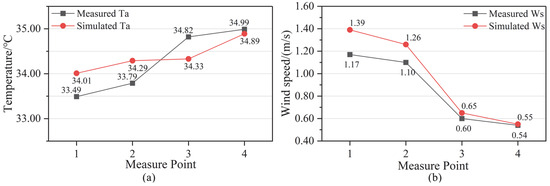
Figure 4.
(a) The mean and standard deviation of air temperature at pedestrian level (z = 1.4 m); (b) The mean and standard deviation of wind speed at pedestrian level (z = 1.4 m).
Table 4.
The RMSE between the measured and simulated values at each measurement point.
2.4. Model Setup and ENVI-Met Simulation Configuration
Based on the architectural orientation and prevailing summer wind direction in Guangzhou, the pilotis are primarily designed on the northern and southern sides of the buildings. The height of the pilotis is kept constant, while the horizontal dimension is selected as the key variable to investigate its proportional impact on the wind-thermal environment in the shaded areas of courtyard buildings. Considering the regional architectural characteristics, with southern pilotis openings are generally larger and northern openings are more variable, and to systematically examine the regression relationships and correlations between outlet width and both the CWZR and PET, the experimental building model was configured with the southern pilotis divided into four equal segments and the northern pilotis into 10 equal segments. This configuration generated a total of 40 simulation cases, with an additional control model without pilotis included for comparison (Figure 5). Subsequent analysis will focus on examining the corresponding outlet and inlet scenarios under conditions of fixed inlet and fixed outlet configurations.
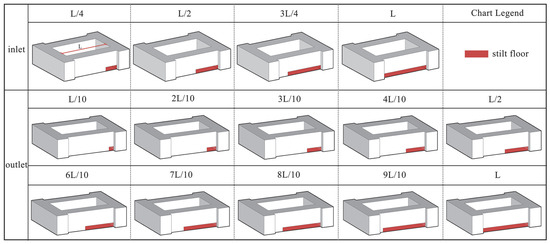
Figure 5.
Models of different pilotis opening sizes.
The simulation domain in this study was covered by a 200 × 200 m grid, with all research models configured at resolutions of dx = dy = 1 m and dz = 2 m. To ensure computational stability, the vertical extent of the simulation domain was set to at least twice the height of the tallest building in the study area, resulting in 30 vertical grid layers. The meteorological data used in the ENVI-met configuration file represented a typical summer day in Guangzhou. The simulation commenced at 08:00 local time on 23 August 2024, with a duration of 11 h. Computational results were extracted at 1.4 m above ground level, with input parameters as specified in Table 5, generating comprehensive wind and thermal environment simulation outputs. Considering typical human activity patterns, the primary analysis period focused on 09:00–18:00 when most outdoor activities occur.
Table 5.
Setting conditions of the study.
2.5. Statistical Analysis and Conceptual Definitions
Given the spatiotemporal variations in wind speed and thermal environment within shaded areas, this study selected characteristic hourly time points from 9:00 to 18:00 to statistically record wind speed and PET values, generating temporal variation trends for daytime conditions. Spatially, considering the heterogeneity of wind speed and PET across different locations in shaded areas, all indicators were calculated as grid-averaged values within the study domain to represent overall conditions. The daily mean PET refers to the average of 10 characteristic hourly PET values. Regression models were employed to quantify relationships between the CWZR, PET values, and inlet/outlet width ratios.
To ensure the robustness of research findings, this study additionally conducted sensitivity analysis and uncertainty analysis. Sensitivity analysis was performed using the Random Forest model (Random Forest Regressor) from machine learning techniques, with input variables including air temperature, relative humidity, wind speed, solar radiation, inlet width ratio, and outlet width ratio, while output variables were PET and CWZR, respectively. In addition, to evaluate the impact of input parameter uncertainty on the model outputs during the simulation process, parameter uncertainty analysis was carried out based on the principle of perturbation propagation. Although this study employed simulations based on predefined typical meteorological conditions and building opening ratios, uncertainties still exist in the input parameters. These include representativeness errors in typical-day meteorological data, discretization errors in the setting of architectural design parameters, and approximation errors inherent in the ENVI-met simulation process. Accordingly, perturbation amplitudes were respectively assigned to air temperature, relative humidity, wind speed, solar radiation, inlet ratio, and outlet ratio as input variables. Furthermore, by integrating feature importance derived from the Random Forest model as relative sensitivity weights for each variable, the uncertainty ranges of output indicators were estimated using an error-propagation method based on weighted sum of squares.
Additional relevant variables and concepts in this study are defined as follows: L represents the total width of pilotis modules along the courtyard-facing southern or northern facades at ground level. To express the proportional relationship of pilotis openings, the dimension of pilotis is compared to the total facade width (e.g., L/4 indicates the pilotis width equals one-quarter of the total ground-level facade width). Unless otherwise specified, all subsequent references to “shaded areas” specifically denote shadows cast by courtyard buildings as the shading structures, while “inlet and outlet” exclusively refer to ventilation openings created by ground-level pilotis on the southern (inlet) and northern (outlet) building facades of the courtyard.
3. Results and Discussion
3.1. Analysis of the Wind Environment
3.1.1. Effect of Building Elevated Floor Width on the Wind Environment in the Shaded Area of the Courtyard
The simulated wind environment results in courtyard-shaded areas under typical inlet sizes of 3L/4 with varying outlet dimensions are presented in Figure 6. Between 14:00 and 15:00, solar radiation reaches its peak intensity, resulting in maximum thermal loads and pronounced thermal differentials in the environment. During this period, the interaction between airflow streams becomes more intense, and analyzing the wind field distribution at this time is beneficial for assessing the actual contribution of pilotis design to mitigating thermal discomfort. Meanwhile, this time period also coincides with an important period for outdoor activities and social interactions among faculty and students in the courtyard. Therefore, the wind field corresponding to different outlet sizes at 15:00 was selected for analysis. As shown in the figure, when the courtyard is fully enclosed, wind speeds within the shaded area remain at approximately 0.20 m/s, indicating stagnant conditions. As the outlet width increases, wind speeds within the shaded area exhibit a corresponding rise. However, beyond an outlet width of 5/10L, wind speed variations become negligible both within the shaded area and across the entire courtyard (Table 6). Notably, wind speeds diminish near the outlet, suggesting that an outlet dimension of 5/10L may serve as a reference value for thermal comfort design. This phenomenon can be attributed to the venturi effect [60]: with smaller outlets, incoming airflow significantly impacts the shaded area and vicinity of the outlet. However, as the outlet continues to expand, airflow becomes distributed throughout the entire courtyard and outlet region, resulting in minimal overall wind speed variations.
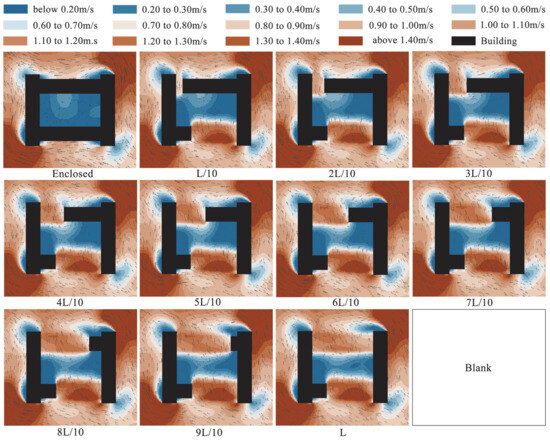
Figure 6.
Flow field corresponding to different outlet sizes under the 3L/4 inlet at 15:00 (the black color indicates building).
Table 6.
Average wind speed in the entire courtyard, shaded area and non-shaded area under different outlet sizes with 3L/4 inlet (Unit: m/s).
Figure 7 presents the simulated wind environment results in courtyard-shaded areas under a typical outlet size of 5L/10 with varying inlet dimensions, analyzed at 15:00. The results demonstrate that as the inlet width increases, wind speeds in the shaded area show negligible variations initially due to its location in the wind shadow region. However, when the inlet width exceeds 3L/4, wind speeds within the shaded area exhibit significant enhancement. Concurrently, the mean wind speed across the entire courtyard substantially increases (Table 7), with a progressive acceleration observed near the outlet location. This phenomenon may be attributed to the Venturi effect [60], where increased airflow through enlarged inlets generates enhanced wind speeds throughout the courtyard and particularly at the outlet.
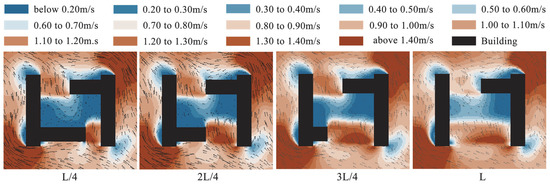
Figure 7.
Flow field corresponding to different inlet sizes under the5L/10 outlet at 15:00 (the black color indicates building).
Table 7.
Average wind speed in the entire courtyard, shaded area and non-shaded area under different inlet sizes with 5L/10 outlet (Unit: m/s).
These findings reveal that wind speeds in shaded areas are more sensitive to inlet dimensions than outlet sizes. The wind shadow effect dominates when no direct airflow enters through inlets, rendering outlet variations ineffective in modifying shaded area ventilation. Furthermore, inlet dimensions demonstrate greater influence on overall courtyard wind conditions. Additional simulations confirm that the effects of pilotis width on shaded area wind speeds under other inlet-outlet configurations follow similar patterns to these representative cases.
3.1.2. The Effect of Pilotis Width on the CWZR in the Courtyard-Shaded Spaces
Figure 8 presents the average comfortable wind zone ratio (CWZR) in shaded areas during daytime under various inlet-outlet configurations. When the inlet width remains constant, the CWZR exhibits a gradual increase with expanding outlet dimensions. For instance, at a fixed inlet width of 3L/4, the difference between maximum and minimum CWZR values is merely 9.70%. Nevertheless, under all fixed-inlet conditions, the most significant CWZR increments consistently occur within the outlet width range of 5/10L to 7/10L, suggesting this interval as a potential design reference for outlet size. Based on the results, due to the relatively low wind speed within the courtyard, increasing the outlet size helps enhance the pressure difference between the inlet and outlet, thereby leading to a continuous increase in CWZR as the outlet size increases. However, with a fixed inlet size, this pressure-driven enhancement remains constrained, resulting in minimal variation between maximum and minimum CWZR values. With fixed outlet widths, the CWZR demonstrates more pronounced enhancement with increasing inlet dimensions. Notably, at a 7L/10 outlet width, the CWZR variation reaches 28.66% between extreme inlet sizes. The increase in inlet size has a more pronounced effect on enhancing the pressure difference between the inlet and outlet. Consequently, variations in inlet size have a more significant impact on improving CWZR compared to outlet size. Comparative analysis reveals substantially limited ventilation performance with restricted inlets: at L/4 inlet width, the maximum CWZR only attains 16.55% across all outlet variations, while even the minimum CWZR reaches 38.80% when the inlet expands to full width (L). These results quantitatively demonstrate that constrained inlet dimensions (below 3L/4) significantly compromise wind comfort in shaded areas, whereas larger openings (≥3L/4) consistently ensure better aerodynamic conditions.
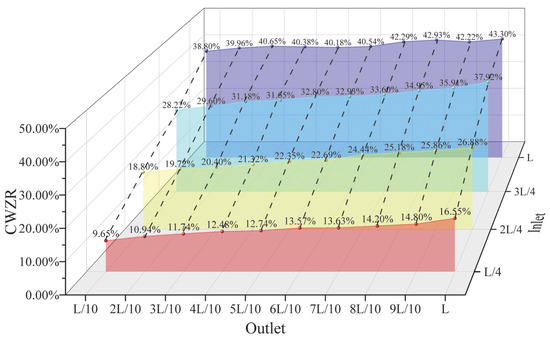
Figure 8.
Average CWZR throughout the daytime for different inlet and outlet sizes.
Figure 9 illustrates the diurnal variation trend of the CWZR in the shaded area under different outlet sizes with an inlet airflow rate of 3L/4. During the period from 9:00 to 12:00, the CWZR for all outlet sizes exhibits an upward trend, reaching its peak value at 12:00. This phenomenon is primarily attributed to the gradual reduction of the shaded area during this time frame, with the shaded area reaching its minimum at 12:00 and being located near the inlet on the southern side of the courtyard, where ventilation conditions are favorable. With intensifying solar radiation, the thermal pressure differential between shaded and sun-exposed zones increases significantly. Consequently, even under relatively low courtyard wind speeds, the CWZR exhibits rapid rise within a limited range. From 12:00 to 16:00, the CWZR demonstrates a declining trend. This is mainly due to the continuous expansion of the shaded area during this period, which leads to a weakening of the thermally driven wind flow and consequently results in limited growth of the comfortable wind zone area. The CWZR attains its lowest value at 16:00, after which it shows a slight increase with minimal fluctuations, eventually stabilizing. This is primarily due to the shaded area continuing to expand after 16:00 while solar radiation weakens, resulting in the near disappearance of the thermal pressure difference between the shaded and sunlit areas. Consequently, the wind environment in the courtyard tends to stabilize, and the variation in the proportion of the comfortable wind zone becomes minimal, with the fluctuation of CWZR gradually leveling off. Moreover, at the same time intervals, CWZR consistently increases with larger outlet sizes, particularly during the periods of 09:00–11:00 and 16:00–18:00. This is mainly attributed to the enhanced ventilation capacity with larger outlets, which improves airflow mobility and uniformity, resulting in a more even wind speed distribution within the courtyard and coverage of a broader area. Overall, larger outlet sizes correspond to higher CWZR values, though the difference generally remains within a range of 5% to 14.80%.
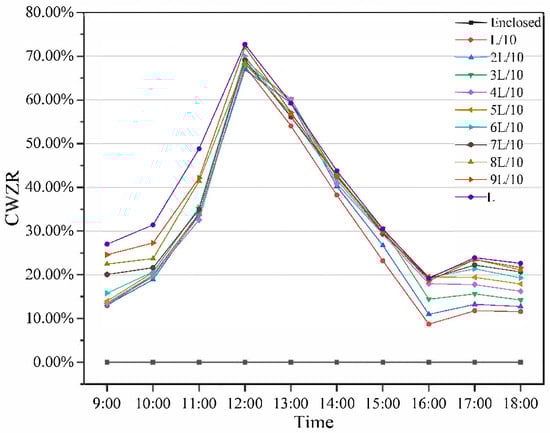
Figure 9.
CWZR in shaded areas under varying outlet dimensions with a fixed 3L/4 inlet width.
Figure 10 presents the diurnal variation trend of the CWZR in the shaded area under different inlet sizes with an outlet dimension of 7L/10. From 9:00 to 12:00, as the inlet width increases, the CWZR exhibits a faster rising trend, reaching its maximum value at 12:00. When the inlet width is L, the CWZR peaks at 94.24%. This is primarily due to the gradual reduction of the shaded area during this period, and which is located on the southern side of the courtyard near the inlet, where ventilation conditions are favorable. As solar radiation intensifies, the thermal pressure difference between the shaded and sunlit areas increases, resulting in a rapid rise in CWZR within a limited range under relatively low wind speed conditions in the courtyard. From 12:00 to 16:00, the CWZR shows a declining trend; however, the larger inlet configurations still maintain a clear advantage. This is mainly due to the shaded area continuing to expand during this period, which reduces the thermally induced pressure gradient and consequently leads to decreased wind speeds. As a result, the expansion of comfortable wind zones remains limited. The CWZR stabilizes after 16:00, primarily due to the diminishing thermal pressure difference between shaded and sun-exposed areas as evening approaches, resulting in stabilized wind conditions within the courtyard that maintain stable CWZR values. Moreover, at the same time period, CWZR consistently increases with larger inlet sizes, with this trend being particularly pronounced between 10:00 and 15:00. This phenomenon stems from two primary mechanisms. On the one hand, a larger inlet allows greater airflow into the courtyard, significantly enhancing air mobility and wind uniformity under low wind speed conditions, thereby contributing to a notable improvement in CWZR. On the other hand, as solar radiation intensifies, the increased wind volume permitted by a larger inlet, combined with the synergistic effects of thermal and wind pressure, leads to a marked increase in wind speed, thereby expanding the area of the comfortable wind zone. After 16:00, the thermal pressure difference between sunlit and shaded areas is significantly reduced, and thus the influence of inlet size on CWZR becomes notably weaker, even under varying inlet conditions. Overall, a larger inlet size corresponds to a higher CWZR, with a significant difference observed. At 12:00, the CWZR difference between an inlet size of L and 1/4L reaches 73.13%, while in other time periods, the difference generally exceeds 10%. A comparison of the results from Figure 9 and Figure 10 further indicates that, for the all-day CWZR, the impact of increasing the inlet size is more pronounced than that of adjusting the outlet dimensions.
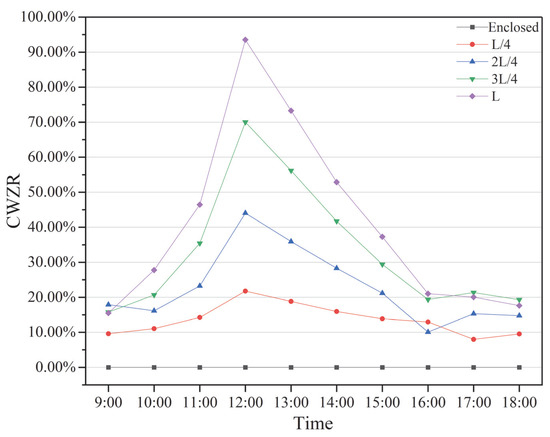
Figure 10.
CWZR in shaded areas under varying inlet dimensions with a fixed 7L/10 outlet width.
3.1.3. Regression Model Analysis Between CWZR and Inlet/Outlet Widths Ratio
Figure 11 illustrates the variation trend of the average CWZR in the courtyard-shaded area under different outlet sizes with an inlet width of 3L/4. The CWZR values for outlet sizes of L/10, 2L/10, 3L/10, 4L/10, 5L/10, 6L/10, 7L/10, 8L/10, 9L/10, and L are 28.22%, 29.60%, 31.18%, 31.65%, 32.80%, 32.93%, 33.60%, 34.95%, 35.91%, and 37.92%, respectively. It is evident that the average CWZR in the shaded area increases with the enlargement of the outlet size. The Regression curve equation can be expressed as Equation (1).
CWZR = 0.0095x + 0.2767 (R2 = 0.9706),
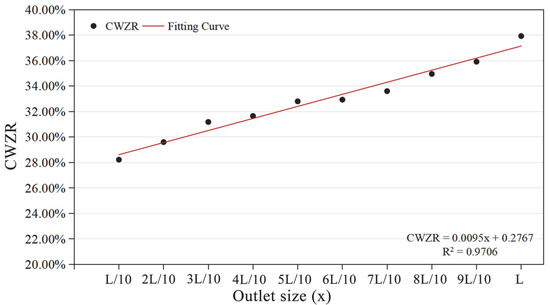
Figure 11.
Regression curve of the CWZR in shaded areas under different outlet dimensions with a fixed 3L/4 inlet width.
The increase in CWZR with outlet size suggests that a larger outlet dimension enhances the overall wind environment. This finding contrasts with the conclusions of Jiang et al. [11], who reported that CWZR decreases with increasing outlet size and that smaller outlets are more favorable for the overall wind environment. The analysis indicates that the observed discrepancies in findings are primarily associated with inlet-outlet configurations. Jiang et al. [11] employed relatively narrow inlets (only one-third of the building height) with perfectly aligned north-south inlet-outlet arrangements, which under smaller outlet conditions tended to confine airflow within courtyard circulation, thereby enhancing CWZR. In contrast, the present study adopts larger inlet sizes with outlet cases ranging from minimal to fully open configurations. Consequently, the dominant factor influencing CWZR values shifts from recirculating courtyard winds to pressure-driven through-flow ventilation, establishing more objective CWZR evaluation criteria for shaded areas. This discrepancy indicates that the impact of outlet size modification differs between the courtyard’s overall wind field and the isolated shaded area. The regression curve equations for the other three inlet sizes under varying outlet dimensions are summarized in Table 8.
Table 8.
CWZR regression curve equations for different outlet sizes corresponding to the other three inlet sizes.
Figure 12 presents the variation trend of CWZR under different inlet sizes with a fixed outlet dimension of 7L/10. The results demonstrate that the impact of increasing inlet size on CWZR is more pronounced than that of outlet size variation. The CWZR values for inlet sizes of L/4, 2L/4, 3L/4, and L are 13.63%, 33.60%, and 42.29%, respectively. The CWZR in the courtyard-shaded area increases with larger inlet dimensions, which aligns with the findings reported by Jiang et al. [11]. The fitted curve can be expressed by Equation (2).
CWZR = −0.0053x2 + 0.1216x + 0.0205 (R2 = 0.9998),
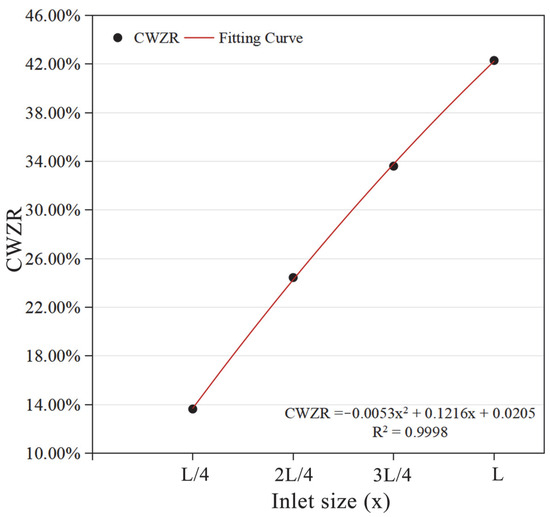
Figure 12.
Regression curve of the CWZR in shaded areas under different inlet dimensions with a fixed 7L/10 outlet width.
From no overhead opening to an opening size of L, the CWZR increases from 0% to 42.29%, reaching its maximum value at the full inlet size (L). This indicates that enlarging the inlet size significantly improves the wind environment in the courtyard’s shaded area. While the specific trend variations may differ from those observed by Jiang et al. [11], the overall pattern shows a consistent increasing tendency.
3.2. Analysis of Thermal Environment
3.2.1. Impact of Building Pilotis Width on Thermal Comfort in the Courtyard-Shaded Areas
Figure 13 presents the diurnal average PET results under different inlet and outlet dimensions. Within the shaded area, when the inlet width remains constant, increasing the outlet width leads to a decreasing trend in PET values. For the four inlet widths examined, the maximum differences between the highest and lowest PET values across various outlet sizes are 0.22 °C, 1.00 °C, 0.73 °C, and 0.46 °C, respectively. This indicates that enlarging the outlet width has a limited effect on reducing PET values in the courtyard-shaded area. Conversely, when the outlet width is fixed and the inlet width increases, the PET values generally exhibit a decreasing trend. For the 10 outlet widths studied, the differences between the highest and lowest PET values corresponding to different inlet sizes are 2.24 °C, 2.22 °C, 2.22 °C, 2.17 °C, 2.25 °C, 2.35 °C, 2.46 °C, 2.52 °C, 2.53 °C, and 2.46 °C. This demonstrates that increasing the inlet width has a more pronounced impact on improving PET values compared to adjusting the outlet width. Notably, when the inlet width exceeds 3L/4, a significant temperature difference (approximately 1 °C) is observed relative to the 2L/4 configuration. This further indicates that an inlet width of 3L/4 has more substantial guidance significance in reducing the PET values.
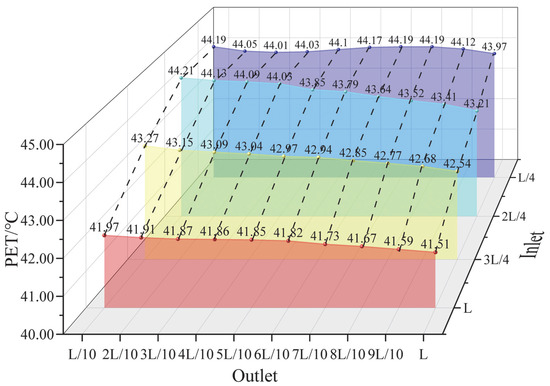
Figure 13.
Average PET throughout the daytime for different inlet and outlet sizes.
3.2.2. Impact of Building Pilotis Width on Hourly PET Variation in the Shaded Areas During Daylight Hours
Following the approach of Taiwanese scholars Lin et al. [52], this study defines the PET threshold for thermal comfort in hot summer conditions as ≤34 °C (comfort zone), while PET values > 42 °C are classified as exceeding thermal tolerance (discomfort zone). The transitional range between 34 °C and 42 °C is identified as a buffer zone from comfort to discomfort. Figure 14 displays the hourly PET values (9:00–18:00) in shaded areas under varying outlet widths (L/10 to L) with a fixed inlet width of 3L/4. Results indicate that PET trends across all outlet widths exhibit similar diurnal patterns, with PET values generally decreasing as inlet width increases. Except for the non-pilotis courtyard scenario, all configurations show peak PET values at 14:00. The maximum observed difference (1.32 °C) occurs at 17:00. During early hours (9:00–10:00), PET values for all pilotis widths predominantly fall within the comfort zone. However, after 12:00, PET values consistently enter the discomfort zone across all configurations, only showing a notable cooling trend post-17:00.
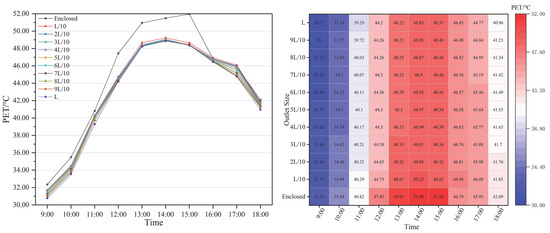
Figure 14.
Average PET in the shaded area with different outlet sizes for 3L/4 inlet width from 9:00 to 18:00.
Figure 15 presents the hourly PET values (9:00–18:00) in the shaded area under different inlet widths with a fixed outlet width of 7L/10. The results demonstrate that, except for the non-pilotis courtyard scenario, all other configurations exhibit peak PET values during 14:00–15:00. While the diurnal PET trends remain similar across inlet widths ranging from L/4 to L, the PET values generally decrease with increasing inlet width. Notably, compared to the previously discussed outlet width variations, the difference in PET values across the various inlet widths is noticeably larger, particularly between 11:00 and 16:00, with the highest difference occurring at 12:00, reaching 7.16 °C. Regarding the diurnal PET variations, during 9:00–10:00, PET values for all pilotis widths predominantly remain within the comfort zone. However, after 12:00, all configurations consistently enter the discomfort zone, with a distinct cooling trend emerging after 17:00.
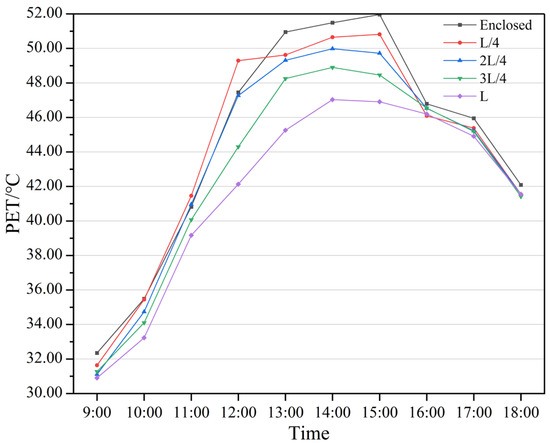
Figure 15.
Average PET in the shaded areas with different inlet sizes for 7L/10 outlet width from 9:00 to 18:00.
Comparative analysis clearly indicates that variations in inlet width exert a more substantial influence on hourly PET values in the shaded area than do changes in outlet width.
3.2.3. Impact of Building Pilotis Width on Hourly Thermal Sensation in the Shaded Spaces
Figure 16 presents the percentage distribution of thermally comfortable (PET ≤ 34 °C) and uncomfortable (PET > 42 °C) zones within the shaded area from 9:00 to 18:00 under varying outlet widths (0-L) with a fixed inlet width of 3L/4. As observed from the figure, when the outlet width increases from 0 to L, the proportion of the comfortable zone at 9:00 initially decreases and then increases, reaching a peak of 83.88% at an outlet width of 7L/10, after which further increases in outlet width result in minimal change. The consistently high comfort zone coverage (>80%) during early morning hours primarily results from favorable ambient temperatures. At 10:00, the proportion of the comfortable zone similarly increases with the outlet width, reaching a maximum of 77.25% at full width (L), albeit lower than the 9:00 values. Concurrently, during this time period, the proportion of the uncomfortable space shows a decreasing trend, reaching its lowest value of 10.85% at an outlet width of L. Post-11:00 observations show a dramatic reduction in comfort zones (<1%) accompanied by rapidly expanding discomfort zones, though the latter exhibits a consistent decreasing trend with increasing outlet width. The period between 14:00–16:00 shows complete thermal discomfort (100%), attributable to elevated air temperatures and diminished shading effectiveness during peak solar hours (12:00–16:00). From 17:00 onward, the proportion of the uncomfortable space begins to drop below 100%, and by 18:00, it significantly decreases. As the outlet width increases, the proportion of the uncomfortable space reduces from 43.75% to 18.62%.
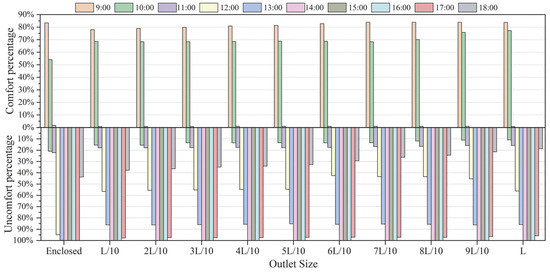
Figure 16.
The percentage distribution of thermally comfortable and uncomfortable zones in the shaded areas under varying outlet widths (0-L) with a fixed inlet width of 3L/4 from 9:00 to 18:00.
Figure 17 displays the percentage distribution of comfortable (PET ≤ 34 °C) and uncomfortable (PET > 42 °C) zones in the shaded area from 9:00 to 18:00 under different inlet widths (0 to L) with a fixed outlet width of 7L/10. The results indicate that at 9:00, the percentage of comfortable space remains relatively stable (>80%) with increasing inlet width, while uncomfortable zones are virtually absent, primarily due to lower morning temperatures. By 10:00, the comfortable zone percentage increases with inlet width, peaking at 82.41% for a full-width inlet (L), though slightly lower than at 9:00. Concurrently, the proportion of uncomfortable space demonstrates a decreasing trend with increasing inlet width, reaching its minimum value of 10.52% when the pilotis width is extended to full dimension (L). After 11:00, the comfortable zone percentage drops sharply to below 1%, while the uncomfortable zone percentage rises rapidly. Nevertheless, increasing the inlet width generally reduces the proportion of uncomfortable space. Between 14:00 and 16:00, the uncomfortable space reaches 100%, mainly due to the rise in air temperature from 12:00 to 16:00, which limits the effectiveness of the shaded area in controlling PET temperature. From 17:00 onward, the proportion of uncomfortable space starts to drop below 100%, and by 18:00, it decreases significantly, ranging from 43.75% to 24.51% as the inlet width increases.
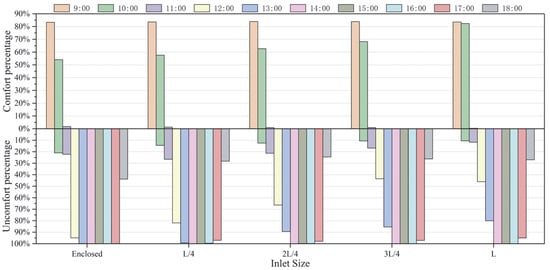
Figure 17.
The percentage distribution of thermally comfortable and uncomfortable zones in the shaded areas under varying inlet widths (0-L) with a fixed outlet width of 7L/10 from 9:00 to 18:00.
These findings demonstrate that thermal comfort in shaded areas is strongest during 9:00–11:00 and from 17:00 onward, suggesting optimal periods for outdoor activity in such environments. The data highlight the critical role of inlet width in mitigating thermal discomfort, particularly during transitional periods before and after peak heat hours.
3.2.4. Regression Analysis Between Diurnal Mean Pet Values and Inlet/Outlet Widths Ratio
Figure 18 presents the variation trend of diurnal mean PET values under different outlet dimensions with a fixed inlet width of 3L/4. The results demonstrate a decreasing trend in diurnal mean PET values with increasing outlet width. Within the range of L/10 to 4L/10 outlet widths, PET values exhibit minimal variation, while more pronounced changes occur between 6L/10 and L. The measured diurnal mean PET values are 44.53 °C (no-pilotis), 43.27 °C (L/10), 43.15 °C (2L/10), 43.09 °C (3L/10), 43.04 °C (4L/10), 42.97 °C (5L/10), 42.94 °C (6L/10), 42.85 °C (7L/10), 42.77 °C (8L/10), 42.68 °C (9L/10), and 42.54 °C (L). The regression equation is expressed as Equation (3).
PET = −0.0731x + 43.332 (R2 = 0.9794),
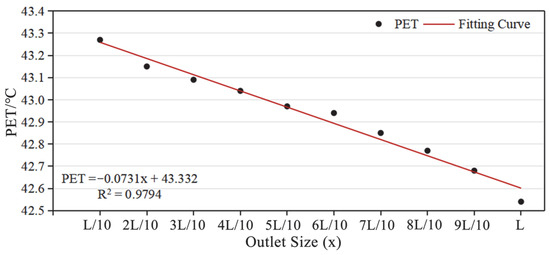
Figure 18.
Regression curve of the PET values in shaded areas under different outlet dimensions with a fixed 3L/4 inlet width.
The decreasing diurnal mean PET values with larger outlet dimensions indicate improved thermal environmental performance. However, the maximum PET reduction between the smallest (L/10) and largest (L) outlet widths is only 0.73 °C, suggesting limited cooling effectiveness through outlet dimension modification alone. The regression equations for the other three inlet width configurations are presented in Table 9.
Table 9.
PET regression curve equations for different outlet sizes corresponding to the other three inlet sizes.
Figure 19 presents the variation trend of PET values under different inlet dimensions with a fixed outlet size of 7L/10. The results demonstrate a pronounced decreasing trend in diurnal mean PET values with increasing inlet dimensions. The measured diurnal mean PET values are 44.53 °C (no pilotis), 44.19 °C (L/4), 43.64 °C (2L/4), 42.85 °C (3L/4), and 41.73 °C (L). The consistent reduction in PET values with larger inlet widths indicates significant thermal environment improvement through inlet expansion. The relationship is quantified by Equation (4).
PET = −0.1425x2 − 0.1045x + 44.433 (R2 = 0.9999),
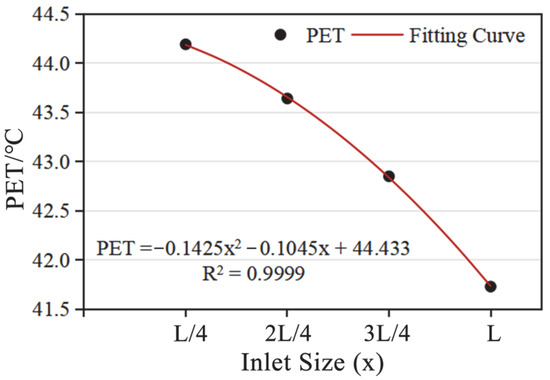
Figure 19.
Regression curve of PET values in shaded areas under different inlet dimensions with a fixed 7L/10 outlet width.
Notably, the maximum temperature reduction reaches 2.46 °C between minimum (L/4) and maximum (L) inlet widths, demonstrating substantially greater cooling effectiveness through inlet modification compared to outlet adjustments. These findings conclusively establish that inlet dimension variation exerts more significant influence on diurnal mean PET values than equivalent outlet modifications.
3.3. Correlation Between CWZR and PET
As shown in Table 10 and Figure 20, a negative correlation exists between the CWZR and PET under different outlet sizes at the inlet of 3L/4, as well as under different inlet sizes at the outlet of 7L/10, with Pearson correlation coefficients approaching −1. This indicates that increasing the area of the comfortable wind zone can reduce PET, thereby improving the thermal environment.
Table 10.
The correlation coefficient between the CWZR and the PET.
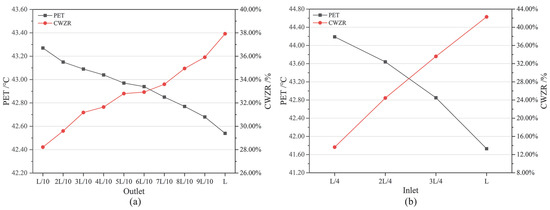
Figure 20.
(a) PET and CWZR diagrams under different outlet sizes at the 3L/4 inlet; (b) PET and CWZR diagrams under different inlet sizes at the 7L/10 outlet.
3.4. Sensitivity and Uncertainty Analysis of the Model
Table 11 presents the feature importance of each model input variable. The analysis indicates that PET is primarily influenced by meteorological parameters, particularly relative humidity (0.41) and air temperature (0.434), while the inlet width ratio accounts for only 0.059, and the outlet width ratio exhibits even lower feature importance. In contrast, CWZR is strongly affected by the geometric configuration of the building, with the inlet width ratio (0.415) and solar radiation (0.411) identified as the dominant contributing factors. This phenomenon can be explained from the perspective of microclimatic dynamics and physical mechanisms. On the one hand, the inlet determines the primary source of airflow in the courtyard, and its proportional factor has a significant impact. On the other hand, increased solar radiation drives surface heating, which induces local buoyancy-driven circulation and alters the wind speed distribution. Simultaneously, under high radiation conditions, shading structures are more likely to trigger cross-ventilation effects, resulting in noticeable changes in CWZR. The above sensitivity analysis reveals that the driving mechanisms of PET and CWZR differ to some extent. This distinction supports the necessity of considering both parameters in this study and in practical courtyard microclimate design: optimizing PET requires attention to climatic background conditions, while enhancing CWZR relies more on spatial configuration.
Table 11.
Feature importance of input variables.
In the uncertainty analysis of the model, this study employed 5% of the input variables’ range in the simulation data as perturbation values to estimate the impact of input parameter uncertainties on model outputs. Weighted error propagation analysis incorporating feature importance derived from Random Forest revealed the following uncertainty ranges: ±1.37 °C for PET and ±8.22% for CWZR. Although CWZR exhibited relatively larger perturbation magnitudes, it maintained discernible differentiation across various design schemes. The relatively smaller uncertainty in PET further demonstrates the robustness of the study’s results, supporting their applicability for guiding design optimization.
3.5. Analysis of Design Strategies
At the microscale level, combined with the above CWZR and PET data, it is evident that the opening size ratio of the pilotis has a significant effect on regulating the wind and thermal comfort environment within shaded courtyard spaces. Therefore, under the premise of meeting the basic functional requirements of the building, the design process should aim to achieve both ventilation and thermal comfort objectives by establishing a reasonable opening size ratio for the pilotis. This can facilitate comfortable cross-ventilation through the courtyard, thereby reducing the thermal comfort temperature of the environment. Based on the findings of this study, the inlet width may be set to a relatively larger size (e.g., 3L/4 to L), and the outlet width should also be of a certain size (e.g., 6L/10 to L), with the inlet oriented in alignment with the prevailing wind direction.
At the macro-scale of urban blocks and city planning, pilotis can regulate the microclimate and improve the overall wind environment of the area. Given the significant cooling effect of pilotis on shaded courtyard areas, their design within blocks or planned districts should align with the prevailing wind direction of the city. The pilotis should be configured as extensions of ventilation corridors, thereby forming a continuous wind corridor network throughout the block or planning area.
Furthermore, in site planning and organization, factors such as the spatial extent of outdoor activities at different times of the day and the corresponding wind and thermal environments should be comprehensively considered. Based on the findings of this study, during hot summer conditions, the recommended time periods for outdoor activities in shaded areas are between 9:00–11:00 and 17:00–18:00, when building-shaded zones serve as crucial spatial carriers for outdoor activities.
4. Conclusions
This study employed CFD simulations to investigate the impact of building pilotis size ratios on the wind-thermal environment in shaded courtyard areas, using the CWZR and PET as key evaluation metrics. Based on the research objectives, the main conclusions are as follows:
- (1)
- Regarding the CWZR in shaded areas, the expansion of the inlet has a greater impact than that of the outlet. For the diurnal average CWZR, under a fixed inlet size, the difference in CWZR among different outlet sizes ranged from 4.50% to 9.70%, whereas under a fixed outlet size, the difference among different inlet sizes ranged from 26.75% to 29.15%. For hourly CWZR values during the daytime, with a fixed inlet (3L/4), the maximum difference in CWZR among different outlet sizes was 14.80%, while with a fixed outlet (7L/10), the maximum difference among different inlet sizes reached 73.13%.
- (2)
- For the PET values in the shaded courtyard area, the expansion of the inlet similarly had a greater influence than that of the outlet. Under a fixed inlet size, the diurnal average PET difference among different outlet sizes ranged from 0.22 °C to 1.00 °C, whereas under a fixed outlet size, the difference among different inlet sizes ranged from 2.17 °C to 2.53 °C. Regarding the hourly PET variation trends throughout the daytime, with a fixed inlet, the maximum PET difference among different outlet sizes was 1.32 °C, while with a fixed outlet, the maximum difference among different inlet sizes was 7.16 °C.
- (3)
- A negative correlation was observed between CWZR and PET under different inlet and outlet size configurations, indicating that increasing CWZR can reduce PET values.
- (4)
- Considering the combined effects of pilotis size ratios on the wind-thermal environment in shaded areas and aiming for optimal comfort wind conditions and PET performance, it is recommended to prioritize larger inlet widths (e.g., 3L/4 to L) when design conditions permit, while the outlet should also maintain a sufficient width (e.g., 6L/10 to L).
- (5)
- In site design, based on the analysis of PET comfort ranges across different time periods, the recommended outdoor activity times in shaded areas during hot summer weather are 9:00–11:00 and 17:00–18:00.
This study investigates the CWZR and PET indices within shaded zones of enclosed courtyards in hot and humid regions at the microscale, aiming to reveal the effects of pilotis width ratios on the summer wind and thermal environments of courtyard-shaded areas during daytime. The findings provide a bioclimatic-based reference for the spatial morphological design of courtyard spaces in hot and humid climates.
Although this study utilized ENVI-met for microclimate simulations to reveal the impact of pilotis ratios on the wind and thermal environment, the findings were obtained under idealized boundary conditions that did not account for intraday weather variations. Notably, transient phenomena characteristic of real climatic conditions—including gust winds, cloud cover fluctuations, and solar radiation intensity variations—were not considered, potentially introducing discrepancies with field observations. Therefore, it is necessary to incorporate dynamic meteorological data in future research to enable comparative analysis under extreme conditions. Furthermore, the simplified boundary conditions employed geometric abstraction of buildings as rectangular volumes without architectural details (e.g., colonnades or mechanical equipment) that may alter ventilation paths. However, these limitations do not compromise the validity of the principal conclusions or design recommendations derived from this study.
This study specifically focuses on the south-north oriented enclosed building typology commonly found in hot-humid regions, while other orientations and morphological configurations remain unexplored. Future research should extend the investigation to alternative building orientations (e.g., 22°, −22°, 45°, and −45°) and courtyard morphologies (e.g., L-shaped, U-shaped configurations).
Author Contributions
Conceptualization, Z.L., Z.Z. and W.M.; Methodology, Z.L. and W.M.; Software, W.M.; Validation, W.M.; Formal analysis, Z.L., Z.Z. and W.M.; Investigation, W.M., Y.L. (Yingzhi Liang) and Z.X.; Resources, Y.L. (Yuankui Li); Data curation, W.M., Y.L. (Yingzhi Liang) and Z.X.; Writing—original draft preparation, W.M.; Writing—review and editing, Z.L. and Z.Z.; Visualization, W.M. and Z.X.; Supervision, Z.L. and Z.Z.; Project administration, Z.L. All authors have read and agreed to the published version of the manuscript.
Funding
This research received no external funding.
Institutional Review Board Statement
Not applicable.
Informed Consent Statement
Not applicable.
Data Availability Statement
Data are contained within the article.
Conflicts of Interest
The authors declare no conflicts of interest.
Abbreviations
The following abbreviations are used in this manuscript:
| PET | Physiological equivalent temperature (°C) |
| CWZR | Comfort wind zone ratio |
| CFD | Computational fluid dynamics |
| Tmrt | The mean radiant temperature |
| RMSE | Root mean square error |
| UHI | Urban heat island |
| Ta | Temperature |
| RH | Relative Humidity |
References
- Zaki, S.A.; Syahidah, S.W.; Shahidan, M.F.; Ahmad, M.I.; Yakub, F.; Hassan, M.Z.; Daud, M.Y.M. Assessment of Outdoor Air Temperature with Different Shaded Area within an Urban University Campus in Hot-Humid Climate. Sustainability 2020, 12, 5741. [Google Scholar] [CrossRef]
- Alkaabi, K.; Senghore, S.; El Fawair, A.R. Toward Sustainable Cities: Monitoring Thermal Environment for Buildings and Pedestrian Space Using Drone-Captured 3D Thermal Imaging. Front. Built Environ. 2023, 8, 1035546. [Google Scholar] [CrossRef]
- Lin, T.-P.; Tsai, K.-T.; Hwang, R.-L.; Matzarakis, A. Quantification of the Effect of Thermal Indices and Sky View Factor on Park Attendance. Landsc. Urban Plan. 2012, 107, 137–146. [Google Scholar] [CrossRef]
- Kantor, N.; Unger, J. Benefits and Opportunities of Adopting GIS in Thermal Comfort Studies in Resting Places: An Urban Park as an Example. Landsc. Urban Plan. 2010, 98, 36–46. [Google Scholar] [CrossRef]
- Edwards, B. Courtyard Housing: Past, Present and Future; Taylor & Francis: Abingdon, UK, 2006; ISBN 0-415-26272-0. [Google Scholar]
- Tao, Y.; Lou, Y.; Chen, Z.; Zhao, F.; Wang, W.; Lin, X. Study on Strategy for Optimization of Thermal Comfort of College Courtyards in Lingnan Area in Summer. Atmosphere 2023, 14, 1685. [Google Scholar] [CrossRef]
- Zhu, J.; Feng, J.; Lu, J.; Chen, Y.; Li, W.; Lian, P.; Zhao, X. A Review of the Influence of Courtyard Geometry and Orientation on Microclimate. Build. Environ. 2023, 236, 110269. [Google Scholar] [CrossRef]
- Patricia Lopez-Cabeza, V.; Rivera-Gomez, C.; Roa-Fernandez, J.; Hernandez-Valencia, M.; Herrera-Limones, R. Effect of Thermal Inertia and Natural Ventilation on User Comfort in Courtyards under Warm Summer Conditions. Build. Environ. 2023, 228, 109812. [Google Scholar] [CrossRef]
- Du, Y.; Mak, C.M. Improving Pedestrian Level Low Wind Velocity Environment in High-Density Cities: A General Framework and Case Study. Sustain. Cities Soc. 2018, 42, 314–324. [Google Scholar] [CrossRef]
- Du, Y.; Mak, C.M.; Huang, T.; Niu, J. Towards an Integrated Method to Assess Effects of Lift-up Design on Outdoor Thermal Comfort in Hong Kong. Build. Environ. 2017, 125, 261–272. [Google Scholar] [CrossRef]
- Jiang, Z.; Gao, W.; Yao, W. Research on the Wind Environment in an Enclosed Courtyard: Effect of the Opening Position, Size and Wind Angle. Urban Clim. 2023, 52, 101737. [Google Scholar] [CrossRef]
- Chen, G. Effect of Piloti on School Building Group Outdoor Thermal Environment in Guangzhou. Master’s Thesis, South China University of Technology, Guangzhou, China, 2012. [Google Scholar]
- Du, Y.; Mak, C.M.; Kwok, K.; Tse, K.-T.; Lee, T.; Ai, Z.; Liu, J.; Niu, J. New Criteria for Assessing Low Wind Environment at Pedestrian Level in Hong Kong. Build. Environ. 2017, 123, 23–36. [Google Scholar] [CrossRef]
- Liu, Y.; Wang, J.; Bai, W.; Dewancker, B.; Gao, W. A Numerical Simulation-Based Adaptation of the Pedestrian-Level Wind Environment in Village Streets: A Case Study on the Chuan Dao Area of the Hanjiang River in Southern Shaanxi. Sustainability 2024, 16, 7597. [Google Scholar] [CrossRef]
- Melbourne, W.H. Criteria for Environmental Wind Conditions. Wind Content Built Environ. 1978, 3, 241–249. [Google Scholar] [CrossRef]
- Bibliographie: Meteorological Office. The Velocity Equivalents of the Beaufort Scale, by G.-C. Simpson. Ciel Terre 1927, 43, 19. [Google Scholar]
- Holger Koss, H. On Differences and Similarities of Applied Wind Comfort Criteria. J. Wind. Eng. Ind. Aerodyn. 2006, 94, 781–797. [Google Scholar] [CrossRef]
- Ma, T.; Chen, T. Classification and Pedestrian-Level Wind Environment Assessment among Tianjin’s Residential Area Based on Numerical Simulation. Urban Clim. 2020, 34, 100702. [Google Scholar] [CrossRef]
- Hu, W. Coupling Study of Spatial Morphology and Outdoor Wind Environment of University Campus in Guangzhou Based on Regression Analysis. Master’s Thesis, South China University of Technology, Guangzhou, China, 2020. [Google Scholar]
- Ye, Q. Research on Design of Outdoor Space in Residential Areas Orientated by Suitable Wind Environment in Guangzhou. Master’s Thesis, Guangzhou University, Guangzhou, China, 2017. [Google Scholar]
- Jamei, E.; Seyedmahmoudian, M.; Horan, B.; Stojcevski, A. Verification of a Bioclimatic Modeling System in a Growing Suburb in Melbourne. Sci. Total Environ. 2019, 689, 883–898. [Google Scholar] [CrossRef]
- Aghamolaei, R.; Fallahpour, M.; Mirzaei, P.A. Tempo-Spatial Thermal Comfort Analysis of Urban Heat Island with Coupling of CFD and Building Energy Simulation. Energy Build. 2021, 251, 111317. [Google Scholar] [CrossRef]
- Sun, R.; Dong, J.; Zhao, H.; Wang, L.; Qin, D. Typical Village and Town Houses in the Cold Region of Northeast China: Simulation Analysis of Courtyard Layout and Winter Wind Environment Habitability. Buildings 2024, 14, 109. [Google Scholar] [CrossRef]
- Guo, P.; Ding, C.; Guo, Z.; Liu, T.; Lyu, T. Coupling CFD Simulation and Field Experiments in Summer to Prove Feng Shui Optimizes Courtyard Wind Environments: A Case Study of Prince Kung’s Mansion in Beijing. Buildings 2022, 12, 629. [Google Scholar] [CrossRef]
- Lu, M.; Song, D.; Shi, D.; Liu, J.; Wang, L. Effect of High-Rise Residential Building Layout on the Spatial Vertical Wind Environment in Harbin, China. Buildings 2022, 12, 705. [Google Scholar] [CrossRef]
- Stocco, S.; Canton, A.; Correa, E. Design Alternatives for Environmental Improvements in Urban Squares of Mendoza—Argentina. Evaluation by Means of ENVI-Met 3.1. Inf. Constr. 2018, 70, e253. [Google Scholar] [CrossRef]
- Balter, J.; Alchapar, N.; Correa, E.; Ganem, C. Urban Microclimatic Modeling for Apartment’s Thermo-Energy Simulation in High-Rise Buildings in Mendoza-Argentina. ENVI-Met and EnergyPlus Software Integration. Inf. Constr. 2021, 73, e382. [Google Scholar] [CrossRef]
- Tsoka, S.; Tsikaloudaki, A.; Theodosiou, T. Analyzing the ENVI-Met Microclimate Model’s Performance and Assessing Cool Materials and Urban Vegetation Applications-A Review. Sustain. Cities Soc. 2018, 43, 55–76. [Google Scholar] [CrossRef]
- Alsaad, H.; Hartmann, M.; Hilbel, R.; Voelker, C. ENVI-Met Validation Data Accompanied with Simulation Data of the Impact of Facade Greening on the Urban Microclimate. Data Brief 2022, 42, 108200. [Google Scholar] [CrossRef] [PubMed]
- Ouyang, W.; Sinsel, T.; Simon, H.; Morakinyo, T.E.; Liu, H.; Ng, E. Evaluating the Thermal-Radiative Performance of ENVI-Met Model for Green Infrastructure Typologies: Experience from a Subtropical Climate. Build. Environ. 2022, 207, 108427. [Google Scholar] [CrossRef]
- Liu, Z.; Zheng, S.; Zhao, L. Evaluation of the ENVI-Met Vegetation Model of Four Common Tree Species in a Subtropical Hot-Humid Area. Atmosphere 2018, 9, 198. [Google Scholar] [CrossRef]
- Gusson, C.S.; Duarte, D.H.S. Effects of Built Density and Urban Morphology on Urban Microclimate—Calibration of the Model ENVI-Met V4 for the Subtropical Sao Paulo, Brazil. Procedia Eng. 2016, 169, 2–10. [Google Scholar] [CrossRef]
- Cortes, A.; Rejuso, A.J.; Santos, J.A.; Blanco, A. Evaluating Mitigation Strategies for Urban Heat Island in Mandaue City Using ENVI-Met. J. Urban Manag. 2022, 11, 97–106. [Google Scholar] [CrossRef]
- Crank, P.J.; Sailor, D.J.; Ban-Weiss, G.; Taleghani, M. Evaluating the ENVI-Met Microscale Model for Suitability in Analysis of Targeted Urban Heat Mitigation Strategies. Urban Clim. 2018, 26, 188–197. [Google Scholar] [CrossRef]
- Hussein, M.S. Mitigation Strategies of the Urban Heat Island Over Greater Cairo Metropolitan Area, Egypt Utilizing ENVI-Met Model. Catrina-Int. J. Environ. Sci. 2021, 24, 35–47. [Google Scholar]
- Abd Elraouf, R.; ELMokadem, A.; Megahed, N.; Eleinen, O.A.; Eltarabily, S. Evaluating Urban Outdoor Thermal Comfort: A Validation of ENVI-Met Simulation through Field Measurement. J. Build. Perform. Simul. 2022, 15, 268–286. [Google Scholar] [CrossRef]
- Liu, S.; Middel, A.; Fang, X.; Wu, R. ENVI-Met Model Performance Evaluation for Courtyard Simulations in Hot-Humid Climates. Urban Clim. 2024, 55, 101909. [Google Scholar] [CrossRef]
- Chen, J.; Wang, F. Ecological Design Method of Commercial Walking Space in Tropical Urban Environment Based on Shaded Area Phenomenon. Environ. Technol. 2021, 42, 2902–2915. [Google Scholar] [CrossRef]
- Wang, Q.; Peng, L.L.H.; Jiang, W.; Yin, S.; Feng, N.; Yao, L. Urban Form Affects the Cool Island Effect of Urban Greenery via Building Shadows. Build. Environ. 2024, 254, 111398. [Google Scholar] [CrossRef]
- Zou, Y.; Chen, J.; Zong, H. Is Shading a Better Way to Cool down? Evaluation and Comparison of the Cooling Capacity of Blue-Green Spaces and Urban Shade. Ecol. Indic. 2024, 167, 112688. [Google Scholar] [CrossRef]
- Acero, J.A.; Koh, E.J.Y.; Tan, Y.S.; Norford, L.K. Quantifying the Effect of Building Shadowing and Cloudiness on Mean Radiant Temperature in Singapore. Atmosphere 2021, 12, 1012. [Google Scholar] [CrossRef]
- Yu, K.; Chen, Y.; Wang, D.; Chen, Z.; Gong, A.; Li, J. Study of the Seasonal Effect of Building Shadows on Urban Land Surface Temperatures Based on Remote Sensing Data. Remote Sens. 2019, 11, 497. [Google Scholar] [CrossRef]
- Liu, J.; Tang, H.; Zheng, B. Thermal Environments of Residential Areas: Sunlight and Building Shadow in a Chinese City with Hot and Humid Summers. Buildings 2024, 14, 2730. [Google Scholar] [CrossRef]
- GB 50178-1993; Standard of Climatic Regionalization for Architecture. China Planning Press: Beijing, China, 1993.
- Meng, H.; Jiao, W.; Hong, J.; Anna, L. Analysis on Wind Environment in Winter of Different Rural Courtyard Layout in the Northeast. 8th Int. Cold Clim. Hvac Conf. 2016, 146, 343–349. [Google Scholar] [CrossRef]
- Yang, L.; Liu, X.; Qian, F.; Niu, S. Research on the Wind Environment and Air Quality of Parallel Courtyards in a University Campus. Sustain. Cities Soc. 2020, 56, 102019. [Google Scholar] [CrossRef]
- Chatzidimitriou, A.; Yannas, S. Street Canyon Design and Improvement Potential for Urban Open Spaces; the Influence of Canyon Aspect Ratio and Orientation on Microclimate and Outdoor Comfort. Sustain. Cities Soc. 2017, 33, 85–101. [Google Scholar] [CrossRef]
- Feng, X.; Wei, Q. Study on the Near-surface Flow Field in Urban Areas of Guangzhou. Ecol. Environ. Sci. 2011, 20, 1558–1561. [Google Scholar] [CrossRef]
- Li, Q. The Influence of Building Clusters’ Planning and Design on the Outdoor Microclimate in Hot and Humid Zone. Ph.D. Thesis, South China University of Technology, Guangzhou, China, 2009. [Google Scholar]
- Mayer, H.; Höppe, P. Thermal Comfort of Man in Different Urban Environments. Theor. Appl. Climatol. 1987, 38, 43–49. [Google Scholar] [CrossRef]
- Matzarakis, A.; Mayer, H.; Iziomon, M.G. Applications of a Universal Thermal Index: Physiological Equivalent Temperature. Int. J. Biometeorol. 1999, 43, 76–84. [Google Scholar] [CrossRef]
- Lin, T.-P.; Yang, S.-R.; Chen, Y.-C.; Matzarakis, A. The Potential of a Modified Physiologically Equivalent Temperature (mPET) Based on Local Thermal Comfort Perception in Hot and Humid Regions. Theor. Appl. Climatol. 2019, 135, 873–876. [Google Scholar] [CrossRef]
- Zheng, Z.; Lu, J.; Dai, K.; Liu, J.; Liu, W.; Zhang, Y.; Fang, Z. Comparison of the Adaption of Outdoor Thermal Comfort of Pedestrians with Face Masks in Semi-Open Spaces. Therm. Sci. Eng. Prog. 2024, 49, 102429. [Google Scholar] [CrossRef]
- Zhou, Z.; Dong, L. Experimental Investigation of the Effect of Surgical Masks on Outdoor Thermal Comfort in Xiamen, China. Build. Environ. 2023, 229, 109893. [Google Scholar] [CrossRef]
- Zhou, Z.; Jiao, R.; Dong, L. The Influence of Perceived Control on Outdoor Thermal Comfort: A Case Study in a Hot Summer and Warm Winter Climate. Build. Environ. 2023, 245, 110872. [Google Scholar] [CrossRef]
- Huttner, S. Further Development and Application of the 3D Microclimate Simulation ENVI-Met. Ph.D. Thesis, Johannes Gutenberg University of Mainz, Mainz, Germany, 2012. [Google Scholar]
- López-Cabeza, V.P.; Galán-Marín, C.; Rivera-Gómez, C.; Roa-Fernández, J. Courtyard Microclimate ENVI-Met Outputs Deviation from the Experimental Data. Build. Environ. 2018, 144, 129–141. [Google Scholar] [CrossRef]
- Lin, L.; Gui, Y. Why Does the Courtyard Spaces of Same Ethnic Group Present Diverse Characteristics in Different Regions: Evidence Based on ENVI-Met Climate Modeling. J. Clean. Prod. 2024, 466, 142703. [Google Scholar] [CrossRef]
- Salata, F.; Golasi, I.; de Lieto Vollaro, R.; de Lieto Vollaro, A. Urban Microclimate and Outdoor Thermal Comfort. A Proper Procedure to Fit ENVI-Met Simulation Outputs to Experimental Data. Sustain. Cities Soc. 2016, 26, 318–343. [Google Scholar] [CrossRef]
- Li, B.; Luo, Z.; Sandberg, M.; Liu, J. Revisiting the “Venturi Effect” in Passage Ventilation between Two Non-Parallel Buildings. Build. Environ. 2015, 94, 714–722. [Google Scholar] [CrossRef]
Disclaimer/Publisher’s Note: The statements, opinions and data contained in all publications are solely those of the individual author(s) and contributor(s) and not of MDPI and/or the editor(s). MDPI and/or the editor(s) disclaim responsibility for any injury to people or property resulting from any ideas, methods, instructions or products referred to in the content. |
© 2025 by the authors. Licensee MDPI, Basel, Switzerland. This article is an open access article distributed under the terms and conditions of the Creative Commons Attribution (CC BY) license (https://creativecommons.org/licenses/by/4.0/).