Article

Combining Demand for Ecosystem Services with Ecosystem Conditions of Vacant Lots to Support Land Preservation and Restoration Decisions

1
Department of Civil, Environmental and Mechanical Engineering (DICAM), University of Trento, Via Mesiano 77, 38123 Trento, Italy
2
LINKS Foundation, via Pier Carlo Boggio 61, 10138 Turin, Italy
*
Author to whom correspondence should be addressed.
Sustainability 2025, 17(10), 4686; https://doi.org/10.3390/su17104686
Submission received: 15 April 2025 / Revised: 13 May 2025 / Accepted: 14 May 2025 / Published: 20 May 2025

Abstract

:
Urban densification threatens vacant lots in cities, potentially affecting biodiversity and the ecosystem services (ES) they provide. Policymakers require evidence-based tools to balance densification policies and initiatives with the preservation of green spaces. This research proposes a method to assess ecosystem conditions (EC) of vacant lots and combine it with ES demand in order to identify lots that need to be prioritised for preservation and restoration. This method is applied to the Northern Milan intermunicipal area (Italy). By using open-access satellite imagery, indicators for abiotic, biotic, and landscape characteristics were determined for each lot regarding four regulating ES (air purification, runoff mitigation, microclimate regulation, and pollination). The EC assessment provides planners with information on the ecosystems’ qualities and their ability to deliver ecosystem services. Our findings indicate that vacant lots differ in their contribution to ES provision due to variation in abiotic, biotic, and landscape connectivity conditions, underlining the need for a more detailed assessment of the differences between each individual area that composes the green infrastructure. However, challenges related to defining reference levels and the availability of detailed local data need to be addressed to guide planning decisions effectively.

1. Introduction

Many European cities, such as Oslo [1], London [2,3], Amsterdam [4], and Zurich [5], are promoting densification policies to accommodate the ongoing population growth and demand for housing. However, while densification contributes to reducing the physical expansion of the city and decreasing dependence on motorised private transport means, numerous studies underscore its negative impacts in terms of the decrease in green space availability and the loss of ecosystem services (ES) [6,7,8,9]. In this context, therefore, urban planners must identify solutions to address the challenge of densifying cities while preserving the availability of green spaces.
The underused spaces within urban areas, which lack human activity and are suitable for infill developments, can be distinguished into two main categories based on the way they originated. These categories include artificial sites that once served a purpose but were abandoned at some point, also known as brownfields, and lots left vacant that were generated by the evolution of the city over time [10,11]. This latter category is particularly important, as its soil has generally been preserved over time, providing a range of additional ES compared to brownfields, such as soil carbon storage, water infiltration, and purification. However, vacant lots are more susceptible to land use changes since they do not require treatments such as demolition or remediation to be converted into built-up areas [12], making them an element of considerable interest in the context of densification processes. Several authors [13,14,15,16] have demonstrated that vacant lots can provide various ES, such as microclimate regulation and runoff mitigation, helping cities address key climate change challenges. Studies in London and Berlin revealed that abandoned vacant lots are highly biodiverse, hosting a rich variety of animal and plant species [17]. In fact, unlike agricultural areas and urban parks, vacant lots lack fertilisers, allowing more spontaneous species to thrive [18]. In addition, they can represent stepping stones in dense built-up areas, facilitating the movement of species [19,20].
Given their potential to provide ES, vacant lots can be considered part of urban green infrastructure (GI), on par with other types of nature-based solutions (NbS).
GI refers to a planned network of natural and semi-natural areas, while NbS are defined as actions inspired and supported by nature [21]. While the concept of GI primarily focuses on networks of green and blue spaces, NbS are more oriented toward working with nature to tackle specific urban challenges [22]. Examples include green roofs and walls, bioswales, and rain gardens, which help regulate temperature and manage stormwater. Initially promoted by international institutions to address climate change issues, the NbS concept has evolved to encompass a wide range of additional benefits [23]. However, both GI and NbS are aimed at enhancing environmental conditions and human well-being, and their relevance to urban environments is closely tied to their ability to deliver ES [24]. As such, they have been promoted as practical tools for translating ES approaches into real-world applications [25]. ES are advocated in spatial planning by numerous studies to promote more sustainable urban policies [26,27]. By emphasising the role of natural elements and healthy ecosystems in influencing quality of life and human well-being, ES also help to reveal trade-offs between alternative land use configurations [25]. Moreover, they can encourage the development of performance-based planning approaches, in which land uses are defined according to specific environmental goals and the expected impacts of proposed interventions [28,29].
In this perspective, integrating ES into planning processes becomes particularly relevant when addressing urban densification challenges to balance increasing building intensity with green space preservation. The ES concept provides a basis for assessing how remaining open spaces, such as vacant lots, support environmental quality and human well-being. In this context, planning vacant lots as part of GI requires a clear understanding of how these spaces may contribute differently to ES provision depending on their characteristics. It is important to highlight that vacant lots have emerged at different stages of urban development, often as remnants of formerly wooded or agricultural land that became enclosed and subsequently abandoned during the city’s expansion [10]. As a result, vacant lots differ significantly in their characteristics and conditions, which in turn influence their capacity to provide ES.
The concept of ecosystem conditions (EC), as developed in environmental science studies [30], is emerging as a powerful tool to support decision-making in socio-ecological systems, and it could also prove useful in exploring how different types of vacant lots contribute to the provision of ES. An EC is defined as the overall quality of an ecosystem in terms of its characteristics, such as vegetation, soil, and landscape connectivity [31]. The condition of an ecosystem underpins its capacity to provide services, and any changes in EC affect the provision of services [32].
At the international level, the United Nations has developed a statistical framework, the System of Environmental Economic Accounting (SEEA) [31], which links information on ecosystems to economic activities. This accounting framework aims to inform international policies by making the contribution of nature to human activities explicit, and the assessment of the EC is a key part of it [32]. At the national and regional levels, also encouraged by the SEEA and the European Biodiversity Strategy [33], several recent studies have developed EC assessments for supporting and improving environmental planning and management decisions [34,35,36,37]. These assessments enable the spatial prioritisation of restoration and preservation actions [38], which, beyond supporting biodiversity, generate co-benefits for climate change mitigation and adaptation by enhancing ecosystem carbon sequestration capacity and reducing environmental risk [39,40,41].
At the local level, EC assessment has received less attention, and very few experiments have been conducted [42,43]. Urban EC studies have primarily focused on assessing individual elements of vegetation, such as tree canopy cover detected in urban areas, to link them with ES provision [44], or on exploring various combinations of natural and artificial components and their performances [42,45]. Another line of research has evaluated the overall ecosystem condition of different cities, districts, or natural areas to compare them, using indicators such as the total percentage of impermeable areas and the percentage of protected natural areas [46,47,48]. However, assessments of EC regarding specific spatial components of GI remain lacking. Here, ES-based approaches to spatial planning have so far primarily focused on mapping the current supply and demand of ES, with the aim of planning interventions to address mismatches and monitor the impacts of new actions [28,49]. Assessment of EC is still an underused approach in spatial planning at the local level. However, it holds significant potential for determining the health of GI in relation to its capacity to provide ES. Incorporating this perspective would enable the identification of green spaces that are in need of preservation or restoration strategies. At the same time, considering the demand for ES helps to reveal who benefits from these services and where needs are more urgent [50,51], ensuring that conservation and restoration efforts prioritise areas where beneficiaries are located. Against this background, this study aims to answer the following research question:
  • How can ecosystem conditions assessment, combined with ES demand, help to identify priority vacant lots for restoration and preservation decisions in urban settings?
To address this question, the study proposes a method for the analysis of vacant lots based on their EC and the demand for ES in their surrounding areas. The application of the method allows for the identification of vacant lots that should be preserved and those that require restoration interventions. The method is tested in the intermunicipal area of Northern Milan, one of the most intensively built-up and densely populated areas in Italy. The article is structured as follows: Section 2 presents the case study area. Section 3 provides a description of the adopted method, while Section 4 presents the results. Section 5 discusses the results obtained and the advantages and limitations of using EC to support land use decisions and provides concluding remarks.

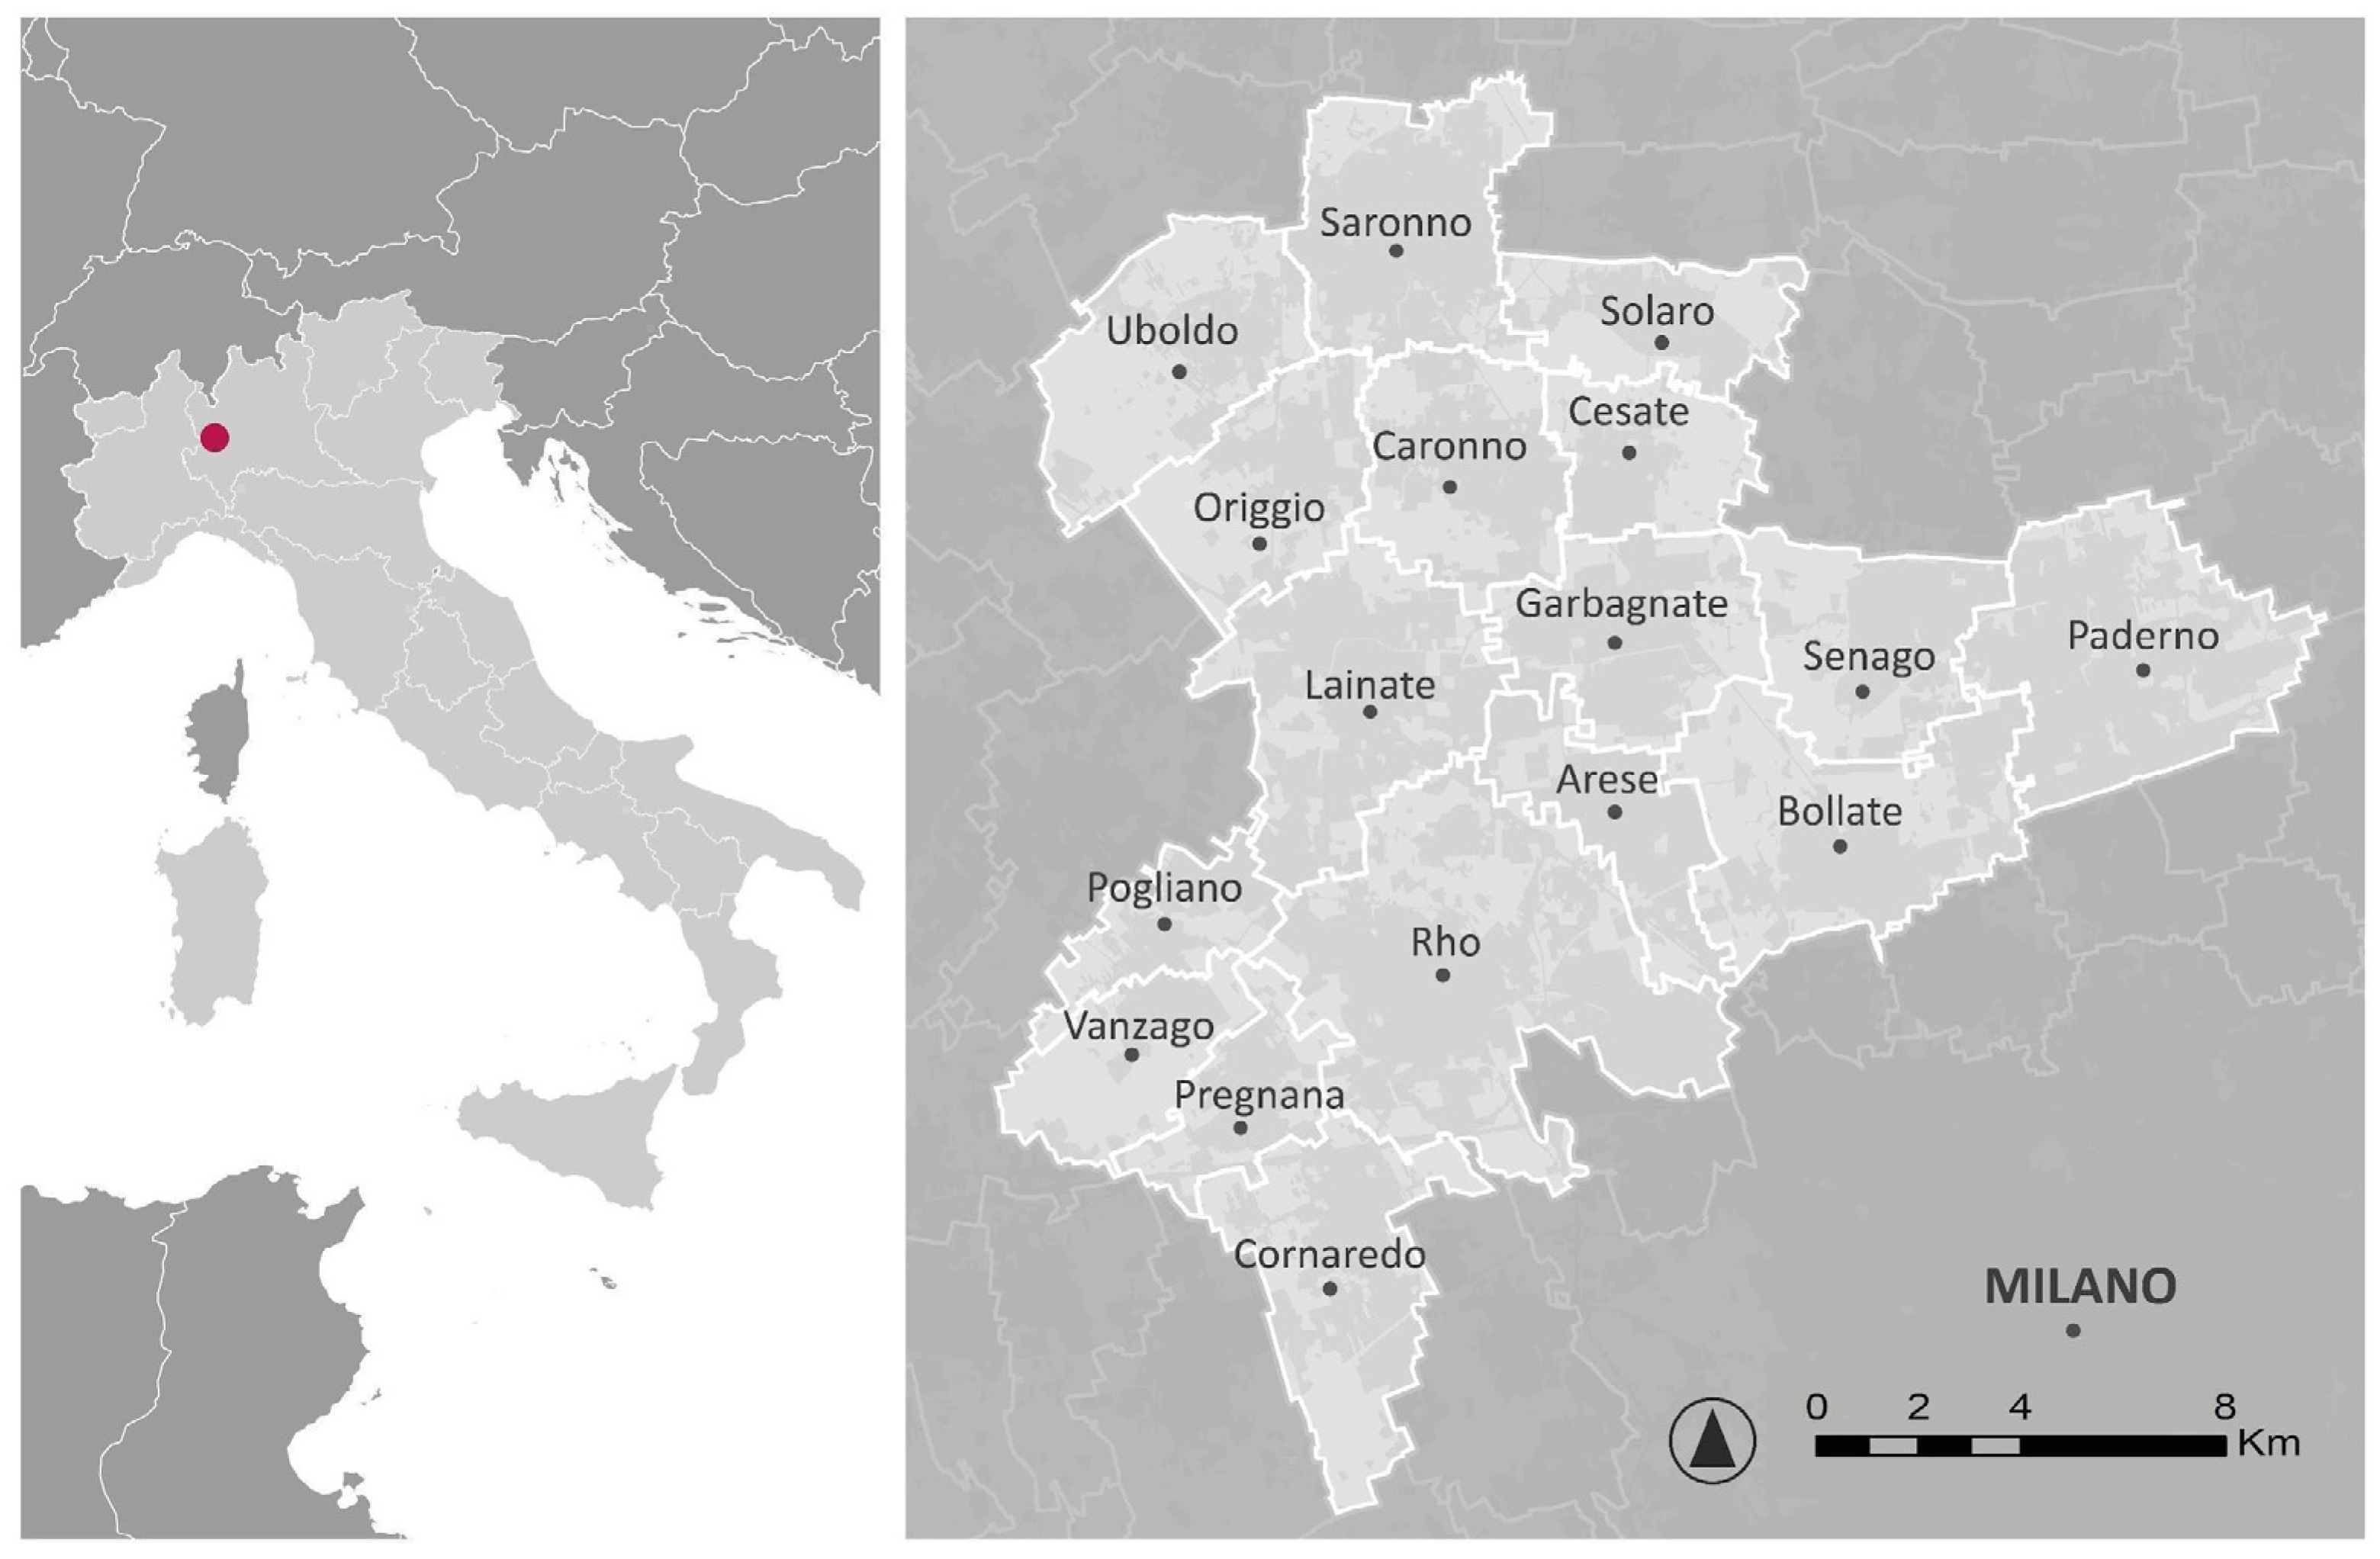
2. Case Study: The Intermunicipal Area of Northern Milan

The Northern Milan intermunicipal area is located to the northwest of the city of Milan, in Lombardy (Figure 1). Lombardy is the region with the highest rates of land take in Italy [52] and is among the most economically productive regions in the European Union [53]. The Northern Milan area encompasses seventeen municipalities, and it is one of the thirty-three homogeneous landscape units (Ambiti Territoriali Omogenei—ATO). ATOs are defined and identified by the Regional Landscape Plan to effectively manage, at a supra-municipal scale, policies concerning land take [54]. According to Regional Law 31/2014, each ATO must define criteria and guidelines to contain and mitigate land take. This involves considering landscape features and the actual production sites and housing needs associated with population growth, as well as the absence of alternatives to the redevelopment of urbanised areas.
The Northern Milan intermunicipal area has a population density of approximately 2300 inhabitants/km2 [55] and ranks as the second landscape unit in terms of urbanisation level (57%) following the urban core of Milan [54]. It represents a metropolitan peri-urban landscape, where urban sprawl has resulted in the merging of historic urban centres in an agglomeration with highly fragmented natural and semi-natural areas, linked by a variety of interstitial vacant lots. This spatial configuration is typical of metropolitan landscapes [56] and can be observed in other European areas, being particularly evident in metropolitan regions with a dispersed urban pattern, such as the Netherlands and southern Poland [57,58].
For the case study area, the Regional Landscape Plan emphasises the need to implement a GI with all the remaining available vacant land [54], but the demand for new building sites, both residential and productive, may be a threat to the conservation of these natural and semi-natural areas.

3. Materials and Methods

The method combines the assessment of ES demand and of EC for the suggestion of the most effective planning provision for a given vacant lot.
The assessment of the ES demand is useful in identifying where the ES provided by vacant lots are of greater importance for the population. Conversely, in areas with lower levels of demand, vacant lot preservation may not be necessary, and in cases where EC are low, further analysis could be conducted to assess their suitability for possible future infill developments.
The assessment of EC complements the assessment of ES demand with a double purpose. Among the lots to preserve where ES demand is highest, it helps to identify those that require environmental restoration interventions to improve their capacity to deliver ES. On the other hand, for vacant lots located in areas with low demand for services, the EC assessment is the basis for defining their level of preservation. The lower the condition is, the lower the proposed level of preservation for the lot.
The quantity and quality of the provision of ES depend on the condition of certain ecosystem components. Not all components of an ecosystem are equally essential for providing a service. For instance, in the case of runoff mitigation service, landscape connectivity characteristics are not relevant because the ecosystem can provide the runoff mitigation service independently of ecological connectivity conditions. Therefore, following the identification of ES pertinent to the case study (see Section 3.1), descriptive indicators of vacant lot ecosystem components were determined and subsequently associated with the corresponding service. The identification of priority areas of intervention for restoration actions and the definition of the preservation level of vacant lots will be determined based on the condition referring to multiple ES, not just one, the provision of which needs to be maintained and enhanced in the case study.

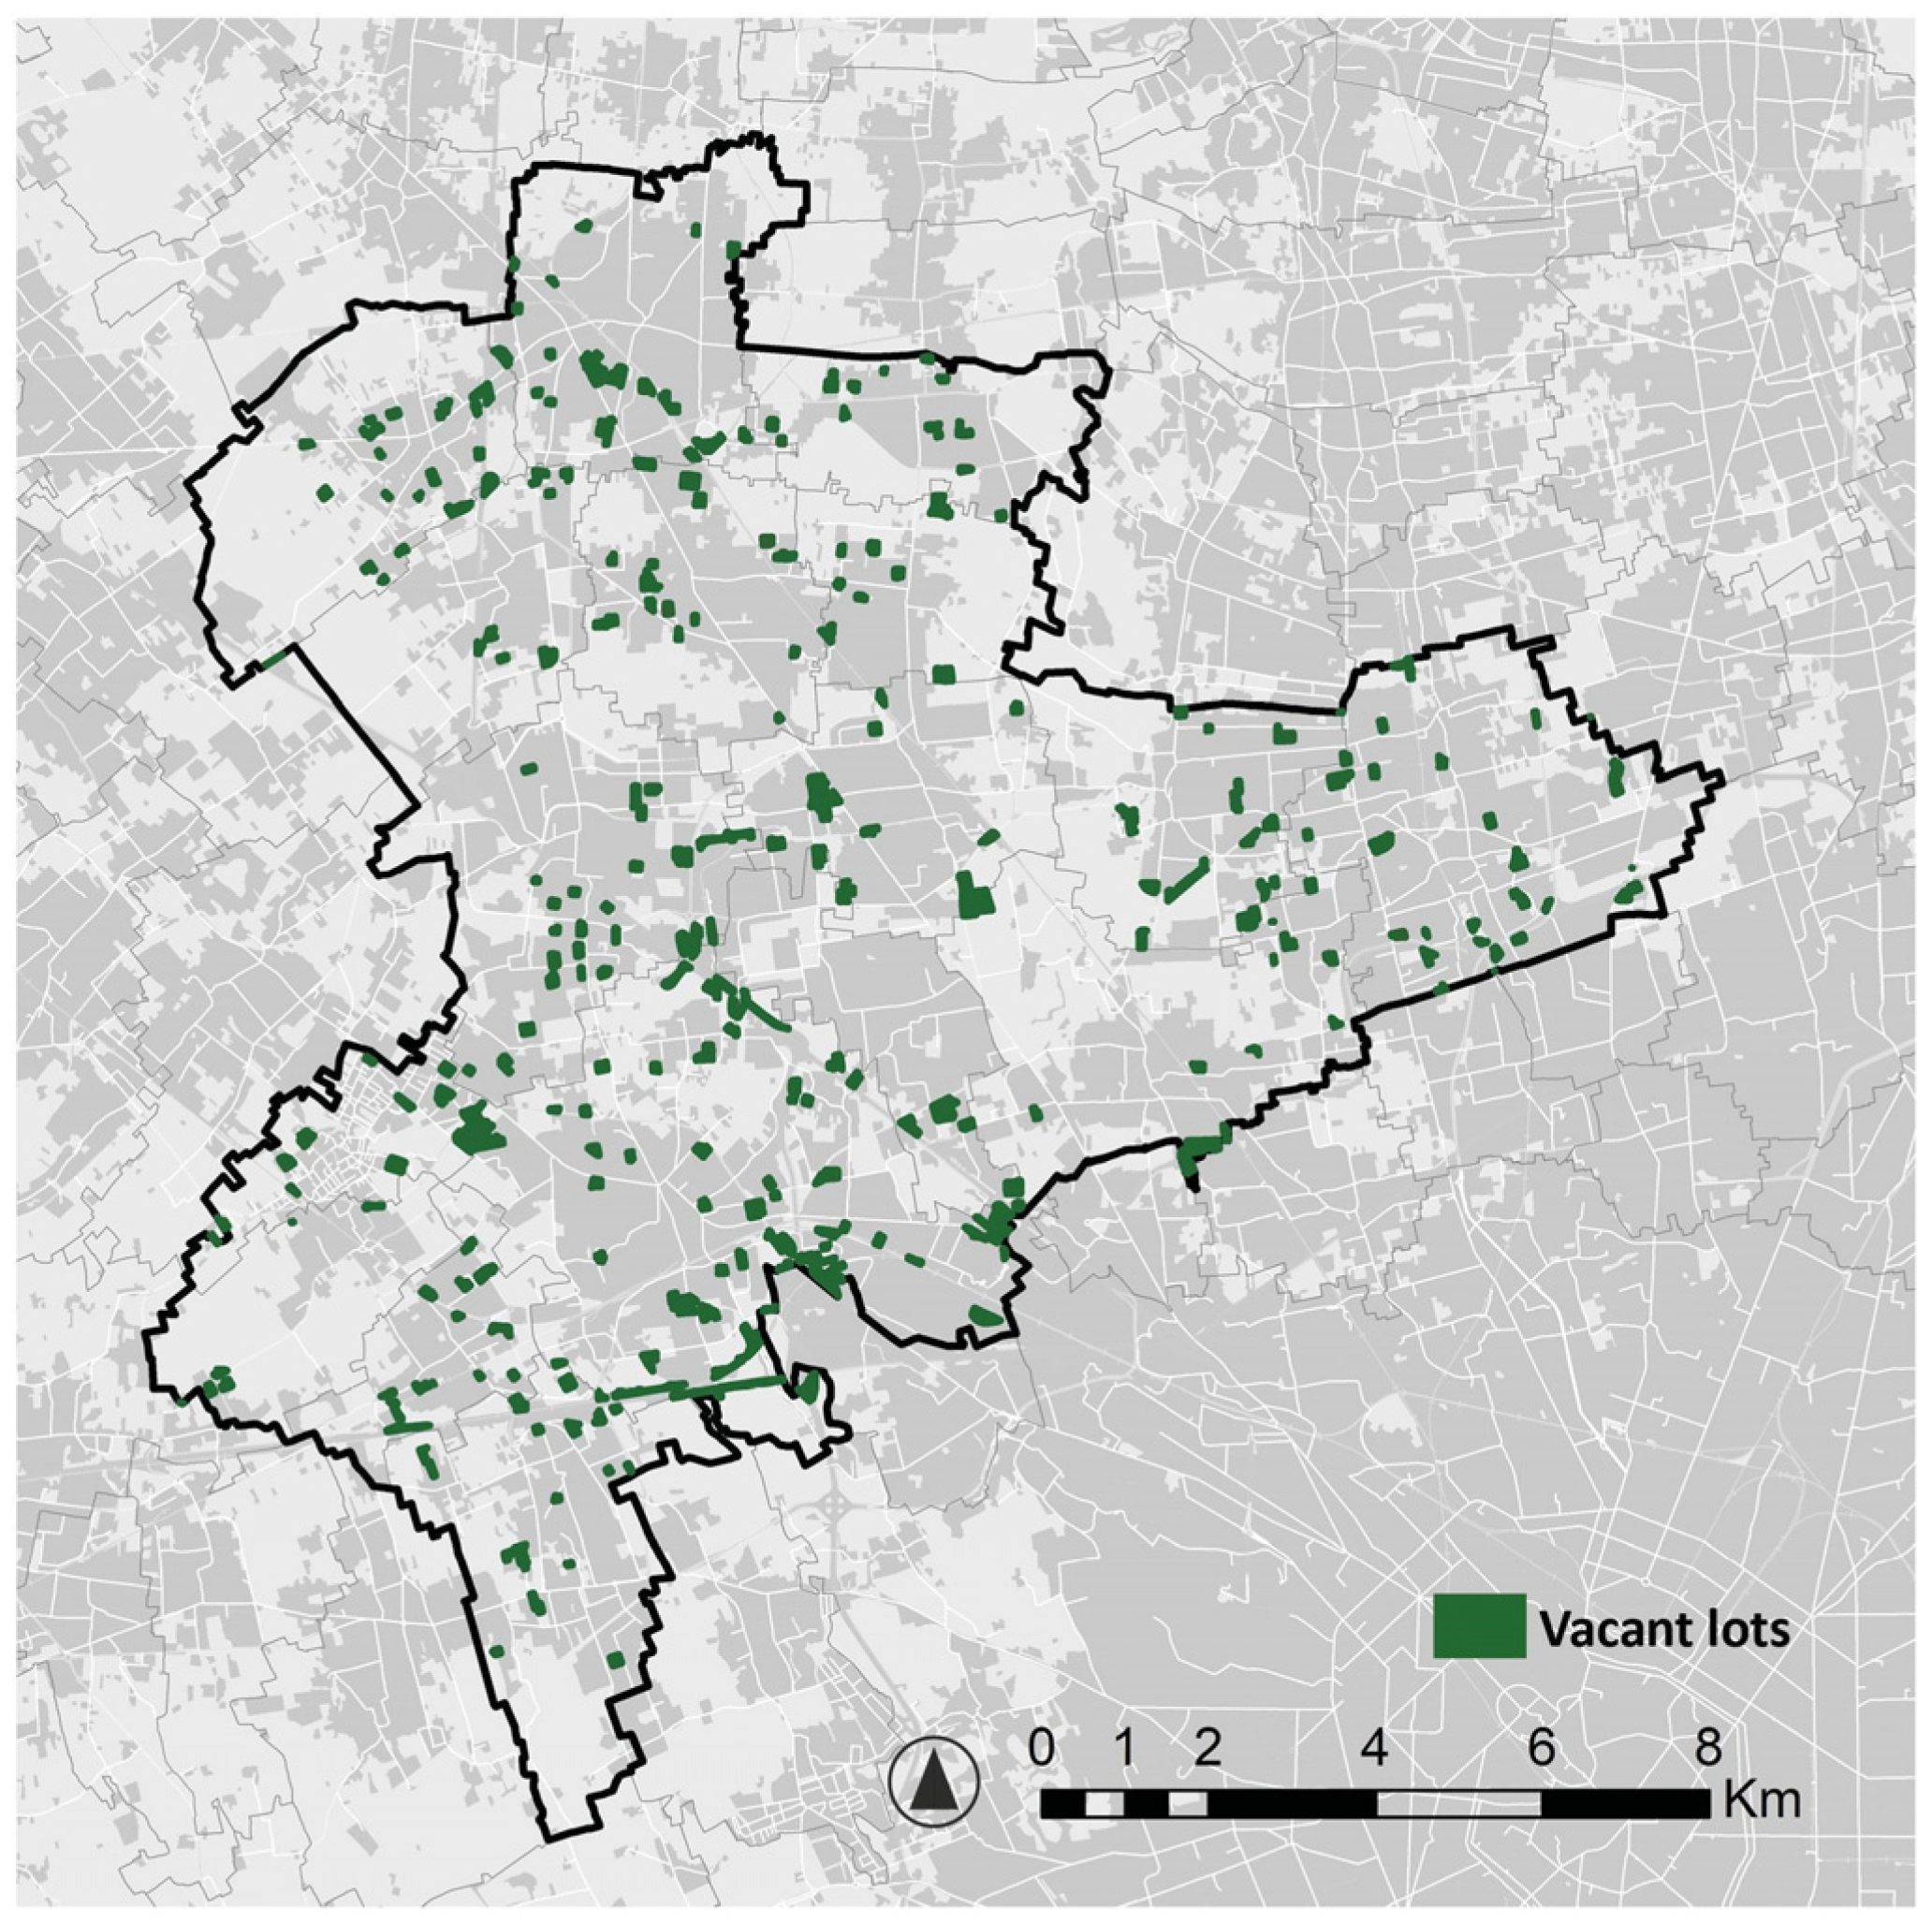
3.1. Identification of Vacant Lots and Selection of Ecosystem Services

The study identifies vacant lots with a minimum size of 100 square meters in the Northern Milan intermunicipal area through the open-source DUSAF 6.0 land use/land cover dataset, which the Lombardy Region developed in 2018 [59]. The information was obtained from orthophotos with a pixel size of 0.2 m and satellite images with a pixel size of 1.5 m. The dataset follows the same classification criteria as the European Corine Land Cover (CLC) dataset but further classifies “green urban areas” into “parks and gardens” and “uncultivated green areas”. The latter class includes abandoned areas in the urban structure that cannot be classified either as agricultural land or as areas under transformation, and thus represents the vacant lots under study in this article. In order to improve the identification of vacant lots misclassified as being for agricultural use, we added areas defined as “without current use” by the Urban Atlas dataset. In the end, the vacant lots detected in the Northern Milan area numbered 309. Their size ranges to a maximum of 11 hectares, with a median value of 0.7 hectares (Figure 2 shows the location of vacant lots in the study area).
These vacant lots primarily provide regulating ES, which they can offer even in their current abandoned state. Regulating ES are ecosystem contributions to environmental regulation by mitigating impacts of natural events and human activities, and their effectiveness strongly depends on the condition of the ecosystem components [60,61].
The selection of relevant regulating ES was guided by their importance for the case study and by the urban planning challenges outlined in the Regional Landscape Plan and Milan’s Metropolitan Strategic Plan. The Regional Landscape Plan highlights the high fragmentation of the Northern Milan landscape and suggests integrating vacant lots into a green infrastructure (GI) to enhance connectivity, facilitate seed and species dispersion, and support the quality of remaining agricultural areas [54]. Milan’s Metropolitan Strategic Plan, under the vision of a “Green Revolution”, promotes climate change adaptation measures and actions to improve air quality [62]. Notably, the Metropolitan City of Milan is among the most polluted areas in Europe. Additionally, its high degree of soil sealing—with Northern Milan ranking as the second most urbanised area after the urban core of Milan [54]—exacerbates the effects of climate change, such as heat waves and extreme rainfall events. To address these environmental challenges, four key ES were identified as potentially supplied by vacant lots: air purification, runoff mitigation, microclimate regulation (cooling), and pollination.

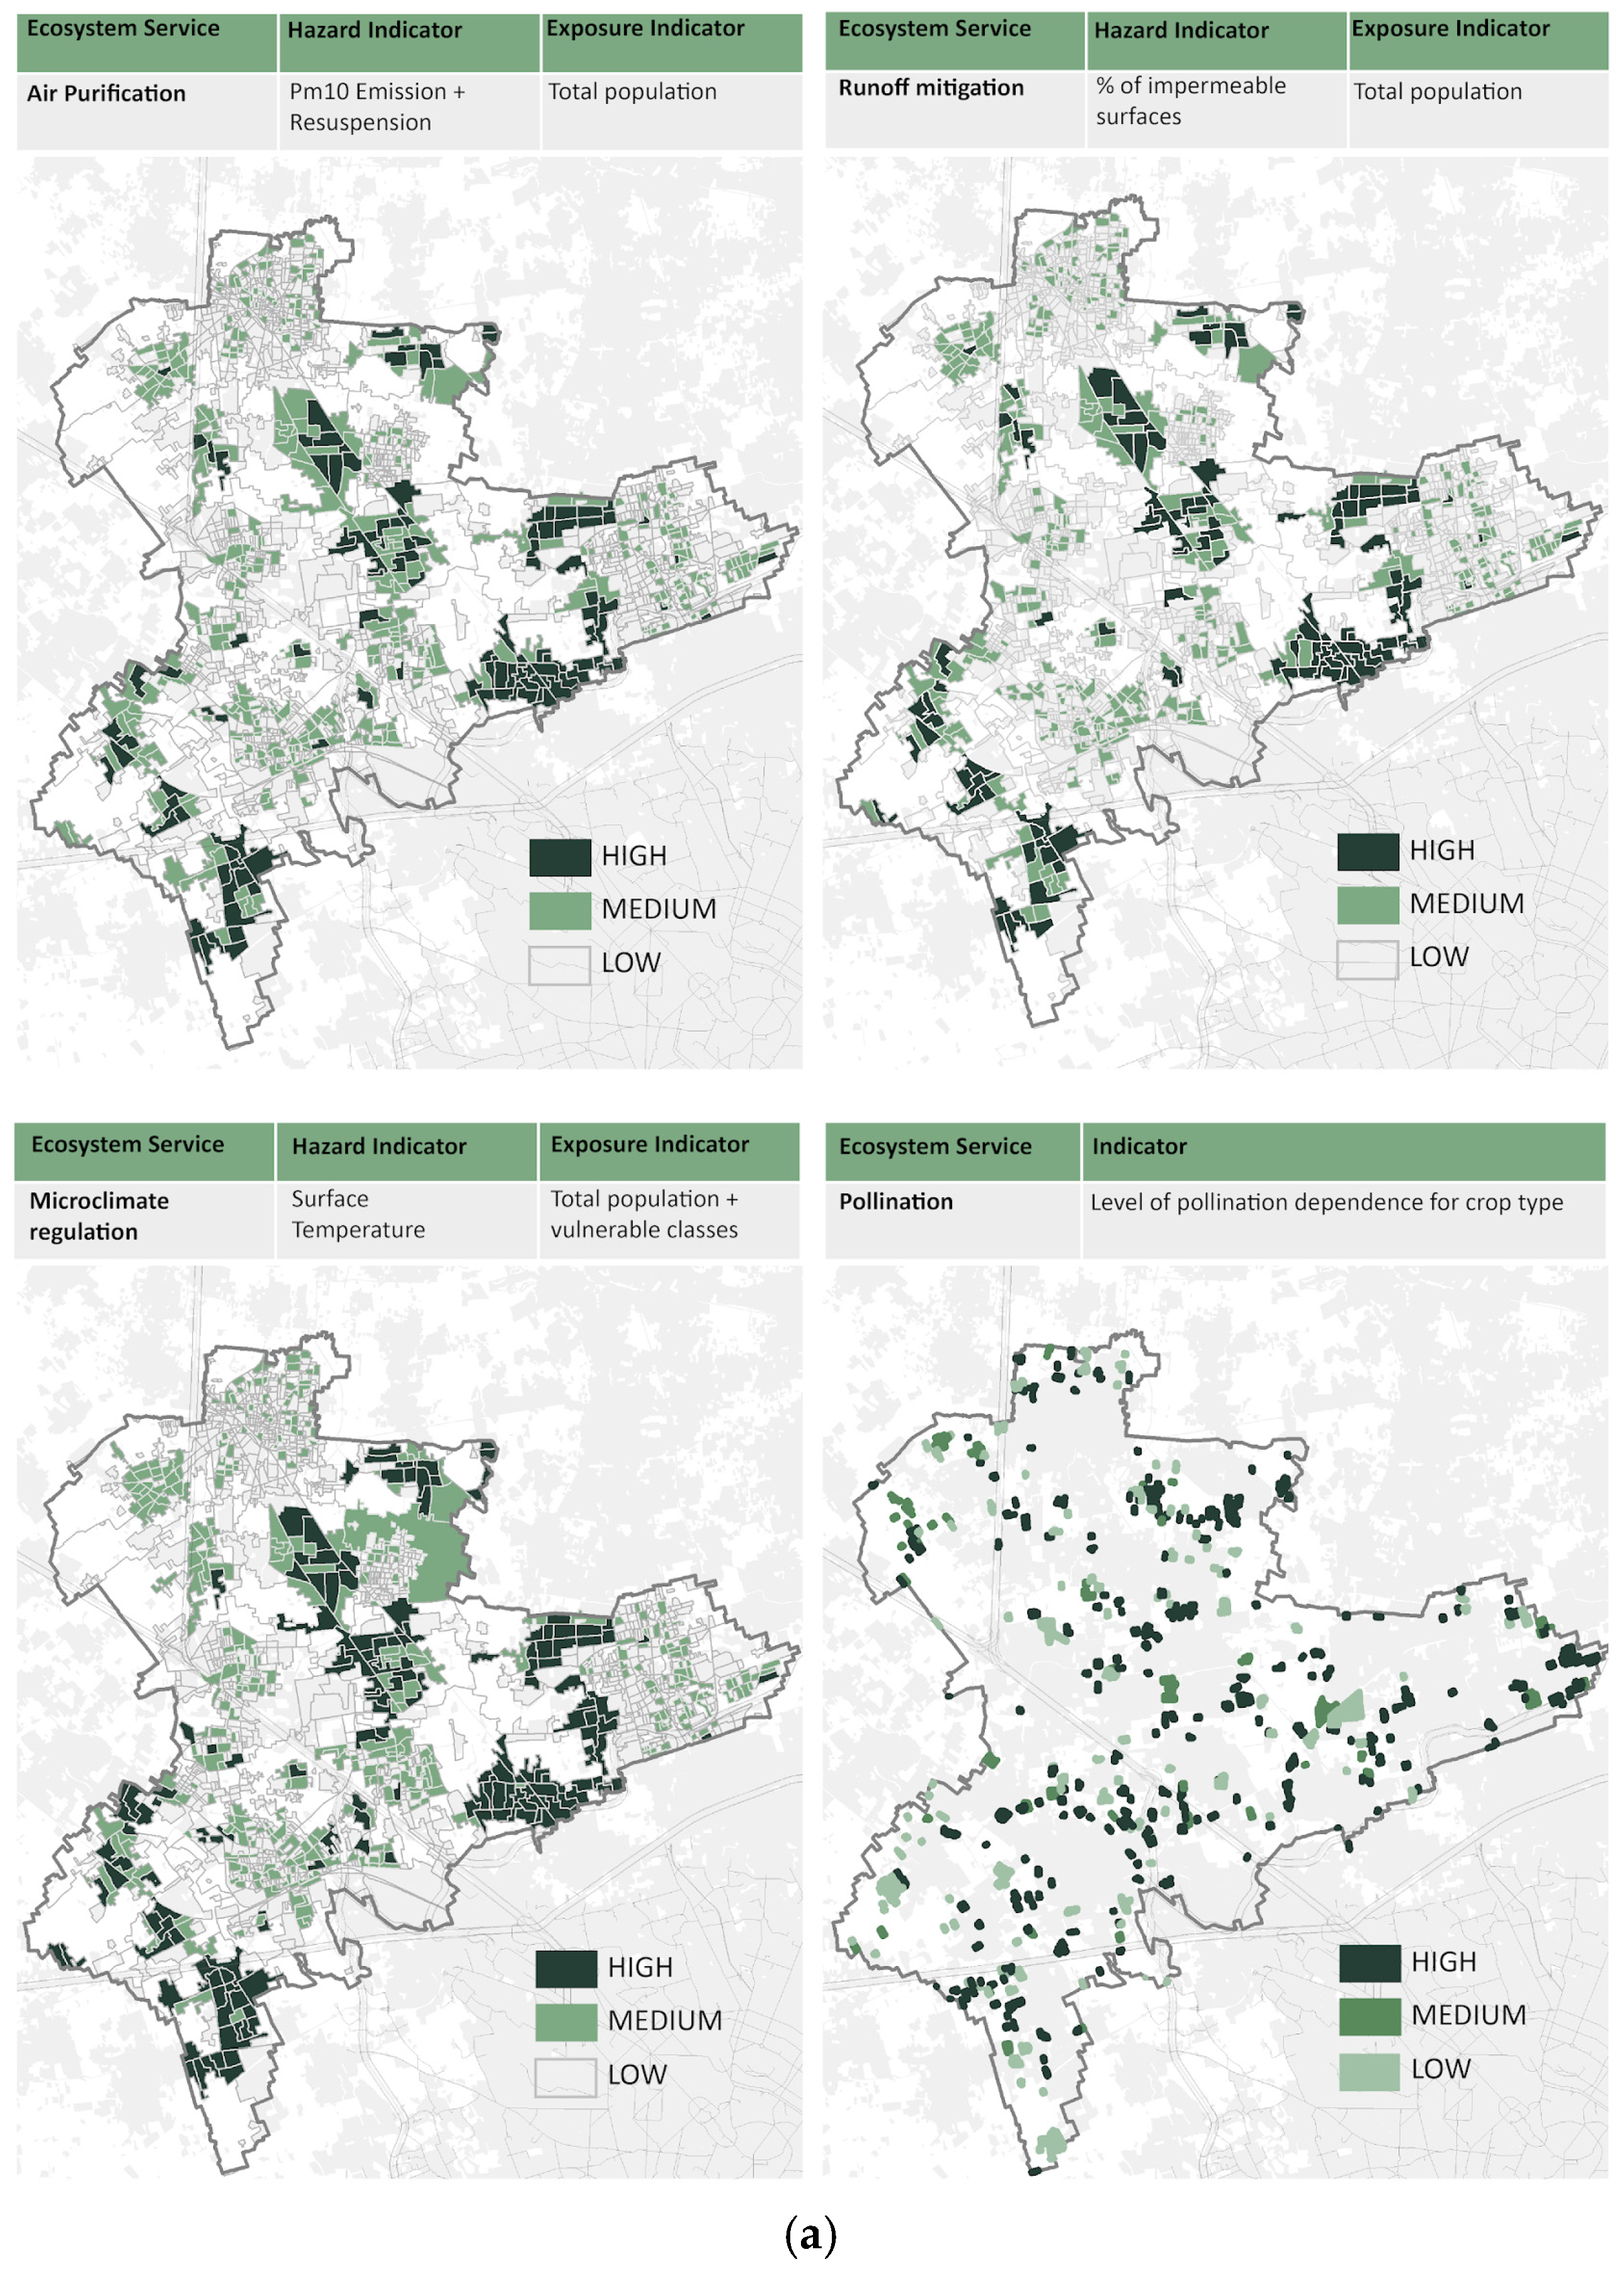
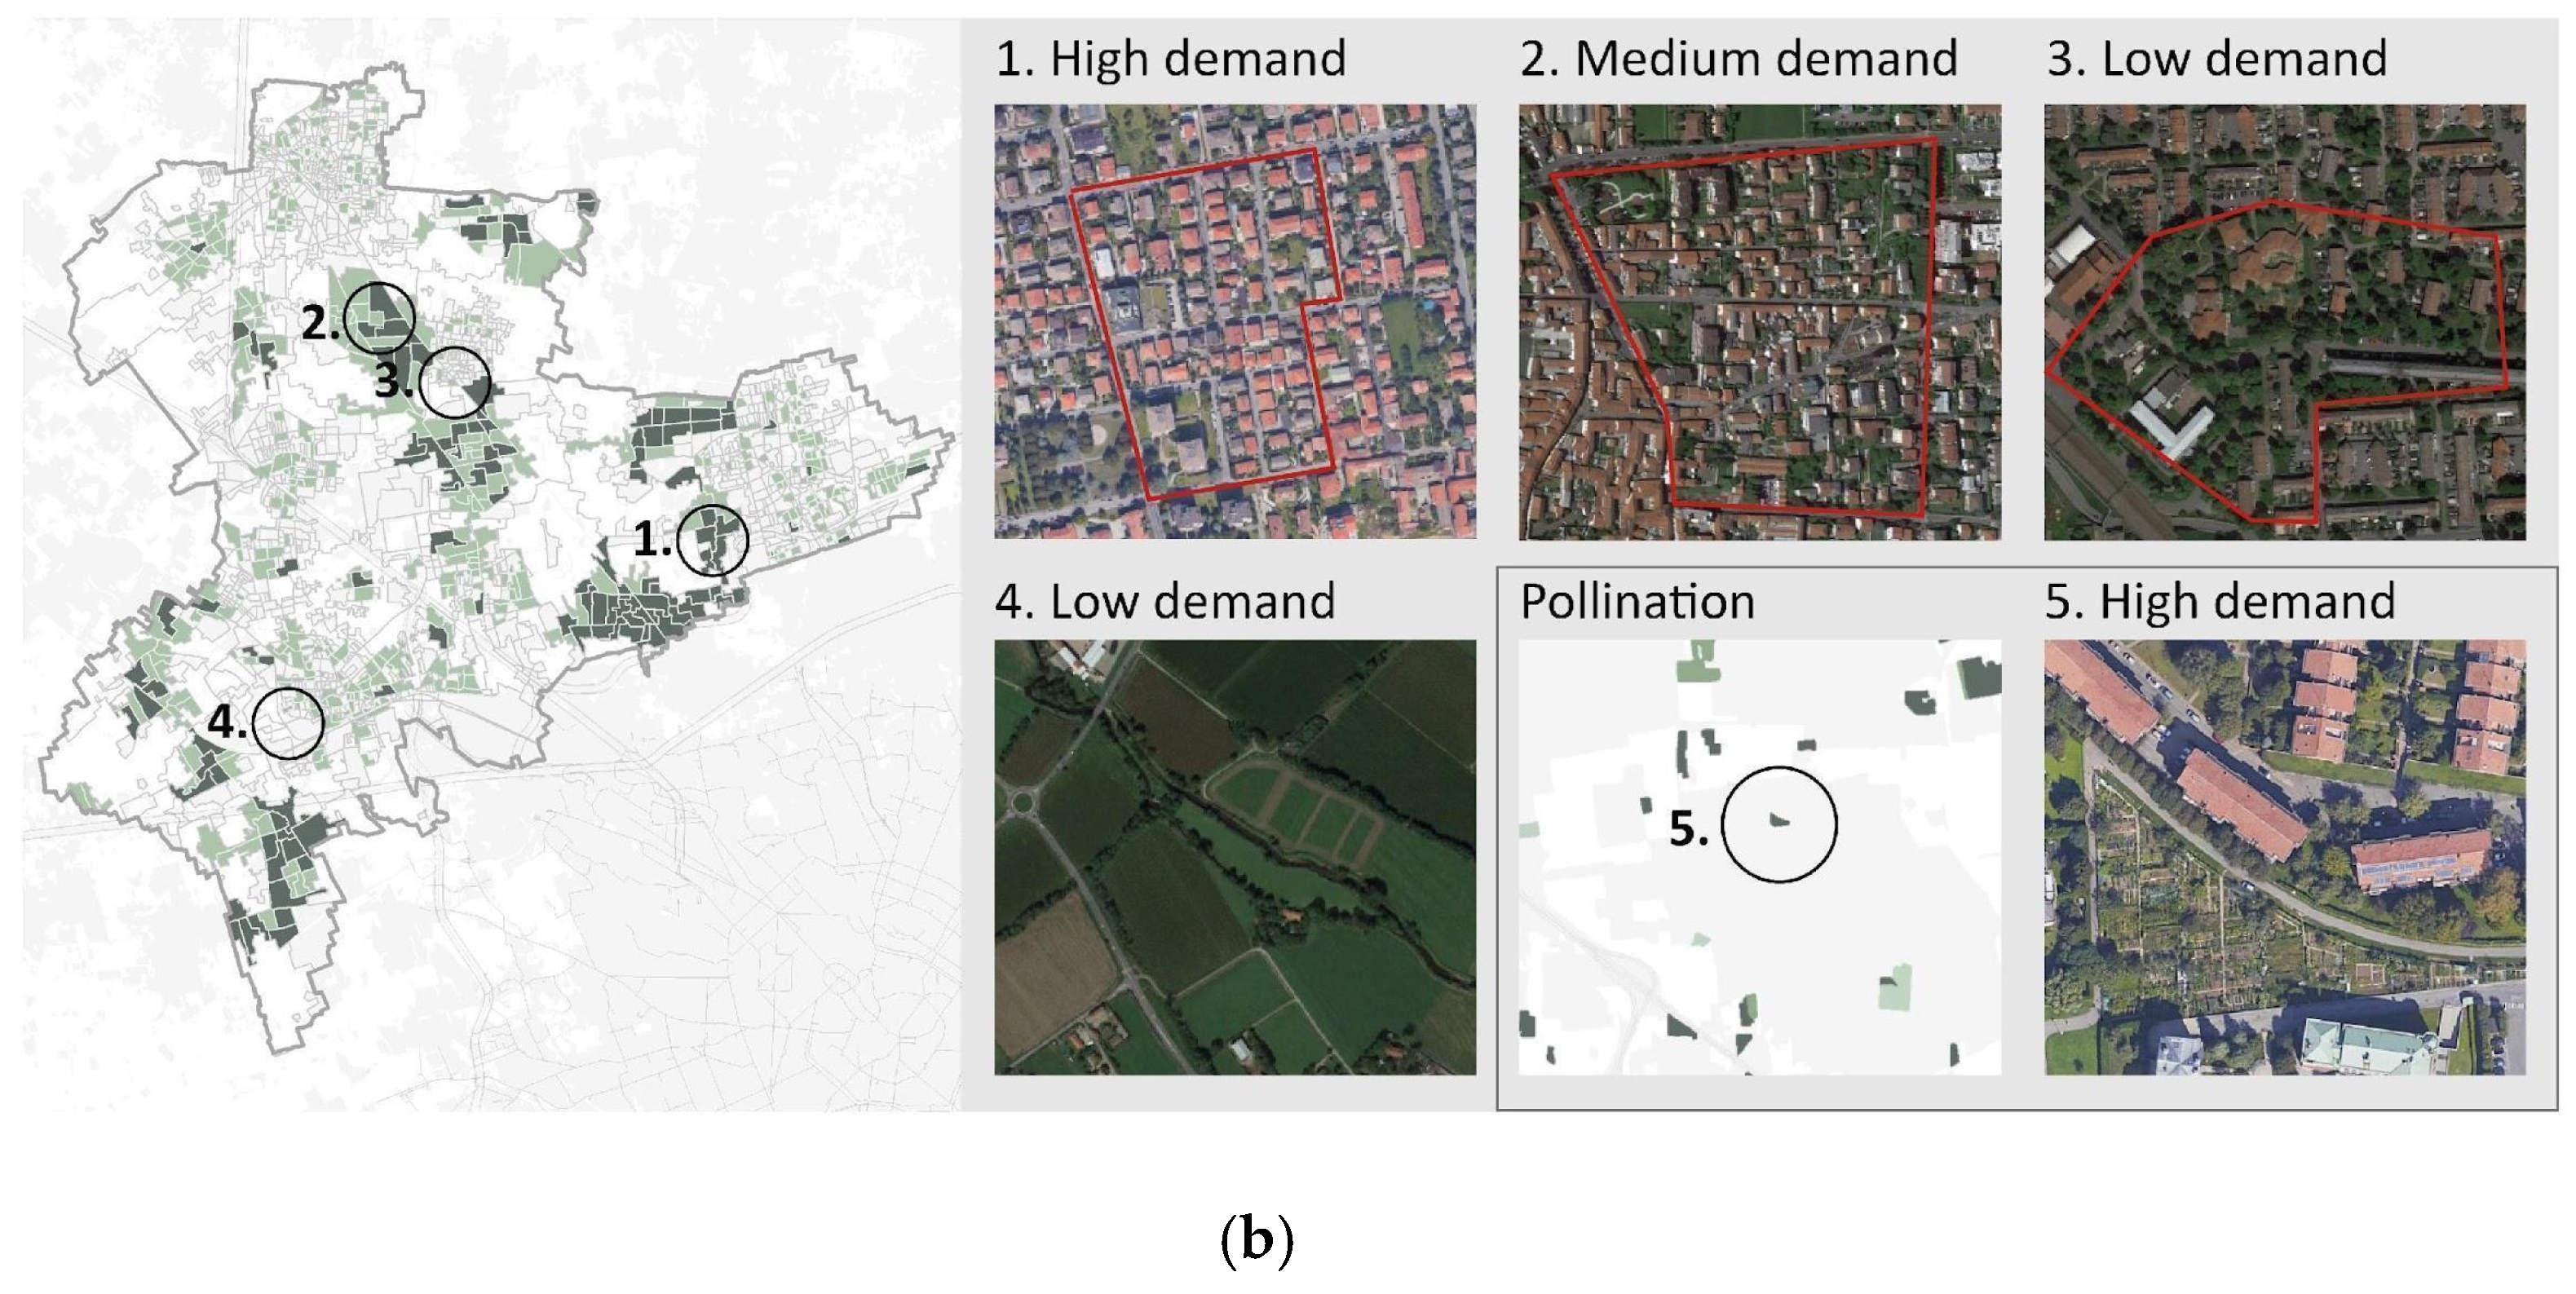
3.2. Assessment of Ecosystem Services Demand

The assessment of the demand for the four ES was developed using proxies and methods already available in the literature, summarised in Table 1. The data results for air purification, runoff mitigation, and microclimate regulation were organised by census areas, and they have been grouped by natural breaks into three classes: low, medium, and high demand for services. In the following subsections, the methodology used for the ES demand assessment is described in detail.
(a)
Air purification
The demand for regulating ES results from the combination of the risk of a dangerous event (hazard) with the necessity of protection for residents and assets [65]. Therefore, to quantify the demand for air purification, the total population of residents in each census area was considered as a vulnerability indicator. The hazard indicator, to describe the risk of air pollution, was developed using the model proposed by Salata et al. [63]. They associated the air pollutant emission sources with land use classes. PM10 emission data for the province of Milan were obtained from INEMAR Lombardia (Inventario Emissioni Aria) with reference to the year 2019, while land use information was based on the DUSAF dataset. Salata et al. [63] emphasise that when assessing air pollution, it is necessary to consider the resuspension of particles that cannot be absorbed by soil or plants. Therefore, the degree of impermeable surfaces for each census area was added as a proxy of resuspension dynamics in addition to Pm10 emissions data.
Equation (1):
D a i r   p u r i f i c a t i o n , i   = P m 10   E m i s s i o n i + R e s u s p e n s i o n i V p o p , i
Equation (2):
V p o p , i   = p o p i m a x ( p o p )
(b)
Runoff mitigation
The demand for runoff mitigation was assessed for each census area, considering the current level of soil sealing, directly related to reduced infiltration capacity. The soil imperviousness thus represents the hazard indicator for urban flooding, which was multiplied by the total resident population, representing the vulnerability indicator. The level of soil sealing was estimated as the average value within each census area of the Copernicus High Resolution Imperviousness Degree (IMD) layer for the year 2018, with a spatial resolution of 10 m.
Equation (3):
D r u n o f f   m i t i g a t i o n , i   = I M D i V p o p , i
(c)
Microclimate regulation
The demand for microclimate regulation was assessed, considering the Land Surface Temperature (LST) as an indicator of urban heat islands and the hazard during summer heat waves. LST is defined as a measure of how hot or cold the surface of the Earth would feel to the touch [66]. It has a strong relation with the urban heat island effect since artificial objects absorb more heat than vegetation, which is then released to the environment, especially at night [67]. The average of the LST within each census area was assessed with the Landsat 8 satellite image related to the thermal infrared band of July 2023 and with a spatial resolution of 100 m. Two categories of people most vulnerable to heat waves were added to the total population: children under the age of 5 and elderly people over the age of 65 [68].
Equation (4):
D m i c r o c l i m a t e   r e g u l a t i o n , i   = L S T i V p o p , i
Equation (5):
V p o p , i   =   p o p t o t , i +   p o p   < 5 y   a n d > 65 y , i p o p t o t + ( p o p   < 5 y   a n d < 65   y )
(d)
Pollination
The ecosystem service of pollination is threatened by changes in land use [69], but its contribution is essential for wild plant communities and for agricultural crops [70]. The most widespread crops in Northern Milan (maize and wheat) do not depend on animal pollination, though the rest of agricultural production benefits to varying degrees, and it is of particular importance for urban gardens [71]. In order to map the demand for pollination, we followed the methodology proposed by Fernandes et al. [64]. They provide a method that meets management needs at the local scale by setting a dependence level for each crop type. On the basis of data availability for the Northern Milan area, we assigned four different levels of dependence (no, low, medium, and high) for each class of agricultural areas defined by the DUSAF dataset and specified in Table 2. An expert ecologist double-checked the assigned level of dependence.

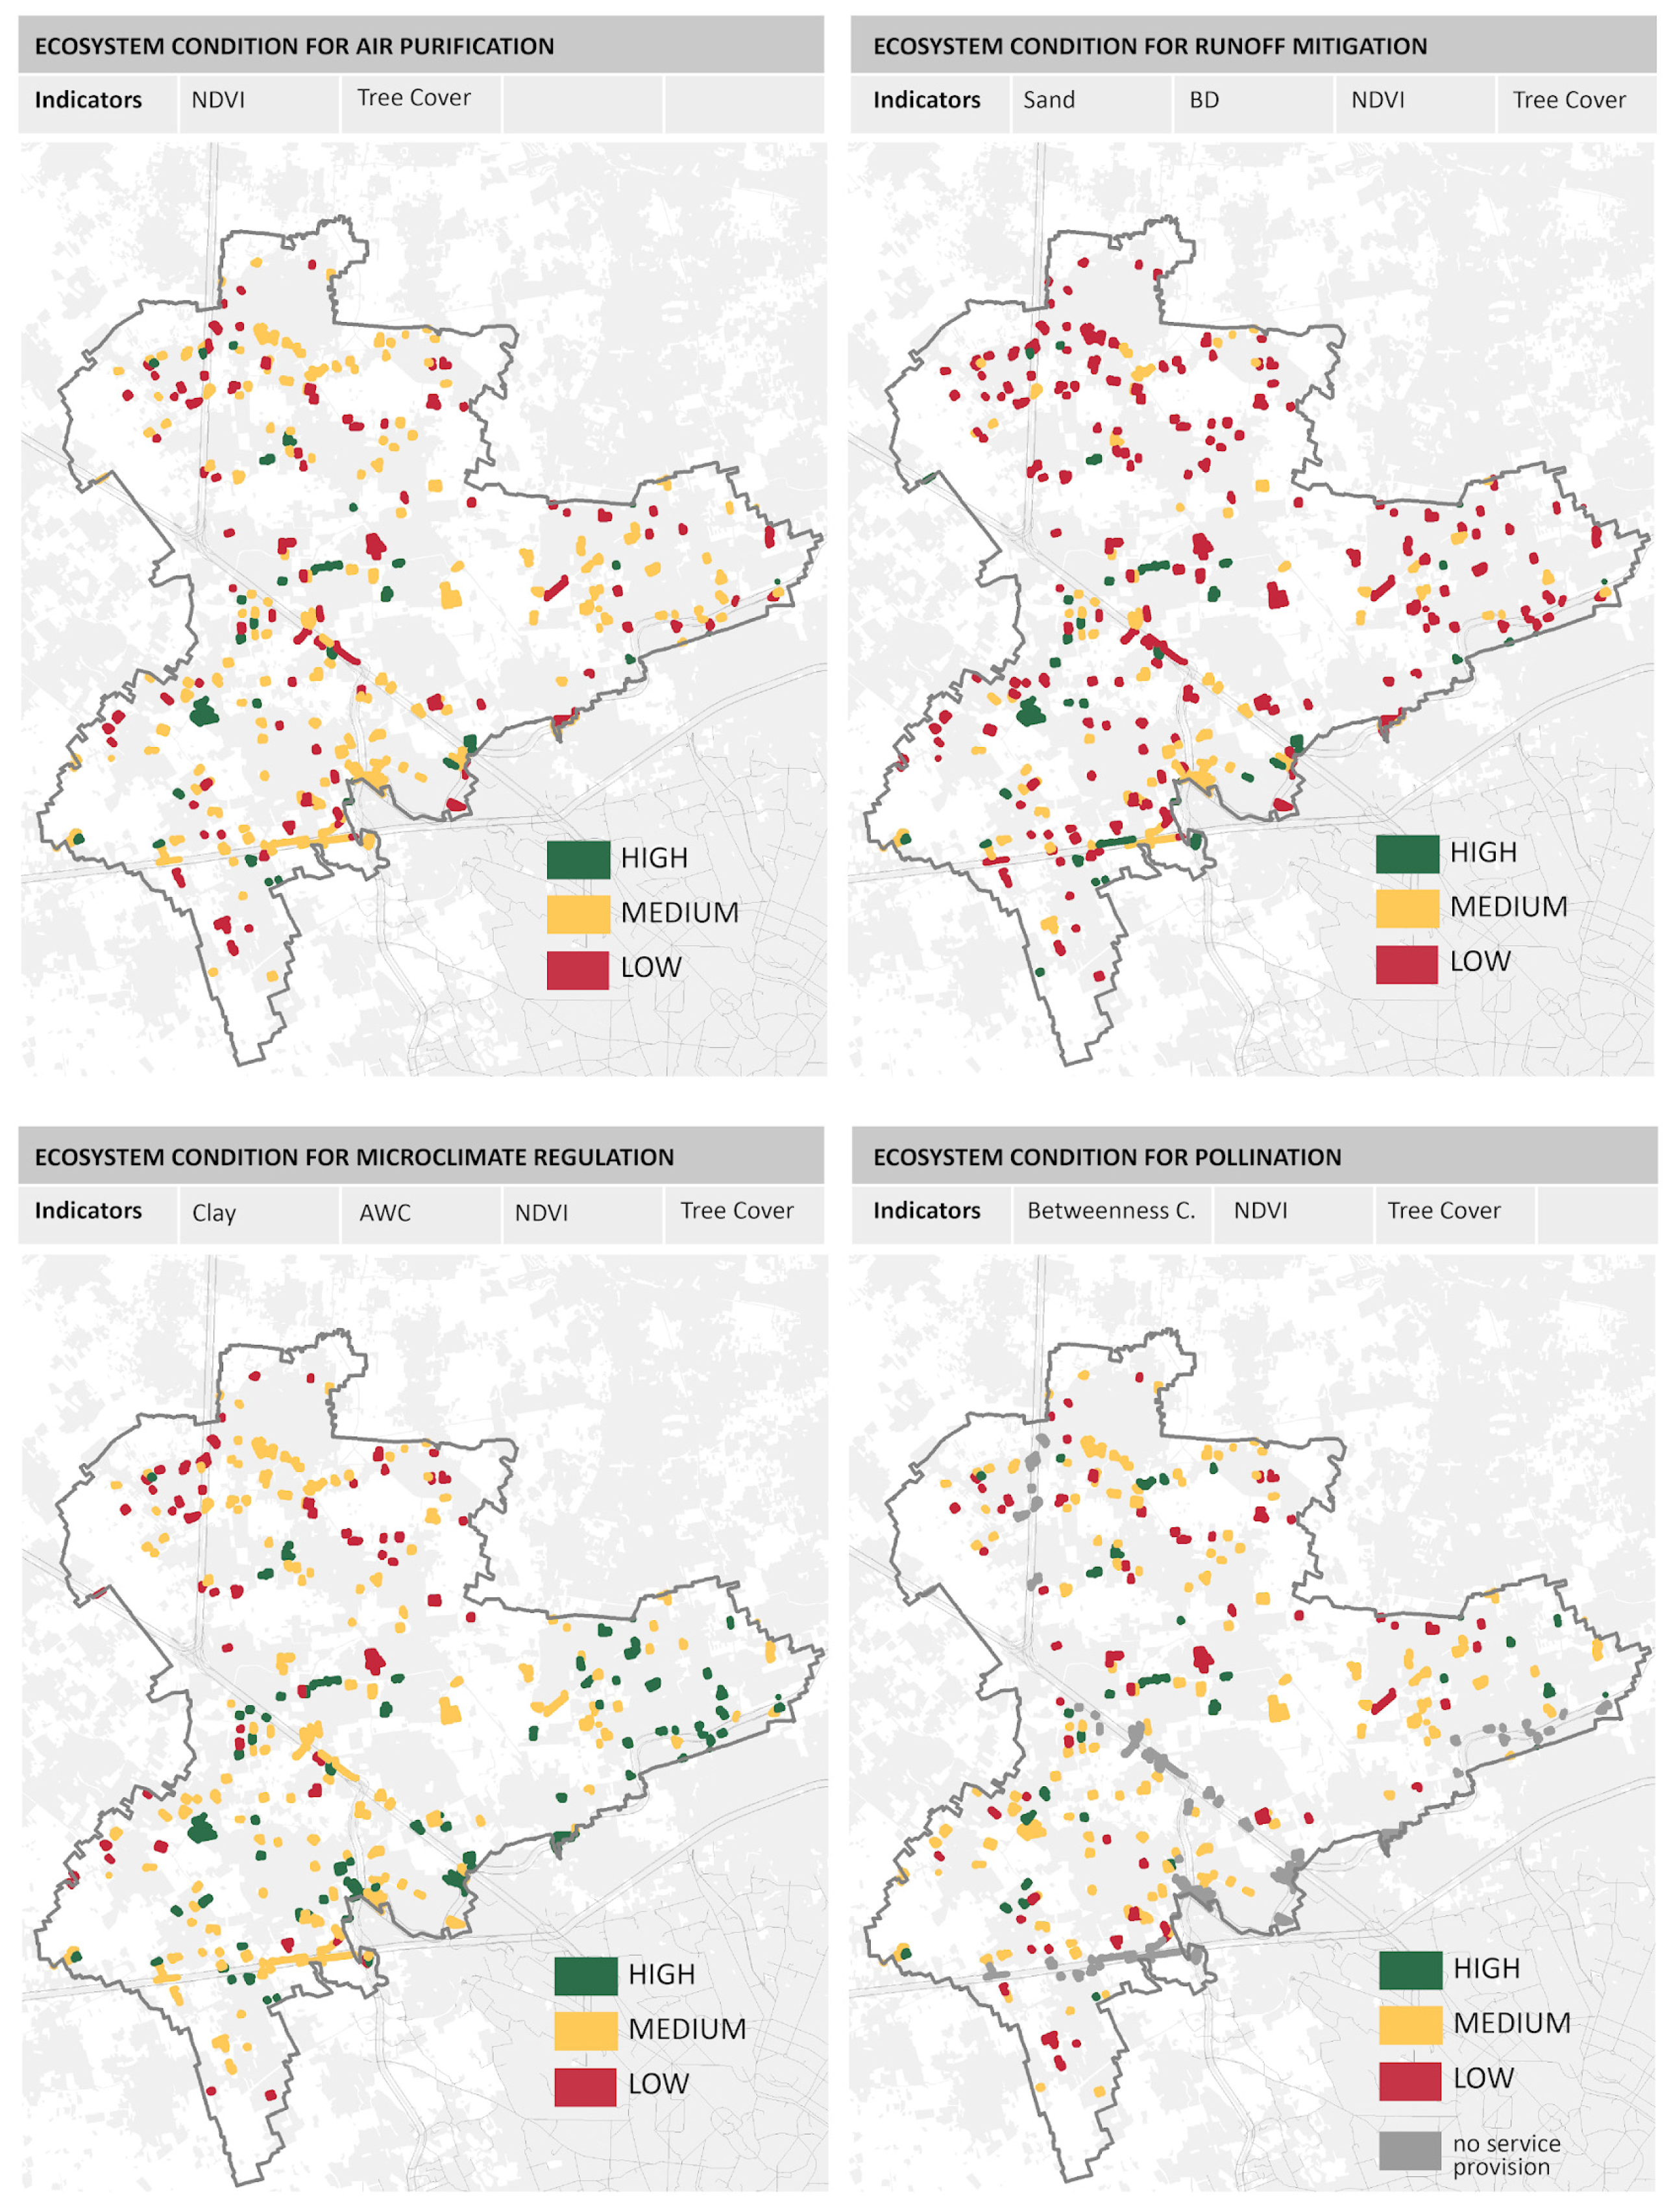
3.3. Assessment of Ecosystem Conditions of Vacant Lots

In the following subsections, we provide an overview of the methods employed for the assessment of ecosystem conditions. A detailed description of each indicator used and its related reference level is provided in the Supplementary Materials.

3.3.1. Indicators Selection and Reference Level Definition

The assessment of EC of vacant lots was based on the typology advanced by Czúcz et al. [72] for the System of Environmental-Economic Accounting Ecosystem Accounting (SEEA-EA). The proposed condition typology consists of six classes categorised in three main groups describing the components of an ecosystem: abiotic, biotic, and landscape connectivity. For each of the six classes, indicators are suggested, and those useful for describing the condition of vacant lots were selected based on data availability and considering the coherence with the local (urban) scale. For instance, Czúcz et al. [72] stated that geology features and soil composition should not be considered since they are stable characteristics that cannot change over time. However, during the study of ecosystems at a plot scale, it is important to know the characteristics of the topsoil, especially when considering them in relation to the provision of ES and the ultimate purpose of the condition assessment developed here. Therefore, to describe the physical structure characteristics of the abiotic component, we have also considered the percentage of sand and clay in the soil. Furthermore, metrics such as connectivity or fragmentation are recommended for describing landscape characteristics; however, they function at a large scale and are more suitable for accounting for regional conditions. Therefore, in this case, we selected centrality metrics [73], which may describe individual patch characteristics. Among the most used centrality metrics, such as degree centrality or closeness centrality, we selected betweenness centrality, which reflects the importance of a node in facilitating connections between all other nodes in the network. Accordingly, the removal of a vacant lot with a high level of betweenness centrality would indicate a significant disruption in species movement or seed dispersal.
All the chosen indicators are summarised in Table 3, along with the data used and the reference level identified for their measurement.
The data to describe the condition of the abiotic and biotic components of the vacant lots were derived from satellite images and their elaborations, as in the case of ESDAC data, and were queried in a GIS environment using the Zonal Statistics tool. In this way, it was possible to obtain a different value for each vacant lot and for each indicator. The methodology used to define the value of betweenness centrality is further specified in the Supplementary Materials supported by Figure S1.
Subsequently, as shown in Table 4, the indicators were associated with the four ES of the case study (air purification, runoff mitigation, cooling, and pollination) according to their relevance in describing the capacity of an ecosystem to provide that service. This was also essential to properly set the reference level, which is defined as the value of the variable corresponding to a state of ecosystem integrity, wherein its condition is optimal and against which it is meaningful to compare all values of the variable [32]. Considering that urban ecosystem conditions are related to the ability to provide services, the reference level in this case will refer to the minimum condition to perform that service [34,43]. For each indicator, a reference level was defined based on previous studies and by considering the case study of application (details in the Supplementary Materials). In the end, the indicator values were categorised into three classes, and the reference value, set based on a literature study, defines the limit between the class with the worst indicator performance and the class with medium or good performance.

3.3.2. Building Ecosystem Condition Indices

The EC indicators of vacant lots, assessed as specified in the previous section and Supplementary Materials, were then combined into four composite indices, each corresponding to one of the four ES examined in the case study, as reported in Table 4. To accomplish this, we followed two steps: normalisation and aggregation [74]. We decided not to assign weights to the different indicators because there was not enough evidence in the literature to quantify the importance of one condition indicator over another in providing the ES under analysis. In the normalisation phase, we employed a method commonly utilised in the development of composite indices [75]—specifically, a min–max technique. This approach divides each variable into intervals ranging from 0 (the lowest value of the condition) to 1 (the highest value of the condition).
In the aggregation step, we used the additive arithmetic method for combining the seven normalised condition indicators in the four final condition indices, each corresponding to a specific ecosystem service (as reported in Table 4). Furthermore, the previously normalised reference levels are also aggregated using the same additive arithmetic approach. In this way, it was possible to integrate the values into the final indices and provide a comparative baseline for assessing the current state of vacant lot EC in providing the related services. As with the indicators, we categorised the final indices into three classes: high, medium, and low EC. The limit between low and medium is defined by the normalised and aggregated value of the reference levels.

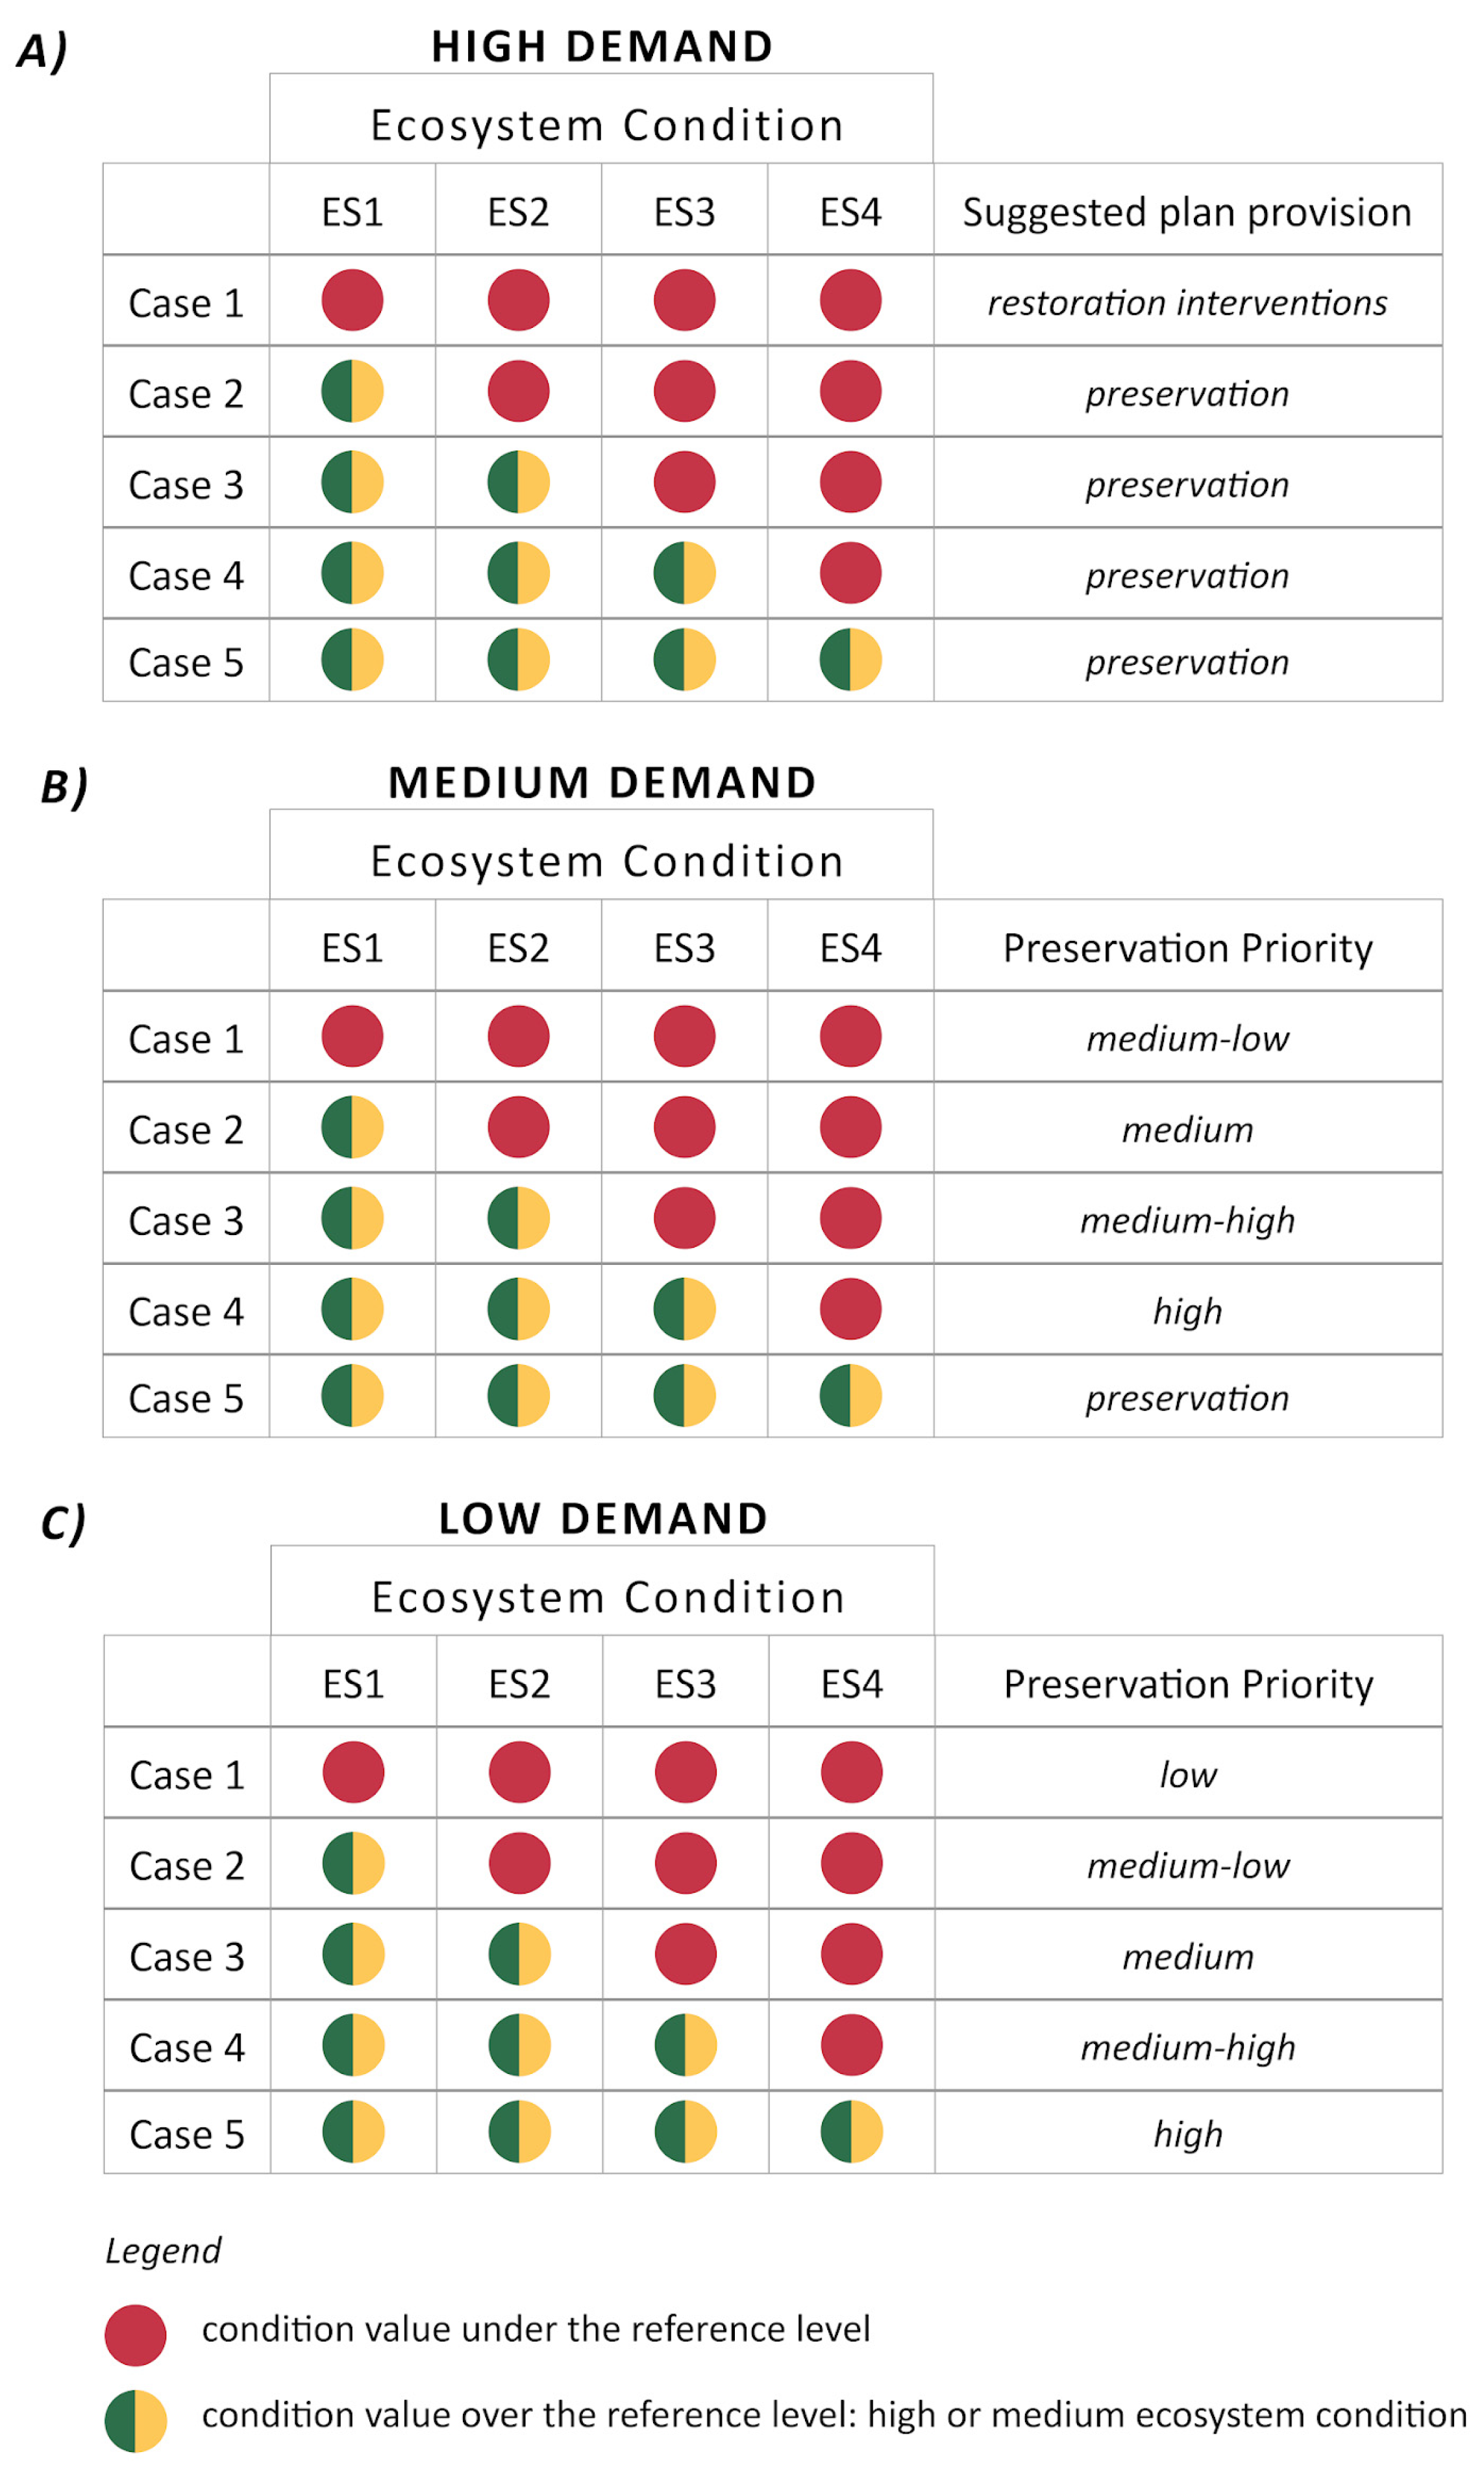
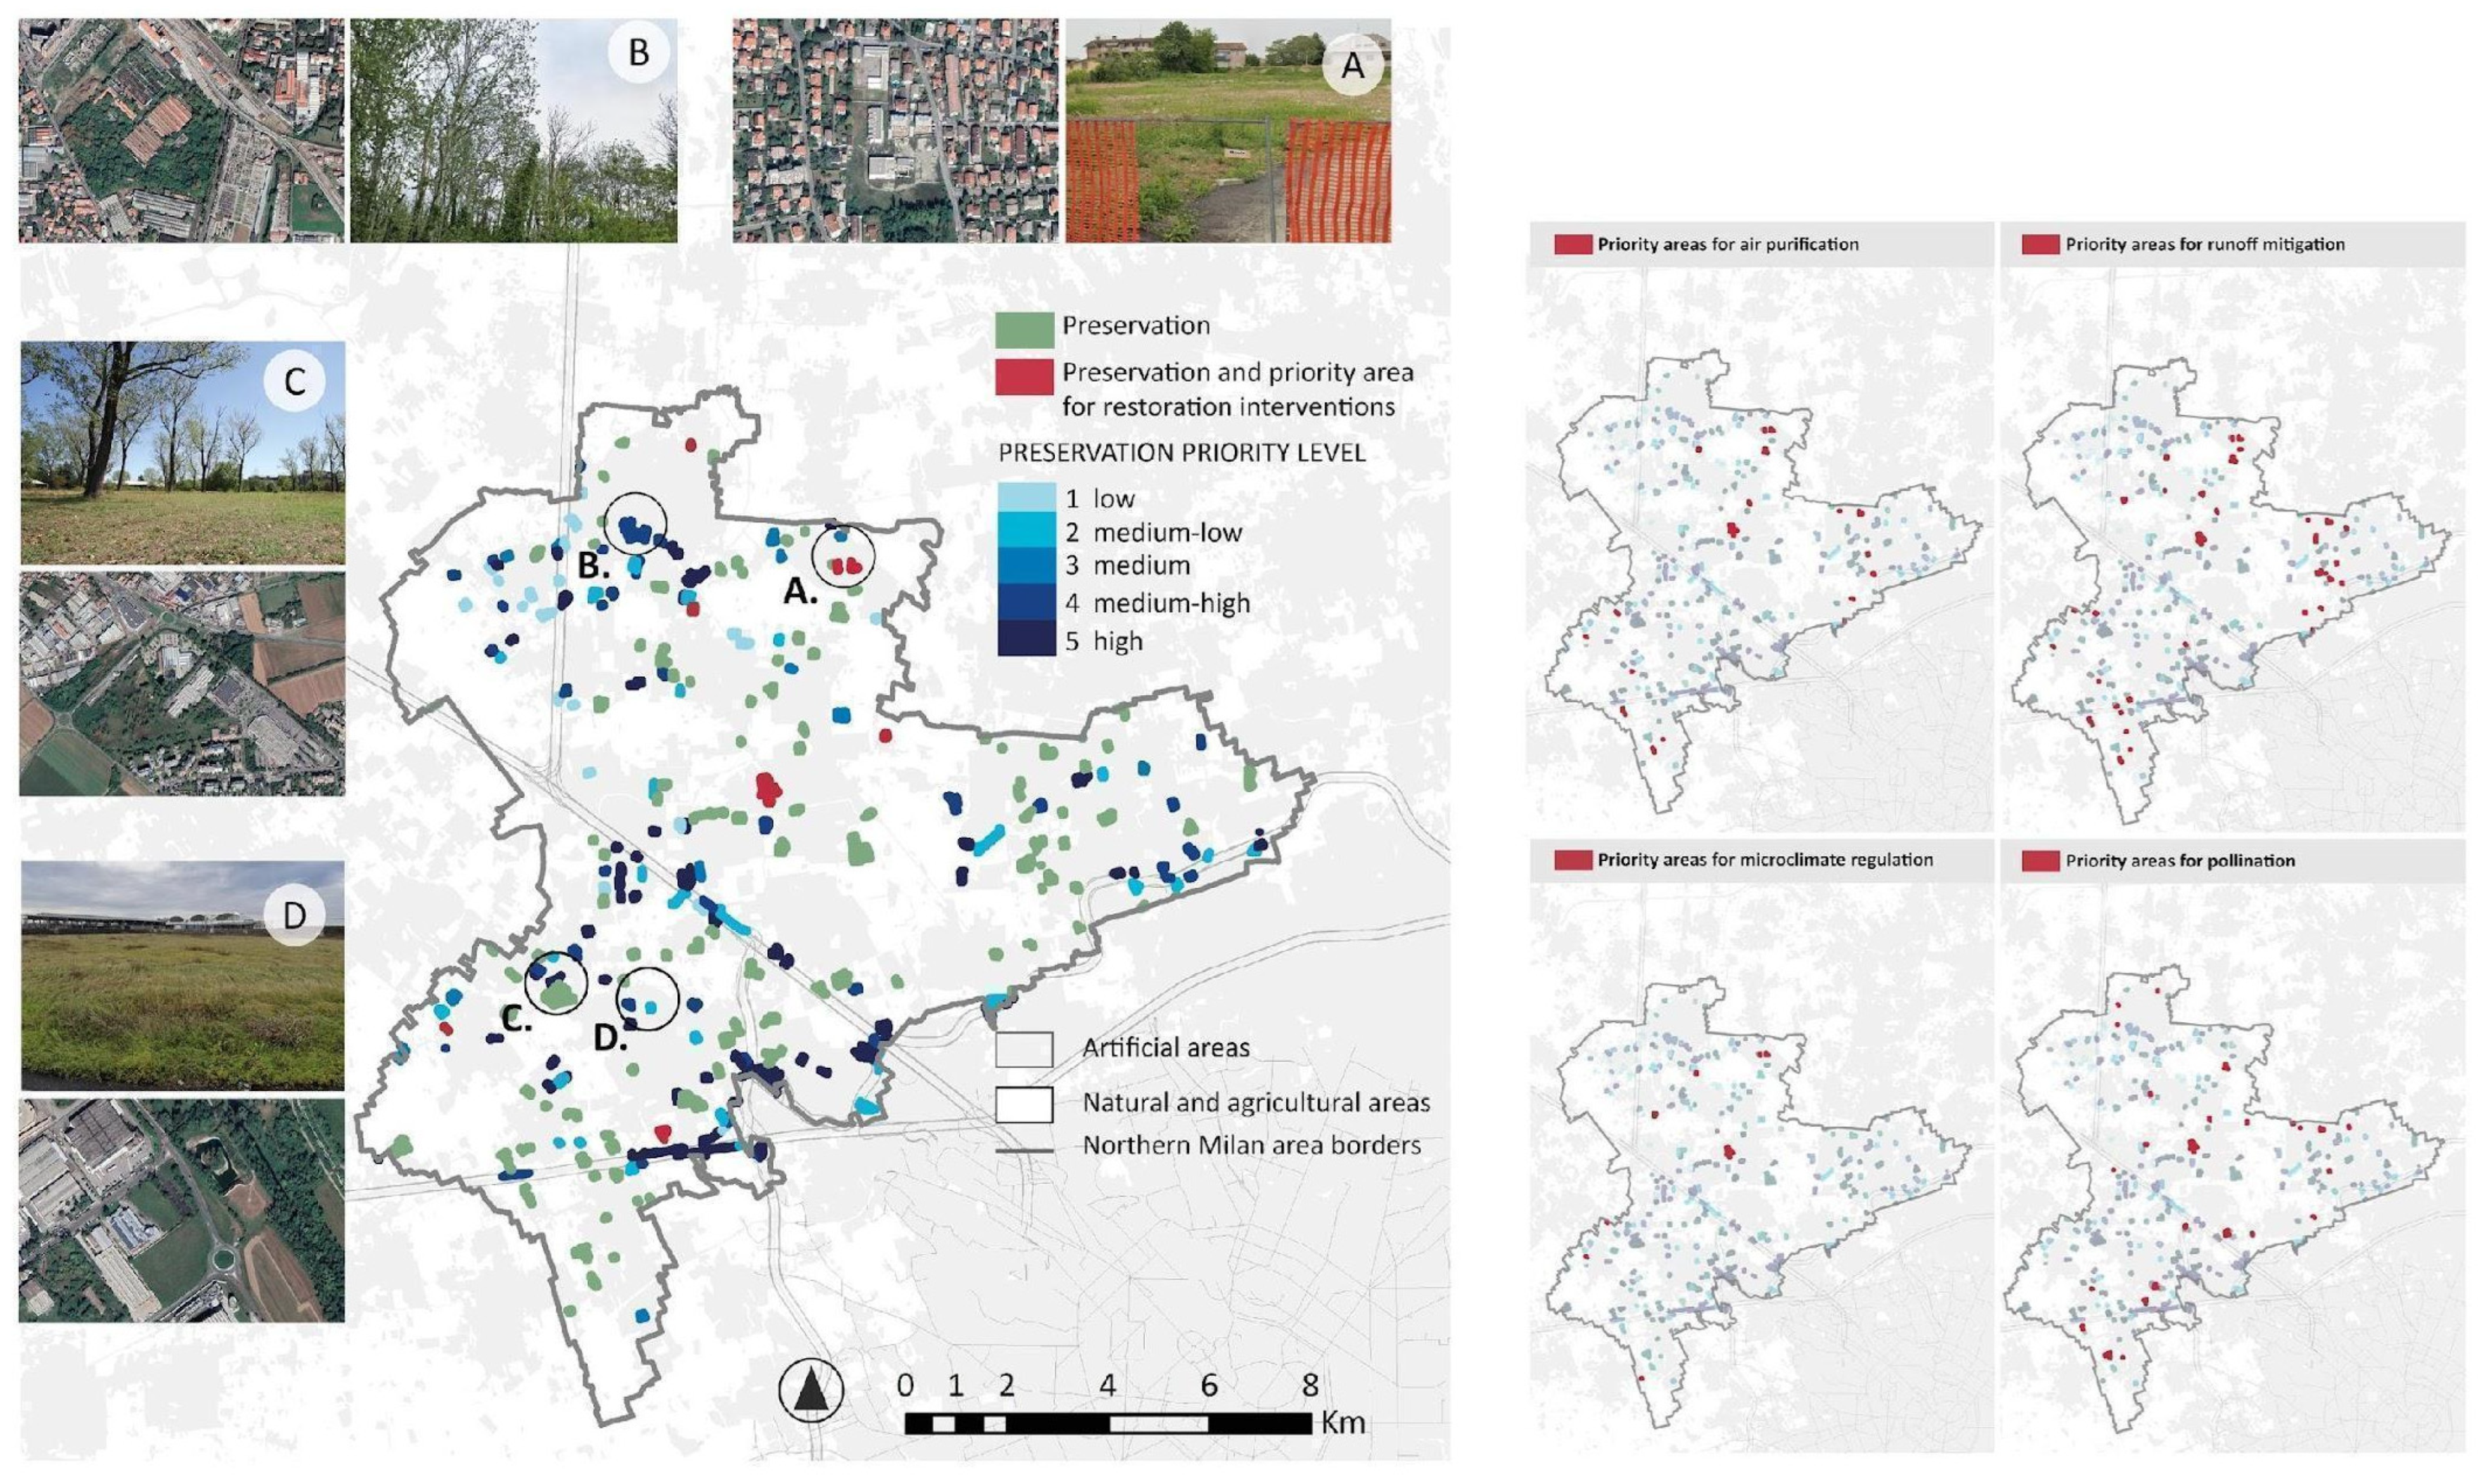
3.4. Combining Demand and Condition

After obtaining the maps of demand for the four ES and the EC of vacant lots, it was possible to overlay the results to identify priority vacant lots for restoration interventions and to define the level of preservation for informing land use planning decisions. The process is summarised in Figure 3 and described in detail here.
Starting from the results of the assessment of the ES demand, census areas with the highest level of demand for the ES of air purification, run-off, and cooling were selected. All the vacant lots in these areas are selected as priority lots, where development must be avoided, and will have to undergo preservation in cases of a high EC and restoration measures in cases of a low EC. For the ecosystem service of pollination, the agricultural areas with the highest levels of demand were selected. A 300-metre buffer (foraging area of the solitary bee [76]) is created around these areas, and the vacant lots that fall within it were selected for preservation or restoration depending on the value of the EC.
By developing different condition indices for each of the ecosystem services under analysis, it is possible to identify and implement appropriate restoration measures for improving the provision of the related service. For instance, if the condition of a vacant lot is low in run-off mitigation, the environmental restoration measures may involve actions such as increasing organic matter in the soil to improve water infiltration capacity.
For vacant lots located in census areas with low and medium demand, a different preservation priority level was defined for each lot based on the four final condition indices, which describe the characteristics of the lot in providing the four ES.
The classification was based on the condition levels obtained for the four services. The preservation classes of lots in low-demand areas were defined as follows:
(1)
Low preservation priority: Lots where none of the condition indices values exceed the reference level are included in this class, indicating a very low ecosystem condition.
(2)
Medium-low preservation priority: This class includes lots where only one of the four condition indices values exceeds the reference level.
(3)
Medium preservation priority: This class comprises lots where two out of four of the condition indices values exceed the reference level.
(4)
Medium-high preservation priority: This class comprises lots where three out of four of the condition indices values exceed the reference level.
(5)
High preservation priority: This class includes lots where all four indices values exceed the defined reference level, indicating a high ecosystem condition.
For vacant lots located in areas with medium demand, the preservation level was increased, suggesting total preservation for lots with a condition above the reference level for all four indices, and “medium-low preservation priority” was set when none of the condition index values exceeded the reference level. Therefore, in medium-demand areas, the “low” conservation priority level is excluded.

4. Results

The demand for the ES of air purification, runoff mitigation, and microclimate regulation is, as expected, influenced by the spatial distribution of population. Hence, although the demand levels were assessed considering different indicators (PM10 emissions, percentage of impervious surface, and surface temperature), the results have similar spatial pattern areas characterised by a certain level of demand that are mainly the same for the three services (Figure 4a,b). The demand map highlights to the southeast the urban centres of Senago and Bollate, the latter one adjacent to the ATO boundaries, closer to the city of Milan. On the northwest-southeast axis, between the main provincial road and the railway axis, the centres of Coronno and Pertusella stand out, characterised by high and medium demand for the three services.
Areas with high demand are characterised by the presence of a larger resident population and a higher percentage of sealed areas, which also influences the surface temperature. Census areas with medium demand for ES may have more permeable surfaces, but the factor that distinguishes them most from areas with high ES demand is the absence of high-rise apartment blocks with many units.
The areas with low demand represent industrial sites lacking the presence of a population, agricultural and natural areas, or low-density residential areas characterised by a low population and a high percentage of permeable surface and green spaces. The demand for the ecosystem service of pollination is substantially different, as it is related to the level of dependence on pollination by type of crop. Therefore, the high demand for pollination in the map highlights the presence of family or community urban gardens. They are located at the edges of the urban centres, often between the residential and industrial areas.
The overall EC for the four ecosystem services analysed, given by the combination of the corresponding indicators, is represented in Figure 5 and shows different results for each ecosystem service. The results of each indicator composing the final condition values are provided in the Supplementary Materials (Figures S2 and S3).
Concerning runoff mitigation, a greater number of vacant lots present condition values below the reference level than for the service of air purification, which was assessed considering the indicators of NDVI and tree cover density. This means that the inclusion of indicators related to the percentage of sand and bulk density for runoff mitigation service further decreases the overall condition, indicating lower performance values for these two indicators.
The EC for microclimate regulation shows a high percentage of vacant lots with an EC above the reference level, but the highest condition values are found more often in vacant lots located on the edge of urban centres, where the population is lower and, consequently, also the demand.
Regarding the pollination service, the condition values for vacant lots undergo another shift with the introduction of the betweenness centrality indicator, which describes the importance of a particular lot for ecological connectivity and does not depend on abiotic and biotic elements. This implies that vacant lots with a high EC level for pollination may also play an important role in planning green corridors. Vacant lots along the highway were excluded from the condition assessment for the ecological service of pollination since they cannot provide it [77].
The results of combining ES demand and the EC of vacant lots are shown in Figure 6. The final mapping shows the total number of vacant lots that should be subject to preservation since they are located in areas of high demand (or in low demand but high EC). Among these, we highlight vacant lots that show low EC for all ES and need restoration interventions to enhance supply. For the remaining lots located in low- and medium-demand areas, the preservation priority level is presented. Thus, we distinguish in this class mainly vacant lots enclosed in industrial areas or in residential areas with a significant presence of green spaces or a low presence of residents.

5. Discussion and Conclusions

The need to support land use decisions to face the dual challenge of densifying urban areas while simultaneously maintaining an adequate supply of ES and enhancing it where possible is a pressing one. To meet these goals, this article, by means of the case study of the Northern Milan intermunicipal area, provides an overview of the different ecosystem conditions of each vacant lot for supplying ES, which might form the basis for land use planning decisions. In fact, the assessment of vacant lots’ EC and their contribution to ES can form the basis for urban planning instruments and strategies that aim at strengthening the presence of nature in cities through preserving, restoring, and expanding ecological networks for climate adaptation purposes, as one of the key objectives of international strategies and of several urban plans across many spatial contexts. This is in line with Urban Greening Plans as prescribed by the EU Biodiversity Strategy for 2030 and with existing examples of Green Infrastructure Plans or Programmes, such as the New York City Green Infrastructure Program [78]. However, traditional institutional frameworks often struggle to adapt to complex and evolving challenges, such as climate change, urban sustainability, and biodiversity loss [79]. Therefore, the successful implementation of strategies and plans for preserving and restoring vacant lots as part of wider and complex ecological and green infrastructure networks requires integration within a multilevel and collaborative governance setting [79,80].
Specifically, the results of our article can support decisions about land use changes and development towards vacant lots characterised by a lower preservation priority level. However, this analysis relies solely on ecosystem conditions and does not consider other essential features that would determine the suitability for the transformation of a lot (e.g., public transport accessibility). The proposed methodology could, therefore, be integrated with other types of analyses assessing suitability for infill development.
The indicators employed and the final condition indices should be intended as a dashboard [81] to support policymakers. With the dashboard, it is possible to evaluate and monitor the trends of key indicators and identify priority lots for preservation or restoration interventions based on local needs. The combined indicators of ES conditions and demand reveal which actions should be taken to enhance the provision of a specific ecological service. Depending on the service of interest, the indicators can be combined and read differently in response to specific requirements. Moreover, the definition of priority areas where different types of restoration actions may be implemented could vary depending on the needs of the context and other factors, such as those related to available financial resources. The dashboard could, in fact, be used to allocate limited restoration funds to the highest-priority lots. Alternatively, during the decision-making process, and still guided by the dashboard, less costly restoration actions could be considered across multiple lots.
Studies on ES that were developed to support urban planning have so far primarily focused on assessing the demand and supply of ES in order to limit the negative impacts of new development [28]. The proposed approach helps to broaden the understanding of the current provision of ecosystem services. This makes it possible to identify and preserve those areas that, under current conditions, provide a significant contribution to ES, promoting conservation strategies based on their existing environmental role.
In relation to the research field of urban-scale ecosystem condition assessments, the proposed approach differs in terms of the research object and, consequently, also in terms of the ultimate purpose. Indeed, the goal of Nedkov et al. [45] and Kourdounouli and Jönsson [47] was to assess the conditions of the entire urban ecosystem, whereas Liu and Russo [42] focused on the GI, and Hanssen et al. [44] assessed individual characteristics of a single component of vegetation (tree canopy cover). The scale of the vacant lot assessment falls between that of the entire urban ecosystem and the detailed analysis of tree canopies. Hence, it can be considered in parallel with the scale of the green infrastructure conditions assessment. However, unlike Liu and Russo [42], this study assesses the conditions of a specific asset of green infrastructure, identifying differences among various vacant lots. Liu and Russo, by contrast, incorporated private green gardens into their analysis (another asset of the green infrastructure) but did not distinguish the differences in their conditions. In addition, the previous studies advanced condition assessments by categorising the urban ecosystem into subtypes based on the characteristics of the urban structure. Our proposed approach, on the other hand, is grounded in the assessment of the demand for ES. In this way, it is possible to address interventions where there is a greater number of beneficiaries.
The assessment of EC can be useful in supporting planning decisions through the introduction of a reference level, which allows for a consistent classification and description of condition values. Indeed, as claimed by Keith et al. [32], reference levels provide an explicit baseline for comparison, making it possible to assess where restoration measures are prioritised and if conditions have improved, worsened, or remained unchanged after spatial planning interventions. Furthermore, it could also help to monitor changes over time and identify positive or negative trends. However, reference levels were selected considering the values identified in the literature and the classification by natural breaks in the case study dataset. Consequently, they may not accurately reflect the EC within the specific study area.
For this study, the adoption of the common typology [72] for assessing ecosystem conditions represents a standardised framework that contributes to the coherence and versatility of the assessment process. Indeed, the use of a framework provides a common basis for evaluation, enabling straightforward comparisons of results across various geographical areas and scales. For example, the assessment of vacant lot ecosystem conditions can be combined with the assessment of other assets and other habitat types, putting together an overall picture of the urban ecosystem.
In addition to the definition of the reference levels, another limitation of this study is the limited availability of detailed local-level data. Data on compositional state characteristics, related to the communities of species present, whether native, allochthonous, or invasive, are missing. For the development of the proposed approach, we employed satellite images from open-source datasets, thus also ensuring the reproducibility of the method in different contexts. However, soil data resolution may not capture micro-scale variability; therefore, the dataset could be supplemented by higher-resolution images obtained through more innovative sensing techniques and by direct field data collection as developed, for example, by Scheeres et al. [82].
Future research within the field of condition assessments might delve into identifying additional key indicators to describe the characteristics of ecosystem components at the urban scale. These investigations should also explore how these indicators can be linked and included in standardised frameworks, such as SEEA-EA.
Finally, concerning the specific contribution to the study area, this research revealed the value of vacant lots when facing current urban challenges. Assessing the EC of vacant lots can therefore help to outline guidelines for the management of these spaces and support local policymakers in the context of densification processes. However, the ever-changing nature of vacant lots constantly being created and modified poses a challenge in sourcing data that can remain stable over time and requires continuous monitoring. Additionally, the private ownership of these lots with pre-allocated development rights may constitute significant obstacles to the practical implementation of the approach. Contextually, the investigation of schemes for financing and public–private agreements for the remediation and purchase of these areas might be deepened.

Supplementary Materials

The following supporting information can be downloaded at: https://www.mdpi.com/article/10.3390/su17104686/s1, Figure S1: Scheme process of shortest path creation; Figure S2: Results for abiotic characteristics; Figure S3: Results for abiotic and landscape characteristics.

Author Contributions

Conceptualization, E.B., E.F. and D.G.; methodology, E.B., E.F. and D.G.; formal analysis, E.B.; investigation, E.B.; data curation, E.B.; writing—original draft preparation, E.B., E.F. and D.G.; writing—review and editing, E.B., E.F. and D.G.; visualization, E.B.; supervision, E.F. and D.G. All authors have read and agreed to the published version of the manuscript.

Funding

This research received no external funding.

Institutional Review Board Statement

Not applicable.

Informed Consent Statement

Not applicable.

Data Availability Statement

The data presented in this study are available on request.

Conflicts of Interest

The authors declare no conflicts of interest.

Abbreviations

The following abbreviations are used in this manuscript:
ESEcosystem Services
ECEcosystem Conditions
GIGreen Infrastructure
NbSNature-based Solutions

References

  1. Kjærås, K. The politics of urban densification in Oslo. Urban Stud. 2023, 61, 40–57. [Google Scholar] [CrossRef]
  2. Blanc, F.; Scanlon, K.; White, T. Living in a Denser London. How Residents See Their Homes; LSE London: London, UK, 2020. [Google Scholar]
  3. Livingstone, N.; Fiorentino, S.; Short, M. Planning for residential ‘value’? London’s densification policies and impacts. Build. Cities 2021, 2, 203–219. [Google Scholar] [CrossRef]
  4. Dembski, S. ‘Organic’ approaches to planning as densification strategy? The challenge of legal contextualisation in Buiksloterham, Amsterdam. Town Plan. Rev. 2020, 91, 283–303. [Google Scholar] [CrossRef]
  5. Herdt, T.; Jonkman, A.R. The acceptance of density: Conflicts of public and private interests in public debate on urban densification. Cities 2023, 140, 104451. [Google Scholar] [CrossRef]
  6. Balikçi, S.; Giezen, M.; Arundel, R. The paradox of planning the compact and green city: Analyzing land-use change in Amsterdam and Brussels. J. Environ. Plan. Manag. 2022, 65, 2387–2411. [Google Scholar] [CrossRef]
  7. Cortinovis, C.; Geneletti, D.; Haase, D. Higher immigration and lower land take rates are driving a new densification wave in European cities. NPJ Urban Sustain. 2022, 2, 19. [Google Scholar] [CrossRef]
  8. Khoshkar, S.; Balfors, B.; Wärnbäck, A. Planning for green qualities in the densification of suburban Stockholm—Opportunities and challenges. J. Environ. Plan. Manag. 2018, 61, 2613–2635. [Google Scholar] [CrossRef]
  9. Verheij, J.; Ay, D.; Gerber, J.-D.; Nahrath, S. Ensuring Public Access to Green Spaces in Urban Densification: The Role of Planning and Property Rights. Plan. Theory Pract. 2023, 24, 342–365. [Google Scholar] [CrossRef]
  10. Di Pietro, F.; Robert, A. Cities and Nature Urban Wastelands A form of Urban Nature? Available online: http://www.springer.com/series/10068 (accessed on 12 December 2023).
  11. Nefs, M. Unused urban space: Conservation or transformation? Polemics about the future of urban wastelands and abandoned building. City Time 2006, 2, 47–58. [Google Scholar]
  12. La Rosa, D.; Privitera, R. Characterization of non-urbanized areas for land-use planning of agricultural and green infrastructure in urban contexts. Landsc. Urban Plan. 2013, 109, 94–106. [Google Scholar] [CrossRef]
  13. Kim, G.; Miller, P.A.; Nowak, D.J. Assessing urban vacant land ecosystem services: Urban vacant land as green infrastructure in the City of Roanoke, Virginia. Urban For. Urban Green. 2015, 14, 519–526. [Google Scholar] [CrossRef]
  14. McPhearson, T.; Kremer, P.; Hamstead, Z.A. Mapping ecosystem services in New York City: Applying a social-ecological approach in urban vacant land. Ecosyst. Serv. 2013, 5, 11–26. [Google Scholar] [CrossRef]
  15. Smith, J.P.; Li, X.; Turner, B.L. Lots for greening: Identification of metropolitan vacant land and its potential use for cooling and agriculture in Phoenix, AZ, USA. Appl. Geogr. 2017, 85, 139–151. [Google Scholar] [CrossRef]
  16. Pham, M.A.; Spring, M.R.; Sivakoff, F.S.; Gardiner, M.M. Reclaiming urban vacant land to manage stormwater and support insect habitat. Urban Ecosyst. 2023, 26, 1813–1827. [Google Scholar] [CrossRef]
  17. London Biodiversity Partnership Urban Wastelands Habitat Statement. Available online: https://www.lbp.org.uk/02audit_pages/aus20_urban.html (accessed on 21 November 2023).
  18. Luo, S.; Havik, K. Gardens of interstitial wildness cultivating indeterminacy in the metropolitan landscape. Spool 2020, 7, 9–22. [Google Scholar] [CrossRef]
  19. Ossola, A.; Locke, D.; Lin, B.; Minor, E. Yards increase forest connectivity in urban landscapes. Landsc. Ecol. 2019, 34, 2935–2948. [Google Scholar] [CrossRef]
  20. Threlfall, C.G.; Law, B.; Banks, P.B. Sensitivity of insectivorous bats to urbanization: Implications for suburban conservation planning. Biol. Conserv. 2012, 146, 41–52. [Google Scholar] [CrossRef]
  21. European Commission. Our Life Insurance, Our Natural Capital: An EU Biodiversity Strategy to 2020. 2011. Available online: https://www.eea.europa.eu/policy-documents/our-life-insurance-our-natural (accessed on 14 November 2023).
  22. Escobedo, F.J.; Giannico, V.; Jim, C.Y.; Sanesi, G.; Lafortezza, R. Urban forests, ecosystem services, green infrastructure and nature-based solutions: Nexus or evolving metaphors? Urban For. Urban Green. 2019, 37, 3–12. [Google Scholar] [CrossRef]
  23. Fang, X.; Li, J.; Ma, Q. Integrating green infrastructure, ecosystem services and nature-based solutions for urban sustainability: A comprehensive literature review. Sustain. Cities Soc. 2023, 98, 104843. [Google Scholar] [CrossRef]
  24. Hansen, R.; Pauleit, S. From Multifunctionality to Multiple Ecosystem Services? A Conceptual Framework for Multifunctionality in Green Infrastructure Planning for Urban Areas. AMBIO 2014, 43, 516–529. [Google Scholar] [CrossRef]
  25. Ronchi, S.; Arcidiacono, A.; Pogliani, L. Integrating green infrastructure into spatial planning regulations to improve the performance of urban ecosystems. Insights from an Italian case study. Sustain. Cities Soc. 2020, 53, 101907. [Google Scholar] [CrossRef]
  26. Longato, D.; Cortinovis, C.; Albert, C.; Geneletti, D. Practical applications of ecosystem services in spatial planning: Lessons learned from a systematic literature review. Environ. Sci. Policy 2021, 119, 72–84. [Google Scholar] [CrossRef]
  27. Ronchi, S. Ecosystem Services for Planning: A Generic Recommendation or a Real Framework? Insights from a Literature Review. Sustainability 2021, 13, 6595. [Google Scholar] [CrossRef]
  28. Cortinovis, C.; Geneletti, D. A performance-based planning approach integrating supply and demand of urban ecosystem services. Landsc. Urban Plan. 2020, 201, 103842. [Google Scholar] [CrossRef]
  29. Pappalardo, V.; La Rosa, D. Policies for sustainable drainage systems in urban contexts within performance-based planning approaches. Sustain. Cities Soc. 2020, 52, 101830. [Google Scholar] [CrossRef]
  30. Roche, P.K.; Campagne, C.S. From ecosystem integrity to ecosystem condition: A continuity of concepts supporting different aspects of ecosystem sustainability. Curr. Opin. Environ. Sustain. 2017, 29, 63–68. [Google Scholar] [CrossRef]
  31. United Nations. System of Environmental-Economic Accounting-Ecosystem Accounting (SEEA EA). 2021. Available online: https://seea.un.org/ecosystem-accounting (accessed on 15 December 2023).
  32. Keith, H.; Czúcz, B.; Jackson, B.; Driver, A.; Nicholson, E.; Maes, J. A conceptual framework and practical structure for implementing ecosystem condition accounts. One Ecosyst. 2020, 5, e58216. [Google Scholar] [CrossRef]
  33. European Commission. EU Biodiversity Strategy for 2030—Bringing Nature Back into Our Lives. 2021. Available online: https://data.europa.eu/doi/10.2779/677548 (accessed on 15 July 2023).
  34. Bruzón, A.G.; Arrogante-Funes, P.; Santos-Martín, F. Modelling and testing forest ecosystems condition account. J. Environ. Manag. 2023, 345, 118676. [Google Scholar] [CrossRef]
  35. Chen, Y.; Vardon, M.; Keith, H.; Van Dijk, A.; Doran, B. Linking ecosystem accounting to environmental planning and management: Opportunities and barriers using a case study from the Australian Capital Territory. Environ. Sci. Policy 2023, 142, 206–219. [Google Scholar] [CrossRef]
  36. Farrell, C.A.; Coleman, L.; Kelly-Quinn, M.; Obst, C.G.; Eigenraam, M.; Norton, D.; O’donoghue, C.; Kinsella, S.; Delargy, O.; Stout, J.C. Applying the system of environmental economic accounting-ecosystem accounting (Seea-ea) framework at catchment scale to develop ecosystem extent and condition accounts. One Ecosyst. 2021, 6, e65582. [Google Scholar] [CrossRef]
  37. Framstad, E.; Kolstad, A.L.; Nybø, S.; Töpper, J.; Vandvik, V. The Condition of Forest and Mountain Ecosystems in Norway. Assessment by the IBECA Method. NINA Report 2100; Norwegian Institute for Nature Research: Trondheim, Noorwegen, 2022. [Google Scholar]
  38. Kim, M.; Koo, N.; Kim, A.R.; Lee, K.; Yun, S.J. Reference Ecosystem Condition-Based Syntaxonomic Study for Ecological Restoration and Protection of Temperate Forests in South Korea. Diversity 2025, 17, 40. [Google Scholar] [CrossRef]
  39. McVittie, A.; Cole, L.; Wreford, A.; Sgobbi, A.; Yordi, B. Ecosystem-based solutions for disaster risk reduction: Lessons from European applications of ecosystem-based adaptation measures. Int. J. Disaster Risk Reduct. 2018, 32, 42–54. [Google Scholar] [CrossRef]
  40. Grassi, G.; Cescatti, A.; Matthews, R.; Duveiller, G.; Camia, A.; Federici, S.; House, J.; De Noblet-Ducoudré, N.; Pilli, R.; Vizzarri, M. On the realistic contribution of European forests to reach climate objectives. Carbon Balance Manag. 2019, 14, 8. [Google Scholar] [CrossRef]
  41. Cook-Patton, S.C.; Drever, C.R.; Griscom, B.W.; Hamrick, K.; Hardman, H.; Kroeger, T.; Pacheco, P.; Raghav, S.; Stevenson, M.; Webb, C.; et al. Protect, manage and then restore lands for climate mitigation. Nat. Clim. Chang. 2021, 11, 1027–1034. [Google Scholar] [CrossRef]
  42. Liu, O.Y.; Russo, A. Assessing the contribution of urban green spaces in green infrastructure strategy planning for urban ecosystem conditions and services. Sustain. Cities Soc. 2021, 68, 102772. [Google Scholar] [CrossRef]
  43. Nowell, M.; Barton, D.N.; Aslaksen, I.; Garnåsjordet, A.; Steinnes, M.; Cimburova, Z. Per Arild Garnåsjordet, Margrete Steinnes, Zofie Cimburova, Urban Green. Urban Green. Integrating Ecosystem Extent and Condition as a Basis for Ecosystem Accounts. Examples from the Oslo Region. 2020. Available online: http://www.ssb.no/en/forskning/discussion-papers (accessed on 13 December 2023).
  44. Hanssen, F.; Barton, D.N.; Venter, Z.S.; Nowell, M.S.; Cimburova, Z. Utilizing LiDAR data to map tree canopy for urban ecosystem extent and condition accounts in Oslo. Ecol. Indic. 2021, 130, 108007. [Google Scholar] [CrossRef]
  45. Nedkov, S.; Zhiyanski, M.; Dimitrov, S.; Borisova, B.; Popov, A.; Ihtimanski, I.; Yaneva, R.; Nikolov, P.; Bratanova-Doncheva, S. Mapping and assessment of urban ecosystem condition and services using integrated index of spatial structure. One Ecosyst. 2017, 2, e14499. [Google Scholar] [CrossRef]
  46. Hou, Y.; Liu, Y.; Zeng, H. Assessment of urban ecosystem condition and ecosystem services in Shenzhen based on the MAES analysis framework. Ecol. Indic. 2023, 155, 110962. [Google Scholar] [CrossRef]
  47. Kourdounouli, C.; Jönsson, A.M. Urban ecosystem conditions and ecosystem services—A comparison between large urban zones and city cores in the EU. J. Environ. Plan. Manag. 2020, 63, 798–817. [Google Scholar] [CrossRef]
  48. Wang, Y.; Zhu, L.; Yang, X.; Zhang, X.; Wang, X.; Pei, J.; Zhou, L.; Luo, Z.; Fang, Q.; Liang, M.; et al. Evaluating the conservation priority of key biodiversity areas based on ecosystem conditions and anthropogenic threats in rapidly urbanizing areas. Ecol. Indic. 2022, 142, 109245. [Google Scholar] [CrossRef]
  49. Salata, S.; Ronchi, S.; Giaimo, C.; Arcidiacono, A.; Pantaloni, G.G. Performance-Based Planning to Reduce Flooding Vulnerability Insights from the Case of Turin (North-West Italy). Sustainability 2021, 13, 5697. [Google Scholar] [CrossRef]
  50. Córdoba Hernández, R.; Camerin, F. The application of ecosystem assessments in land use planning: A case study for supporting decisions toward ecosystem protection. Futures 2024, 161, 103399. [Google Scholar] [CrossRef]
  51. Villamagna, A.M.; Angermeier, P.L.; Bennett, E.M. Capacity, pressure, demand, and flow: A conceptual framework for analyzing ecosystem service provision and delivery. Ecol. Complex. 2013, 15, 114–121. [Google Scholar] [CrossRef]
  52. Munafò, M. (Ed.) Consumo di Suolo, Dinamiche Territoriali e Servizi Ecosistemici. Edizione 2023. Report SNPA 37/23; Sistema Nazionale per la protezione dell’Ambiente: Roma, Italy, 2023. [Google Scholar]
  53. Confindustria Lombardia. Piano Strategico #Lombardia2030; Confindustria Lombardia: Milan, Italy, 2015. [Google Scholar]
  54. Regione Lombardia. Progetto di Integrazione del PTR ai Sensi Della l.r.31/14. Criteri per l’attuazione Della Politica di Riduzione del Consumo di Suolo. Aggiornamento 2021. Available online: https://www.regione.lombardia.it/wps/wcm/connect/cfa792b3-cc7e-42ac-8595-1a9b6b1e0cb8/criteri-attuazione-aggiornamento-2021-integrazione-ptr-consumo-suolo.pdf?MOD=AJPERES&CACHEID=ROOTWORKSPACE-cfa792b3-cc7e-42ac-8595-1a9b6b1e0cb8-nYcm0Fh (accessed on 13 May 2025).
  55. Eurostat Population and Housing Census 2021: First EU Results. Available online: https://ec.europa.eu/eurostat/web/products-eurostat-news/w/DDN-20230330-2 (accessed on 14 July 2023).
  56. Metropolitan Landscapes: Towards a Shared Construction of the Resilient City of the Future; Contin, A., Ed.; Landscape Series; Springer International Publishing: Cham, Switzerland, 2021; Volume 28, ISBN 978-3-030-74423-6. [Google Scholar]
  57. Marull, J.; Farré, M.; Galletto, V.; Trullén, J. Analysing sustainable-progress typologies in European metropolitan regions. Cities 2023, 137, 104347. [Google Scholar] [CrossRef]
  58. Nabielek, K.; Hamers, D.; Evers, D. Cities in Europe; Netherlands Environmental Assessment Agency: The Hauge, The Netherlands, 2016. [Google Scholar]
  59. Regione Lombardia. Geoportale Regione Lombardia. Available online: https://www.geoportale.regione.lombardia.it/ (accessed on 14 January 2024).
  60. La Notte, A.; Liquete, C.; Grizzetti, B.; Maes, J.; Egoh, B.N.; Paracchini, M.L. An ecological-economic approach to the valuation of ecosystem services to support biodiversity policy. A case study for nitrogen retention by Mediterranean rivers and lakes. Ecol. Indic. 2015, 48, 292–302. [Google Scholar] [CrossRef]
  61. Vári, Á.; Kozma, Z.; Pataki, B.; Jolánkai, Z.; Kardos, M.; Decsi, B.; Pinke, Z.; Jolánkai, G.; Pásztor, L.; Condé, S.; et al. Disentangling the ecosystem service ‘flood regulation’: Mechanisms and relevant ecosystem condition characteristics. Ambio 2022, 51, 1855–1870. [Google Scholar] [CrossRef]
  62. Città Metropolitana di Milano. Piano Strategico Triennale del Territorio Metropolitano, Orizzonte 2026. Available online: https://www.cittametropolitana.mi.it/export/sites/default/Piano_Strategico_2022_2024/doc/01_Rev28_PSTTM_ORIZZONTE-2026_Approvato_13giu23.pdf (accessed on 20 January 2024).
  63. Salata, S.; Ronchi, S.; Arcidiacono, A. Mapping air filtering in urban areas. A Land Use Regression model for Ecosystem Services assessment in planning. Ecosyst. Serv. 2017, 28, 341–350. [Google Scholar] [CrossRef]
  64. Fernandes, J.; Antunes, P.; Santos, R.; Zulian, G.; Clemente, P.; Ferraz, D. Coupling spatial pollination supply models with local demand mapping to support collaborative management of ecosystem services. Ecosyst. People 2020, 16, 212–229. [Google Scholar] [CrossRef]
  65. Wolff, S.; Schulp, C.J.E.; Verburg, P.H. Mapping ecosystem services demand: A review of current research and future perspectives. Ecol. Indic. 2015, 55, 159–171. [Google Scholar] [CrossRef]
  66. Guillevic, P.G.F.; Nickeson, J.; Hulley, G.; Ghent, D.; Yu, Y.; Trigo, I.; Hook, S.; Sobrino, J.; Remedios, J. Land Surface Temperature Product Validation Best Practice Protocol. Version 1.1. In Good Practices for Satellite-Derived Land Product Validation; Guillevic, P., Göttsche, F., Nickeson, J., Román, M., Eds.; Land Product Validation Subgroup (WGCV/CEOS), 2018. Available online: https://lpvs.gsfc.nasa.gov/PDF/CEOS_LST_PROTOCOL_Feb2018_v1.1.0_light.pdf (accessed on 13 May 2025).
  67. Sheng, L.; Tang, X.; You, H.; Gu, Q.; Hu, H. Comparison of the urban heat island intensity quantified by using air temperature and Landsat land surface temperature in Hangzhou, China. Ecol. Indic. 2017, 72, 738–746. [Google Scholar] [CrossRef]
  68. Kabisch, N.; van den Bosch, M.; Lafortezza, R. The health benefits of nature-based solutions to urbanization challenges for children and the elderly—A systematic review. Environ. Res. 2017, 159, 362–373. [Google Scholar] [CrossRef] [PubMed]
  69. Zulian, G.; Maes, J.; Paracchini, M. Linking Land Cover Data and Crop Yields for Mapping and Assessment of Pollination Services in Europe. Land 2013, 2, 472–492. [Google Scholar] [CrossRef]
  70. Klein, A.-M.; Vaissière, B.E.; Cane, J.H.; Steffan-Dewenter, I.; Cunningham, S.A.; Kremen, C.; Tscharntke, T. Importance of pollinators in changing landscapes for world crops. Proc. R. Soc. B Biol. Sci. 2007, 274, 303–313. [Google Scholar] [CrossRef]
  71. Zhao, C.; Sander, H.A.; Hendrix, S.D. Wild bees and urban agriculture: Assessing pollinator supply and demand across urban landscapes. Urban Ecosyst. 2019, 22, 455–470. [Google Scholar] [CrossRef]
  72. Czúcz, B.; Keith, H.; Driver, A.; Jackson, B.; Nicholson, E.; Maes, J. A common typology for ecosystem characteristics and ecosystem condition variables. One Ecosyst. 2021, 6, e58218. [Google Scholar] [CrossRef]
  73. Estrada, E.; Bodin, Ö. Using network centrality measures to manage landscape connectivity. Ecol. Appl. 2008, 18, 1810–1825. [Google Scholar] [CrossRef]
  74. Nardo, M.; Saisana, M.; Saltelli, A.; Tarantola, S. Tools for Composite Indicators Building. 2005. Available online: https://publications.jrc.ec.europa.eu/repository/handle/JRC31473 (accessed on 12 October 2023).
  75. Cutter, S.L.; Burton, C.G.; Emrich, C.T. Disaster Resilience Indicators for Benchmarking Baseline Conditions. J. Homel. Secur. Emerg. Manag. 2010, 7, 1–23. [Google Scholar] [CrossRef]
  76. Gathmann, A.; Tscharntke, T. Foraging ranges of solitary bees. J. Anim. Ecol. 2002, 71, 757–764. [Google Scholar] [CrossRef]
  77. Dargas, J.H.F.; Chaves, S.R.; Fischer, E. Pollination of lark daisy on roadsides declines as traffic speed increases along an Amazonian highway. Plant Biol. 2016, 18, 542–544. [Google Scholar] [CrossRef]
  78. NYC Environmental Protection. NYC Green Infrastructure 2024 Annual Report. Available online: https://www.nyc.gov/assets/dep/downloads/pdf/water/stormwater/green-infrastructure/gi-annual-report-2024.pdf (accessed on 7 May 2025).
  79. Pahl-Wostl, C. A conceptual framework for analysing adaptive capacity and multi-level learning processes in resource governance regimes. Glob. Environ. Change 2009, 19, 354–365. [Google Scholar] [CrossRef]
  80. Donati, G.F.A.; Van Den Brandeler, F.; Fischer, M.; Molné, F.; Schenk, N.; Grünholz, M.; Bolliger, J. Biodiversity Conservation in Human-Dominated Landscapes: Toward Collaborative Management of Blue–Green Systems. Conserv. Lett. 2025, 18, e13079. [Google Scholar] [CrossRef]
  81. Hardi, P.; Semple, P. The dashboard of sustainability: From a metaphor to an operational set of indices. In Proceedings of the Fifth International Conference on Social Science Methodology, Cologne, Germany, 3–6 October 2000. [Google Scholar]
  82. Scheeres, J.; de Jong, J.; Brede, B.; Brancalion, P.H.S.; Broadbent, E.N.; Zambrano, A.M.A.; Gorgens, E.B.; Silva, C.A.; Valbuena, R.; Molin, P.; et al. Distinguishing forest types in restored tropical landscapes with UAV-borne LIDAR. Remote Sens. Environ. 2023, 290, 113533. [Google Scholar] [CrossRef]
Figure 1. Case study area.
Sustainability 17 04686 g001
Figure 2. Vacant lots locations.
Sustainability 17 04686 g002
Figure 3. The matrix of demand and conditions for the four ES represents the method for outlining the plan provisions to suggest a preservation priority level for each vacant lot. (A) Vacant lots located in high-demand areas are recommended for preservation, with a priority for restoration interventions if the condition is under the reference level for all four ES. (B) Preservation priority level for vacant lots in medium-demand areas. (C) Preservation priority level for lots in low-demand areas.
Sustainability 17 04686 g003
Figure 4. (a) Ecosystem services demand in the case study area. (b) Examples of areas with different demand for ES.
Sustainability 17 04686 g004aSustainability 17 04686 g004b
Figure 5. Ecosystem condition indices of vacant lots with respect to the four ES.
Sustainability 17 04686 g005
Figure 6. Left side: Map of the results and selected examples of vacant lots according to the plan provision and the priority level for preservation. (A) Vacant lot with low conditions in a high-demand area; preservation and priority area for restoration interventions. (B) Vacant lot with high conditions in a low-demand area; high preservation priority level. (C) Vacant lot with conditions over the reference level for all the ES and in a high-demand area; preservation as suggested by the plan provision. (D) Vacant lot with ecosystem conditions under the reference level for three of the four ES and in a low-demand area; medium-low preservation priority level. Right side: Priority vacant lots for environmental restoration interventions according to ES.
Sustainability 17 04686 g006
Table 1. Indicators for assessing ecosystem services demand.
Ecosystem ServiceHazard IndicatorExposure IndicatorMethod
Air purificationPM10 emission (μg/m3) + Resuspension (%)Total populationSpatial modelling based on Salata et al. [63]
Runoff mitigationImpermeable surfaces (%)Total populationProxy based on impermeable surface (IMD High Resolution Layer Copernicus)
Microclimate
regulation
Surface temperature (°C)Total population + vulnerable classes (children and elderlies)Proxy based on surface temperature (Landsat Collection 2 Surface Temperature)
Ecosystem ServiceIndicatorReference
PollinationLevel of pollination dependence by crop typeEcological modelling based on Fernandes et al. [64]
Table 2. Pollination dependence level by crop type.
NomenclaturePollination
Dependence Level
Arable landNo
Wooded arable landLow
Vegetable outdoor cropsMedium
Vegetable protected cropsNo
Horticultural outdoor cropsHigh
Horticultural protected cropsNo
Vegetable gardensHigh
VineyardsLow
OrchardsHigh
Poplar grovesLow
Other orchardsLow
Meadows without tree and shrub speciesNo
Meadows with tree and shrub speciesLow
Table 3. Ecosystem condition indicators, reference levels, and data used.
GROUPSTypology ClassIndicatorData
Source
YearSpatial
Resolution
Reference Level
DescriptorUnit
A. ABIOTICA1. Physical state
characteristics
Clay content%ESDAC2018500 × 500 m20
Sand content%ESDAC2018500 × 500 m25
Bulk densityg/cm3ESCAD2018500 × 500 m1.39
Available water
capacity
%ESDAC2018500 × 500 m0.10
B. BIOTICB2. Structural state
characteristics
Maximum annual NDVI%Sentinel201810 × 10 m0.50
Tree cover density%Copernicus201810 × 10 m5
C. LANDSCAPEC1. Landscape
characteristics
Betweenness
centrality
%DUSAF2018 >0
Table 4. Association of condition indicators with corresponding ecosystem services.
Ecosystem Condition Indicators
ABIOTICBIOTICLANDSCAPE
ECOSYSTEM
SERVICES
ClaySandBulk DensityAWCNDVITree Cover DensityBetweenness Centrality
Runoff mitigation XX XX
Microclimate regulationX XXX
Pollination XXX
Air purification XX
Disclaimer/Publisher’s Note: The statements, opinions and data contained in all publications are solely those of the individual author(s) and contributor(s) and not of MDPI and/or the editor(s). MDPI and/or the editor(s) disclaim responsibility for any injury to people or property resulting from any ideas, methods, instructions or products referred to in the content.

