Article

Heavy Metal Contamination of Sediments in the Inaouène Watershed (Morocco): Indices, Statistical Methods, and Contributions to Sustainable Environmental Management

1
Laboratory of Geo-Resources and Environment, Faculty of Science and Technology, University of Sidi Mohammed Ben Abdellah, Route d’Imouzzer, P.O. Box 2202, Fez 30000, Morocco
2
International Water Research Institute, University Mohammed VI Polytechnic, Benguerir 43150, Morocco
3
Laboratory of Continental and Coastal Morphodynamic (M2C), University of Rouen-Normandy, Place Emile Blondel, 76281 Mont-Saint-Aignan, Cedex, France
4
Laboratory of Natural Resources and Environment (LRNE), Multidisciplinary Faculty, University of Sidi Mohammed Ben Abdellah, P.O. Box 1223, Taza 35000, Morocco
5
Laboratory of Intelligent System, Georesources and Renewable Energies, Faculty of Science and Technology, University of Sidi Mohammed Ben Abdellah, Route d’Imouzzer, P.O. Box 2202, Fez 30000, Morocco
6
Laboratory of Space, History, Dynamics, and Sustainable Development, University of Sidi Mohammed Ben Abdellah, Route d’Imouzzer, P.O. Box 2202, Fez 30000, Morocco
7
Department of Geography and Planning, Pluridisciplinaire Faculty, University Mohamed Premier, P.O. Box 300, Selouane, Nador 62700, Morocco
*
Author to whom correspondence should be addressed.
Sustainability 2025, 17(10), 4668; https://doi.org/10.3390/su17104668
Submission received: 14 April 2025 / Revised: 11 May 2025 / Accepted: 16 May 2025 / Published: 19 May 2025

Abstract

:
The Inaouène watershed (3600 km2), part of the Sebou River’s upper valley in northern Morocco, faces urban, agricultural, and industrial discharges. This research investigates the environmental impact of heavy metal contamination in sediments and its implications for sustainable watershed management and long-term ecological protection. Sediment samples were collected from six sites along the river and the Idriss 1st dam. A combined approach of geochemical analyses and multivariate statistical methods (PCA, HCA) identified metal sources and grouped sites by contamination patterns. Additionally, pollution indices (Igeo, EF, PLI) were used to assess contamination levels and infer potential sources. Results revealed variable metal concentrations: upstream (Ech1) showed high levels of chromium (133 mg/kg) and copper (32.5 mg/kg) linked to urban discharges and erosion, while downstream (Ech6) exhibited high barium (3245 mg/kg) and strontium (505 mg/kg) concentrations due to dam sedimentation. Pollution indices confirmed moderate to high contamination, particularly at Ech1 and Ech6. Multivariate analysis identified three main clusters influenced by both anthropogenic and geological factors. These findings underline the need for integrated sediment management, regular monitoring, and environmental protection strategies to preserve the watershed and the aquifer’s ecological balance.

1. Introduction

The impacts of climate change, including the impacts of drought and extreme climate events on surface water and groundwater resources, have gained significant attention during the last decades [1,2,3,4,5,6]. However, the main natural challenges also include the increasing presence of contaminants, such as heavy metals, in aquatic environments, which has become a critical environmental issue due to their toxicity, persistence, and tendency to accumulate in sediments [7,8]. River sediments act as both sinks and potential secondary sources of these pollutants, especially under changing environmental conditions (pH, redox potential) [9,10,11,12]. Unlike organic pollutants, heavy metals are not biodegradable and may pose long-term risks to aquatic ecosystems, groundwater, and human health through biomagnification and trophic transfer [13,14,15].
Anthropogenic activities, such as the discharge of untreated domestic wastewater, the use of metal-containing fertilizers and pesticides in agriculture, and various industrial emissions, contribute significantly to the contamination of river sediments, and subsequently, aquifers [16,17,18]. Natural processes, including soil erosion, weathering, and rock leaching, also contribute to metal input, although to a lesser extent [19,20]. Once introduced into the river system, most unbound heavy metals bind to fine particles through processes such as adsorption and coprecipitation, leading to their accumulation in sediments [21,22].
The Inaouéne watershed has limited industrial activity, but has experienced substantial agricultural expansion and demographic increase in recent times. These developments are the primary sources of contamination in the river, which receives unprocessed household wastewater from Taza, Oued Amlil, and neighboring communities. This contamination poses a threat to the water quality of the Inaouéne.
A geochemical study is essential to identify contamination zones affecting sediment quality. Among various pollutants, heavy metals are particularly concerning due to their natural accumulation through geological erosion. The studied basin lies at the junction of three major structural domains: the southern Prerif complex, the South Rif trough, and the northern Middle Atlas. This location results in a diversity of geological formations prone to erosion, contributing metal-rich particles to the Inaouéne. Notably, the Inaouéne is the main water source for the Idriss 1st Dam, which is one of Morocco’s biggest dams in terms of size and storage.
In recent years, water quality assessments of monitored areas along the Inaouéne have predominantly fallen into lower categories, suggesting the presence of contamination [23,24,25]. Despite this, there has been a scarcity of research examining the ecological hazards linked to sediment pollution within the Inaouéne watershed, highlighting the pressing need to investigate heavy metal pollution in its sediments.
This research aims to evaluate environmental contamination levels and identify potential origins of heavy metals (Li, Zn, Co, Cu, Ni, Pb, V, Ba, Sr, and Ce) in the sediments of the Inaouéne basin. The buildup of these metallic elements in sediments presents an ongoing risk to aquatic ecosystems and other environmental components [26].
Scientists have introduced various approaches for detecting heavy metals in aquatic ecosystems alongside assessments of ecotoxicological risks [27,28]. The geoaccumulation index (Igeo), enrichment factor (EF), sediment pollution index (SPI), contamination factor (CF), potential ecological risk (PER), pollution load index (PLI), sediment quality guidelines and modified degree of contamination (mCd) have been employed to evaluate sediment contamination [29,30].
Although sediment quality indices assess individual metal risks, heavy metal contamination often involves complex mixtures, where the combined effects may be more harmful than those of single metals. In worst-case scenarios, these risks are considered additive [31]. Consequently, the potential ecological risk (PER) index proposed by Hakanson [32] estimates cumulative pollution using a toxic response factor specific to each metal. However, its calculation relies on a basic contamination factor that can introduce inaccuracies, particularly in complex environments, such as estuaries, where large river inputs strongly influence sediment dynamics [33]. In addition, one of the main limitations of PER lies in background geochemical concentrations, which vary according to lithology, regional geochemical context and local natural conditions. The use of reference values that are not adapted to the geological substrate of the site under study can lead to an incorrect estimate of ecological risk. Unlike the enrichment factor, which accounts for natural sediment inputs, the contamination factor overlooks lithogenic contributions, making EF a more accurate and realistic tool for assessing ecological risk.
Finally, principal component analysis (PCA) and hierarchical cluster analysis (HCA) were used to investigate the origins of heavy metals. By combining statistical analysis with various indices, a comprehensive assessment of the risks linked to heavy metals in Inaouéne sediments can be achieved.
To provide a comprehensive understanding of contamination dynamics in the Inaouéne watershed, this study combines geochemical analyses, pollution indices (Igeo, EF, CF, SPI, PLI, PER), and multivariate statistical techniques (PCA, HCA) to identify contamination levels, sources, and spatial trends. To operationalize this framework, the methodology incorporates field sampling, laboratory analyses, and statistical modeling, as detailed below.

2. Materials and Methods

2.1. Description of the Sampling Area

The Inaouène River basin, situated in the northernmost section of Morocco, spans an area of 3600 km2 and has a perimeter of 354.39 km. This watershed is positioned at the easternmost edge of the Sebou basin, within the geographical coordinates of (33.84° N; 34.58° N) and (3.78° W; 4.91° W). Located in Morocco’s Fès-Meknès region (Figure 1), it constitutes a significant component of the upper Sebou valley’s primary watersheds. The Inaouène basin’s unique location is characterized by its topography, which is influenced by the exposed formations of both the Rif mountain chain and the Middle Atlas range.
The climate of the Inaouène basin is Mediterranean, ranging from semi-arid to sub-humid. Precipitation shows a temporal distribution, with alternating dry and wet years [34]. In response to the semi-arid climatic characteristics, the Inaouène River regime exhibits seasonal variations, with periods of floods and low flows [35]. This prevailing climate type over the basin is marked by high rainfall variability, making flood periods unpredictable. Exceptional rainfall totals received by the Inaouène basin during certain times of the year significantly increase the volume of water in transit, often leading to floods that, in some cases, can inundate the major bed of the alluvial plain.
The basin’s topography is characterized by predominantly rugged terrain, generally hilly in the north and mountainous in the south. Based on slope indices, the slope system of the Inaouène basin is generally steep. The rugged relief and steep slope system promote rapid water transmission towards the outlet, resulting in synchronous and significant flooding events.
In this region, three main aquifers stand out, each with its own geological and hydrodynamic characteristics [36]:
  • The Taza aquifer develops within highly karstified Lias limestone formations. It exhibits strong heterogeneity due to fracturing and the presence of sinkholes and underground conduits. Its recharge is rapid but irregular, making it sensitive to climatic variations.
  • The Fès-Taza corridor aquifer is housed in Mio-Pliocene sedimentary formations (limestone, sandstone, marl). It ranges from unconfined to confined depending on the area, with diffuse recharge through porous materials. Its behavior is strongly influenced by local tectonics.
  • The Magoussa aquifer, a semi-confined to confined system, consists of marly and sandy formations. It is characterized by low permeability and reduced transmissivity, with slow and limited recharge. Its functioning is moderate and highly dependent on the local lithological context.

2.2. Collection and Analysis of Sediments

To assess sediment contamination dynamics in the Inaouène watershed, six sampling stations (Ech1–Ech6) were strategically selected along the main river channel and the Idriss 1st Dam reservoir during the dry season (June 2019). The selection aimed to reflect a range of environmental conditions and potential contamination sources across the watershed, including upstream urban areas, agricultural zones, tributary confluences, and the downstream reservoir. Although some previous studies have focused on localized sub-watersheds, few have addressed the entire basin—particularly the area influenced by the Idriss 1st Dam. This spatial design provides a representative overview of contamination gradients and sediment quality across the system.
This spatial distribution is illustrated in Figure 1:
  • Anthropogenic influences, such as urban discharges near Taza city (Ech2) and agricultural runoff from Oued Amlil (Ech3);
  • Hydrological processes, including tributary confluences (Oued Larbae at Ech1, Oued Bouhlou at Ech4) and dam-induced sedimentation (Ech5);
  • Contamination gradients, from the upstream reference site (Ech1, minimally impacted) to post-dam sediments (Ech6).
Station Ech1, located before the confluence with Oued Larbae, serves as a baseline for geogenic metal levels. In contrast, Ech2 reflects urban pollution downstream of Taza, while Ech3 and Ech4 highlight agricultural and mixed anthropogenic inputs. The dam-related stations (Ech5–Ech6) evaluate how reservoir dynamics alter metal distribution in sediments.
Using a Van Veen grab sampler, we collected surface sediment samples ranging from 0 to 5 cm. These samples were then stored in a refrigerator until we could analyze them in the laboratory.
After being air dried, the sediment samples were carefully sorted to remove any remaining stones, trash, or plant roots. Finally, the samples were pulverized with an agate mortar and passed through a mesh that had a diameter of less than 5 mm. To avoid any air contact, they were carefully put in plastic bags and sealed. To prevent the growth of microorganisms that could compromise their qualities, they were kept in a cold chamber at 4 °C.
While soils and sediments are chemically and physically very similar, most physico-chemical studies followed the AFNOR guidelines for soil and sediment quality, commonly known as the NF X31 series of French national standards [37]. A representative fraction of the raw sample was obtained using the NF X31-101 standard, as described in a prior study [38]. The sample is dried in an oven set at 40 °C until it reaches a consistent mass, then any clumps are reduced and the sample is sieved until its particle diameter is less than or equal to 2 mm. Using this approach, all samples were prepared for physico-chemical analysis.
Electrical conductivity, based on the extraction of water-soluble salts, was determined according to the NF X 31-113 standard [37]. The pH, representing the actual acidity and taking into account the free H3O+ ions in the liquid phase, was measured according to the NF X 31-103 standard. Loss on ignition, which provides an indication of the total organic matter content of the sediments, was measured according to the NF X 31-151 standard.
The carbonate content was measured using Bernard’s calcimetry method in accordance with the NF P18-508 standard. The dissolution of trace metallic elements by HF/HNO3 acid digestion was performed according to the NF X 31-151 standard. Inductively coupled plasma atomic emission spectroscopy (ICP-AES) was utilized in the laboratory of the National Office of Hydrocarbons and Mines (ONHYM) in order to ascertain the concentrations of heavy metals.

2.3. Pollution Indices and Contamination Levels

Enrichment refers to an increase in total concentrations due to anthropogenic inputs, without necessarily implying a negative impact on environmental quality [39]. The enrichment factor (EF) serves as a measure to evaluate the elevation in a chemical element’s concentration within sediment, relative to a standard reference. This factor has been extensively employed by researchers to pinpoint the human-derived sources of metallic elements in the environment [40]. The enrichment factor is calculated using the equation (Equation (1)) provided by Sutherland [41].
E F = E l / X s a m p l e E l / X c r u s t
El” represents the studied element, the brackets indicate concentration (mg/kg), and “X” is employed as the designated reference element. The indices “crust” and “sample” specify the environment to which the concentration pertains.
The chosen reference element is zirconium (Zr) because it is relatively immobile in geochemical environments, even under weathering conditions and chemical alteration processes. It is rarely influenced by human activities or pollution-related enrichment processes, making it a stable reference. This reliability allows it to effectively assess the enrichment of other elements, such as heavy metals. The degree of enrichment can be divided into seven categories (Table 1).
In 1969, German researcher Muller [42] introduced the Index of Geoaccumulation (Igeo). This metric was originally developed to evaluate heavy metal contamination in sediments, examine the natural distribution patterns of heavy metals, and assess the environmental impact of human activities. The Igeo is calculated using the following formula (Equation (2)):
I g e o = L o g 2 ( C i k B i )
where Ci represents the observed concentration of heavy metal i (mg/kg); Bi denotes the geological background value of heavy metal i, According to Wedepohl’s research, Zn = 52 mg/kg, Li = 22 mg/kg, Co = 11.6 mg/kg, Cu = 14.3 mg/kg, Ni = 18.6 mg/kg, Pb = 17 mg/kg, V = 53 mg/kg, Ba = 668 mg/kg, Sr = 316 mg/kg, Ce = 237 mg/kg and Cr = 35 mg/kg [43]; k is a constant, typically set to 1.5. This correction factor is introduced to minimize the influence of possible variations in the geochemical background, which may result from lithological differences in the sediments [44]. Based on the Igeo value, the degree of pollution can be classified into seven categories (Table 1). This index can also be used to assess soil contamination [45].
According to Hakanson [32], the total of all contamination factors is known as the degree of contamination (DC). Each sampling point can have its polymetallic contamination estimated a priori using this method [46]. The following equation (Equation (3)) expresses this level of contamination:
D C i = F C
To apply this formula, it is necessary to consider both metal and organic contaminants. Abrahim and Parker [47] proposed a modification to this formula to account for the number of pollutants analyzed. The modified degree of contamination (mCd) for each site is determined by dividing the total of the contamination factors (CF) by the quantity of pollutants examined. This is represented by the equation (Equation (4)):
m C d = C F i n
where n is the total number of contaminants that were analyzed.
Abrahim and Parker [47] categorized the mCd into seven distinct classes (Table 1). The contamination factor is utilized to identify and measure the level of trace element contamination in sediments [48,49]. This factor is determined using the following equation (Equation (5)):
C F x = C x B g x
where Cx is the detected concentration of element x, and Bg is the reference background level for element x.
Hakanson [32] established contamination categories according to CF values (Table 2).
The potential ecological risk (PER) assessment is a set of methods introduced by the Swedish scientist Hakanson [32] to evaluate sediment or soil contamination by heavy metals from a sedimentological perspective. It considers the environmental behavior and characteristics of heavy metals. This assessment incorporates multiple fields of research, such as biotoxicology, environmental chemistry, and ecology. The following equations (Equation (6)) are used to calculate the ecological risk index (RI):
C f i = C s i C n i , E r i = T r i C f i   e t   R I = i = 1 n E r i
With C f i representing the contamination factor for a specific heavy metal i, C s i is the calculated concentration of a metallic element in ppm, and C n i denotes the background concentration of heavy metals [50]. For each element i, T r i represents the toxic response factor, and E r i stands for the PER (Potential Ecological Risk) factor. The following are the heavy metal hazardous response coefficients, according to the standard set by Hakanson [25,32]: Cr = 2, Zn = 1, V = 2, Ni = 5, Ba = 2, Pb = 5, Co = 5, and Cu = 5.
The RI refers to the PER factor for a variety of elements. Table 2 displays the classification of these values.
Although Igeo, CF, and DC serve as indicators for assessing sediment enrichment and contamination by specific trace metals (ETMs), these measures do not take into account the toxicity of the elements. Recognizing this limitation, Rubio et al. [51] introduced the sediment pollution index (SPI), which incorporates a toxicity weight or weighting factor (W) for each ETM. This factor varies based on the relative toxicity of the element in question. The SPI is calculated using a specific formula (Equation (7)) developed by Rubio et al. [51] and is associated with five distinct quality classes, as described by Singh et al. [52] (Table 3). By considering both contamination levels and the potential toxic effects of various trace metals, the SPI provides a more comprehensive evaluation of sediment pollution.
S P I x = C F x W x W t
where Wx is the weight assigned to the considered metal,
Wt: ΣWx
To evaluate the overall contamination level at a sampling site, a study was conducted using the pollutant load index (PLI). This index considers the combined concentration of all metals analyzed in the study [53]. The PLI is determined using the formula (Equation (8)) developed by Tomlinson et al. [54].
P L I = C F 1 × C F 2 × C F 3 × × C F n n
where CFi is the contamination factor for metal i, and n is the number of metals analyzed.
Cumulative information on metal pollution in sediments is provided by the Metal Pollution Index. Three levels make up the pollution load index, per Tomlinson et al. [54] (Table 3).

2.4. Multivariate Statistical Analyses

Fundamental and multivariate statistical analyses were utilized to examine the connections among heavy metals [55]. Employing multivariate statistical techniques enhances the interpretation of intricate data matrices, leading to a more comprehensive understanding of various environmental factors [56]. Included in these methodologies are correlation analysis (CA), factor analysis (FA), discriminant analysis (DA), and principal component analysis (PCA) [57], which have been extensively applied to evaluate sediment quality [58]. CA, specifically, is a multivariate technique that categorizes geochemical parameters by examining the interconnections among chemical constituents [59]. PCA is a commonly employed multivariate analytical technique that condenses a collection of original variables, such as geochemical data, into a smaller set of indices (principal components or factors). This process aids in interpreting variations in the data that simple correlation analysis may not uncover [60]. Consequently, CA and PCA serve as valuable methods for uncovering shared patterns, identifying anomalies in dispersion, minimizing the dimensionality of original datasets, and improving the comprehension of the geogenic and environmental sources of metals in sediments [61]. PCA has been employed in various studies to discern both human and natural impacts on surface water quality [62]. Simultaneously, hierarchical cluster analysis (HCA) is commonly employed to categorize water samples according to their analogous hydrochemical properties, a technique regularly utilized in the field of earth sciences [63]. The analysis and processing of the data were conducted using R software (version 4.2.2) to investigate the spatiotemporal variability of metal concentrations in sediments.
To enhance understanding, Table 4 below presents the main multivariate indices and methods applied in this study, highlighting their role in assessing sediment contamination and identifying pollution sources.

3. Results and Discussion

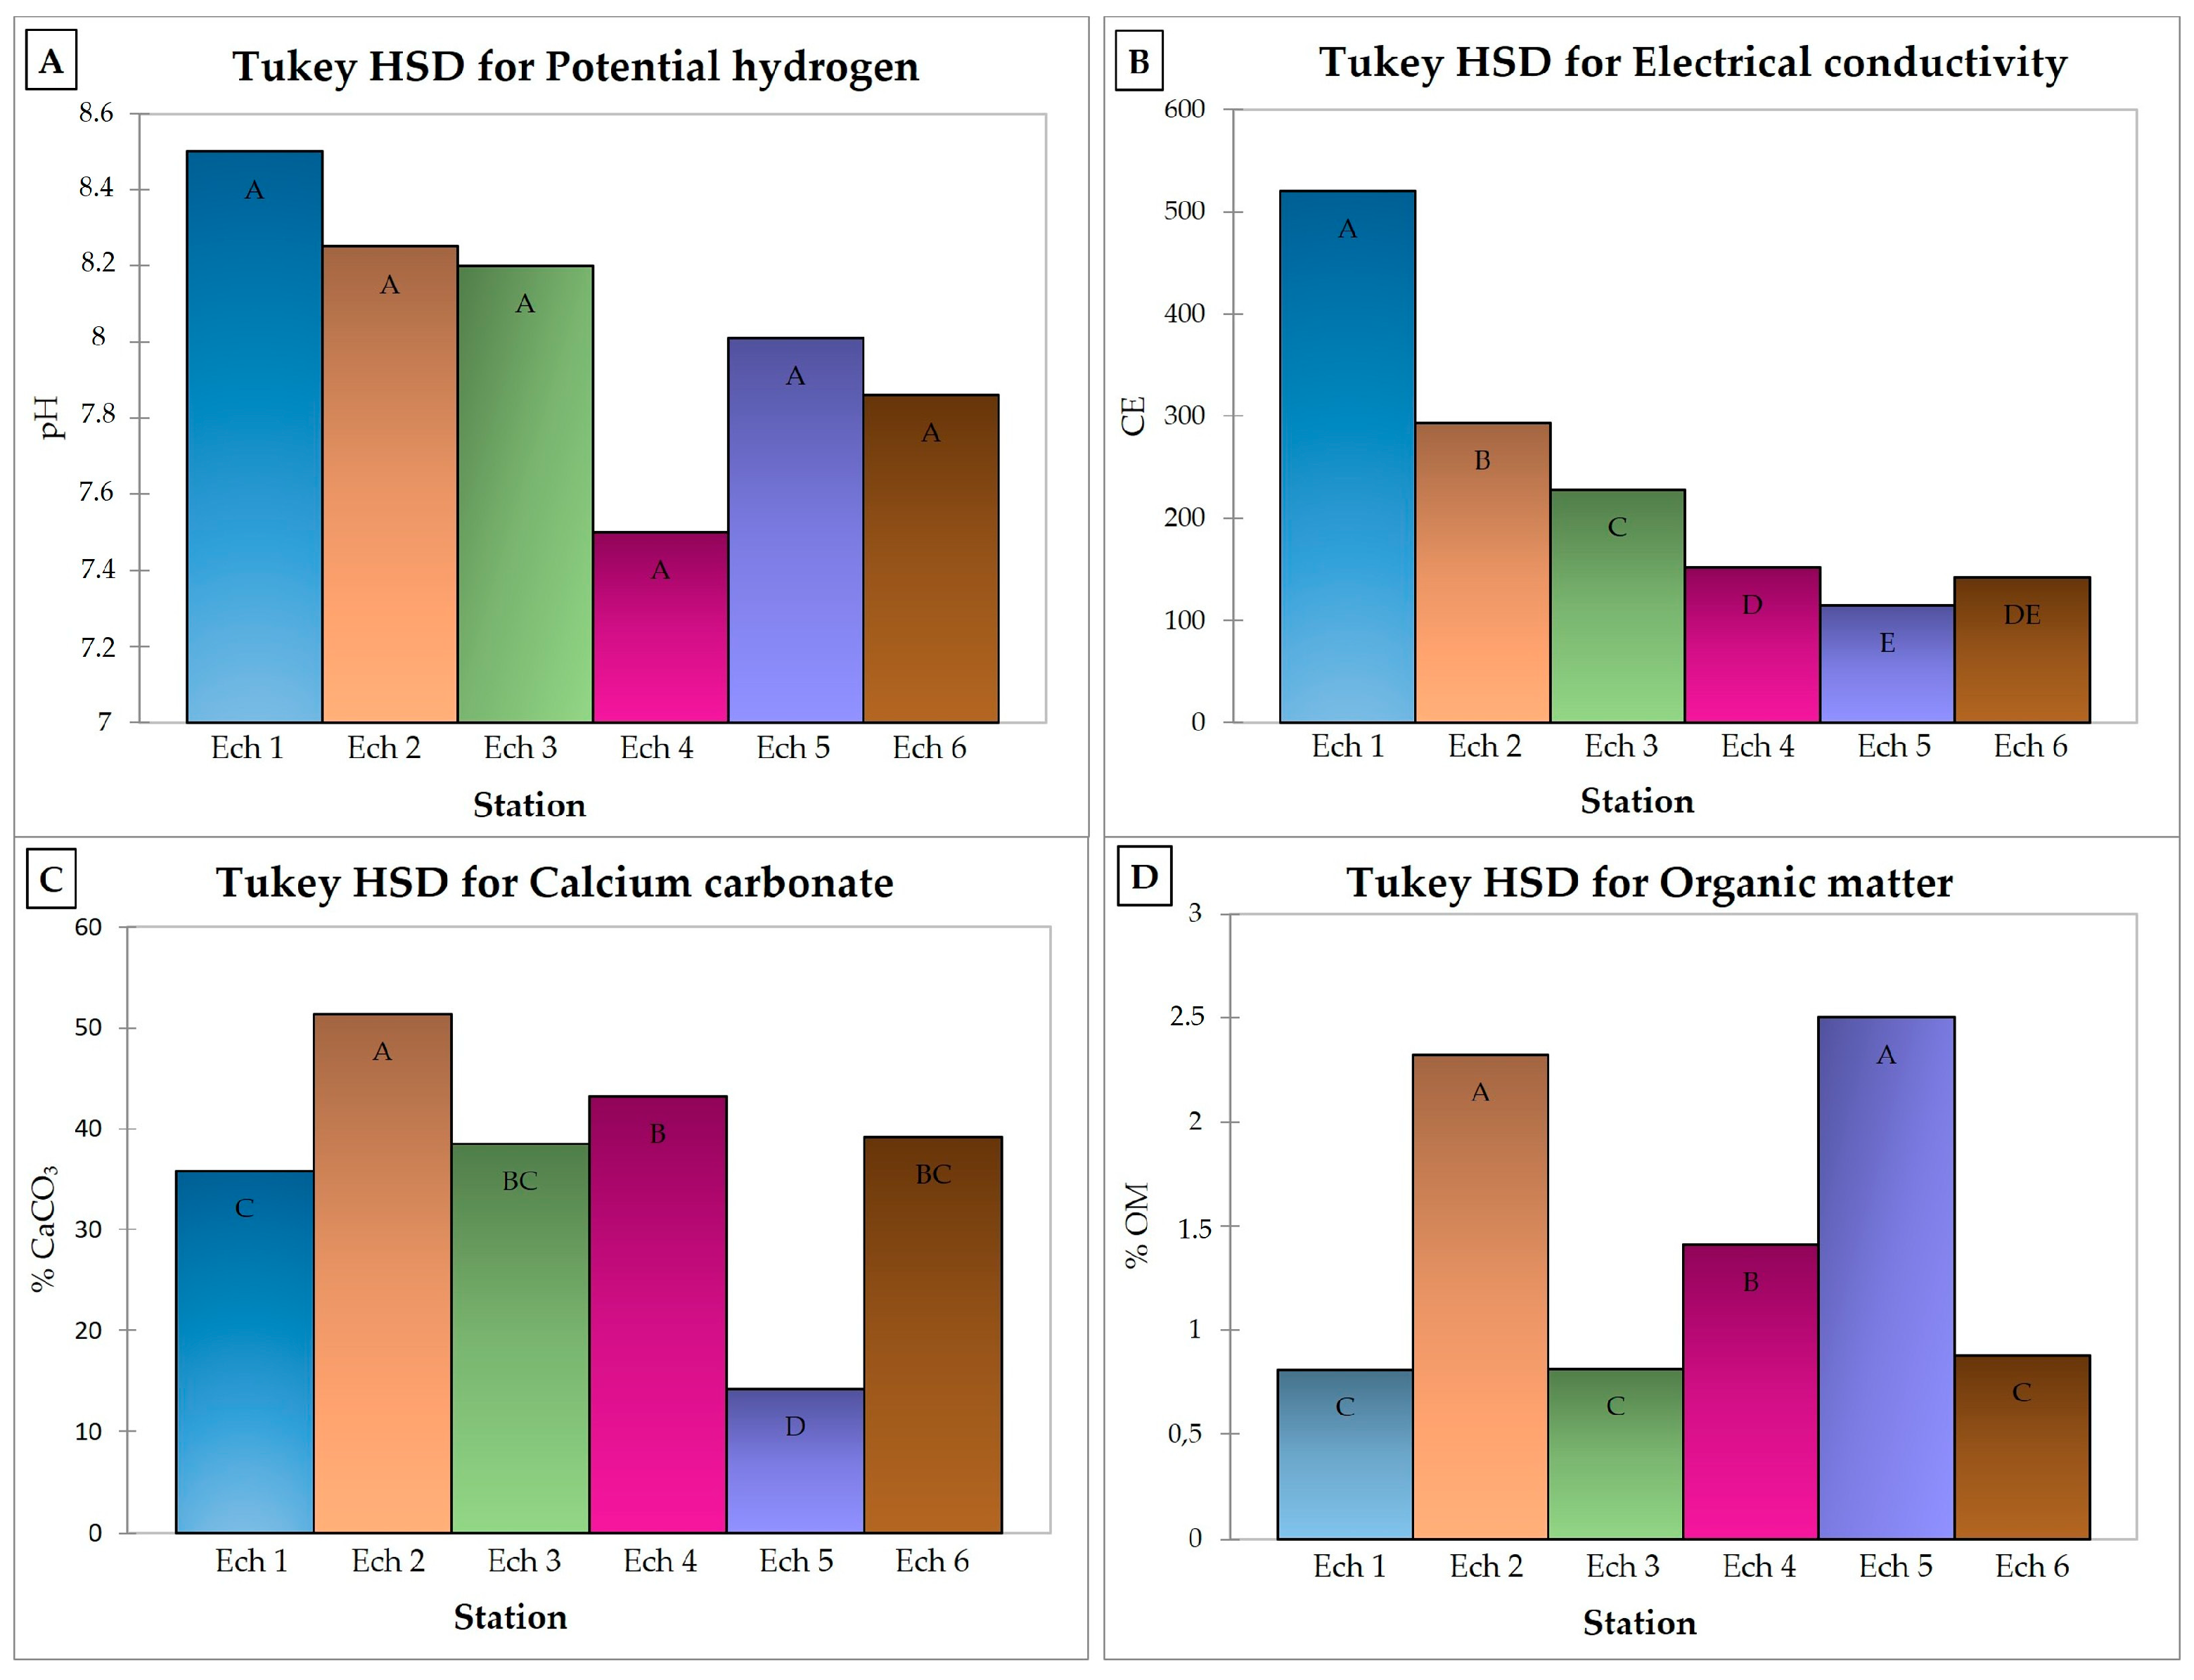
The study of the physicochemical parameters of sediments across the watershed stations reveals significant spatial variations, confirmed by statistical analysis (one-way ANOVA) and further refined by the Tukey HSD post hoc test. These results reflect the influence of geological, hydrodynamic, and anthropogenic factors on sediment composition.
Measured pH (Figure 2A) values range from 7.9 to 8.4, indicating a slightly to moderately alkaline environment. The ANOVA analysis did not reveal any significant differences between stations, which is confirmed by the Tukey HSD test; all stations belong to the same homogeneous group.
Despite the absence of statistical differences, environmental data highlight that station Ech1 (pH = 8.4) exhibits the highest pH, reflecting a strong presence of carbonates and bicarbonates and a low content of acidic organic matter. In contrast, station Ech4 (pH = 7.9) shows a decrease while still within alkaline conditions, possibly due to organic matter accumulation or sedimentation processes in stagnant areas. This apparent stability may therefore conceal local geochemical mechanisms that could potentially influence metal mobility [64].
Unlike pH, electrical conductivity (Figure 2B) shows highly significant differences between stations (ANOVA, p < 0.05), as revealed by the Tukey test.
Station Ech1 (327 µS/cm) forms a statistically distinct group (Group A), indicating a high concentration of dissolved ions, which can be attributed to mineral inputs from surrounding slopes and urban discharges from the city of Taza. Stations Ech4 to Ech6, particularly Ech6 (147 µS/cm), belong to statistically lower groups (Groups D and E), reflecting a progressive dilution of ions in the calmer dam zones, which promotes sedimentation. Thus, the statistical distribution of electrical conductivity follows a clear environmental logic, a downstream decrease in the watershed linked to hydrological dynamics and upstream anthropogenic influence.
CaCO3 content (Figure 2C) varies significantly between stations (ANOVA, p < 0.05), with clear distinctions according to the Tukey test.
The Inaouéne stations (Ech1, Ech2, Ech3) show high carbonate levels (35.81% to 51.35%), statistically superior (Groups A and B), which is consistent with the calcareous nature of the geological substrate. In contrast, stations near the dam (Ech4 to Ech6) present lower content (as low as 14.19% at Ech5—Group D), likely diluted by non-carbonated sediment inputs or due to the accumulation of organic matter. These differences reflect lithological heterogeneities and a contrasting depositional dynamic between the mineral-rich upstream and the more mixed downstream sediments.
Organic matter content (Figure 2D) also varies significantly between stations (ANOVA, p < 0.05), showing a clear downstream increase.
Stations Ech1 to Ech3 (Inaouéne) exhibit the lowest values (0.79% to 1.64%), grouped in Tukey’s C groups, reflecting low anthropogenic influence and limited organic matter input. In contrast, Ech5 (2.14%) stands out statistically (Group A), indicating a more substantial accumulation due to domestic and agricultural discharges, as well as enhanced sedimentation in the stagnant waters of the dam.

3.1. Analysis and Distribution of Heavy Metals in Sediments

Analyzing heavy metal concentrations in river sediments is crucial for evaluating the effects of human activities and natural processes on watershed environmental quality. Elements such as zinc, copper, lead, chromium, and other trace metals (ETMs) can accumulate in sediments from industrial, agricultural, and urban sources, as well as natural rock erosion. To assess potential ecological risk, concentrations were compared to Sediment Quality Guidelines (SQGs), specifically the Threshold Effect Level (TEL) and Probable Effect Level (PEL) proposed by MacDonald [65].
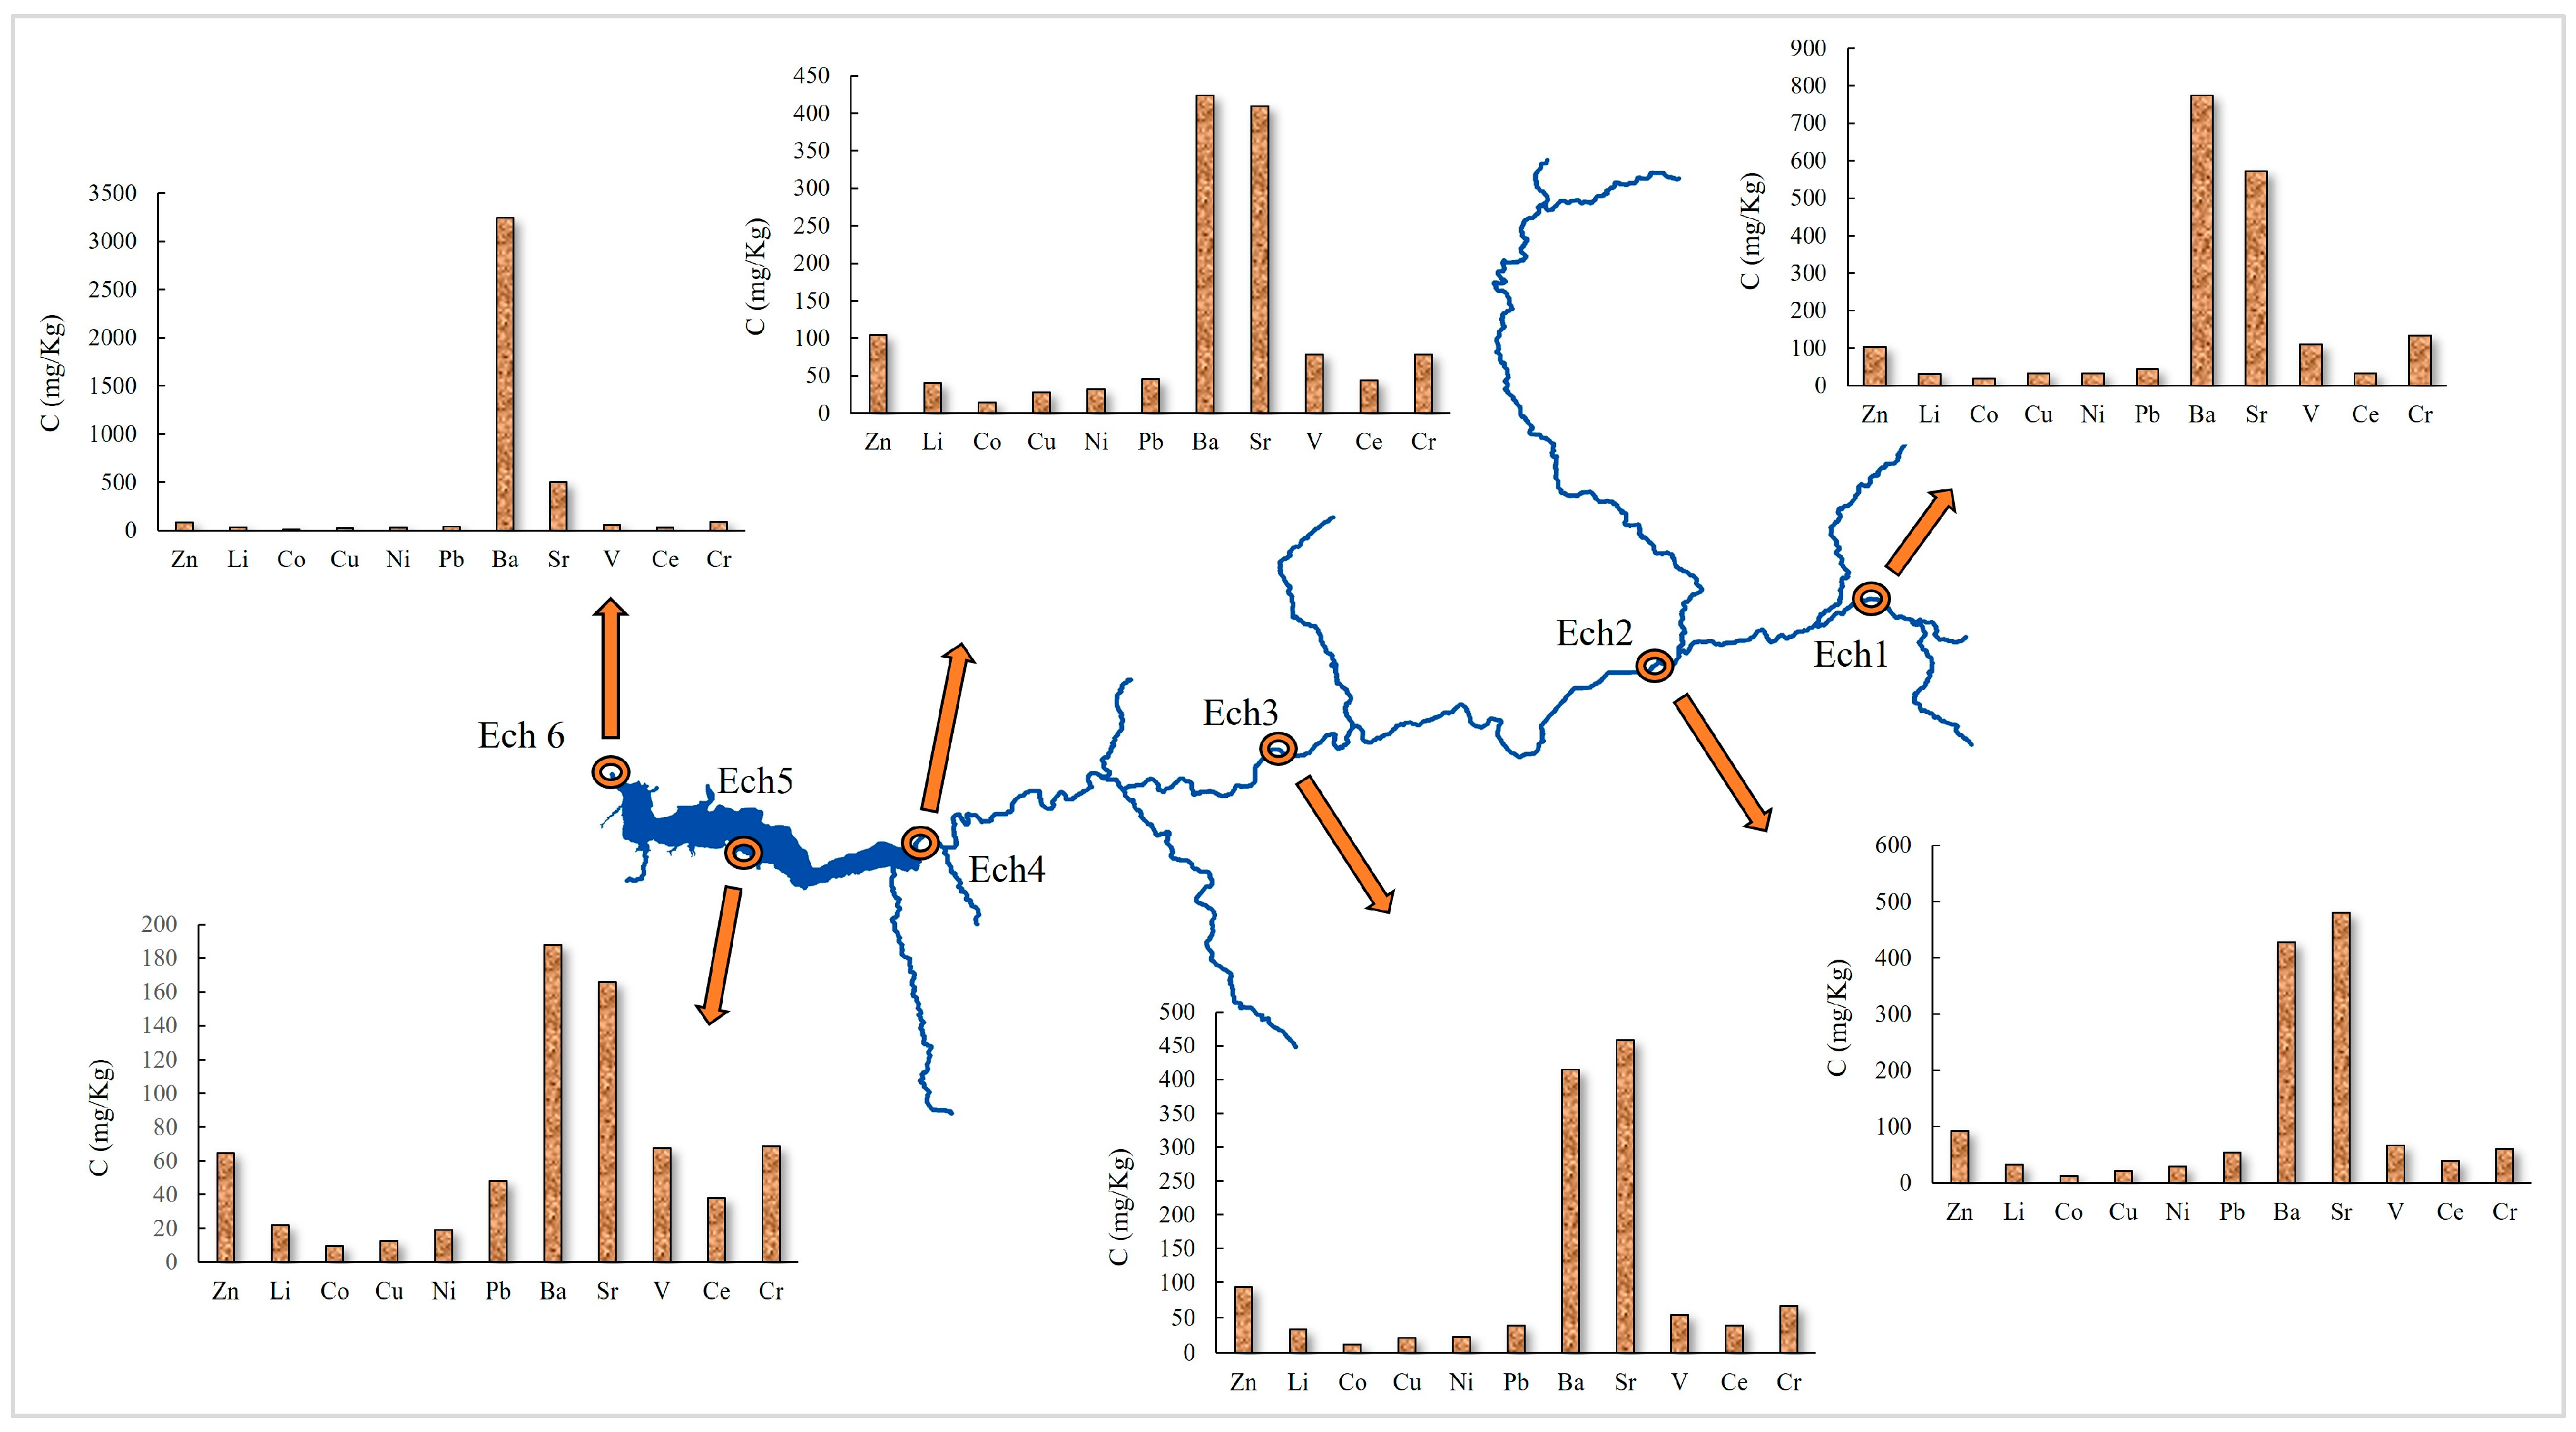
The figure provides a spatial overview of metal concentrations at six sites along the Inaouéne and at the Idriss 1st Dam, helping to identify possible contamination sources and accumulation patterns.

3.1.1. Zinc (Zn)

Zinc concentrations (Figure 3), range from 64.5 mg/kg at Ech5 to 104.5 mg/kg at Ech4. Zinc is often associated with industrial discharges and agricultural fertilizer use [66]. The higher values observed at certain stations, particularly at Ech1 and Ech4, suggest pollution from nearby anthropogenic sources, likely linked to intensive agricultural activities along the Inaouéne. According to Nazir et al. [67], zinc is commonly found in river sediments due to its use in fertilizers and pesticides. In contrast, concentrations are generally lower at Ech5 (middle of the dam), reflecting less pollution at this location, primarily due to dilution by large quantities of clear water from surrounding runoff and tributaries [68]. This helps to reduce its concentration in sediments compared to the other stations.
Zinc concentrations across all stations (64.5 to 104.5 mg/kg) are below the Threshold Effect Level (TEL) (124 mg/kg), indicating no expected negative effects on aquatic organisms concerning zinc. None of the sites exceed the Probable Effect Level (PEL) threshold of 271 mg/kg, so zinc contamination appears to be moderate and under control. Zinc concentrations at all stations (64.5 to 104.5 mg/kg) are below the Threshold Effect Level (TEL) of 124 mg/kg, suggesting no expected negative impacts on aquatic organisms related to zinc. All locations remain below the Probable Effect Level (PEL) threshold of 271 mg/kg, indicating that zinc pollution is modest and manageable.

3.1.2. Lithium (Li)

Lithium concentrations (Figure 3) vary across stations, with notably higher values at Ech4 (40.5 mg/kg) and Ech6 (38.5 mg/kg), compared to the lowest concentration at Ech5 (22 mg/kg). These relatively high levels suggest a potential influence from the geological composition of surrounding rocks, as lithium is naturally present in certain geological formations rich in minerals such as granite. Adeel et al. [69] highlight that lithium can be mobilized into fluvial systems through soil and rock erosion, especially in areas where anthropogenic pressures exacerbate natural weathering and transport processes.

3.1.3. Cobalt (Co)

Cobalt concentrations are highest at Ech1 (18 mg/kg) and lowest at Ech5 (9.5 mg/kg). Cobalt is often an indicator of industrial pollution, and its gradual decrease in downstream stations may reflect dilution effects or reduced industrial activity in these areas (Ech4, Ech5, and Ech6). Huang et al. [70] emphasize that heavy metals, such as cobalt, can be transported over long distances in rivers, but their concentration typically decreases as they are adsorbed by sediments.

3.1.4. Copper (Cu)

All living organisms require copper as an essential element, yet it becomes toxic when concentrations are elevated [71]. The copper content at various stations exhibits a range, with Ech5 showing the lowest level at 12.5 mg/kg and Ech1 displaying the highest at 32.5 mg/kg (Figure 3). The highest concentrations observed at Ech1 and Ech4 are primarily linked to agricultural practices in the study area. Copper is frequently used in fungicides to protect crops [72], and agricultural activities near rivers can lead to leaching of contaminated soils into rivers through rainfall, thus transporting copper into the watercourse. Domestic wastewater discharges can also introduce copper into the environment, and certain household products containing copper, such as detergents, may be indirect sources of copper [73]. Copper concentrations in all stations, except for Ech5 (12.5 mg/kg), exceed the TEL threshold (18.7 mg/kg). However, all stations are well below the PEL threshold (108 mg/kg). Copper concentrations indicate a potential mild contamination, especially at Ech1 (32.5 mg/kg), but no severe ecotoxicological effects are expected.

3.1.5. Nickel (Ni)

The sediment Ni concentrations across the examined stations are depicted in Figure 3, revealing peak levels of 32 mg/kg at Ech1 and Ech4, while Ech5 exhibited the lowest concentration at 19 mg/kg. Nickel’s presence in these areas can be attributed to natural sources, primarily iron oxides and iron-rich laterites. This explains the elevated Ni levels observed at all locations situated within the Lias carbonated terrains, which feature exposed red Triassic clay formations. Similar results have been reported in studies on Fe-Ni lateritic deposits, particularly in regions with ultramafic rocks, which contribute to the widespread presence of nickel through natural weathering [74]. Nickel concentrations in all stations exceed the TEL threshold (15.9 mg/kg), with particularly high values at Ech1 and Ech4 (32 mg/kg). While these values do not exceed the PEL threshold (42.8 mg/kg), they indicate notable pollution at several stations, which could pose long-term toxicity problems for aquatic life.

3.1.6. Lead (Pb)

Lead (Figure 3) shows a high concentration at station Ech2 (54.5 mg/kg), which is typical of areas affected by anthropogenic discharges related to pollution from effluents from the city of Taza upstream of the basin. The low concentrations at Ech3 (39 mg/kg) may indicate less anthropogenic influence at that site. Pb is recognized as a key indicator of anthropogenic contamination in river systems due to its historical widespread use in fuels and industrial products, such as gasoline and paints. This heavy metal can persist in the environment for long periods, leading to significant accumulation in sediments [75]. Lead concentrations are all above the TEL threshold (30.2 mg/kg), and Ech2 (54.5 mg/kg) far exceeds this threshold, suggesting notable contamination at this station. However, no station exceeds the PEL threshold (112 mg/kg), so while contamination is present, it is not considered extremely dangerous according to Canadian standards.

3.1.7. Barium (Ba) and Strontium (Sr)

The extremely high concentrations of barium (3245 mg/kg) and strontium (505 mg/kg) at Ech6, compared to other stations, suggest accumulation in the sediments downstream of the Idriss 1st dam. These elements can be mobilized by the erosion of rocks rich in barium and strontium, but their massive accumulation at Ech6 is likely due to the dam’s retention effect, which traps sediments. Dams are well documented for modifying sediment dynamics, leading to the accumulation of certain elements downstream, including barium and strontium) [76,77].

3.1.8. Vanadium (V)

Vanadium reaches high concentrations at Ech1 located upstream of the Inaouéne (110 mg/kg) and a minimum is recorded at station Ech3 (54.5 mg/kg) (Figure 3). The high concentration suggests an influence from multiple natural and anthropogenic sources. It is linked to domestic and agricultural discharges from urban areas and surrounding farms. The application of phosphate fertilizers in agriculture and the release of untreated wastewater may have intensified vanadium levels in these regions. Moreover, the significant concentration could also be influenced by the erosion of schist formations present in the watershed. These metamorphic rocks, rich in vanadium-containing minerals, contribute to the natural input of this element into river sediments through runoff and erosion. Vanadium tends to adsorb onto clay particles, metal oxides, and organic matter in sediments [78]. Once adsorbed, it can remain trapped in these particles for extended periods.

3.1.9. Cerium (Ce)

Cerium is more concentrated at Ech4 (43.5 mg/kg) and decreases at Ech6 (28.5 mg/kg) (Figure 3). Ce sources may be natural, from the weathering of igneous rocks. However, human activities may contribute to the variability of its concentration, as indicated. The contamination of the environment by rare earth elements (REE), including cerium, is an increasing concern due to their wide use in various high-tech applications, leading to potential accumulation in soils and water systems [79].

3.1.10. Chromium (Cr)

Chromium concentrations range from 61 mg/kg (Ech2) to 133 mg/kg (Ech1) (Figure 3), likely reflecting a combination of several sources. Naturally, it is released into the environment by the weathering of rocks, which can lead to the formation of hexavalent chromium (Cr VI), a toxic and mobile form in soils and waters [80]. Anthropogenic activities, such as metal production, waste treatment, paint manufacturing, and tanning, are major contributors to chromium pollution. Finally, agricultural practices, including the use of fertilizers derived from sewage sludge, may also contaminate soils [81], and subsequently, the sediments of the Inaouéne. Chromium concentrations in several stations (Ech1: 133 mg/kg, Ech4: 78 mg/kg, Ech6: 91.5 mg/kg) exceed the TEL threshold (52.3 mg/kg), indicating significant contamination. The concentration at Ech1 (133 mg/kg) is dangerously close to the PEL threshold (160 mg/kg), suggesting concerning chromium pollution at this site.

3.2. Pollution and Risk Evaluation

3.2.1. Geoaccumulation Index (Igeo)

The analysis of the Igeo for various heavy metals in the sediments of the sampling stations (Ech1 to Ech6) allows for evaluating the pollution level in the Inaouéne watershed (Figure 4). The geoaccumulation index (Igeo) values provide an overview of metal accumulation in sediments, ranking pollution levels for each metal according to an established scale (Table 1).
By analyzing the geoaccumulation index (Igeo) for the heavy metals in the sampling stations Ech1 to Ech6 (Table 5, Figure 4), a descending order of metal accumulation is observed as follows: Pb (1.096) > Cr (1.341) > Zn (0.422) > Cu (0.599) > V (0.468) > Ni (0.198) > Sr (0.272) > Li (0.295) > Co (0.049) > Ba (−0.372) > Ce (−1.180). The negative Igeo values for barium (Ba) and cerium (Ce) in all stations indicate a level of zero pollution, reflecting the natural background concentration of these elements without accumulation from anthropogenic sources.
The Igeo values for nickel (Ni), copper (Cu), zinc (Zn), and vanadium are mostly between 0 and 1, indicating low pollution. However, the Igeo values for zinc in station Ech4 (0.422) and copper in Ech1 (0.599) approach the threshold for moderate pollution, suggesting a slight accumulation that could come from local sources.
Lead (Pb) shows a higher average value, reaching 1.096 at station Ech2, classifying it in the moderately polluted to non-polluted category. This pollution level, slightly higher than for other metals, is attributed to anthropogenic contributions related to domestic effluents in this region.
As for chromium (Cr), although its average Igeo remains low, it reaches a notable value of 1.341 at station Ech1, indicating a moderate to non-polluted level of pollution. This accumulation of chromium in Ech1 suggests a point source of pollution at this particular station.

3.2.2. Enrichment Factor (EF) and Sediment Pollution Index (SPI)

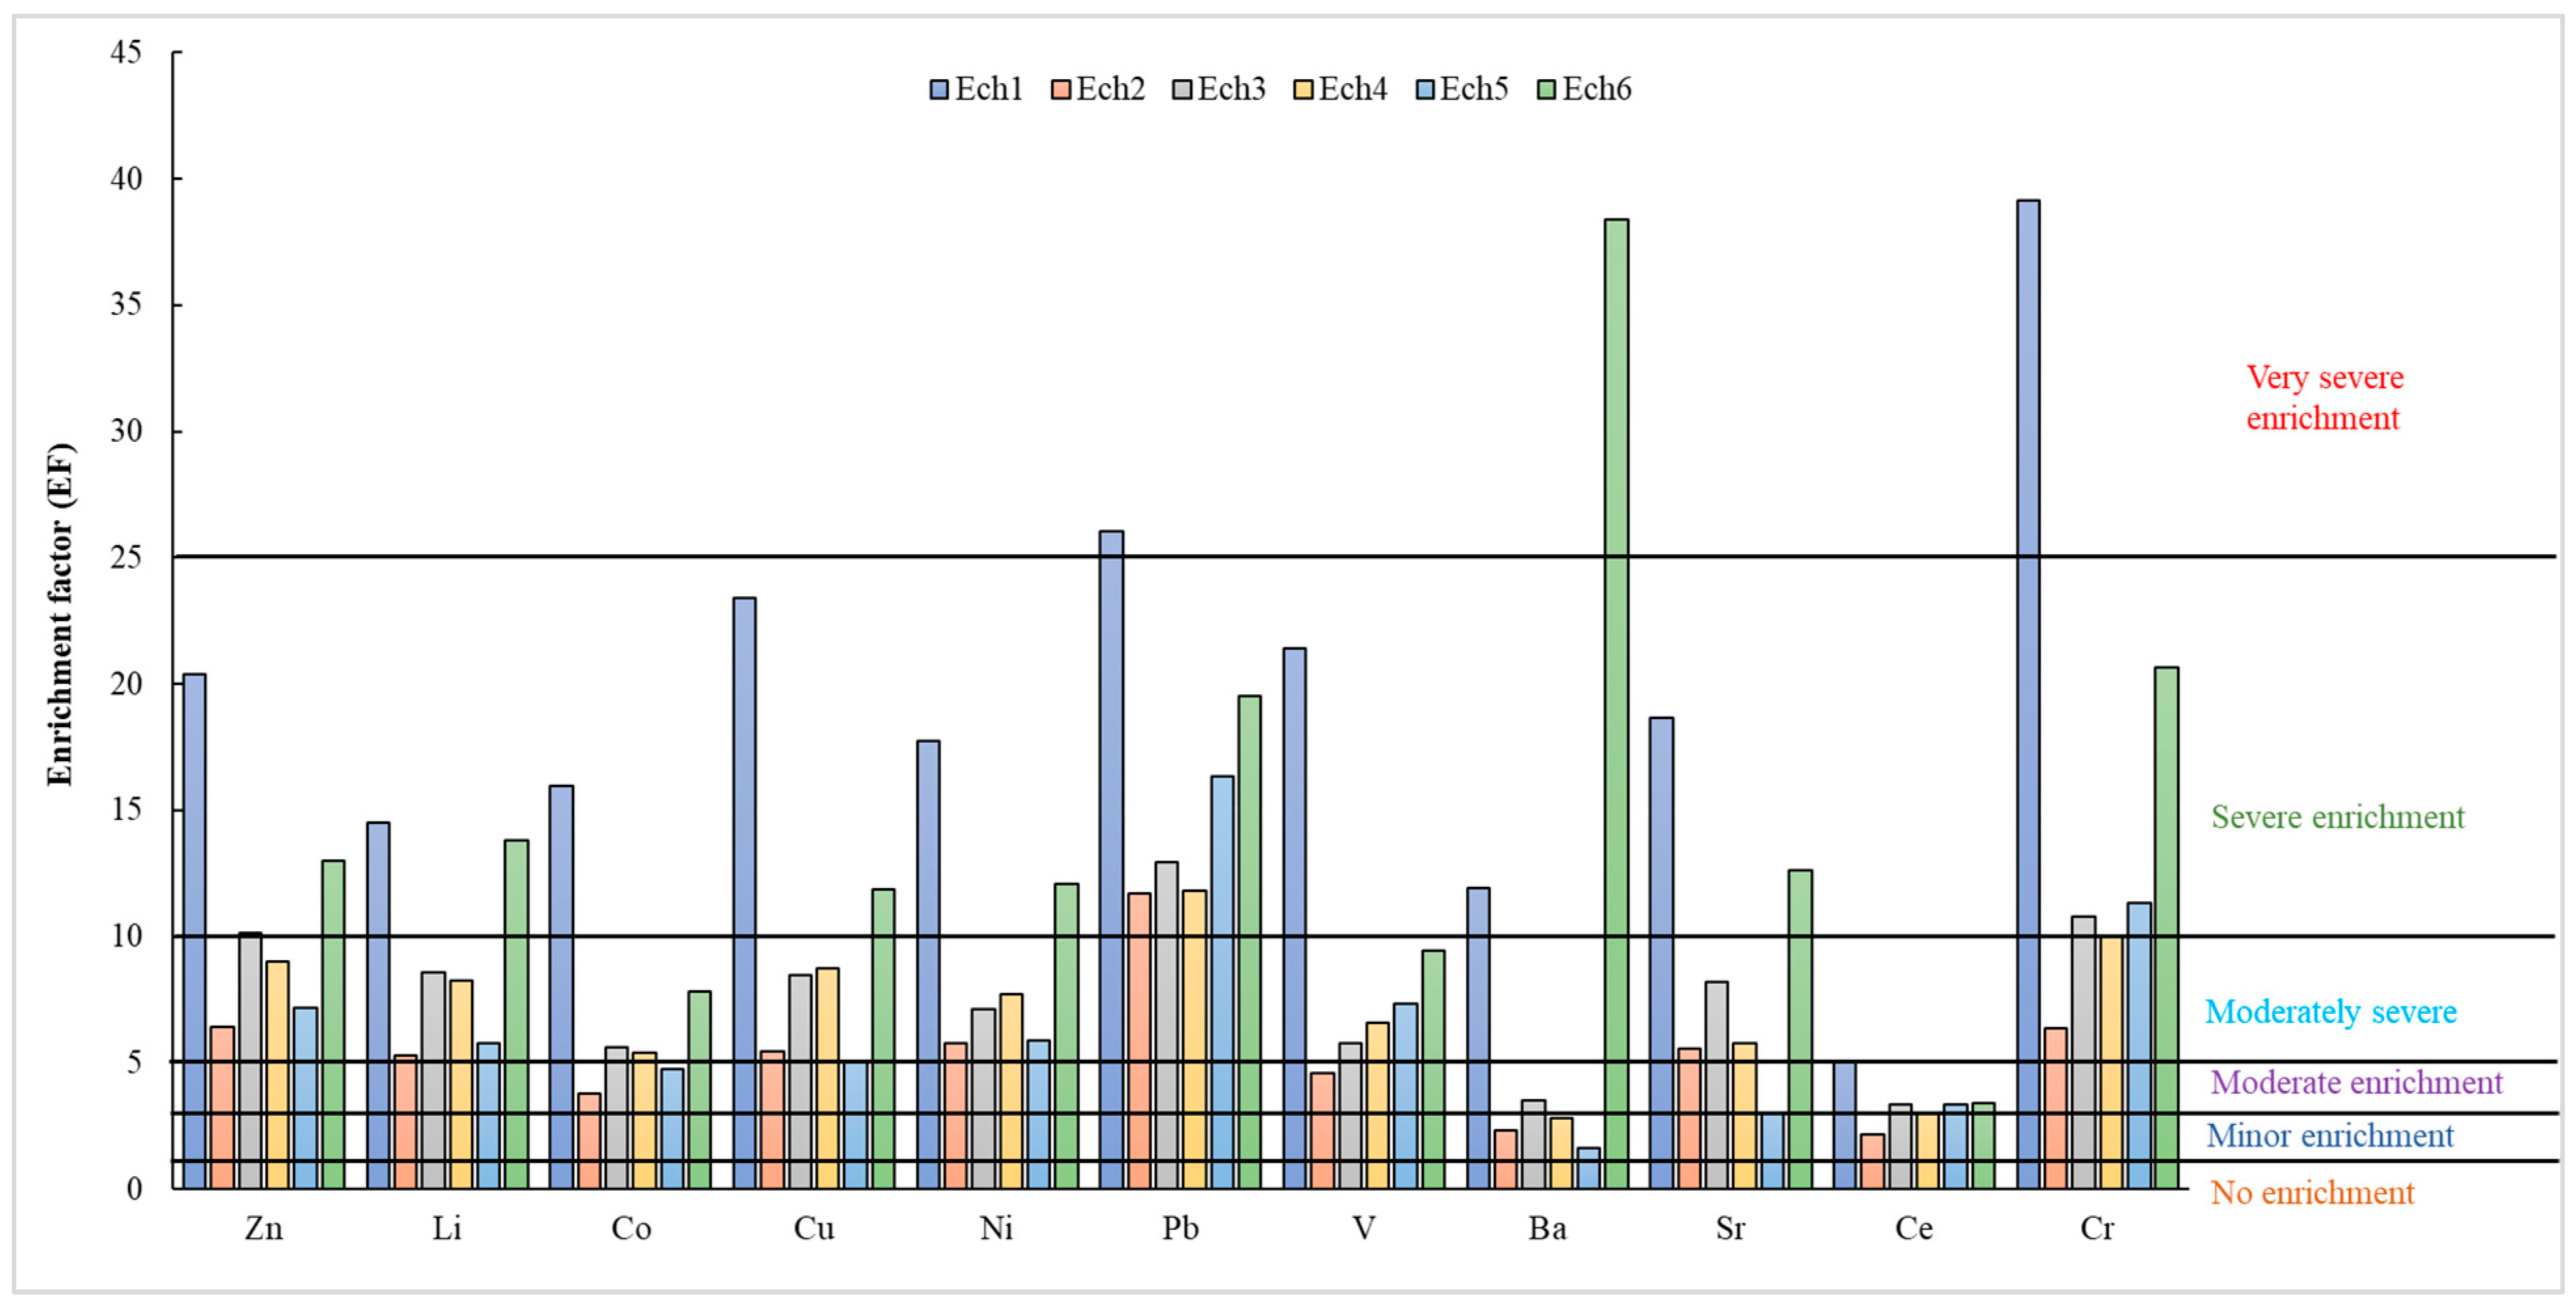
The enrichment factor (EF) values for the examined heavy metals, calculated with zirconium as the reference element, are shown in the preceding table. These values can be interpreted by referring to the EF classification standards outlined in Table 1. The sediments of Inaouéne exhibit varying levels of contamination across different sampling locations, as evidenced by the disparate enrichment factors (EF) for elements such as Zn, Li, Ni, Cu, Pb, Co, V, Ba, Sr, Ce, and Cr (Figure 5).
The EF values (Table 5) for Zn range from 6.5 to 20.4, cobalt (Co) from 3.8 to 16, and copper (Cu) from 5.1 to 23.4, classifying these elements in the moderately severe to severe enrichment category. Lead (Pb), with EF values ranging from 11.7 to 26.1, and barium (Ba), reaching a high value of 38.4 at station Ech6, also show severe enrichment levels, likely linked to industrial pollution sources. For other metals, strontium (Sr) shows EF values between 3.0 and 18.7, while cerium (Ce) ranges from 2.2 to 5.1, and chromium (Cr) varies from 6.4 to 39.2. These metals display moderate to severe enrichment, with a particularly high concentration of Cr, especially at stations Ech1 and Ech6, suggesting a notable anthropogenic contribution.
The descending order of EF values for the heavy metals, excluding zirconium, is as follows: Cr > Co > Cu > Pb > Zn > V. This order indicates that Cr and Co exhibit the highest enrichment levels among the studied metals, while zinc and vanadium (V) have lower but still significant enrichment values.
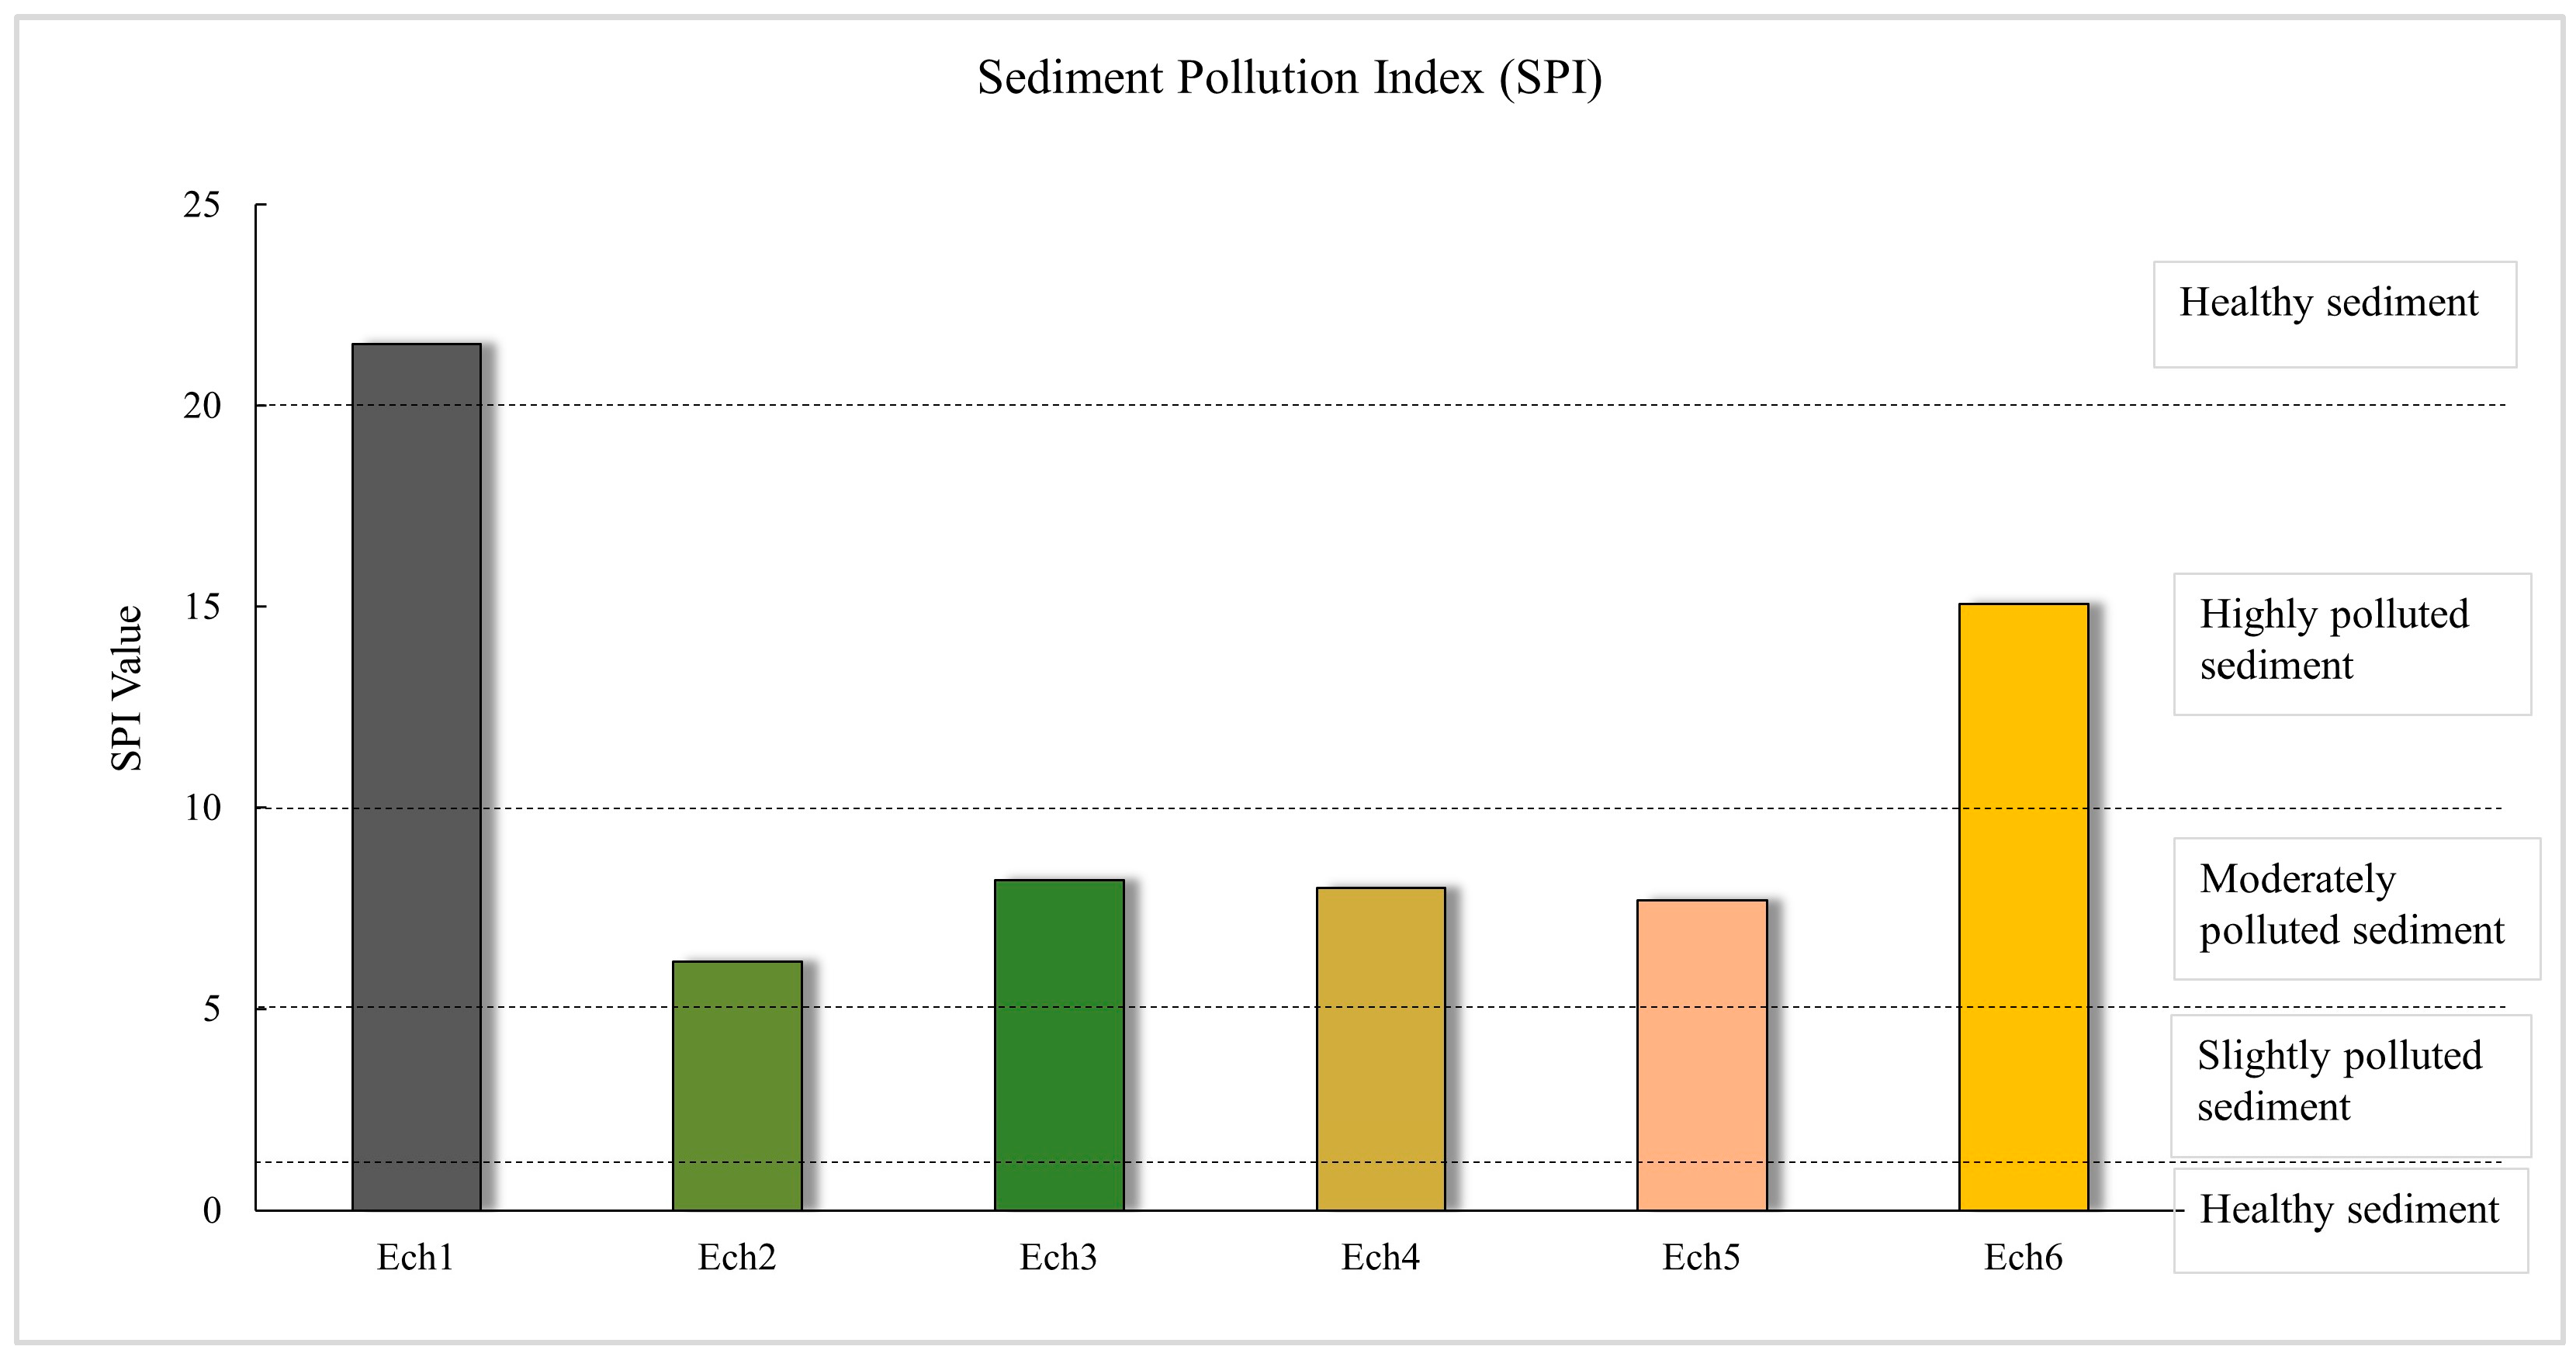
To assess the potential risk of sediment in the Inaouène watershed, a sediment pollution index (SPI) was used. The results show varying levels of pollution between the different sampling sites (Figure 6).
The highest pollution level was observed at station Ech1, with an SPI value reaching 21.53 (Table 6), classifying this station as having “hazardous sediments”. This level signifies considerable pollution in this part of the Inaouène River, probably caused by nearby pollution sources or the buildup of heavy metals carried by the river. On the other hand, stations Ech2, Ech3, Ech4, and Ech5 show SPI values ranging from 6.17 to 8.19, suggesting a moderate level of pollution. Although lower than that of Ech1, these values indicate notable contamination, pointing to a potential impact on the ecosystem. These levels may be influenced by anthropogenic activities in the area, such as domestic discharges and agricultural runoff.
Station Ech6, located downstream of the dam, exhibits an SPI of 15.06, indicating a high level of pollution. This result can be attributed to the sedimentation of polluted particles accumulating in this area due to the water flow slowdown caused by the dam. It may also reflect ongoing contaminant accumulation, necessitating rigorous environmental monitoring to prevent impacts on biodiversity.

3.2.3. Contamination Factor (CF), Modified Degree of Contamination (mCd), and Pollution Load Index (PLI)

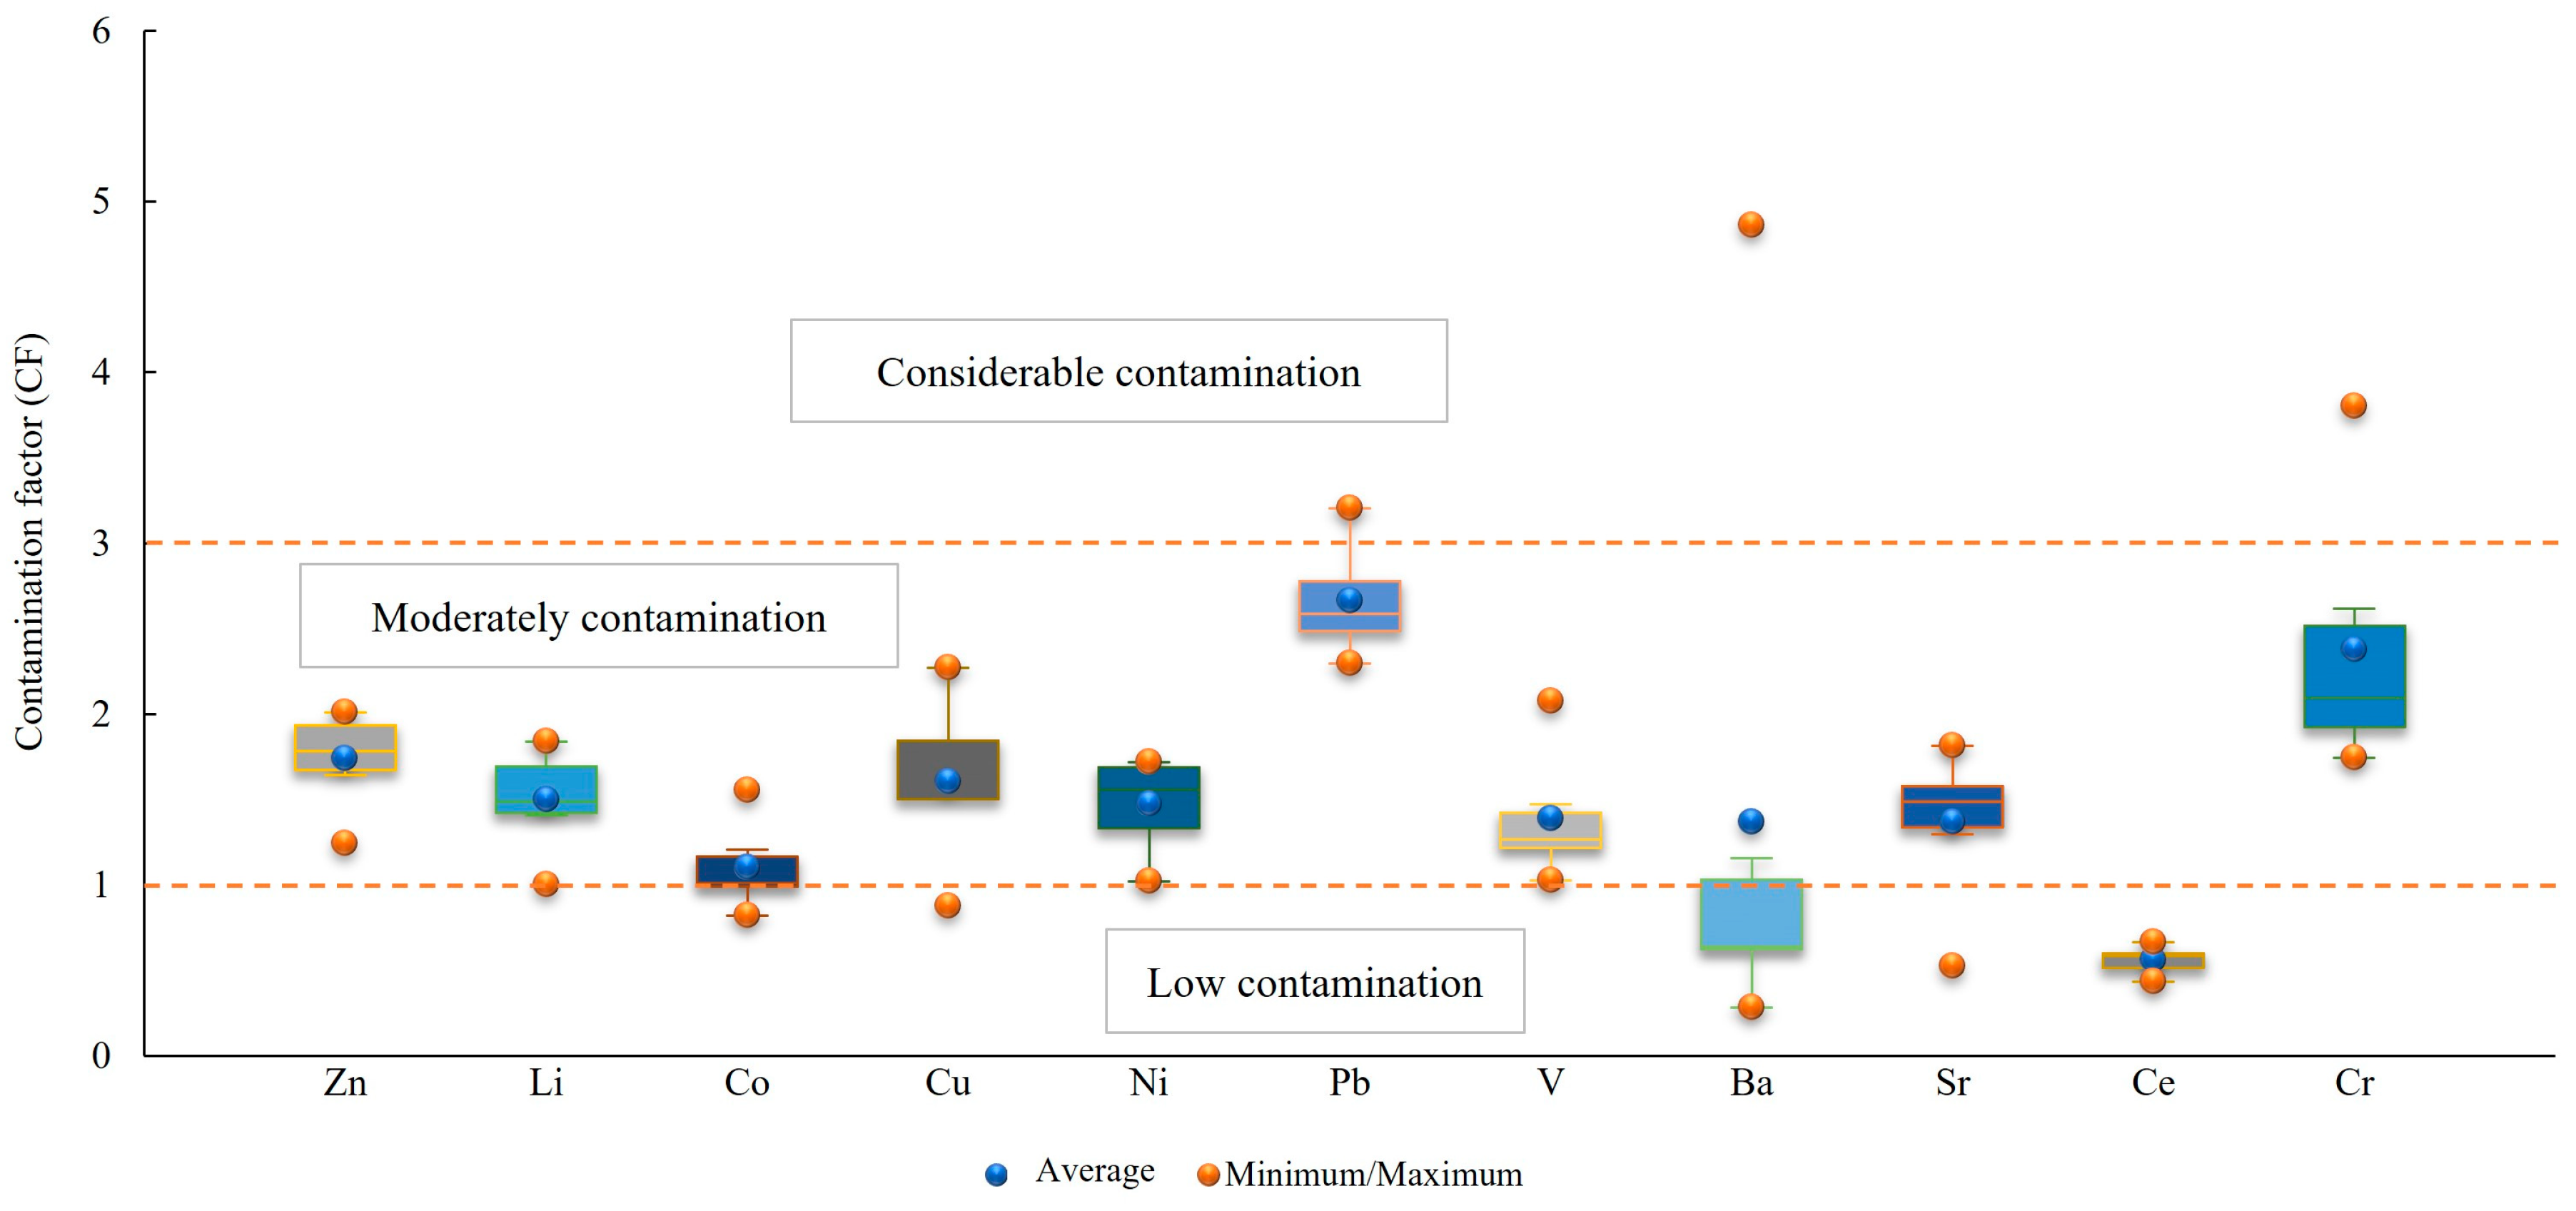
In sediment samples, CF values (Figure 7) for most heavy metals, including copper (Cu), zinc (Zn), cobalt (Co), lithium (Li), nickel (Ni), vanadium (V), and chromium (Cr), predominantly range between 1 and 3, corresponding to moderate contamination based on classification thresholds. For instance, the CF values for zinc range from 1.24 to 2.01 (Table 5), indicating moderate contamination across all stations. This pattern is consistent for cobalt, with values ranging from 0.82 (Ech5) to 1.55 (Ech1), demonstrating generally low contamination levels in some stations and moderate levels in others.
Lead (Pb) exhibits higher CF values, ranging from 2.47 (Ech6) to 3.21 (Ech2), placing it primarily in the considerable contamination category in certain stations, particularly Ech2. This considerable contamination level may be attributed to local pollution sources, potentially linked to anthropogenic and agricultural activities in the region.
Barium (Ba) generally shows low CF values, often below 1, except at station Ech6, where the CF reaches 4.86, indicating considerable contamination. This anomaly might suggest a localized pollution source or enriched barium deposits at this specific station.
For chromium (Cr), CF values range from 1.74 to 3.80, placing it mostly in the moderate contamination category, with considerable contamination observed at certain stations, such as Ech1. Copper (Cu), with CF values between 0.87 (Ech5) and 2.27 (Ech1), falls into the moderate contamination category at most stations. This contamination is attributed to diffuse anthropogenic sources, including domestic discharges and agricultural activities.
The decreasing order of contamination for the elements across all stations is as follows: Pb > Cr > Cu > Zn > Ni > Co, with lead and chromium showing the highest contamination levels. This suggests that lead may originate from specific pollution sources, such as effluent discharges from the city of Taza, while chromium could be linked to agricultural practices or naturally enriched background sources.
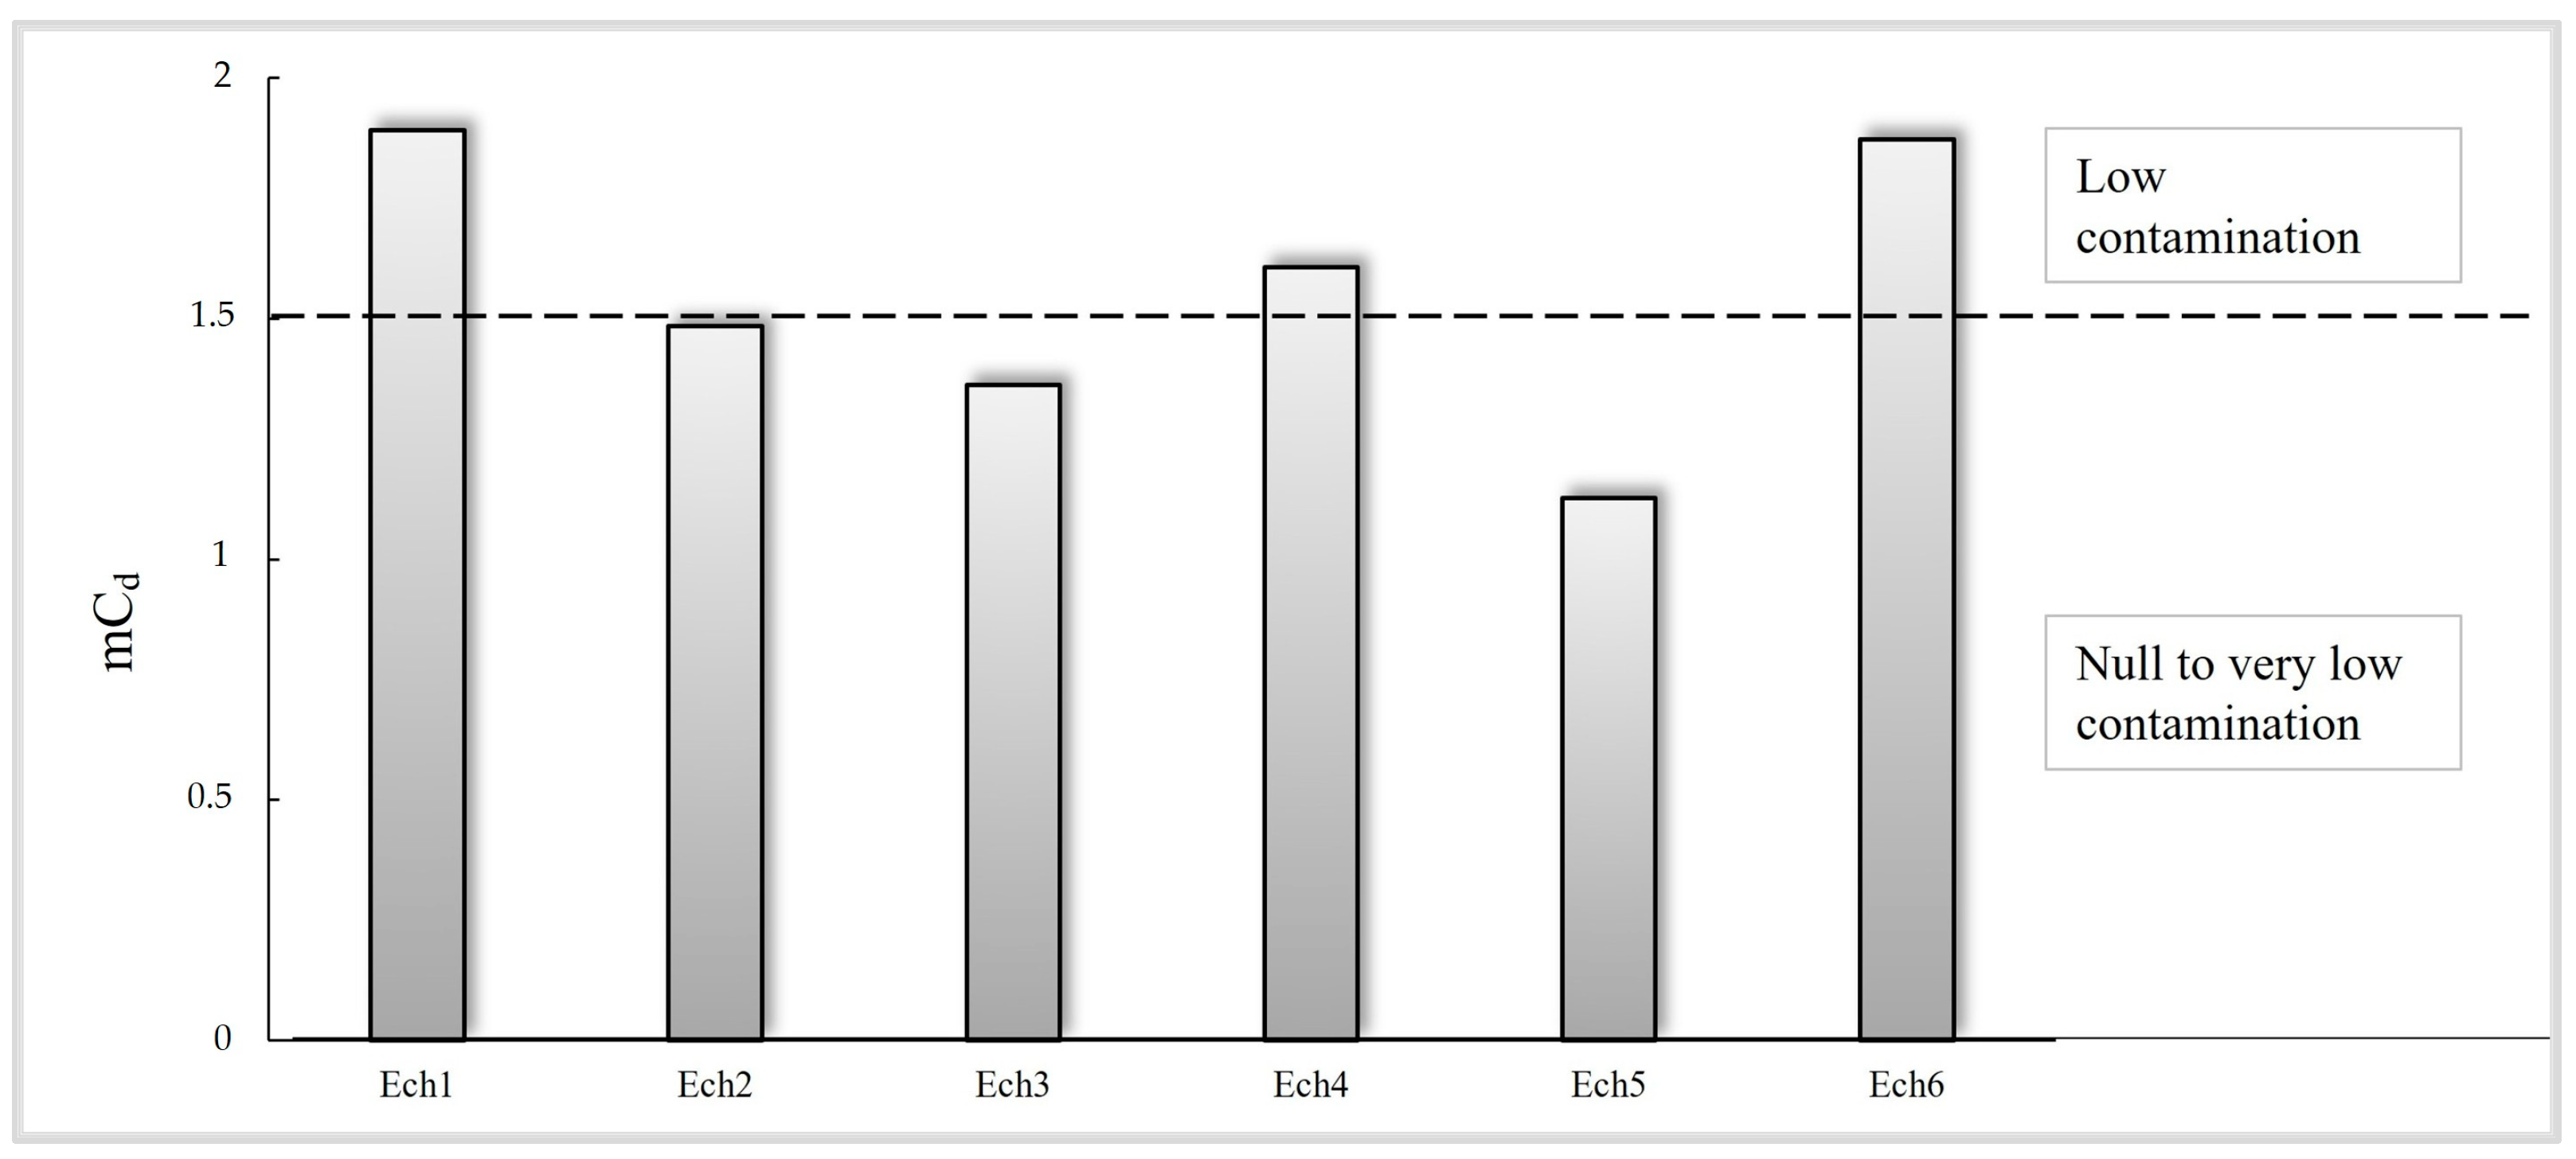
To assess the severity of sediment contamination at various sampling points in the Inaouène watershed, the modified degree of contamination (mCd) method was used (Figure 8, Table 6). Stations Ech1 and Ech6 indicate mCd values of 1.891 and 1.872, respectively, falling under the low contamination category (1.5 < mCd < 2). This suggests a moderate pollution impact. Station Ech4, with an mCd of 1.607, also belongs to this category. On the other hand, stations Ech2, Ech3, and Ech5, with mCd values of 1.484, 1.362, and 1.127, respectively, are classified as having no to very low contamination (mCd < 1.5). These results indicate moderate pollution in certain areas while showing an overall controlled pollution level within the Inaouène watershed.
The sediment pollution levels in the Inaouène River and the Idriss I Dam can be evaluated by examining the pollution load index (PLI) values obtained from various sampling locations (Figure 9). The PLI values across the six stations (Ech1 to Ech6) range from 1.257 (Ech5) to 1.318 (Ech1) (Table 6). All these PLI values are greater than 1, which, according to the classification, corresponds to a high pollution level. This elevated PLI across all stations indicates that the sediments in the region are not merely subject to background pollution but show significant enrichment with contaminants.
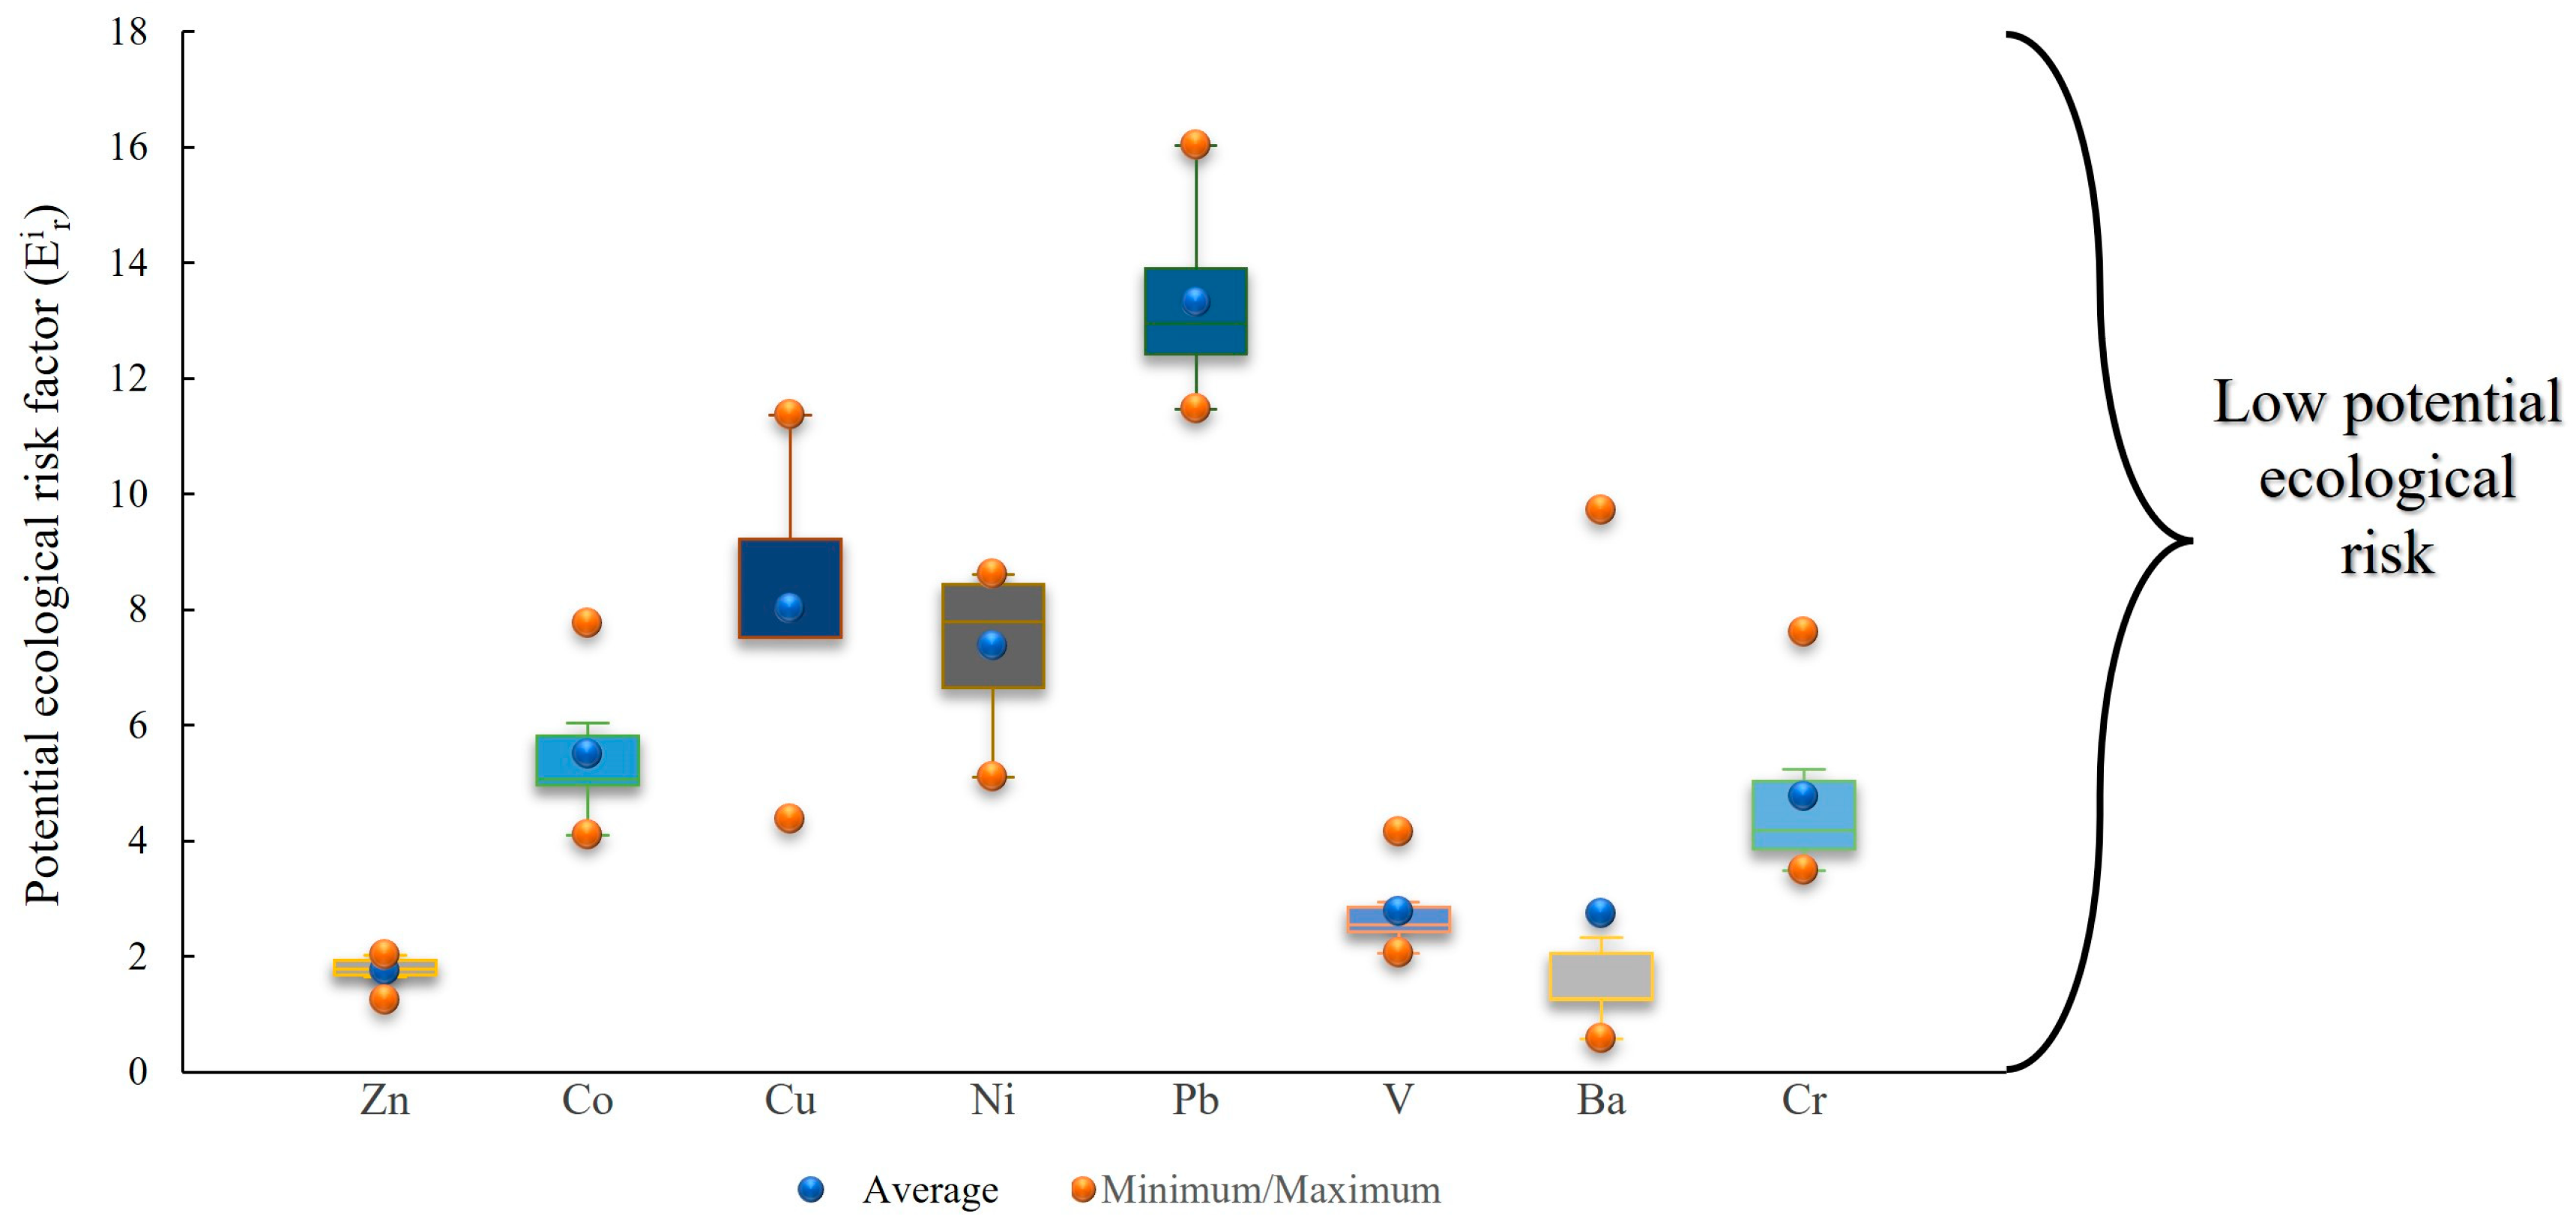
The potential ecological risk factors (Er) for the heavy metals examined in the Inaouène Watershed sediments are displayed in Figure 10 and Table 5. These E r i values follow a descending order: Pb (16.029) > Cu (11.364) > Ni (8.602) > Co (7.759) > Cr (7.600) > V (4.151) > Ba (2.317) > Zn (2.010). According to the classification, the examined heavy metals demonstrate a minimal ecological risk potential. Despite their low overall risk, Pb and Cu show the highest E r i values, indicating their comparatively greater toxicity to aquatic life than the other metals studied. The variations in E r i values observed across the stations can be attributed to localized inputs, likely influenced by anthropogenic activities and the inherent properties of the metals.
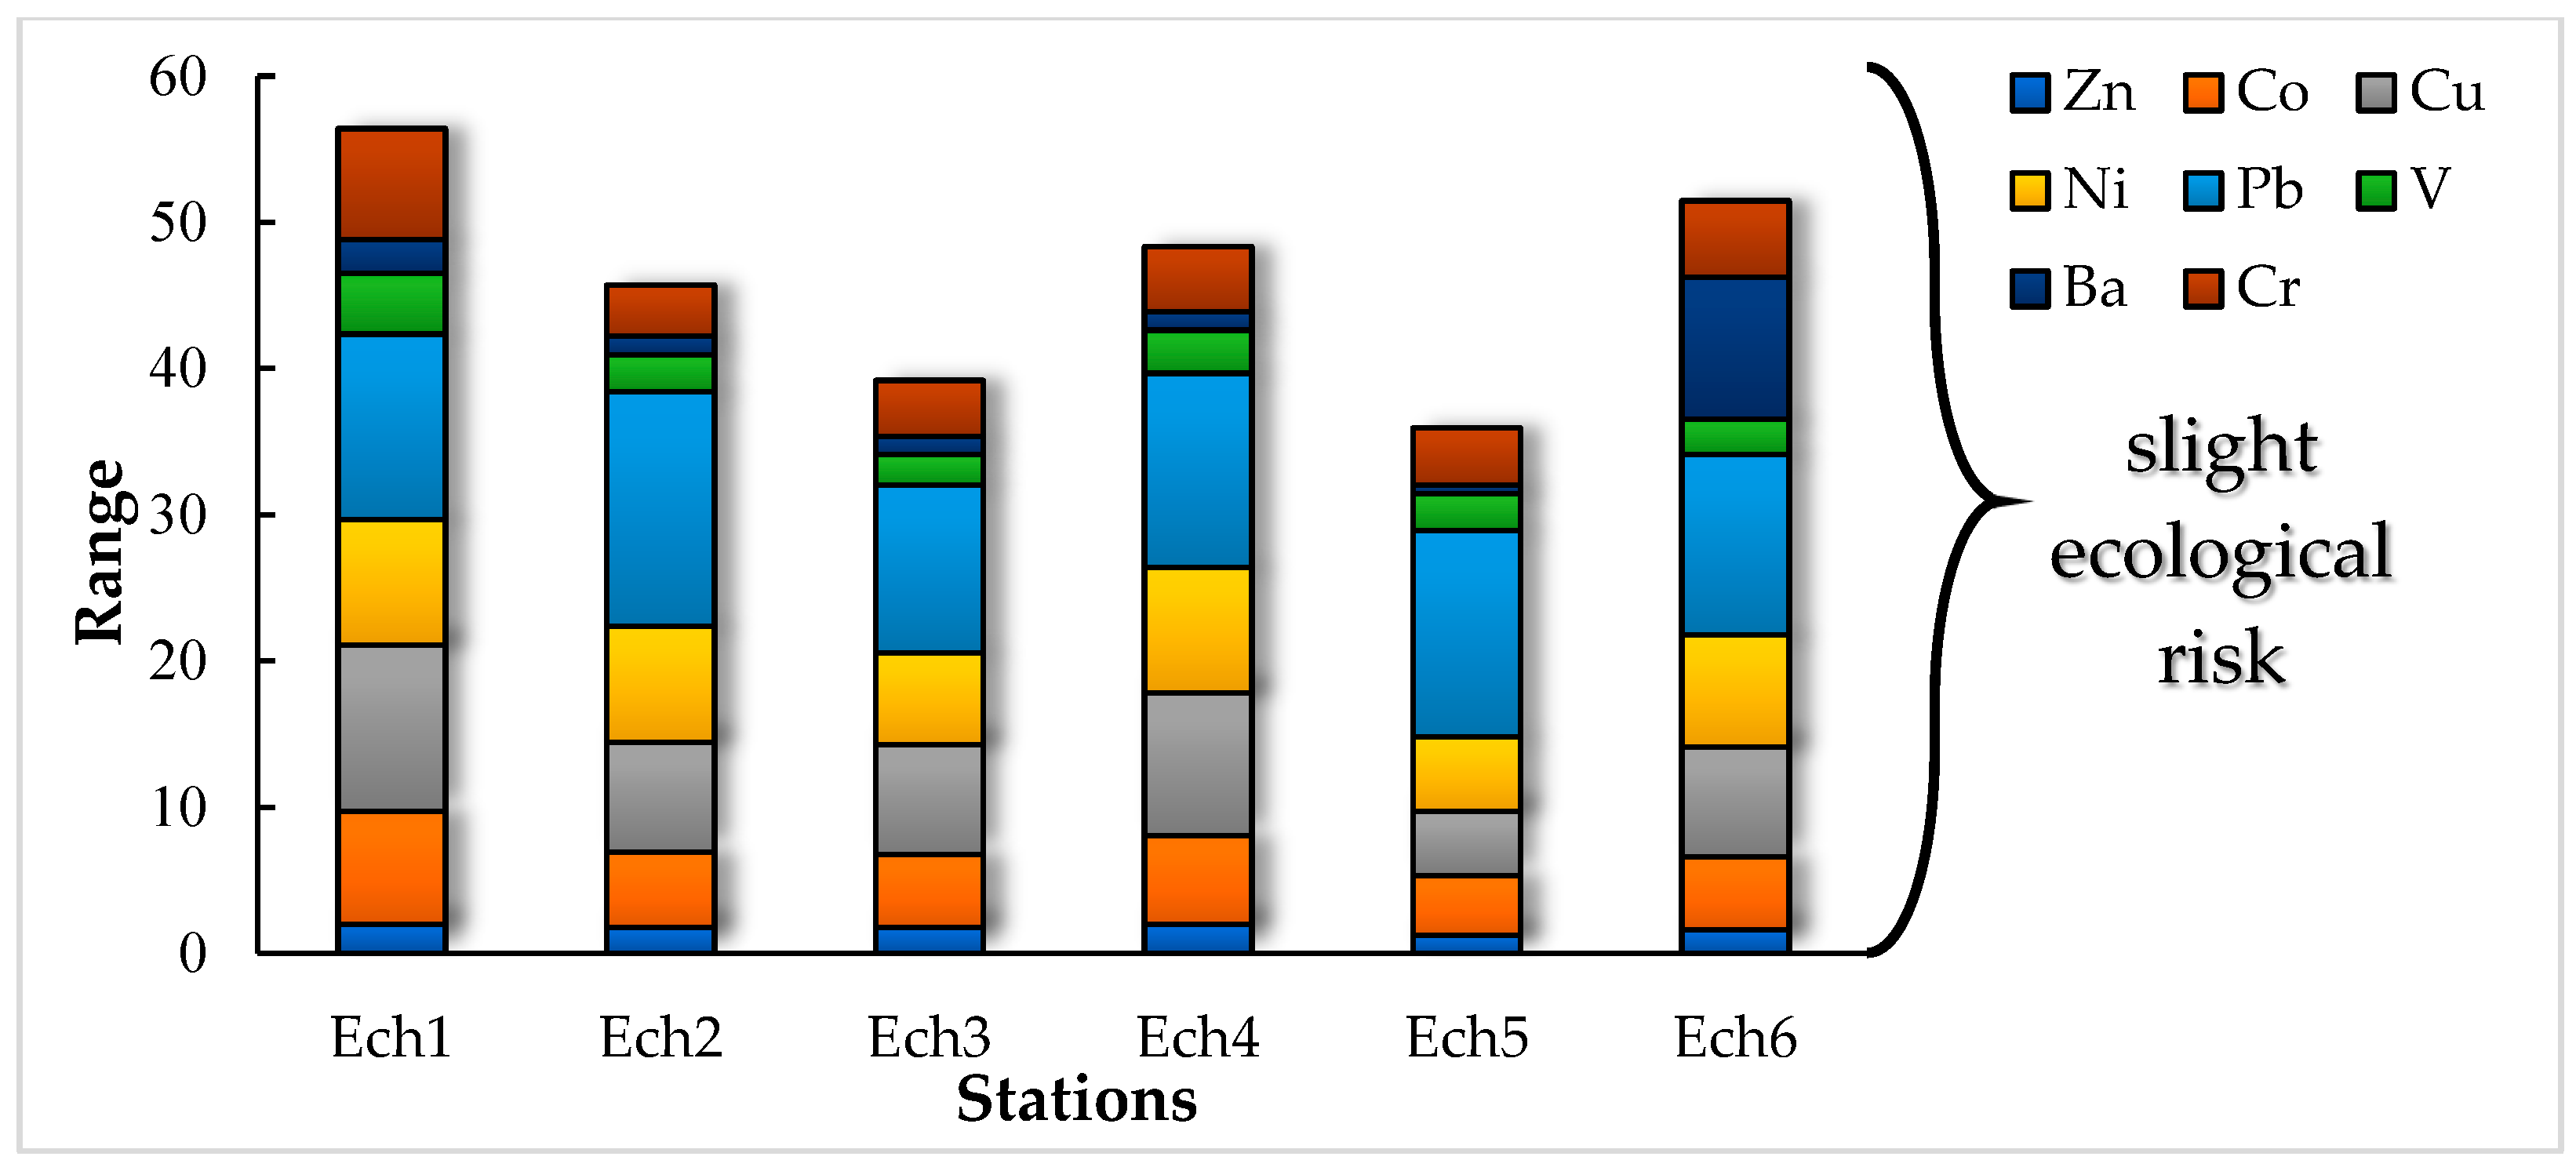
The potential ecological risk index (PERI) values for the Inaouène River and 1st Idriss Dam sampling sites are presented in Figure 11. All stations exhibit RI values below 60 (Table 6), indicating low ecological risk overall. Values followed an ascending gradient from Ech5 (35.955) in the mid-reservoir to Ech1 (56.421) upstream, with intermediate stations Ech3 (39.186), Ech2 (45.713), Ech4 (48.340), and Ech6 (51.473) showing progressive increases. While stations Ech1 and Ech6 displayed the highest PERI values within this range (56.421 and 51.473, respectively), their risk levels remain classified as low. At Ech1, this relative elevation reflects significant chromium (133 mg/kg) and copper (32.5 mg/kg) accumulation from untreated urban discharges near Taza, compounded by erosion of metal-rich Triassic clays. Downstream transport of lead from Ech2 (54.5 mg/kg) further contributes through adsorption onto fine sediments. The elevated PERI at Ech6 stems primarily from the dam’s sediment-trapping effect, which concentrates barium (3245 mg/kg) and strontium (505 mg/kg) elements that, despite their lower individual toxicity, contribute to cumulative risk through prolonged reservoir retention. While the stations Ech3 and Ech5 display relatively lower values, reflecting reduced pollution levels or diluted sediment inputs in these areas.
The PER is highly dependent on geochemical background concentrations, which vary across regions and geological contexts. The use of inappropriate reference values can distort the real risk assessment by overestimating or underestimating the ecological threat. To achieve a more accurate evaluation, the results of the PER were cross-referenced with other contamination indices (Igeo, EF, SPI, PLI) and multivariate analyses (PCA, CA). These approaches help strengthen the reliability of ecological risk assessment by triangulating the information and considering the diversity of environmental factors.

3.3. Identification of Pollution Sources

3.3.1. Correlation Matrix

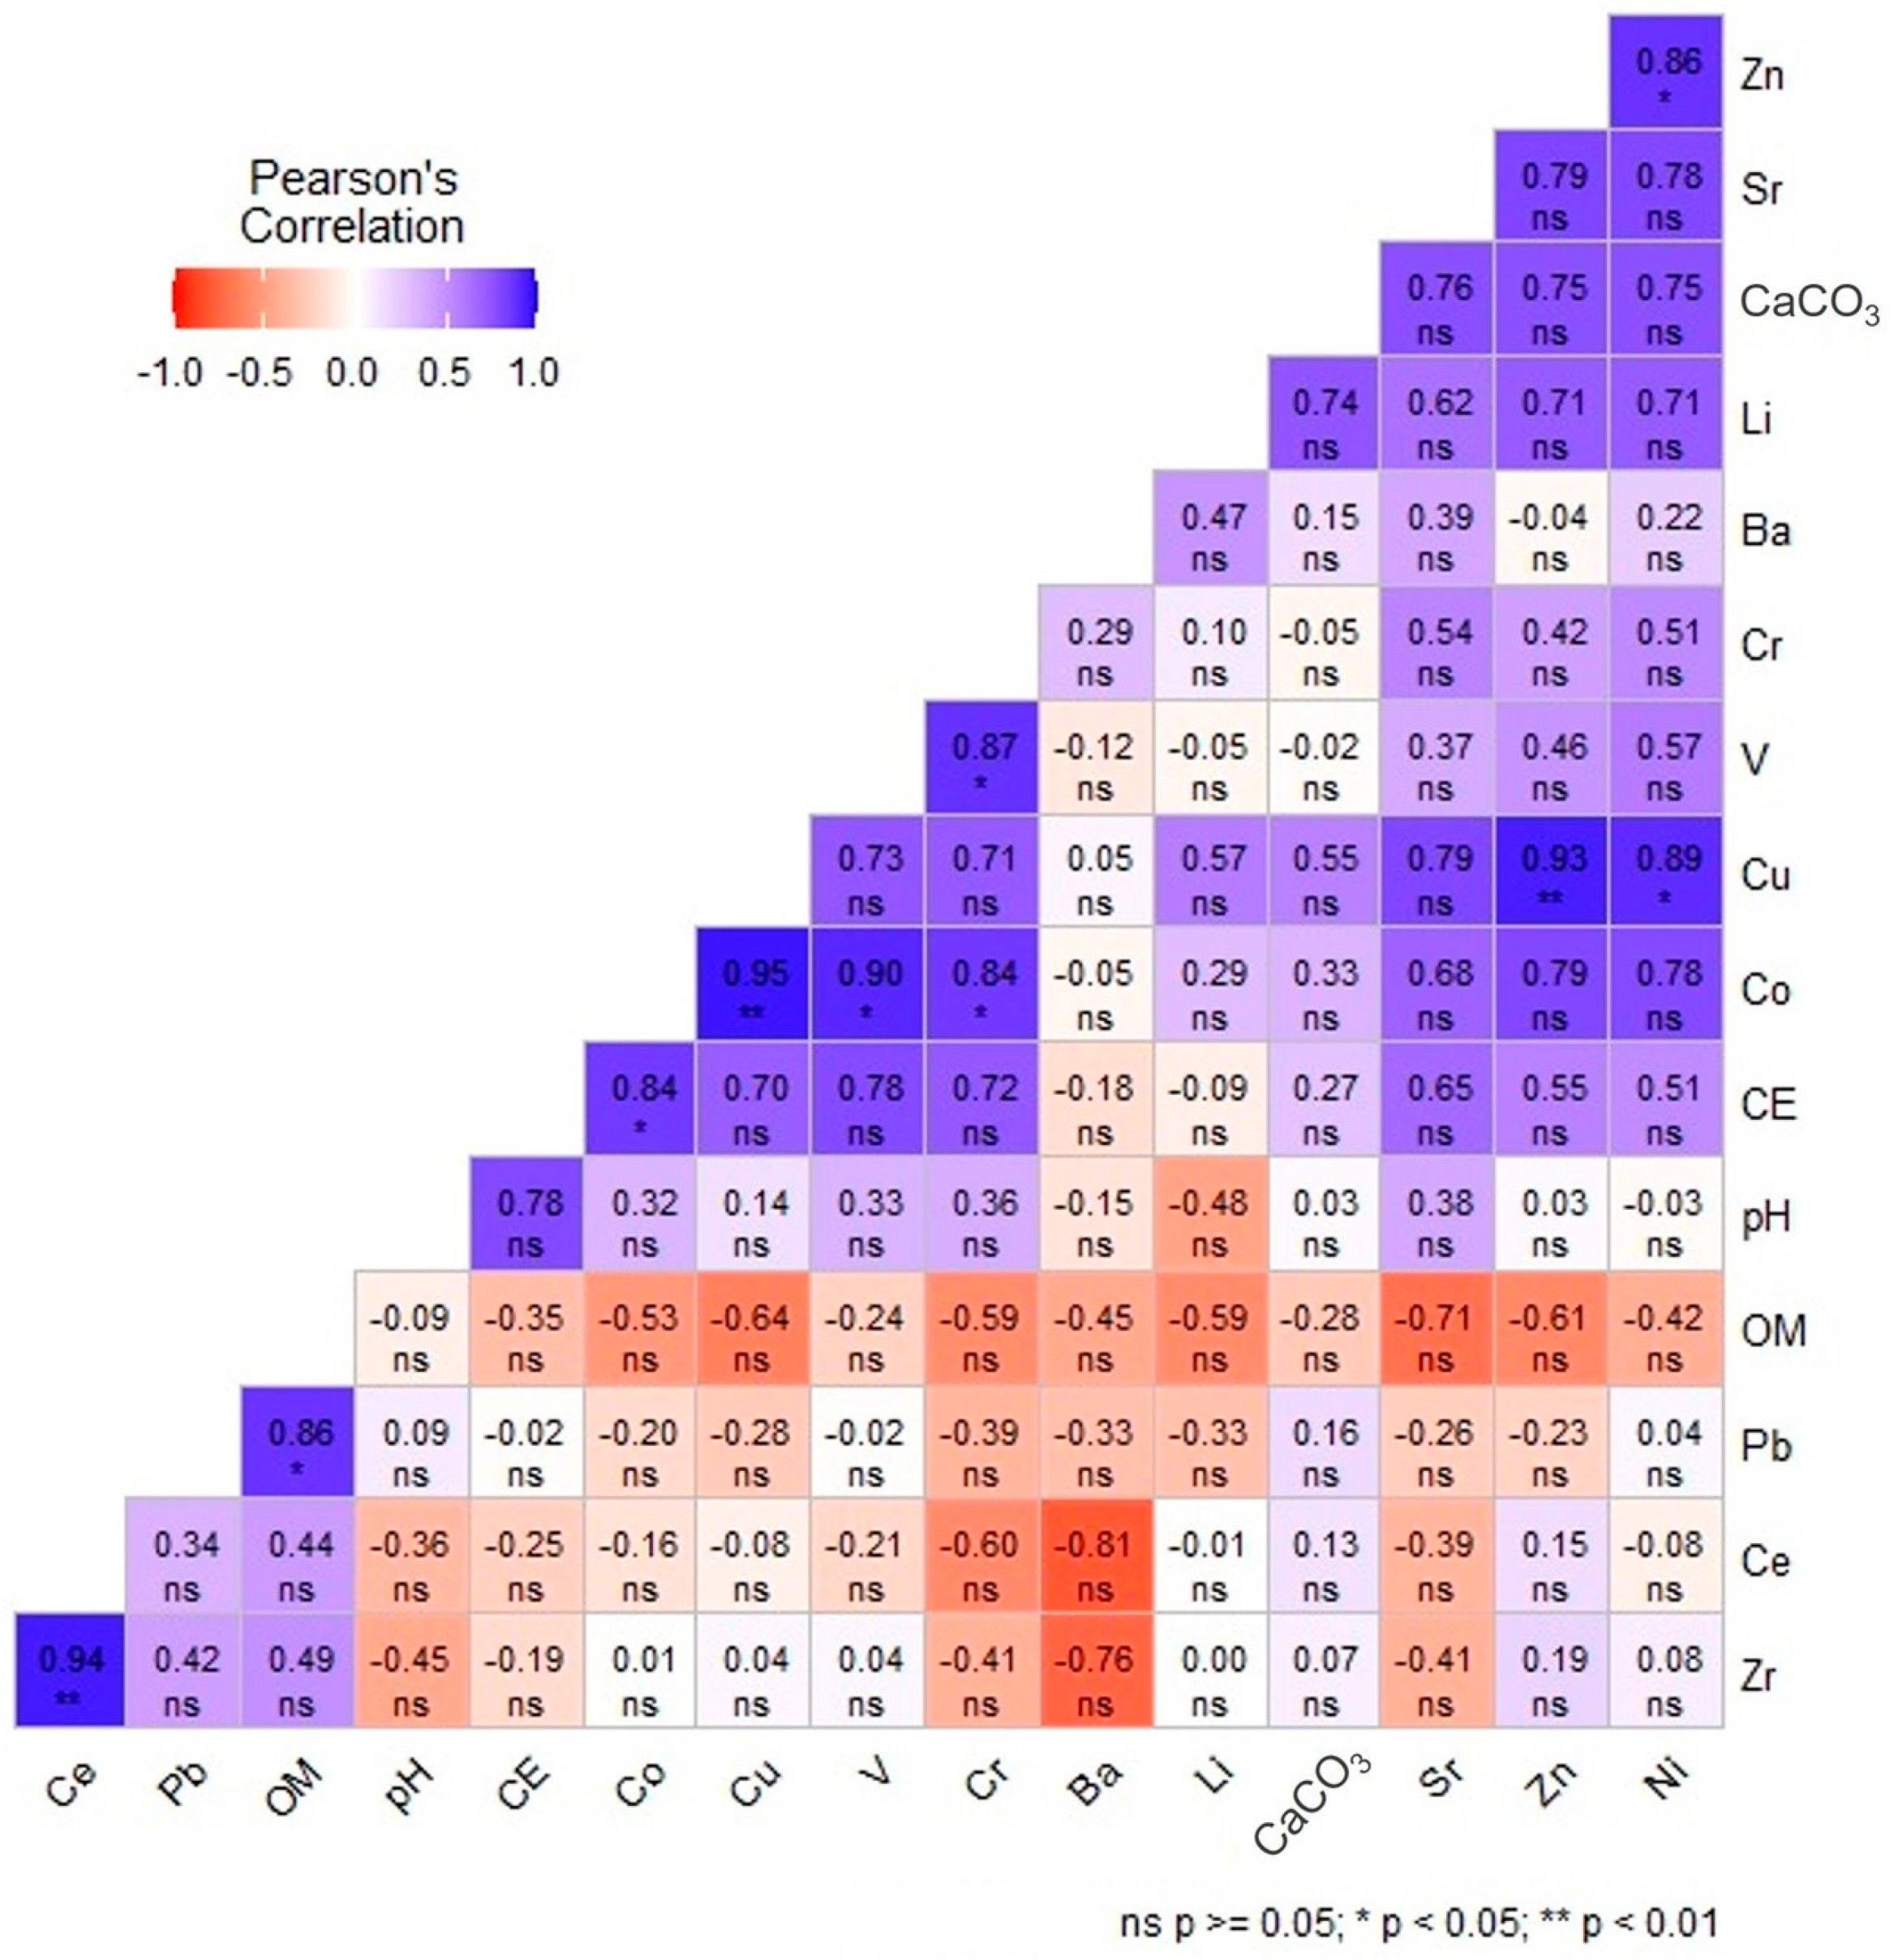
Multivariate analysis, including hierarchical cluster analysis (HCA), Pearson correlation analysis, and principal component analysis (PCA), represents an efficacious approach to determining the origins of heavy metals in fluvial ecosystems [82,83]. Furthermore, examining correlations among metallic elements in sediments provides detailed insights into their origins, pathways, and modes of dispersion or exposure [84]. Pearson correlation coefficients were determined to identify correlations among the physicochemical characteristics studied in the sediments of the Inaouène watershed, ranging from +1 to −1 [77], as illustrated in Figure 12. The analysis reveals several significant positive and negative correlations, offering a deeper understanding of the interactions between chemical elements and the physicochemical properties of the sediments.
Several significant positive correlations are observed, including a strong relationship between copper (Cu) and cobalt (Co) (r = 0.948, p < 0.01), as well as between Cu and zinc (Zn) (r = 0.930, p < 0.01). These correlations indicate that these elements may co-occur in similar mineral fractions or share a common source, whether anthropogenic or natural [85]. Additionally, nickel (Ni) exhibits strong positive correlations with Zn (r = 0.865, not significant) and Cu (r = 0.885, not significant), further supporting this hypothesis.
Conversely, significant negative correlations are identified. For instance, lead (Pb) exhibits a strong negative correlation with organic matter content (% OM) (r = −0.865, p < 0.05), indicating that Pb enrichment might be linked to fewer organic sources or conditions that inhibit organic matter accumulation. Similarly, % OM exhibits negative correlations with Cu (r = −0.636, not significant) and Zn (r = −0.595, not significant), highlighting an inverse dynamic between these elements and organic content.
Regarding physicochemical properties, electrical conductivity (EC) displays strong positive correlations with several elements, such as cobalt (Co) (r = 0.837, not significant) and vanadium (V) (r = 0.778, not significant). This suggests that sediment mineralization may be influenced by the presence of these elements. However, EC shows a weak negative correlation with zirconium (Zr) (r = −0.192, not significant), which is considered a stable reference element.
The calcium carbonate content (% CaCO3) shows positive correlations with nickel (Ni) (r = 0.751, not significant) and strontium (Sr) (r = 0.759, not significant), likely reflecting geological inputs or interactions related to carbonate dissolution. In contrast, it exhibits a moderate negative correlation with cerium (Ce) (r = −0.129, not significant), which may be linked to specific geochemical fractionation processes.
Finally, pH shows moderate correlations with elements such as cobalt (Co) (r = 0.333, not significant) and vanadium (V) (r = 0.353, not significant), indicating a potential influence of pH on the availability or precipitation of these elements. However, a negative correlation is observed between pH and zirconium (Zr) (r = −0.429, not significant), potentially explained by Zr’s stability under acidic conditions.

3.3.2. Principal Component Analysis

The PCA analysis shows that axis F1 explains 45.6% of the total variance, and axis F2 accounts for 20.9%, resulting in a cumulative variance of 66.5%. These two axes offer a reliable and insightful representation of the relationships among the various variables examined (Figure 13A).
The first principal component (Dim1), which accounts for a significant proportion of the total variance, is positively correlated with a group of trace elements including Zn, Cu, Ni, Co, Sr, and Cr, along with environmental parameters, such as electrical conductivity (EC), organic matter (OM), and the percentage of calcium carbonate (%CaCO3). The alignment of these variables along the same axis suggests that they are influenced by similar geochemical processes or originate from common sources. Many of these metals, particularly Zn, Cu, Ni, and Cr, are well known for their association with urban runoff, industrial effluents, and agricultural practices [86], pointing to anthropogenic inputs in the upstream sections of the watershed. Co and Sr, while partially of anthropogenic origin, can also be naturally released through the weathering of local geological formations, particularly those rich in carbonate and silicate minerals [87]. Their correlation with carbonates and organic matter suggests a potential co-precipitation or adsorption onto these phases, which influences their mobility.
The inverse correlation with pH implies that under slightly acidic conditions, these metals may become more mobile or bioavailable, enhancing their presence in the sediment matrix. Overall, the grouping of these elements along Dim1 reflects both anthropogenic pressure and geogenic background, highlighting the complex interaction between natural and human-influenced processes in the Inaouéne watershed.
This dimension is mainly influenced by station Ech1, which is characterized by a high cos2 value and an extreme position on the axis of this dimension (Figure 13B). This station plays a key role in defining the variables associated with Dim1. Station Ech6 also shows a notable contribution to this dimension, although to a lesser extent than Ech1.
The second principal component (Dim2) is mainly associated with Zr, Ba, Ce, and Pb (Figure 13A), which appear to form a distinct group. This correlation suggests that these elements likely share a common natural origin, possibly linked to the erosion of local rocks rich in silicate and phosphate minerals. Zr, Ba, and Ce are typically considered lithogenic elements, meaning they are mostly derived from the natural breakdown of rocks rather than human activity [88]. Although Pb is often linked to anthropogenic sources, its association with these elements here may indicate a dominant geogenic contribution. This group is more representative of the geological background of the watershed, especially in areas less affected by direct human influence.
In terms of spatial distribution, station Ech4 stands out with a strong contribution to Dim2, as shown by its distance from the origin and high cos2 value (Figure 13B). This indicates a strong association with the geogenic element group, likely reflecting the influence of natural geological inputs in that area. Station Ech2 also contributes to Dim2, but to a lesser extent. In contrast, stations such as Ech3 and Ech5 show weak contributions to both main components, suggesting limited influence from either anthropogenic or geogenic sources in their geochemical profiles.

3.3.3. Hierarchical Cluster Analysis (HCA)

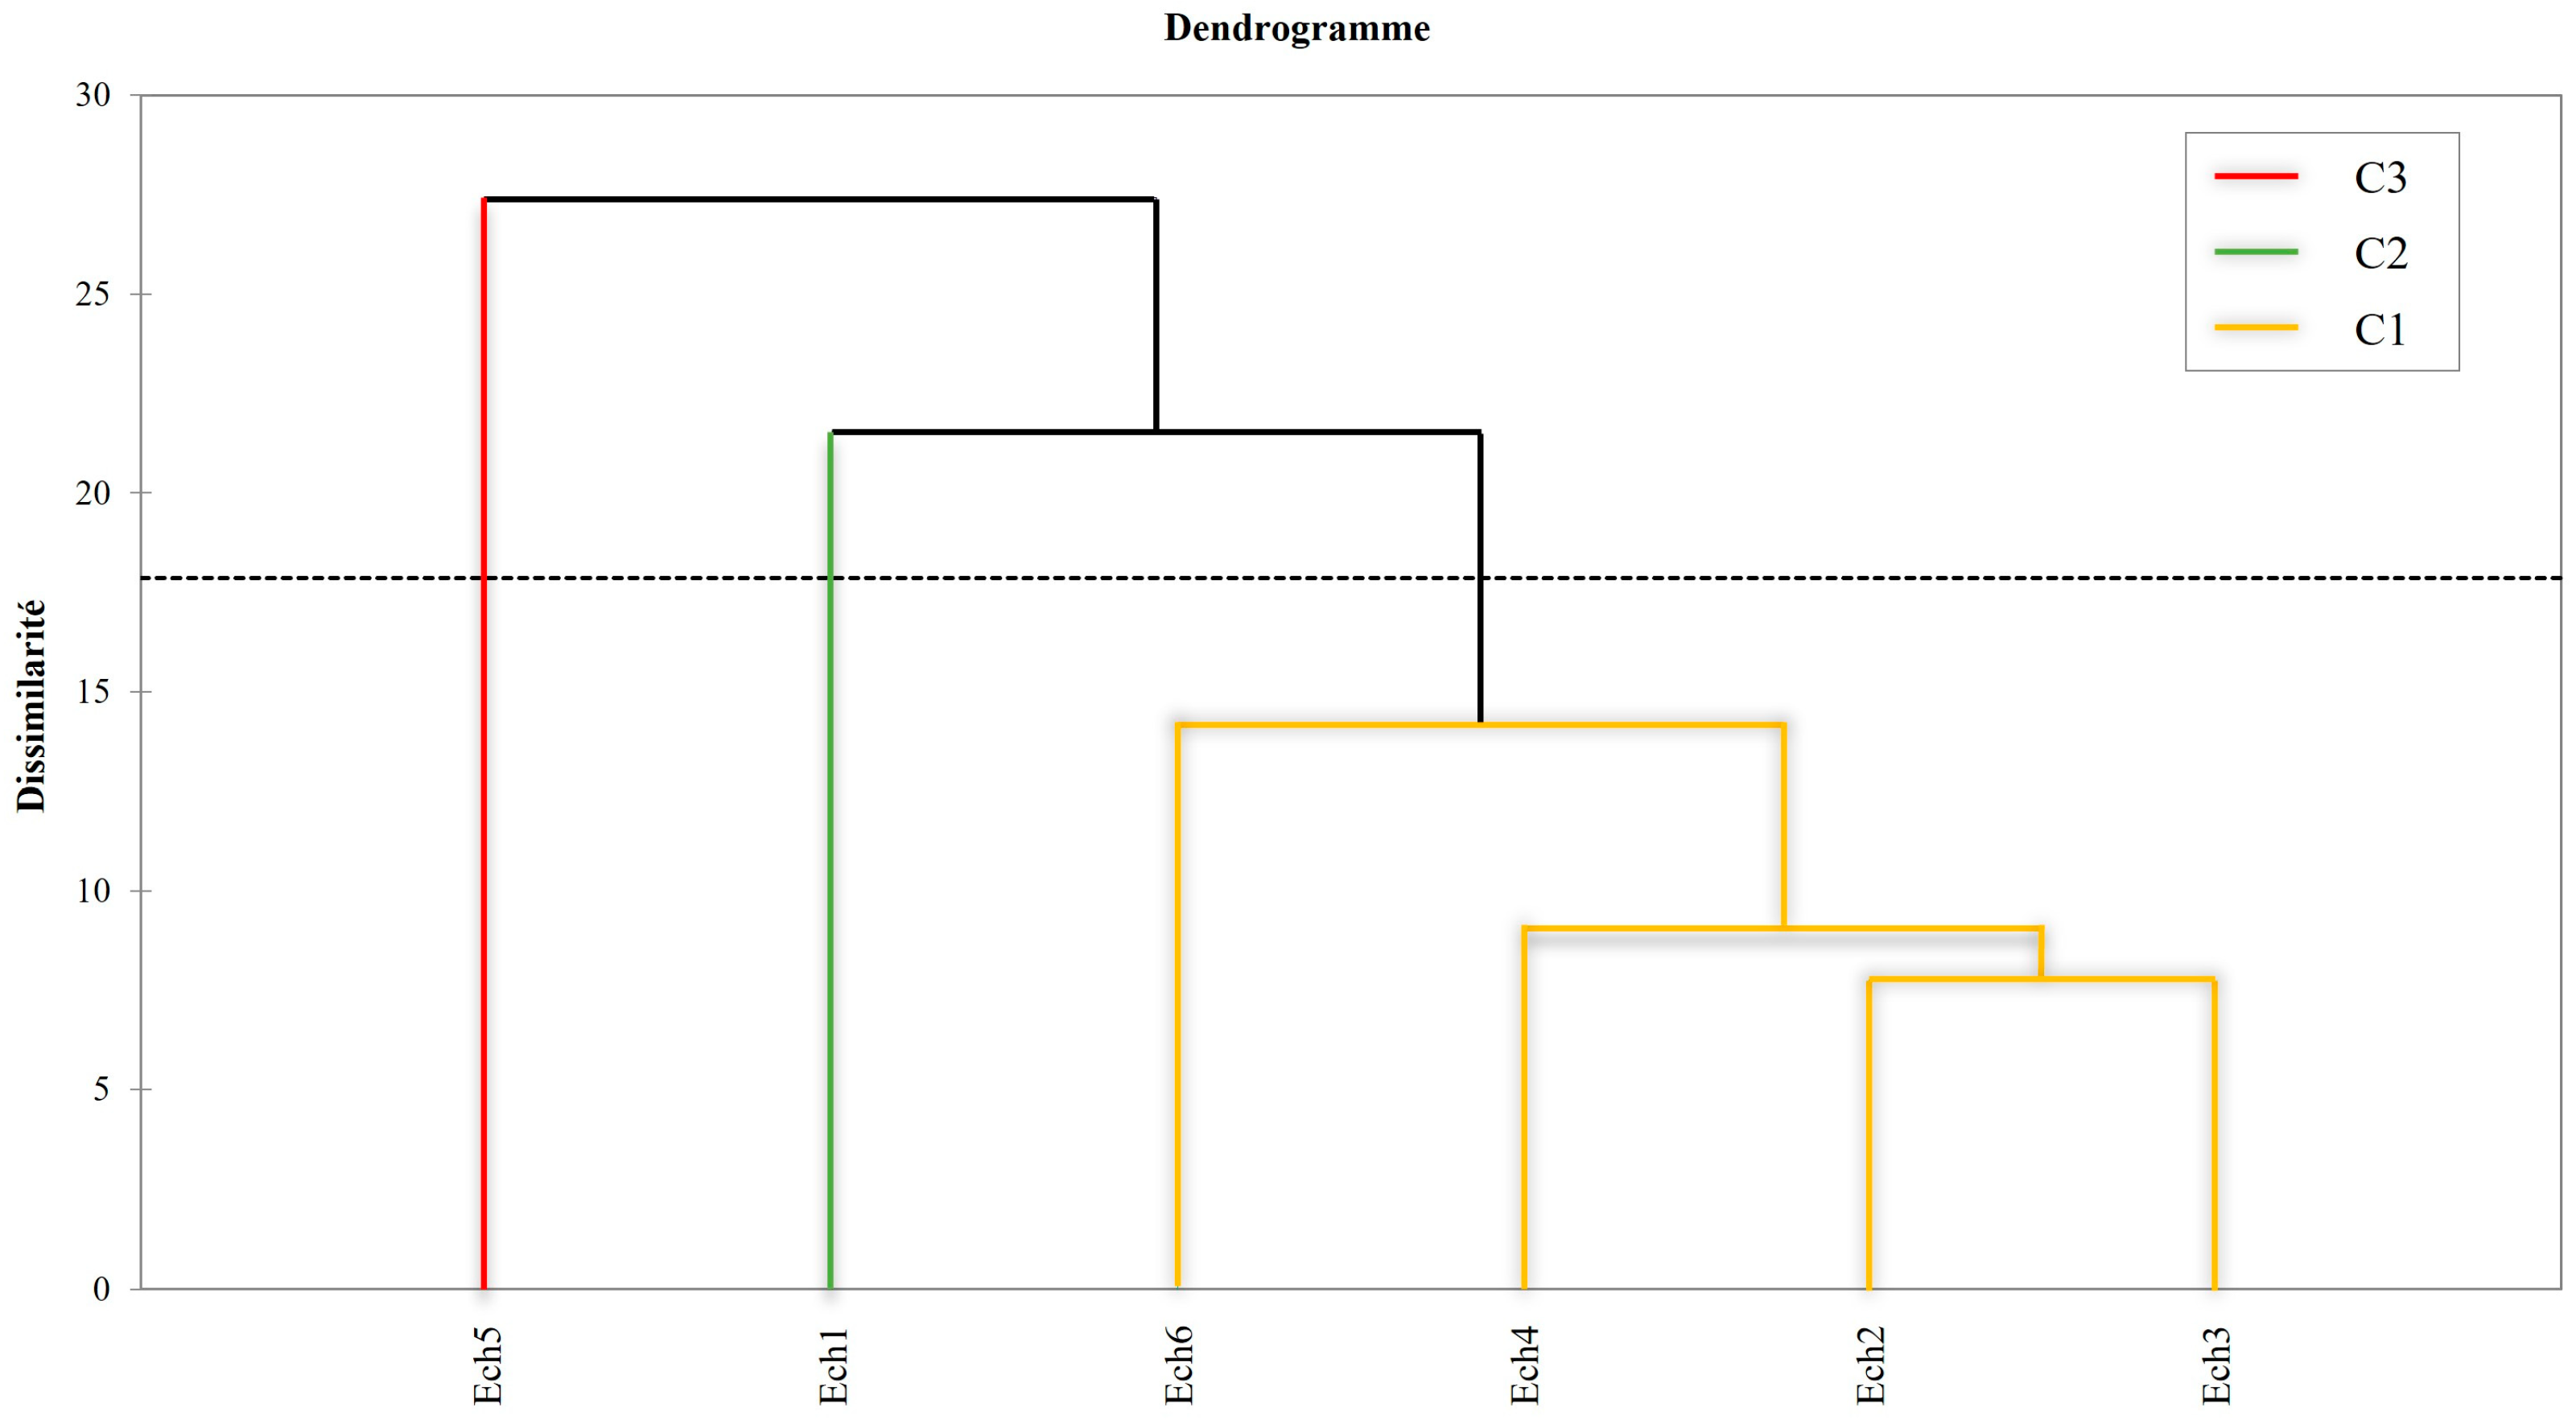
Euclidean distance and Ward’s linkage method are employed to geographically classify the sampling locations based on their similarity or dissimilarity [89]. To validate the outcomes of the Principal Component Analysis (PCA), this research utilized Hierarchical Cluster Analysis (HCA) [90]. The HCA applied to the stations of the Inaouéne and the Idriss I dam allowed for the grouping of the stations into three main clusters (Figure 14), taking into account their position in the watershed as well as their geochemical characteristics.
Cluster 1 groups stations Ech2, Ech3, Ech4, and Ech6, which share similar geochemical features despite their spatial distribution. The resemblance between Ech4 and Ech6 may be related to the hydraulic behavior and sedimentation dynamics of the Idriss I dam, which tend to homogenize certain parameters in the downstream area. Meanwhile, Ech2 and Ech3, located upstream along the Inaouéne, display similar profiles, potentially influenced by a combination of natural fluvial inputs and diffuse anthropogenic pressures, including domestic and agricultural discharges. This cluster thus reflects a continuum from upstream river segments to the dam-influenced zone, with comparable concentrations of Zn, Ni, Cr, and consistent physico-chemical conditions (pH, EC).
The second cluster includes station Ech1, located in the upper watershed, and characterized by distinctively high concentrations of heavy metals (especially Zn, Cr, Cu) and elevated electrical conductivity. This unique profile likely reflects localized anthropogenic inputs from urban settlements near Taza, combined with active soil erosion in the area. Its position as a separate cluster highlights the site-specific influence of both geological and human-induced factors.
The third cluster includes station Ech5, located in the middle of the dam, which appears as an isolated group due to its particular characteristics, namely lower concentrations of heavy metals and a higher percentage of organic matter (% OM). This pattern may be associated with sedimentation dynamics typical of dam reservoirs, where finer particles and organic matter tend to accumulate in the central, deeper zones. Such zones often favor the burial of heavy metals and the stabilization of organic matter under geochemical conditions that reduce metal mobility and bioavailability [91].

4. Conclusions

This study provides a comprehensive assessment of heavy metal contamination in the sediments of the Inaouène watershed, integrating geochemical indices and multivariate statistical tools to identify contamination patterns and potential sources. The findings highlight spatial variability influenced by both anthropogenic activities (urban discharges, agricultural runoff) and natural inputs (geological background, sedimentation processes near the dam).
Beyond characterizing contamination, these results have important implications for both surface and groundwater quality management. The identification of critical zones—particularly upstream urban areas and the reservoir affected by sediment accumulation—can help prioritize monitoring efforts and guide remediation strategies. Given the potential for contaminant infiltration into shallow aquifers, especially in karstified or fractured geological settings, protecting sediment quality also contributes to preserving groundwater resources.
The combined use of indices, such as PERI, SPI, and EF, along with statistical analyses, offers a practical framework for environmental risk assessment in data-scarce regions. We recommend integrating these tools into long-term sediment and aquifer monitoring programs while developing targeted management policies that protect both sediment and water quality in the Idriss 1st Dam and its upstream tributaries.
Ultimately, this work contributes to a better understanding of contamination dynamics in Moroccan watersheds and supports evidence-based decision making for sustainable watershed, reservoir, and aquifer resource management.

Author Contributions

Conceptualization, M.L.; methodology, M.L., M.M.M. and H.F.; validation, F.B. and I.L.; formal analysis, M.L., K.A. and F.B.; writing—original draft preparation, M.L.; writing—review and editing, L.B. and I.L.; visualization, M.L. and Y.A.B.; supervision, L.B. and V.M.; Funding acquisition, Y.A.B. All authors have read and agreed to the published version of the manuscript.

Funding

This research received no external funding.

Institutional Review Board Statement

Not applicable.

Informed Consent Statement

Not applicable.

Data Availability Statement

The data are available on request from the corresponding author.

Conflicts of Interest

The authors declare no conflicts of interest.

References

  1. Guemouria, A.; Chehbouni, A.; Belaqziz, S.; Epule Epule, T.; Ait Brahim, Y.; El Khalki, E.M.; Dhiba, D.; Bouchaou, L. System Dynamics Approach for Water Resources Management: A Case Study from the Souss-Massa Basin. Water 2023, 15, 1506. [Google Scholar] [CrossRef]
  2. Najmi, A.; Igmoullan, B.; Namous, M.; El Bouazzaoui, I.; Ait Brahim, Y.; El Khalki, E.M.; Saidi, M.E.M. Evaluation of PERSIANN-CCS-CDR, ERA5, and SM2RAIN-ASCAT rainfall products for rainfall and drought assessment in a semi-arid watershed, Morocco. J. Water Clim. Change 2023, 14, 1569–1584. [Google Scholar] [CrossRef]
  3. Ait Brahim, Y.; Bouchaou, L.; Sifeddine, A.; Beraaouz, E.H.; Wanaim, A.; Cheng, H. Hydro-climate characteristics of the karst system of Wintimdouine cave (Western High Atlas, Morocco): Monitoring and implications for paleoclimate research. Environ. Earth Sci. 2019, 78, 508. [Google Scholar] [CrossRef]
  4. Rhoujjati, N.; Ait Brahim, Y.; Hanich, L.; Rhoujjati, A.; Rafik, A.; Ouatiki, H.; Chehbouni, A.; Bouchaou, L. Snowpack and groundwater recharge in the Atlas mountains: New evidence and key drivers. J. Hydrol. Reg. Stud. 2023, 49, 101520. [Google Scholar] [CrossRef]
  5. Hakam, O.; Baali, A.; Azennoud, K.; El Kamel, T.; Ait Brahim, Y.; Ahouach, Y. Spatiotemporal evolution of droughts and their teleconnections with large-scale climatic indices in the Lower Sebou Basin in northwestern Morocco. Acta Geogr. Slov. 2022, 62, 24. [Google Scholar] [CrossRef]
  6. El Bouazzaoui, I.; Ait Brahim, Y.; El Khalki, E.M.; Najmi, A.; Bougadir, B. A Summary Analysis of Groundwater Vulnerability to Climate Variability and Anthropic Activities in the Haouz Region, Morocco. Sustainability 2022, 14, 14865. [Google Scholar] [CrossRef]
  7. El Zokm, G.M.; Okbah, M.A.; Younis, A.M. Assessment of heavy metals pollution using AVS SEM and fractionation techniques in Edku Lagoon sediments, Mediterranean Sea, Egypt. J. Environ. Sci. Health A 2015, 50, 571–584. [Google Scholar] [CrossRef]
  8. Wojtkowska, M.; Bogacki, J. Assessment of trace metals contamination, species distribution, and mobility in river sediments using EDTA extraction. Int. J. Environ. Res. Public Health 2022, 19, 6978. [Google Scholar] [CrossRef]
  9. Ciszewski, D.; Grygar, T.M. A review of flood-related storage and remobilization of heavy metal pollutants in river systems. Water Air Soil Pollut. 2016, 227, 239. [Google Scholar] [CrossRef]
  10. Shotbolt, L.A.; Thomas, A.D.; Hutchinson, S.M. The use of reservoir sediments as environmental archives of catchment inputs and atmospheric pollution. Prog. Phys. Geogr. 2005, 29, 337–361. [Google Scholar] [CrossRef]
  11. Chapman, P.M.; Wang, F.; Caeiro, S.S. Assessing and managing sediment contamination in transitional waters. Environ. Int. 2013, 55, 71–91. [Google Scholar] [CrossRef] [PubMed]
  12. Gu, Y.G.; Lin, Q.; Jiang, S.J.; Wang, Z.H. Metal pollution status in Zhelin Bay surface sediments inferred from a sequential extraction technique, South China Sea. Mar. Pollut. Bull. 2014, 81, 256–261. [Google Scholar] [CrossRef] [PubMed]
  13. Tessier, E. Diagnostic de la Contamination Sédimentaire par les Métaux/Métalloïdes dans la rade de Toulon et Mécanismes Contrôlant leur Mobilité. Ph.D. Thesis, Université du Sud Toulon Var, Toulon, France, 2012. [Google Scholar]
  14. Xie, F.; Xie, Z.; Zhou, B.; Li, L.; Zhou, X.; Fan, O.; Lü, C. Characteristics and health risk assessment of organochlorine pesticides (OCPs) residues along Sino-Russian boundary river. Water Air Soil Pollut. 2020, 231, 10. [Google Scholar] [CrossRef]
  15. Xu, C.; Yan, H.; Zhang, S. Heavy metal enrichment and health risk assessment of karst cave fish in Libo, Guizhou, China. Alex. Eng. J. 2021, 60, 1885–1896. [Google Scholar] [CrossRef]
  16. Varol, M.; Şen, B. Assessment of nutrient and heavy metal contamination in surface water and sediments of the upper Tigris River, Turkey. Catena 2012, 92, 1–10. [Google Scholar] [CrossRef]
  17. Karbassi, A.R.; Monavari, S.M.; Bidhendi, G.R.; Nouri, J.; Nematpour, K. Metal pollution assessment of sediment and water in the Shur River. Environ. Monit. Assess. 2008, 147, 107–116. [Google Scholar] [CrossRef]
  18. Malki, M.; Choukr-Allah, R.; Bouchaou, L.; Hirich, A.; Ait Brahim, Y.; Krimissa, S.; Hssaisoune, M.; Nghira, A.; Barceló, D. Assessment of groundwater quality: Impact of natural and anthropogenic contamination in Souss-Massa River Basin. In The Souss-Massa River Basin, Morocco. The Handbook of Environmental Chemistry; Springer: Cham, Switzerland, 2016; Volume 53. [Google Scholar] [CrossRef]
  19. Islam, M.S.; Ahmed, M.K.; Raknuzzaman, M.; Habibullah-Al-Mamun, M.; Islam, M.K. Heavy metal pollution in surface water and sediment: A preliminary assessment of an urban river in a developing country. Ecol. Indic. 2015, 48, 282–291. [Google Scholar] [CrossRef]
  20. Gao, X.L.; Chen, C.T.A. Heavy metal pollution status in surface sediments of the coastal Bohai Bay. Water Res. 2012, 46, 1901–1911. [Google Scholar] [CrossRef]
  21. Sakan, S.M.; Dordević, D.S.; Manojlović, D.D.; Predrag, P.S. Assessment of heavy metal pollutants accumulation in the Tisza River sediments. J. Environ. Manag. 2009, 90, 3382–3390. [Google Scholar] [CrossRef]
  22. Bibak, M.; Sattari, M.; Agharokh, A.; Tahmasebi, S.; Namin, J.I. Assessing some heavy metals pollutions in sediments of the northern Persian Gulf (Bushehr province). Environ. Health Eng. Manag. J. 2018, 5, 175–179. [Google Scholar] [CrossRef]
  23. Naoura, J.; Benaabidate, L.; Benbrahim, K.F. Assessment of water quality of the Inaouène River, Northern Morocco. Int. J. Innov. Appl. Stud. 2015, 10, 60–66. Available online: http://www.ijias.issr-journals.org/ (accessed on 13 January 2025).
  24. Afgane, R.; Benjelloun, F.; Lahrach, A.; Daide, F. Comparative study of the physico-chemical and metallic quality of waters and sediments in the Larbaa Basin (Morocco) in the dry and wet period. J. Ecol. Eng. 2021, 22, 92–102. [Google Scholar] [CrossRef]
  25. Ben Abbou, M.; Fadil, F.; El Haji, M. Évaluation de la qualité des cours d’eau de la ville de Taza utilisées dans l’irrigation des cultures maraîchères, Maroc. J. Appl. Biosci. 2014, 77, 6462–6473. [Google Scholar] [CrossRef]
  26. Duodu, O.G.; Goonetilleke, A.; Ayoko, A.G. Comparison of pollution indices for the assessment of heavy metal in Brisbane River sediment. Environ. Pollut. 2016, 219, 1077–1091. [Google Scholar] [CrossRef]
  27. Ezewudo, B.I.; Mgbenka, B.O.; Islam, M.S.; Proshad, R.; Odo, G.E. Appraisal of metal contamination in sediments of lower reaches of Niger River, Nigeria, using contamination indices and sediment quality guidelines. Int. J. Environ. Anal. Chem. 2021, 103, 2616–2635. [Google Scholar] [CrossRef]
  28. Pan, D.; Chen, H. Border pollution reduction in China: The role of livestock environmental regulations. China Econ. Rev. 2021, 69, 101681. [Google Scholar] [CrossRef]
  29. Kubra, K.; Mondol, A.H.; Ali, M.M.; Islam, M.S.; Akhtar, S.; Ahmed, A.S.S.; Bhuyan, M.S.; Rahman, M.M.; Siddique, M.A.B.; Islam, A.R.M.T. Assessment of As, Cr, Cd, and Pb in urban surface water from a subtropical river: Contamination, sources, and human health risk. Int. J. Environ. Anal. Chem. 2023, 191, 114960. [Google Scholar] [CrossRef]
  30. Tokatli, C. Sediment quality of Ergene River basin: Bio-ecological risk assessment of toxic metals. Environ. Monit. Assess. 2019, 191, 706–717. [Google Scholar] [CrossRef]
  31. Neff, J.M.; Stout, S.A.; Gunster, D.G. Ecological risk assessment of polycyclic aromatic hydrocarbons in sediments: Identifying sources and ecological hazard. Integr. Environ. Assess. Manag. 2005, 1, 22–33. [Google Scholar] [CrossRef] [PubMed]
  32. Hakanson, L. An ecological risk index for aquatic pollution control: A sedimentological approach. Water Res. 1980, 14, 975–1001. [Google Scholar] [CrossRef]
  33. Brady, J.P.; Ayoko, G.A.; Martens, W.N.; Goonetilleke, A. Development of a hybrid pollution index for heavy metals in marine and estuarine sediments. Environ. Monit. Assess. 2015, 187, 306. [Google Scholar] [CrossRef] [PubMed]
  34. Libiad, M.; Khabbach, A.; Ennabili, A. State of riparian vegetation of streams in the watershed of the Inaouène Wadi (NW Morocco). Mater. Environ. Sci. 2015, 6, 34–45. [Google Scholar]
  35. El Garouani, A.; Tribak, A. Relation entre hydrologie et climat dans le bassin versant de l’Oued Inaouène (pré-Rif marocain). In Climate Variability and Change: Proceedings of the Fifth FRIEND World Conference Held at Havana, Cuba; IAHS Publ.: Havana, Cuba, 2006; p. 308. [Google Scholar]
  36. ABHS. Actualisation du Plan Directeur d’Aménagement Intégré des Ressources en Eau du Bassin de Sebou. Mission II: Évaluation Quantitative des Ressources en Eau; Agence du Bassin Hydraulique de Sebou: Fes, Morocco, 2021. [Google Scholar]
  37. AFNOR. Qualité des Sols; AFNOR Edition: Paris, France, 1994; 250p. [Google Scholar]
  38. Wang, G.; Zeng, C.; Zhang, F.; Zhang, Y.; Scott, C.A.; Yan, X. Traffic-related trace elements in soils along six highway segments on the Tibetan Plateau: Influence factors and spatial variation. Sci. Total Environ. 2017, 581, 811–821. [Google Scholar] [CrossRef]
  39. Chassin, P.; Baize, D.; Cambier, P.; Sterkman, T. Les éléments traces métalliques et la qualité des sols. Impact à Moyen Et à Long terme. Étude Et Gest. Des Sols 1996, 3, 298–306. [Google Scholar]
  40. Li, X.; Feng, L. Multivariate and geostatistical analyses of metals in urban soil of Weinan industrial areas, Northwest China. Atmos. Environ. 2012, 47, 58–65. [Google Scholar] [CrossRef]
  41. Sutherland, R.A. Bed sediment-associated trace metals in an urban stream, Oahu, Hawaii. Environ. Geol. 2000, 39, 330–341. [Google Scholar] [CrossRef]
  42. Muller, G. Index of Geoaccumulation in Sediments of the Rhine River. GeoJournal 1969, 2, 108–118. [Google Scholar]
  43. Wedepohl, K.H. The composition of the continental crust. Geochim. Cosmochim. Acta 1995, 59, 1217–1239. [Google Scholar] [CrossRef]
  44. Minoubi, A.; Mejjad, N.; El Khalidi, K.; Bouchkara, M.; Fadili, A.; Chaibi, M.; Zourarah, B. Spatial Distribution and Contamination Level Assessment of Marine Sediment of the Safi Bay (Moroccan Atlantic Coast). Oceans 2023, 4, 331–349. [Google Scholar] [CrossRef]
  45. Loska, K.; Wiechula, D.; Korus, I. Metal contamination of farming soils affected by industry. Environ. Int. 2004, 30, 159–165. [Google Scholar] [CrossRef]
  46. Sahli, L.; El Okki, M.E.H.; Afri-Mehennaoui, F.Z.; Mehennaoui, S. Utilisation d’indices pour l’évaluation de la qualité des sédiments: Cas du bassin Boumerzoug (Algérie). Eur. Sci. J. 2014, 10, 336–346. [Google Scholar]
  47. Abrahim, G.M.S.; Parker, R.J. Assessment of heavy metal enrichment factors and the degree of contamination in marine sediments from Tamaki Estuary, Auckland, New Zealand. Environ. Monit. Assess. 2008, 136, 227–238. [Google Scholar] [CrossRef] [PubMed]
  48. Zhu, H.N.; Yuan, X.Z.; Zeng, G.M.; Jiang, M.; Liang, J.; Zhang, C.; Yin, J.; Huang, H.J.; Liu, Z.F.; Jiang, H.W. Ecological risk assessment of heavy metals in sediments of Xiawan Port based on modified potential ecological risk index. Trans. Nonferrous Met. Soc. China 2012, 22, 1470–1477. [Google Scholar] [CrossRef]
  49. Rezaie-Boroon, M.H.; Toress, V.; Diaz, S.; Lazzaretto, T.; Tsang, M.; Deheyn, D.D. The geochemistry of heavy metals in the mudflat of Salinas de San Pedro Lagoon, California, USA. J. Environ. Prot. 2013, 4, 12–25. [Google Scholar] [CrossRef]
  50. Zhang, W.F.; Liu, X.P.; Cheng, H.F.; Zeng, E.Y.; Hu, Y.A. Heavy metal pollution in sediments of a typical mariculture zone in South China. Mar. Pollut. Bull. 2012, 64, 712–720. [Google Scholar] [CrossRef]
  51. Rubio, B.; Nombela, M.A.; Vilas, F. Geochemistry of major and trace elements in sediments of the Ría de Vigo (NW Spain): An assessment of metal pollution. Mar. Pollut. Bull. 2000, 40, 968–980. [Google Scholar] [CrossRef]
  52. Singh, M.; Müller, G.; Singh, I.B. Heavy metals in freshly deposited stream sediments of rivers associated with urbanisation of the Ganga Plain, India. Water Air Soil Pollut. 2002, 141, 35–54. [Google Scholar] [CrossRef]
  53. Rezaei, A.; Hassani, H.; Jabbari, N. Evaluation of groundwater quality and assessment of pollution indices for heavy metals in North of Isfahan Province, Iran. J. Sustain. Water Resour. Manag. 2019, 5, 491–512. [Google Scholar] [CrossRef]
  54. Tomlinson, D.L.; Wilson, J.G.; Harris, C.R.; Jeffrey, D.W. Problems in the assessment of heavy-metal levels in estuaries and the formation of a pollution index. Helgoländer Meeresunters 1980, 33, 566–575. [Google Scholar] [CrossRef]
  55. Yinxian, S.; Junfeng, J.; Zhongfang, Y.; Xuyin, Y.; Changping, M.; Ray, F.; Godwin, A. Geochemical behavior assessment and apportionment of heavy metal contaminants in the bottom sediments of lower reach of Changjiang River. Catena 2011, 85, 73–81. [Google Scholar] [CrossRef]
  56. Rezaei, A.; Hassani, H.; Fard Mousavi, S.B.; Jabbari, N. Evaluation of heavy metals concentration in Jajarm bauxite deposit in northeast of Iran using environmental pollution indices. Malays. J. Geosci. 2019, 3, 12–20. [Google Scholar] [CrossRef]
  57. Liu, J.; Zhang, D.; Tang, Q.; Xu, H.; Huang, S.; Shang, D.; Liu, R. Water quality assessment and source identification of the Shuangji River (China) using multivariate statistical methods. PLoS ONE 2021, 16, e0245525. [Google Scholar] [CrossRef] [PubMed]
  58. Abdulsalam, A.; Ramli, M.F.; Jamil, N.R.; Ashaari, Z.H.; Umar, D.A. Hydrochemical characteristics and identification of groundwater pollution sources in tropical savanna. Environ. Sci. Pollut. Res. 2022, 29, 384–398. [Google Scholar] [CrossRef] [PubMed]
  59. Abuzaid, A.S.; Abdel-Salam, M.A.; Ahmad, A.F.; Fathy, H.A.; Fadl, M.E.; Scopa, A. Effect of marginal-quality irrigation on accumulation of some heavy metals (Mn, Pb, and Zn) in Typic Torripsamment soils and food crops. Sustainability 2022, 14, 1067. [Google Scholar] [CrossRef]
  60. Huang, C.; Akram, W.; Rashid, A.; Ullah, Z.; Shah, M.; Alrefaei, A.F.; Kamel, M.; Aleya, L.; Abdel-Daim, M.M. Quality assessment of groundwater based on geochemical modelling and water quality index (WQI). Water 2022, 14, 3888. [Google Scholar] [CrossRef]
  61. Tharmar, E.; Abraham, M.; Prakash, R.; Sundaram, A.; Flores, E.S.; Canales, C.; Alam, M.A. Hydrogeochemistry and water quality assessment in the Thamirabarani River stretch by applying GIS and PCA techniques. Sustainability 2022, 14, 16368. [Google Scholar] [CrossRef]
  62. Akoto, O.; Adopler, A.; Tepkor, H.E.; Opoku, F.A. Comprehensive evaluation of surface water quality and potential health risk assessments of Sisa river, Kumasi. Groundw. Sustain. Dev. 2021, 15, 100654. [Google Scholar] [CrossRef]
  63. Ghesquière, O.; Walter, J.; Chesnaux, R.; Rouleau, A. Scenarios of groundwater chemical evolution in a region of the Canadian Shield based on multivariate statistical analysis. J. Hydrol. Reg. Stud. 2015, 4, 246–266. [Google Scholar] [CrossRef]
  64. Wang, Y.; Jiao, J.J.; Zhang, K.; Zhou, Y. Enrichment and Mechanisms of Heavy Metal Mobility in a Coastal Quaternary Groundwater System of the Pearl River Delta, China. Sci. Total Environ. 2016, 545–546, 493–502. [Google Scholar] [CrossRef]
  65. MacDonald, D.D.; Ingersoll, C.G.; Berger, T.A. Development and Evaluation of Consensus-Based Sediment Quality Guidelines for Freshwater Ecosystems. Arch. Environ. Contam. Toxicol. 2000, 39, 20–31. [Google Scholar] [CrossRef]
  66. Lim, S.S.; Fontmorin, J.M.; Pham, H.T.; Milner, E.; Abdul, P.M.; Scott, K.; Head, I.; Yu, E.H. Zinc removal and recovery from industrial wastewater with a microbial fuel cell: Experimental investigation and theoretical prediction. Sci. Total Environ. 2021, 776, 145934. [Google Scholar] [CrossRef] [PubMed]
  67. Nazir, M.A.; Hasan, M.; Mustafa, G.; Tariq, T.; Ahmed, M.M.; Dehno, R.G.; Ghorbanpour, M. Zinc oxide nano-fertilizer differentially affects the morphological and physiological identity of redox-enzymes and biochemical attributes in wheat (Triticum aestivum L.). Sci. Rep. 2024, 14, 13091. [Google Scholar] [CrossRef] [PubMed]
  68. Cheikh, B.B.; Khoukhi, Y.; Arabi, M.; Chafi, A.; Omari, A.; Benyoussef, S. The spatiotemporal variation in lead and zinc contents in the Moulouya River (northeastern Morocco). E3S Web Conf. 2024, 527, 02006. [Google Scholar] [CrossRef]
  69. Adeel, M.; Zain, M.; Shakoor, N.; Muhammad Arslan Ahmad, M.A.; Azeem, I.; Aziz, A.M.; Tulcan, S.X.R.; Rathore, A.; Tahir, M.; Horton, R.; et al. Global navigation of lithium in water bodies and emerging human health crisis. NPJ Clean Water 2023, 6, 33. [Google Scholar] [CrossRef]
  70. Huang, Z.; Liu, C.; Zhao, X.; Dong, J.; Zheng, B. Risk assessment of heavy metals in the surface sediment at the drinking water source of the Xiangjiang River in South China. Environ. Sci. Eur. 2020, 32, 23. [Google Scholar] [CrossRef]
  71. Linder, C.M.; Hazegh-Azam, M. Copper biochemistry and molecular biology. Am. J. Clin. Nutr. 1996, 63, 797S–811S. [Google Scholar] [CrossRef]
  72. Simpson, L.S.; Batley, E.G.; Hamilton, L.I.; Spadaro, A.D. Guidelines for copper in sediments with varying properties. Chemosphere 2011, 85, 1487–1495. [Google Scholar] [CrossRef]
  73. Iwegbue, M.A.C.; Emakunu, S.O.; Lari, B.; Egobueze, E.F.; Tesi, O.G.; Nwajei, E.G.; Martincigh, S.B. Risk of human exposure to metals in some household hygienic products in Nigeria. Toxicol. Rep. 2019, 6, 914–923. [Google Scholar] [CrossRef]
  74. Eliopoulos, E.M.; Laskou, M.; Eliopoulos, G.D.; Megremi, I.; Kalatha, S.; Eliopoulos, D.G. Origin of critical metals in Fe–Ni laterites from the Balkan Peninsula: Opportunities and environmental risk. Minerals 2021, 11, 1009. [Google Scholar] [CrossRef]
  75. Zhang, R.; Guan, M.; Shu, Y.; Shen, L.; Chen, X.; Zhang, F.; Li, T.; Jiang, T. Reconstruction of historical lead contamination and sources in Lake Hailing, Eastern China: A Pb isotope study. Environ. Sci. Pollut. Res. 2016, 23, 9183–9191. [Google Scholar] [CrossRef]
  76. Madejón, P. Barium. In Heavy Metals in Soils, 1st ed.; Alloway, B., Ed.; Springer: Dordrecht, The Netherlands, 2013; p. 22. [Google Scholar] [CrossRef]
  77. Kothari, V.; Vij, S.; Sharma, K.S.; Gupta, N. Correlation of various water quality parameters and water quality index of districts of Uttarakhand. Environ. Sustain. Indic. 2020, 9, 100093. [Google Scholar] [CrossRef]
  78. Kończyk, J.; Kluziak, K.; Kołodyńska, D. Adsorption of vanadium (V) ions from aqueous solutions on different biomass-derived biochars. J. Environ. Manag. 2022, 313, 114958. [Google Scholar] [CrossRef] [PubMed]
  79. Akcil, A.; Swami, K.R.; Gardas, R.L.; Hazrati, E.; Dembele, S. Overview on hydrometallurgical recovery of rare-earth metals from red mud. Minerals 2024, 14, 587. [Google Scholar] [CrossRef]
  80. Prasad, S.; Yadav, K.K.; Kumar, S.; Gupta, N.; Cabral-Pinto, M.S.M.; Rezania, S.; Radwan, N.; Alam, J. Chromium contamination and effect on environmental health and its remediation: A sustainable approach. J. Environ. Manag. 2021, 285, 112174. [Google Scholar] [CrossRef]
  81. Tumolo, M.; Ancona, V.; De Paola, D.; Losacco, D.; Campanale, C.; Massarelli, C.; Uricchio, V.F. Chromium pollution in European water, sources, health risk, and remediation strategies: An overview. Int. J. Environ. Res. Public Health 2020, 17, 5438. [Google Scholar] [CrossRef]
  82. Deng, L.; Shahab, A.; Xiao, H.; Li, J.; Rad, S.; Jiang, J.; Yu, G.; Jiang, P.; Huang, H.; Li, X.; et al. Spatial and temporal variation of dissolved heavy metals in the Lijiang River, China: Implication of rainstorm on drinking water quality. Environ. Sci. Pollut. Res. 2021, 28, 68475–68486. [Google Scholar] [CrossRef]
  83. Zhang, G.; Bai, J.; Zhao, Q.; Lu, Q.; Jia, J.; Wen, X. Heavy metals in wetland soils along a wetland-forming chronosequence in the Yellow River Delta of China: Levels, sources, and toxic risks. Ecol. Indic. 2016, 69, 331–339. [Google Scholar] [CrossRef]
  84. Xiao, H.; Shahab, A.; Ye, F.; Wei, G.; Li, J.; Deng, L. Source-specific ecological risk assessment and quantitative source apportionment of heavy metals in surface sediments of Pearl River Estuary, China. Mar. Pollut. Bull. 2022, 179, 113726. [Google Scholar] [CrossRef]
  85. Motswaiso, F.; Nakamura, K.; Watanabe, N.; Komai, T. Geochemical Investigation of Metals and Trace Elements around the Abandoned Cu-Ni Mine Site in Selibe Phikwe, Botswana. J. Geosci. Environ. Prot. 2019, 7, 275–293. [Google Scholar] [CrossRef]
  86. Zhang, S.; Han, G.; Zeng, J. Geochemical Characteristics of Strontium Isotopes in a Coastal Watershed: Implications for Anthropogenic Influenced Chemical Weathering and Export Flux. PeerJ 2022, 10, e13223. [Google Scholar] [CrossRef]
  87. Jiang, J.; Fu, M.; Yang, J.; Song, Y.; Fu, G.; Wang, H.; Lin, C.; Wang, Y. Spatial Distribution Characteristics, Ecological Risk Assessment, and Source Analysis of Heavy Metal(loid)s in Surface Sediments of the Nearshore Area of Qionghai. Front. Mar. Sci. 2024, 11, 1491242. [Google Scholar] [CrossRef]
  88. Rani, S.; Ahmed, M.K.; Xiongzhi, X.; Keliang, C.; Islam, M.S.; Al-Mamun, M.H. Occurrence, spatial distribution, and ecological risk assessment of trace elements in surface sediments of rivers and coastal areas of the east coast of Bangladesh, north-east Bay of Bengal. Sci. Total Environ. 2021, 801, 149782. [Google Scholar] [CrossRef] [PubMed]
  89. Das, C.R.; Das, S.; Panda, S. Groundwater quality monitoring by correlation, regression and hierarchical clustering analyses using WQI and PAST tools. Groundw. Sustain. Dev. 2021, 16, 100708. [Google Scholar] [CrossRef]
  90. Varol, M.; Gündüz, K.; Sünbül, M.R. Pollution status, potential sources, and health risk assessment of arsenic and trace metals in agricultural soils: A case study in Malatya province, Turkey. Environ. Res. 2021, 202, 111806. [Google Scholar] [CrossRef]
  91. Tian, S.; Zhao, Y.; Gong, Y.; Wang, G. Experimental Study on Tailings Deposition Distribution Pattern and Sedimentation Characteristics. ACS Omega 2024, 9, 19428–19439. [Google Scholar] [CrossRef]
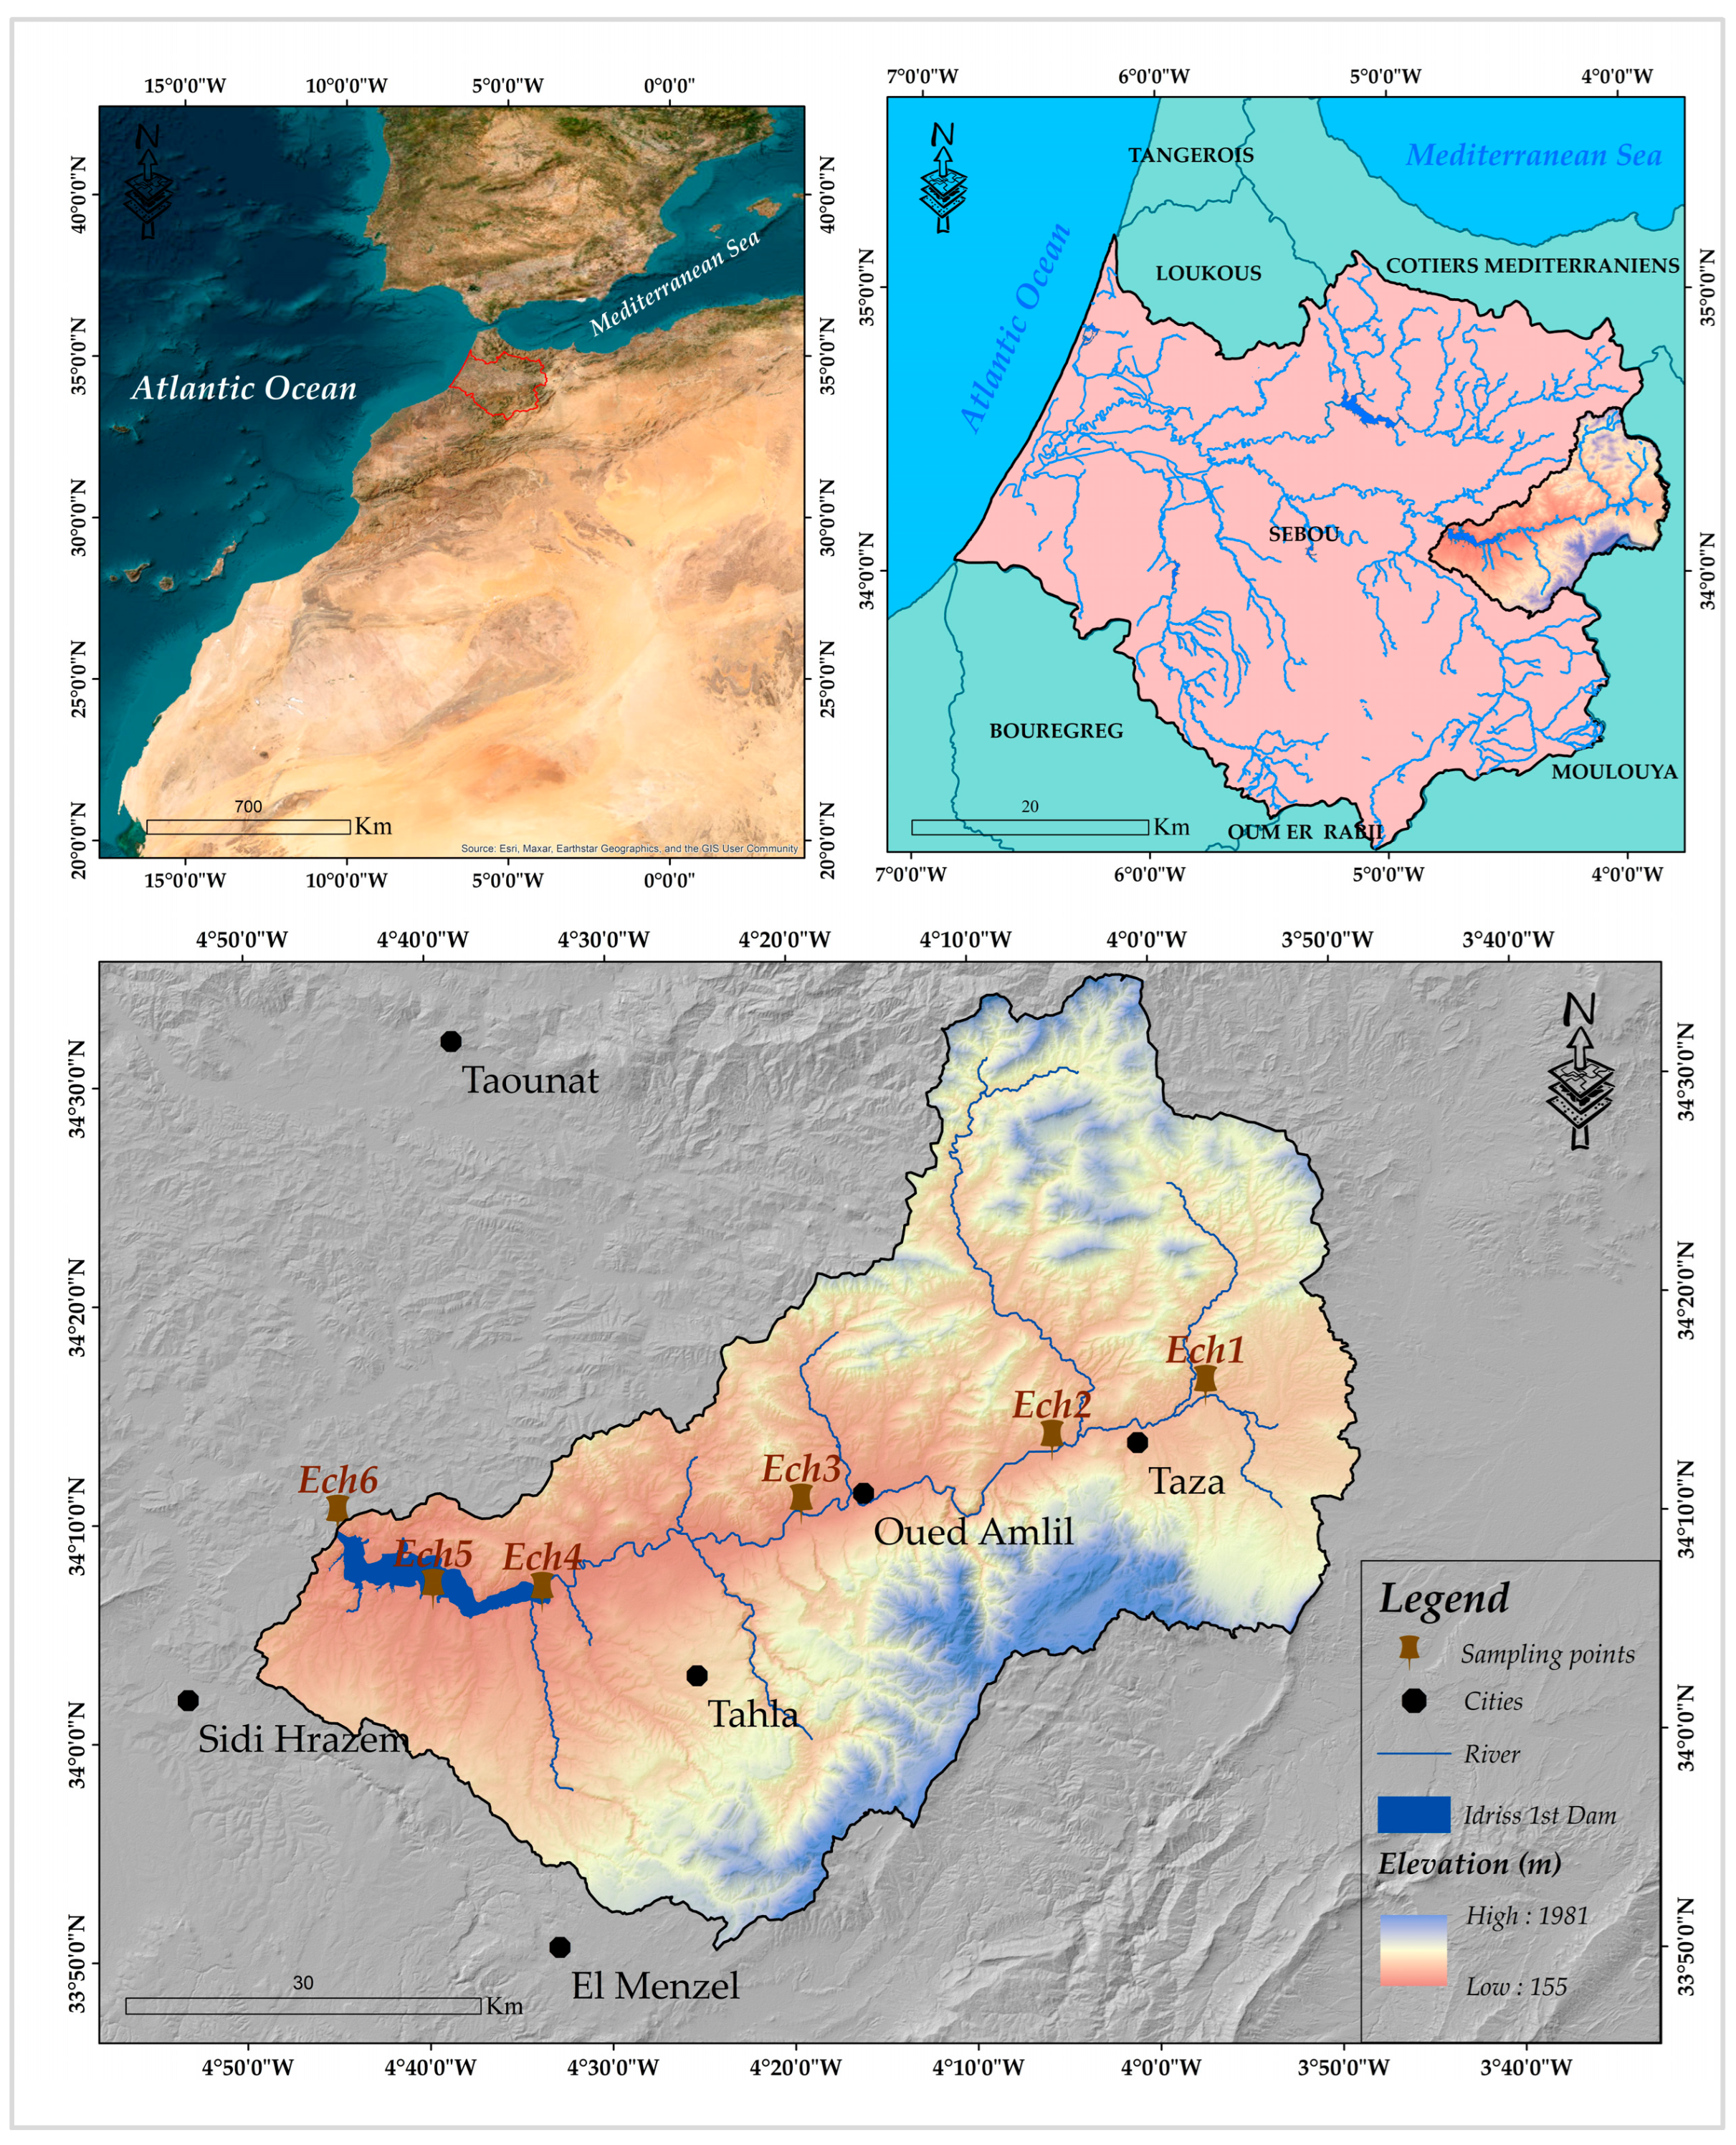
Figure 1. Overview of the study area and the locations of sampling sites.
Sustainability 17 04668 g001
Figure 2. ANOVA and Tukey’s multiple comparison of physicochemical parameters pH (A), EC (B), CaCO3 (C), and OM (D) in sediments across sampling stations.
Sustainability 17 04668 g002
Figure 3. Spatial distribution of heavy metal concentrations in sediments of the Inaouéne watershed, upstream of the Idriss 1st Dam (Note: C denotes concentration).
Sustainability 17 04668 g003
Figure 4. Geoaccumulation index of heavy metals in the surface sediments of Oued Inaouène.
Sustainability 17 04668 g004
Figure 5. Heavy metal enrichment factors (EF).
Sustainability 17 04668 g005
Figure 6. Sediment pollution index (SPI) in Inaouène watershed.
Sustainability 17 04668 g006
Figure 7. Box plot of the contamination factor (CF) for metals analyzed in the sediments of the Inaouène watershed.
Sustainability 17 04668 g007
Figure 8. Modified degree of contamination (mCd) in the sediments of the Inaouène watershed.
Sustainability 17 04668 g008
Figure 9. Pollution load index (PLI) in the sediments of the Inaouène watershed.
Sustainability 17 04668 g009
Figure 10. Distribution of potential ecological risk factors ( E r i ) for various chemical elements in sediments of the Inaouène watershed.
Sustainability 17 04668 g010
Figure 11. Distribution of ecological risk index (IR) by station based to the heavy metals analyzed in the Inaouéne watershed.
Sustainability 17 04668 g011
Figure 12. Pearson correlation matrix for trace elements and environmental parameters.
Sustainability 17 04668 g012
Figure 13. Correlation circle of heavy metals analyzed in Inaouéne sediments (A), and sampling stations representation map (B).
Sustainability 17 04668 g013
Figure 14. Dendrogram of hierarchical clustering of samples.
Sustainability 17 04668 g014
Table 1. Presentation and classification of enrichment factor, geoaccumulation index and modified contamination level.
Enrichment Factor (EF)Index of Geoaccumulation (Igeo)Modified Degree of Contamination (mCd)
ValuePollution IntensityValuePollution LevelValueSediment Pollution Intensity
EF > 50Extremely severeIgeo ≥ 5Very highly pollutedmCd ≥ 32Ultra-high contamination
25 ≤ EF ≤ 50Very severe4 ≤ Igeo < 5Highly polluted16 < mCd < 32Extremely high contamination
10 ≤ EF ≤ 25severe3 ≤ Igeo < 4Moderately to highly polluted8 < mCd < 16Very high contamination
5 ≤ EF ≤ 10Moderately severe2 ≤ Igeo < 3Moderately polluted4 < mCd < 8High contamination
3 ≤ EF ≤ 5Moderate1 ≤ Igeo < 2Moderately to unpolluted2 < mCd < 4Very high contamination
1 ≤ EF ≤ 3Minor0 ≤ Igeo < 1Unpolluted1.5 < mCd < 2Low contamination
EF < 1No enrichmentIgeo < 0Background concentrationmCd < 1.5Null to very low contamination
Table 2. Categories of pollution indices and contamination levels applied in the study.
Contamination Factor (CF)Ecological Risk Factor (Er)Ecological Risk Index (RI)
ValuePollution CategoryValueRisk CategoryValueRisk Category
CF < 1Low contaminationEr < 40No metal enrichmentRI < 150Low risk
1 ≤ CF ≤ 3Moderately40 ≤ Er < 80Moderate contamination150 ≤ RI < 300Moderate
3 ≤ CF ≤ 6Considerable80 ≤ Er < 160Considerable300 ≤ RI < 600Considerable
CF > 6Very high160 ≤ Er < 320HighRI ≥ 600Very high
--Er ≥ 320Very high--
Table 3. Sediment pollution index and pollution load categories.
Sediment Pollution Index (SPI)Pollution Load Index (PLI)
ValuesPollution IntensityValuesQuality
0 ≤ SPI < 2Healthy sediment0No pollution
2 ≤ SPI < 5Slightly polluted sediment1Background pollution
5 ≤ SPI < 10Moderately polluted sediment>1Elevated pollution level
10 ≤ SPI < 20Highly polluted sediment -
20 ≤ SPIHazardous sediment -
Table 4. Summary of indices and statistical methods used for sediment contamination assessment.
AbbreviationFull NamePurpose/Use
IgeoGeoaccumulation IndexEvaluates the level of heavy metal accumulation compared to natural background values.
EFEnrichment FactorIdentifies the degree of anthropogenic influence on metal concentrations.
PLIPollution Load IndexAssesses the overall contamination status of a site using multiple metals.
PERIPotential Ecological Risk IndexEstimates the ecological risk posed by heavy metals, considering their toxicity.
SPISediment Pollution IndexIntegrates metal concentration and toxicity into a composite pollution score.
PCAPrincipal Component AnalysisIdentifies relationships between variables and potential sources of metal contamination.
HCAHierarchical Cluster AnalysisGroups sampling sites based on similarities in their contamination profiles.
Table 5. Igeo, CF, EF and Er values for elements in sediment samples from the Inaouéne watershed.
ZnLiCoCuNiPbVBaSrCeCr
CF
Min1.241.000.820.871.022.291.030.280.530.431.74
Max2.011.841.552.271.723.212.084.861.810.663.80
Mean1.741.501.101.601.472.661.391.371.370.562.38
SD0.280.300.250.480.280.320.371.730.450.080.76
EF
Min6.455.303.775.055.7811.694.611.633.042.196.35
Max20.4114.5215.9923.4217.7326.0621.3938.3818.675.1039.16
Mean11.039.387.2210.519.3916.409.2010.108.983.4016.37
SD5.153.944.506.794.695.626.1914.365.750.9512.13
Igeo
Min−0.27−0.58−0.87−0.78−0.550.61−0.54−2.41−1.51−1.790.22
Max0.420.300.050.600.201.100.471.700.27−1.181.34
Mean0.20−0.03−0.480.04−0.050.82−0.15−0.81−0.23−1.430.61
SD0.250.310.310.470.300.170.351.390.650.220.41
Er
Min1.240-4.094.375.1111.472.060.56--3.49
Max2.010-7.7611.368.6016.034.159.72--7.60
Mean1.740-5.508.017.3713.312.772.73--4.75
SD0.280-1.272.381.391.600.733.47--1.52
Table 6. Mean values for mDc, RI, PLI and SPI mCd in sediment samples from the Inaouéne watershed.
mCdRIPLISPI
Min1.1335.961.266.17
Max1.8956.421.3221.53
Mean1.5646.181.2911.11
SD0.307.630.025.97
Disclaimer/Publisher’s Note: The statements, opinions and data contained in all publications are solely those of the individual author(s) and contributor(s) and not of MDPI and/or the editor(s). MDPI and/or the editor(s) disclaim responsibility for any injury to people or property resulting from any ideas, methods, instructions or products referred to in the content.