Article

Comprehensive Modeling of Climate Risk in the Dominican Republic Using a Multivariate Simulator

by
Antonio Torres Valle
1,2,
Juan C. Sala Rosario
1,3,
Yanelba E. Abreu Rojas
1,4 and
Ulises Jauregui Haza
1,*
1
Área de Ciencias Básicas y Ambientales, Instituto Tecnológico de Santo Domingo (INTEC), Ave. de los Próceres 49, Santo Domingo 10602, Dominican Republic
2
Higher Institute of Technologies and Applied Sciences (InSTEC), University of Havana, Havana 11300, Cuba
3
Defensa Civil, Av. Ortega y Gasset Esq. Pepillo Salcedo, Plaza de la Salud, Edif. Comisión Nacional de Emergencias, 2do nivel, Santo Domingo 10101, Dominican Republic
4
Comisión Nacional de Emergencia, Av. Ortega y Gasset Esq. Pepillo Salcedo, Plaza de la Salud, Edif. Comisión Nacional de Emergencias, Santo Domingo 10101, Dominican Republic
*
Author to whom correspondence should be addressed.
Sustainability 2025, 17(10), 4638; https://doi.org/10.3390/su17104638
Submission received: 9 March 2025 / Revised: 25 April 2025 / Accepted: 7 May 2025 / Published: 19 May 2025

Abstract

:
This study introduces a multivariate simulation framework for assessing climate risks in the Dominican Republic. The simulator operates in two modes—climate risk evaluation and disaster management—using a unified database. This database integrates codified variables associated with global warming, hazards, vulnerabilities (including their interdependencies), and adaptive capacities, facilitating risk assessments across diverse scenarios. Simulations are initiated using predefined variable combinations, interconnected via Boolean algebra, to generate risk levels aligned with the Intergovernmental Panel on Climate Change (IPCC) scales. The key findings underscore the influence of specific variables within the modeled scenarios. For instance, inadequate energy management and insufficient mitigation measures significantly amplify climate risks, particularly in regions with vulnerable infrastructure. Validation against established models, including EN-ROADS and PRECIS, confirms the simulator’s predictive accuracy and reliability. This study highlights the critical role of regionalized risk assessments in developing targeted adaptation and mitigation strategies that address localized vulnerabilities. The proposed simulator provides an innovative tool for real-time climate risk assessment, enabling policymakers to model potential outcomes and optimize decision-making processes. Future improvements should focus on enhancing spatial resolution, integrating real-time data, and refining models of infrastructure interdependencies. This research advances the development of evidence-based climate risk assessment tools, supporting informed policymaking and effective disaster risk management in the Dominican Republic.

1. Introduction

The Intergovernmental Panel on Climate Change (IPCC) outlines its perspective on climate change-related risks in its latest reports, which illustrates the multifactorial nature of the phenomenon [1,2]. Additionally, Equation (1) provides a concise representation of the risk. 1:
R = P × V × E
where R is the risk associated with climate change, P is the probability of hazards, V is vulnerability to hazards, and E is exposure to hazards.
Hazards refer to climate-related events that humanity routinely faces, such as hurricanes, droughts, rising sea levels, and melting ice. As shown in Equation (1), risk arises from the interplay of these factors, where probability reflects the frequency of hazard occurrence, vulnerability indicates the susceptibility of natural and socioeconomic systems to each hazard type, and exposure denotes the presence of these systems in hazard-prone areas.
Climate change risk stems from both natural and anthropogenic factors, including natural variability and human-induced climate change. Variables that intensify the frequency and severity of climatic hazards interact with socioeconomic factors, such as development pathways, adaptation and mitigation measures, and governance decisions, which influence vulnerability and exposure.
Inadequate design of anthropogenic development components exacerbates vulnerability and exposure. Moreover, these components contribute to greenhouse gas (GHG) emissions, which amplify climate change and, in turn, intensify hazards. This dual impact creates a feedback loop that perpetuates climate risk, complicating efforts to break this cycle.
Simulators have proven valuable for modeling climate-related risks, aiding decision-making and training personnel in relevant technologies [3]. In 2007, simulators for rising sea levels were developed, followed by Google Earth’s 2009 model to raise awareness about climate change. These tools allowed users to adjust parameters like temperature or sea level to explore predefined scenarios. Educational simulators, such as the CO2 Bathtub [4] and more recent artificial intelligence-based models for global weather forecasting [5], have also emerged.
Among the most advanced simulators is the EN-ROADS system, developed by the Massachusetts Institute of Technology. EN-ROADS enables flexible scenario-building, incorporating variables such as energy supply (fossil fuels versus renewable sources), transportation (efficiency and electrification), building and industrial energy use (efficiency and electrification), population and economic growth, and carbon removal (e.g., reforestation and technology). These parameters influence development trajectories, economic trends, renewable energy adoption, temperature levels, flooding, and other global warming impacts. For certain variables, such as flooding, EN-ROADS generates maps depicting regional changes [6].
A more sophisticated modeling approach, characterized by greater objectivity and complexity due to its extensive input variables, is the PRECIS (Providing Regional Climates for Impacts Studies) framework. PRECIS is a regional climate modeling system based on large computing clusters, developed by the Hadley Centre of the Met Office of the United Kingdom [7].
Three-dimensional ocean–atmosphere models rely on GHG emission and removal scenarios as inputs. These scenarios, predefined by the IPCC, reflect varying levels of human management of GHG inventories, ranging from optimistic to pessimistic outcomes. By integrating atmospheric gas life cycle models with radiative transfer models, these simulations estimate warming effects. Feedback loops from warming itself complicate these models, producing positive effects (e.g., increased water vapor leading to more warming) or negative effects (e.g., enhanced CO2 uptake via photosynthesis). Within the PRECIS framework, two scenarios (HadCM3 and ECHAM4) predict global and regional changes in temperature, precipitation, and other parameters, such as in the Caribbean region. These forecasts indicate rising temperatures and decreasing precipitation. Though not a simulator, PRECIS supports long-term climate predictions and informs adaptation and mitigation strategies.
Another critical aspect of climate risk simulations is the interplay between climate hazards and infrastructure. Network theory and system-of-systems approaches model these relationships, assessing how hazards impact infrastructure directly (e.g., physical damage) and indirectly (e.g., disruptions across interconnected systems like electricity, water, wastewater, fuel, or transportation networks). Satellite-derived maps often facilitate these models by providing spatial data, while analyses typically focus on economic losses and require infrastructure fragility curves [8,9,10,11,12]. Additionally, hazard–vulnerability interactions can trigger NaTech accidents (technological risks caused by natural events), which, though rare, have severe consequences and are often modeled independently [13,14].
Simplified vulnerability assessment methods have also been developed to evaluate risks from hazards such as floods, high winds, landslides, tsunamis, or earthquakes. These methods use basic parameters, such as hazard intensity and building characteristics, to estimate vulnerabilities [15,16,17,18,19,20,21,22,23,24,25,26,27,28,29,30].
The complexity of climate risk, involving numerous variables, has led to the use of layered satellite maps combined with artificial intelligence (AI) techniques. Flood prediction models are a notable example [31]. Generally, these models address risk indirectly through factors like rising temperatures, reduced precipitation, increasing atmospheric GHG levels, sea level rise, and economic losses [4,5,6,7,31].
Integrating all relevant factors—hazards, vulnerabilities, adaptation measures, global warming, mitigation strategies, infrastructure networks, and NaTech events—is a high-priority need. Effective decision-making for climate change and disaster management requires a holistic approach, as the dynamic interactions among these elements can produce unpredictable outcomes if not modeled together. Boolean logic, successfully applied in complex tasks like Probabilistic Safety Analysis (PSA) for nuclear power plants [32], offers a promising methodology for coupling correlated variables. This research aims to develop an AI-powered simulator to directly predict climate risk in the Dominican Republic.

2. Materials and Methods

For the study of climate risk and disaster management, the procedure described in the following algorithm (Figure 1) was used:

2.1. Establishment of the Systemic Conceptual Pattern of Climate Risk

The systemic conceptual framework for global climate risk is depicted in Figure 2. This framework uses a matrix-based schematic to represent any system (SYSTEM X) and its associated climatic hazards (PRE1), such as hurricanes, sea level rise, ice melt, droughts, and floods. Corresponding vulnerabilities (VUL1) and adaptation measures (ADA1), designed to offset these vulnerabilities, are tailored to each hazard. The system is influenced by global variables—both natural and anthropogenic—with the latter (GLOBAL) potentially mitigated through measures (MIT). These variables collectively determine the system’s risk level.
Terms in the model are assigned identification codes and qualitative measurement levels based on IPCC guidelines [1,2]. The GLOBAL variable reflects the simulated level of global warming. Mitigation failure (MIT) is modeled to account for the management of emission sources, including those from industry and agriculture. Regional precursors (PRE1) represent climate hazards specific to a region, including their qualitative probability. Vulnerabilities (VUL1) encompass exposures and susceptibilities to hazards, while adaptive capacities (ADA1) refer to predefined adaptation actions for each scenario. Further details on this conceptual framework are provided in Section 4.

2.2. Development of a Structured Climate Risk Equation

Based on a detailed study of Figure 2, an appropriate equation to describe the system risk will be the following:
R s i s t = G L O B A L × M I T × i = 1 n R i
R i = P i × V U L i × A D A i
Rsist represents the climate risk of the studied system; GLOBAL denotes anthropogenic warming; MIT refers to mitigation strategies (both global); Ri indicates possible risks within the system; Pi represents local climate hazards; and VULi and ADAi are the corresponding vulnerabilities and adaptation actions associated with these hazards, respectively.

2.3. Design of a Hazard vs. Vulnerability Matrix Adapted to IPCC Scales

A hazard vs. vulnerability (risk) matrix, adapted from IPCC scales [1,2], is presented in Figure 3. Two additional levels, obvious (O) and insignificant (I), have been included. This matrix uses color coding to represent risk levels (see legend). It is divided into three bands: brown and red indicate the highest risks (obvious and very high), yellow represents medium risks (high, medium, and low), and green and white denote the lowest risks (very low and insignificant). These colors visually highlight risk levels in matrices and maps, based on combinations of factors from the global risk equation.
The hazard and vulnerability inputs for the risk matrix are derived from separate hazard and vulnerability matrices. The hazard matrix integrates evidence for each hazard with levels of global warming, while the vulnerability matrix models evidence for vulnerability alongside adaptation failure. A disaster management simulator output was developed using a similar approach, but it excludes the influence of global warming. In this configuration, hazard, vulnerability, and adaptation inputs are assigned their respective states (probability or evidence) at the time of simulation.
The matrix is implemented in the simulator using Boolean algebra. The simulation begins with an initial state where no system elements are affected. Users activate specific elements of the risk equation, triggering deviations quantified according to the risk matrix. The system’s overall risk, Rsist, is determined by the highest individual risk, Ri, simulated within it. Each Ri is calculated based on the combination of activated (evident) factors and compensatory factors. When compensatory factors are not activated, they assume the minimum possible value as defined by the matrix. Conversely, the highest risk values occur when all input factors reach their evidence or failure levels.

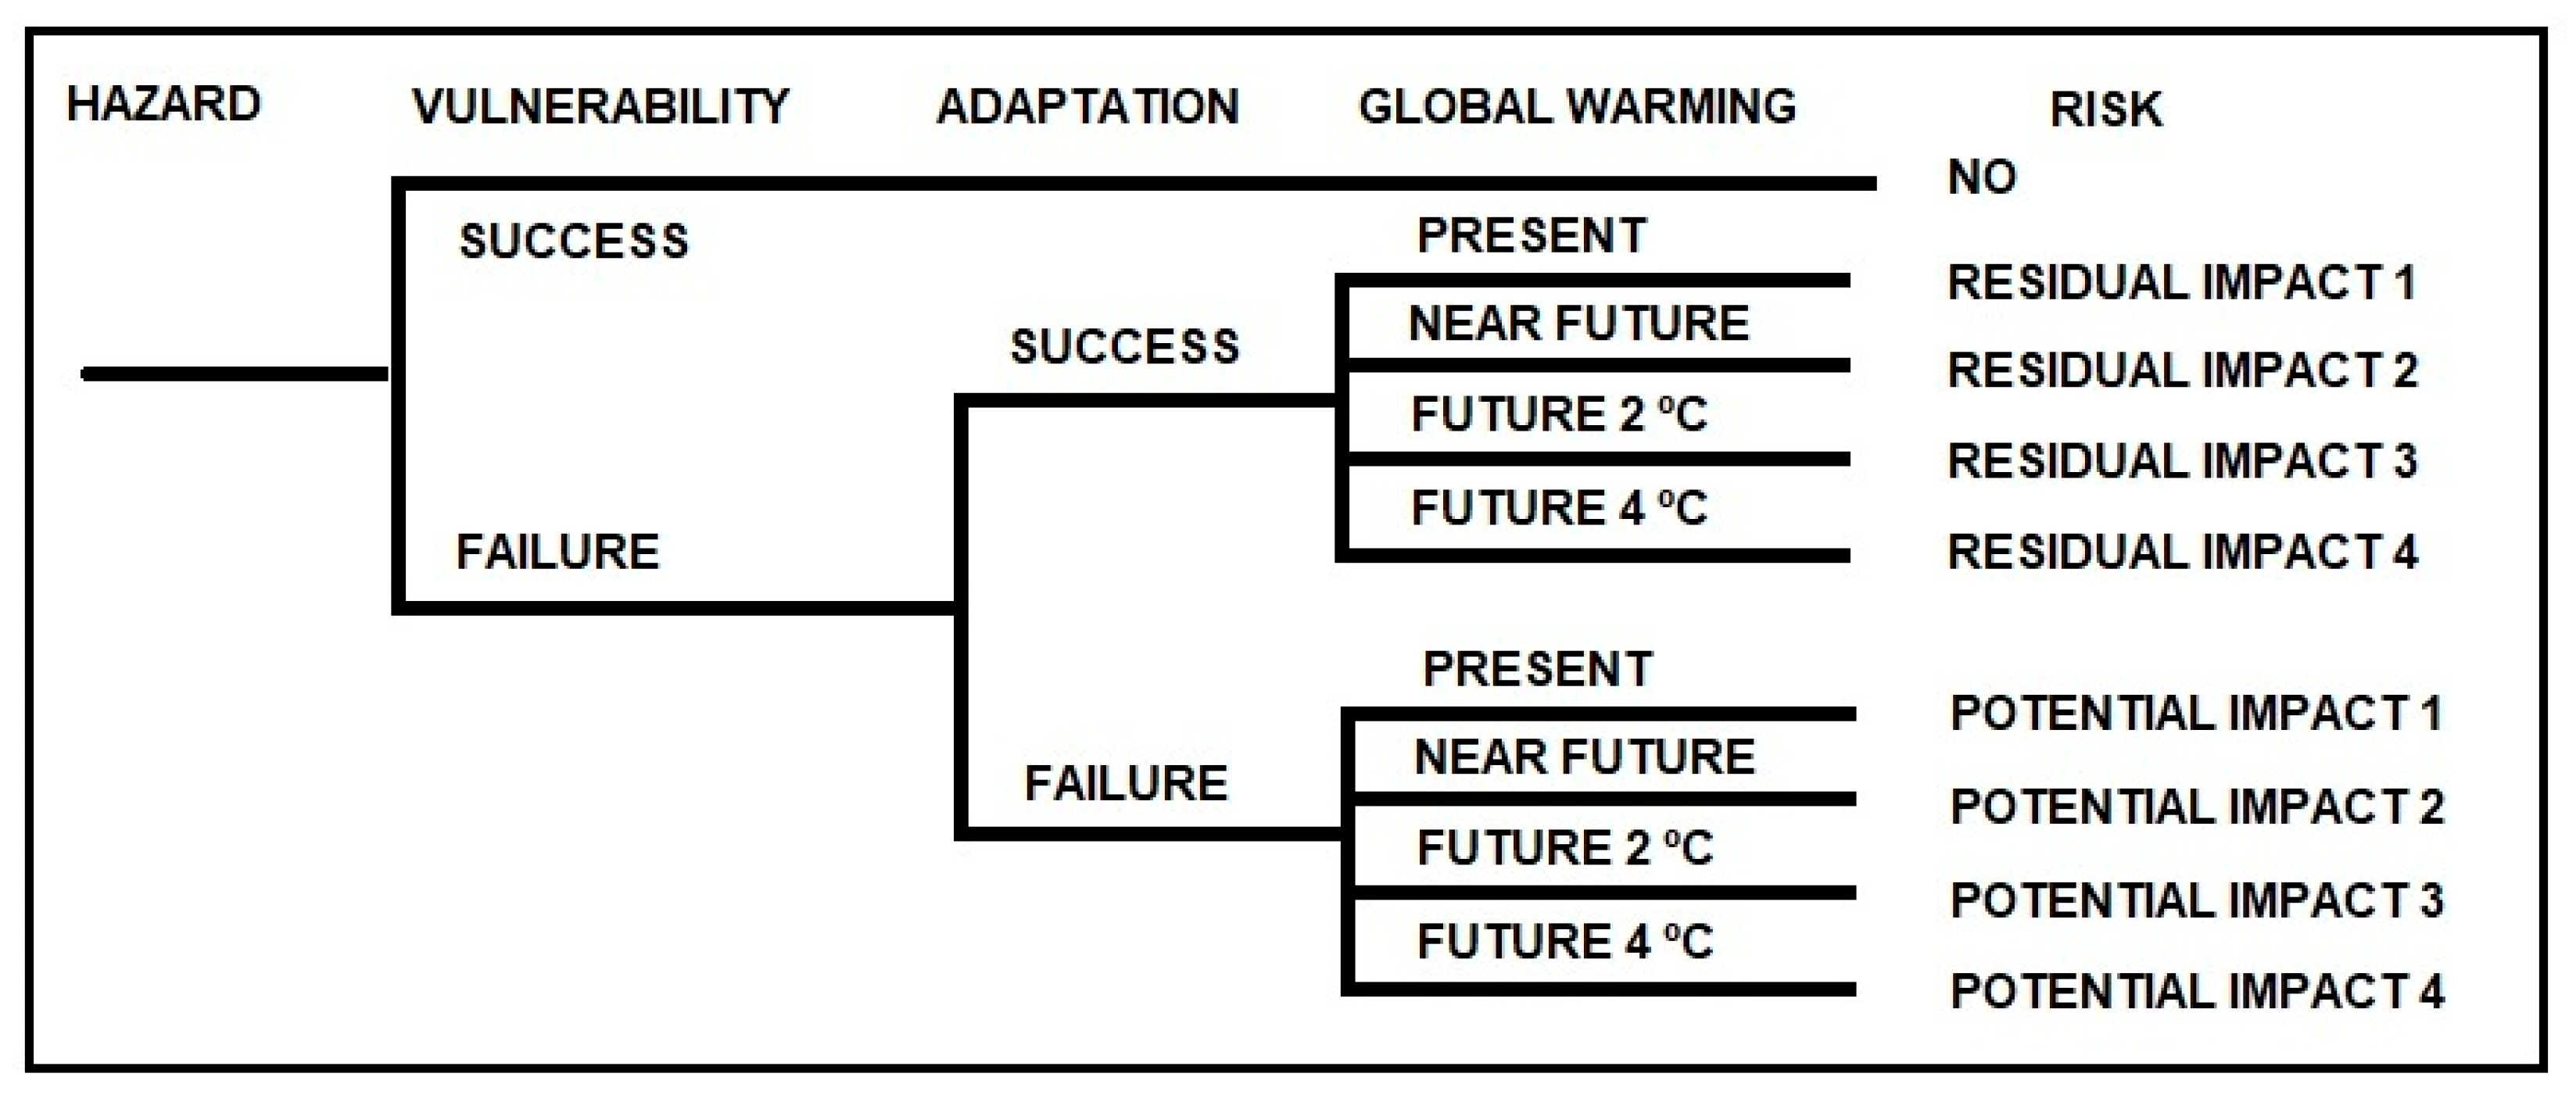
2.4. Theoretical Development of Risk Patterns at Corresponding Scales

The development of risk patterns follows hazard–vulnerability–adaptation linkages from the IPCC and other regional sources [1,2,33,34,35,36,37,38,39,40]. Two primary cases were modeled: a global scenario and a regional scenario. Due to the complexity, volume, and need to integrate analytical and graphical data, one global scenario and three regional scenarios (Dominican Republic, Cuba, and Honduras) were created. Each scenario includes an analytical matrix, which models the interrelations among all equation components, and a graphical map base, which supports interactive visualization and risk simulation.
To represent risk contributors within each scenario, standardized alphanumeric codes were used. Hazards are denoted analytically with keywords such as HURRICANE, DROUGHT, and HEAVY-PRECIP and visually with corresponding symbols on maps (see Table 1 and Figure 4 base). Vulnerabilities follow a similar approach: for example, WATER-STRESS represents water-related vulnerability, while WATER-MANAGE denotes its adaptation measure. Each vulnerability and adaptation action is assigned alphanumeric codes for matrices and visual symbols for maps, with detailed descriptions provided (Table 1 and Figure 4 base).
The model has been enhanced to illustrate the relationships between driving forces, pressures [41], and vulnerabilities, emphasizing their anthropogenic or environmental origins. These driving forces, influenced by effective or poor management and environmental behavior, are categorized into thematic areas: international economic relations (ECON-INTER), national economy (ECON-NAT), governance (GOBERNAB), science and technology (SCIENC-TECH), human development (DEVE-HUMAN), and energy and environment [34].
Figure 4 provides an example of data used for the global scenario [1,2]. This dataset integrates couplings between hazards (third column), vulnerabilities (first column), adaptation actions (second column), and risk forecasts by the degree of warming for various regions worldwide (fourth column) [1,2].
The event tree in Figure 5 is a Boolean representation of Figure 4, showing the matrix being input into the simulator.
Hazards in the simulator can be selected from those listed in Column 3 of Figure 4, vulnerabilities can be selected from Column 1, and adaptation actions can be selected from Column 2. Risk levels vary based on the success or failure of adaptation measures and the degree of global warming. This configuration defines the simulator’s climate risk mode. A disaster management mode employs a similar Boolean representation but excludes global warming levels.
Key risks were identified by evaluating the scientific, technical, and socioeconomic literature, using a methodology consistent with this research. These risks are classified as key due to their potential to cause dangerous anthropogenic interference, a criterion established in the IPCC’s Fourth Assessment Report based on key vulnerabilities [42]. Parameters for identifying key risks or vulnerabilities include distribution, magnitude, irreversibility, periodicity, low adaptive capacity, persistence, rate of change, and confidence. This framework has been applied to systematize the databases used in the simulator. Data from the first three columns of Figure 4 are coded using affine chains: Column 1 as COSTA-STRESS (coastal vulnerability), Column 2 as COSTA-MANAGE (adaptation to coastal vulnerability), and Column 3 as climatic hazards, including DROUGHT, PRECIP-EXTREM (heavy precipitation), HURRICANE, SEA-LEVEL (rise), and ACIDIFICAC (ocean acidification).
For each degree of warming (0.6, 1, 2, and 4 °C; see Column 4 in Figure 4), a risk behavior band is observed, ranging from lower (left end of the dashed bar) to higher levels (right end). The lowest risk level reflects the successful implementation of adaptation actions (Column 2), while the highest indicates their absence. The lower end of the dashed bar represents residual impacts (post-adaptation), and the upper end denotes potential impacts [34]. This dataset of residual and potential impact forecasts is critical for the simulator’s design.
Similar data, as shown in Figure 4, can be compiled for global regions (AFRICA, ASIA, AUSTRALASIA, NORTH AMERICA, CENTRAL–SOUTH AMERICA, SMALL ISLANDS, POLAR REGIONS, OCEANS). Global vulnerability distributions further enrich this database [1,2]. In the global scenario, an interactive world map visualizes regions and their associated risks, hazards, vulnerabilities, and adaptation actions.
For regional scenarios, data were sourced from national climate change communications, atlases, forecast maps, natural risk assessments, specialized references, and models of climatic event responses [33,34,35,36,37,38,39]. Aligning these cases with global key risks (Figure 6) was considered best practice, supported by consistency with prior vulnerability studies [40]. At local scales, regional data and higher-resolution information enable more precise results.
Regional scenarios model impacts on economic, social, and ecological systems, including, in general, WATER RESOURCES, COASTAL ZONES, BIOLOGICAL DIVERSITY, FORESTS, AGRICULTURE, HUMAN SETTLEMENTS-LAND USE, HUMAN HEALTH, TOURISM, and ENERGY. The robustness of these scenarios depends on the quality and quantity of available data [33,34,35,36,37,38,39]. Variations among regional scenarios also reflect their practical utility.
Interrelations between environmental issues are incorporated into the model. For example, water resource challenges affect agriculture, human settlements, and health, while biodiversity and land use impact health. These relationships are modeled through connections among vulnerabilities.
Figure 6 illustrates the integration of information into the simulator’s matrices and maps for global and regional scenarios. Arrows indicate the transfer of data from reference sources (textual or graphical) to the simulator’s resources (matrices and maps). The ASER simulator code manages these data, storing them in analytical and graphical databases. Once systematized, these matrices and maps form knowledge bases for climate risk, tailored to global and regional scales. Models at the local level are similar to the regional level in terms of impact modeling, but higher-resolution information can cover more specific objectives, such as particular areas or infrastructure networks. For this level, it is common to extrapolate information from models at the regional scale.

2.5. Calibration of Risk Patterns Using IPCC Forecasts and Regional Sources

Risk levels derived from the hazard vs. vulnerability matrix (Figure 3) require calibration to align with observed behaviors. This involves using risk forecasts stratified by world regions or regional impacts under global warming scenarios [1,2,42]. These calibrations reflect predicted risk levels, including datasets on residual and potential impacts, as derived from the referenced sources.

2.6. Data Integration into the Risk Simulation System

Figure 6 shows how data are incorporated into analytical matrices and interactive maps at global and regional levels. The matrices are organized into six key areas:
-
General links: connecting global or regional scenarios to subprocesses (geographic areas or impacts).
-
Subprocess links: associating zones or impacts with hazards and vulnerabilities.
-
Hazard–global variable links: relating hazards to climate variability and anthropogenic warming.
-
Mitigation links: modeling relationships between anthropogenic warming and mitigation strategies, including GHG emission sources.
-
Vulnerability links: addressing susceptibility and adaptation while incorporating driving forces and inter-vulnerability dependencies.
-
Special dependencies: modeling infrastructure networks and NaTech events when necessary.
This structure captures the detailed interconnections outlined by the IPCC.

2.7. Simulator Work Mode Selection

The simulator operates in two modes: climate risk and disaster management. In the climate risk mode, it uses IPCC risk forecasts for global scenarios [1,2] and regional predictions from national communications and other sources [37]. Users specify warming levels to estimate risks based on contributing factors. In disaster management mode, warming levels are excluded, and risks are assessed using hazard, vulnerability, and adaptation classifications. To minimize subjectivity, the system provides evaluation methods for various contributors [15,16,17,18,19,20,21,22,23,24,25,26,27,28,29,30]. Further details are provided in Section 2.9.
While both modes are applicable across global, regional, and local scenarios, the climate risk mode is best suited for global scenarios, both modes are viable for regional scenarios, and the disaster management mode is preferable for local scenarios.

2.8. Multivariate Studies

Multivariate studies allow users to simulate custom configurations of hazards, global temperature ranges, vulnerability evidence, and adaptation or mitigation failures. The results from ASER simulations can be reviewed by experts and decision-makers using the system’s user manual and tutorials. Outputs, both analytical and graphical, use color coding (aligned with the climate risk matrix in Figure 3) to highlight changes in matrices (colored cells) or maps (colored grids). A key feature is the provision of risk forecasts for predefined hazard–vulnerability–adaptation configurations tied to warming levels, reflecting residual and potential impacts.
In risk management studies, the results are more conservative due to the focus on verified hazards and vulnerability or adaptation failures, unlike climate change scenarios that account for warming levels. This conservatism stems from regional and local realism and the absence of warming-related amplifications noted in IPCC forecasts [1,2].

2.9. Model Adjustments for Regional or Local Characteristics

As models achieve sufficient complexity in capturing contributor relationships, they must be refined to reflect specific regional or local characteristics. Three key areas are considered:
-
Hazards and infrastructure: assessing the effect of direct and indirect vulnerabilities from hazards on infrastructure, including dependency chains across networks (e.g., electricity failures impacting water, sewage, fuel, or telecommunications) [8,9,10,11,12].
-
NaTech accidents: identifying and modeling facilities prone to technological accidents triggered by natural events, capturing associated hazard–vulnerability relationships [13,14].
-
Specific vulnerability adjustments: tailoring generic vulnerabilities using detailed methodologies based on available data [15,16,17,18,19,20,21,22,23,24,25,26,27,28,29,30].
The climate risk matrix supports modeling these dependencies within and between infrastructure networks. For NaTech risks, facilities are integrated into the model. The system currently supports data adjustments for all hazards and over 15 vulnerability types, with methods aligned to simulator scales and parameters for high-resolution applications.
Notable methods [15,16,17,18,19,20,21,22,23,24,25,26,27,28,29,30] include the following:
-
Hazards: classifying the frequency and intensity of hurricanes, precipitation, sea level rise, droughts, extreme temperatures, and ocean acidification.
-
Vulnerabilities: evaluating marine ecosystems, coastal flooding settlements, human health, terrestrial and aquatic ecosystems, territorial economies, fires, urban flooding, food security, and water resources.
Additional methods are being developed. These are critical when advanced resources like satellite maps or layered data are unavailable.

2.10. Assessing Model Interrelation Levels

A normalized importance coefficient evaluates the relevance of each climate risk matrix component for a given scenario. The algorithm calculates each component’s contribution through recursive activation, assessing its role in the model. Table 2 lists weight factors assigned to climatic risk processes for each scenario.
The limiting processes are, in the global scenario, the significant geographical areas and, in the regional scenarios, the impacts.
In this way, the importance of each component is calculated as follows:
I c o m p = i = 1 n W F i
where Icomp represents the importance of a given component; WFi denotes the weight factors for each peak process (geographical zones or impacts) when the component is active; and n indicates the number of peak processes considered in the climate risk model.
For analysis, components are categorized into climate hazards, vulnerabilities, adaptation actions, and mitigation strategies. The interrelation level of each component, calculated using this formula, reveals its contribution to the model. Applying the Pareto principle to rank components informs strategic decisions for each scenario.

2.11. Recursive Model Updates Based on Data Availability

The simulator is a dynamic tool designed for decision-making and requires regular updates as new data emerge. Updates involve new bibliographic research, model refinement, information retrieval technologies, or field visits. The tool’s reliability for decision-making depends on the accuracy and relevance of its underlying models across all scales and modes.

3. Results

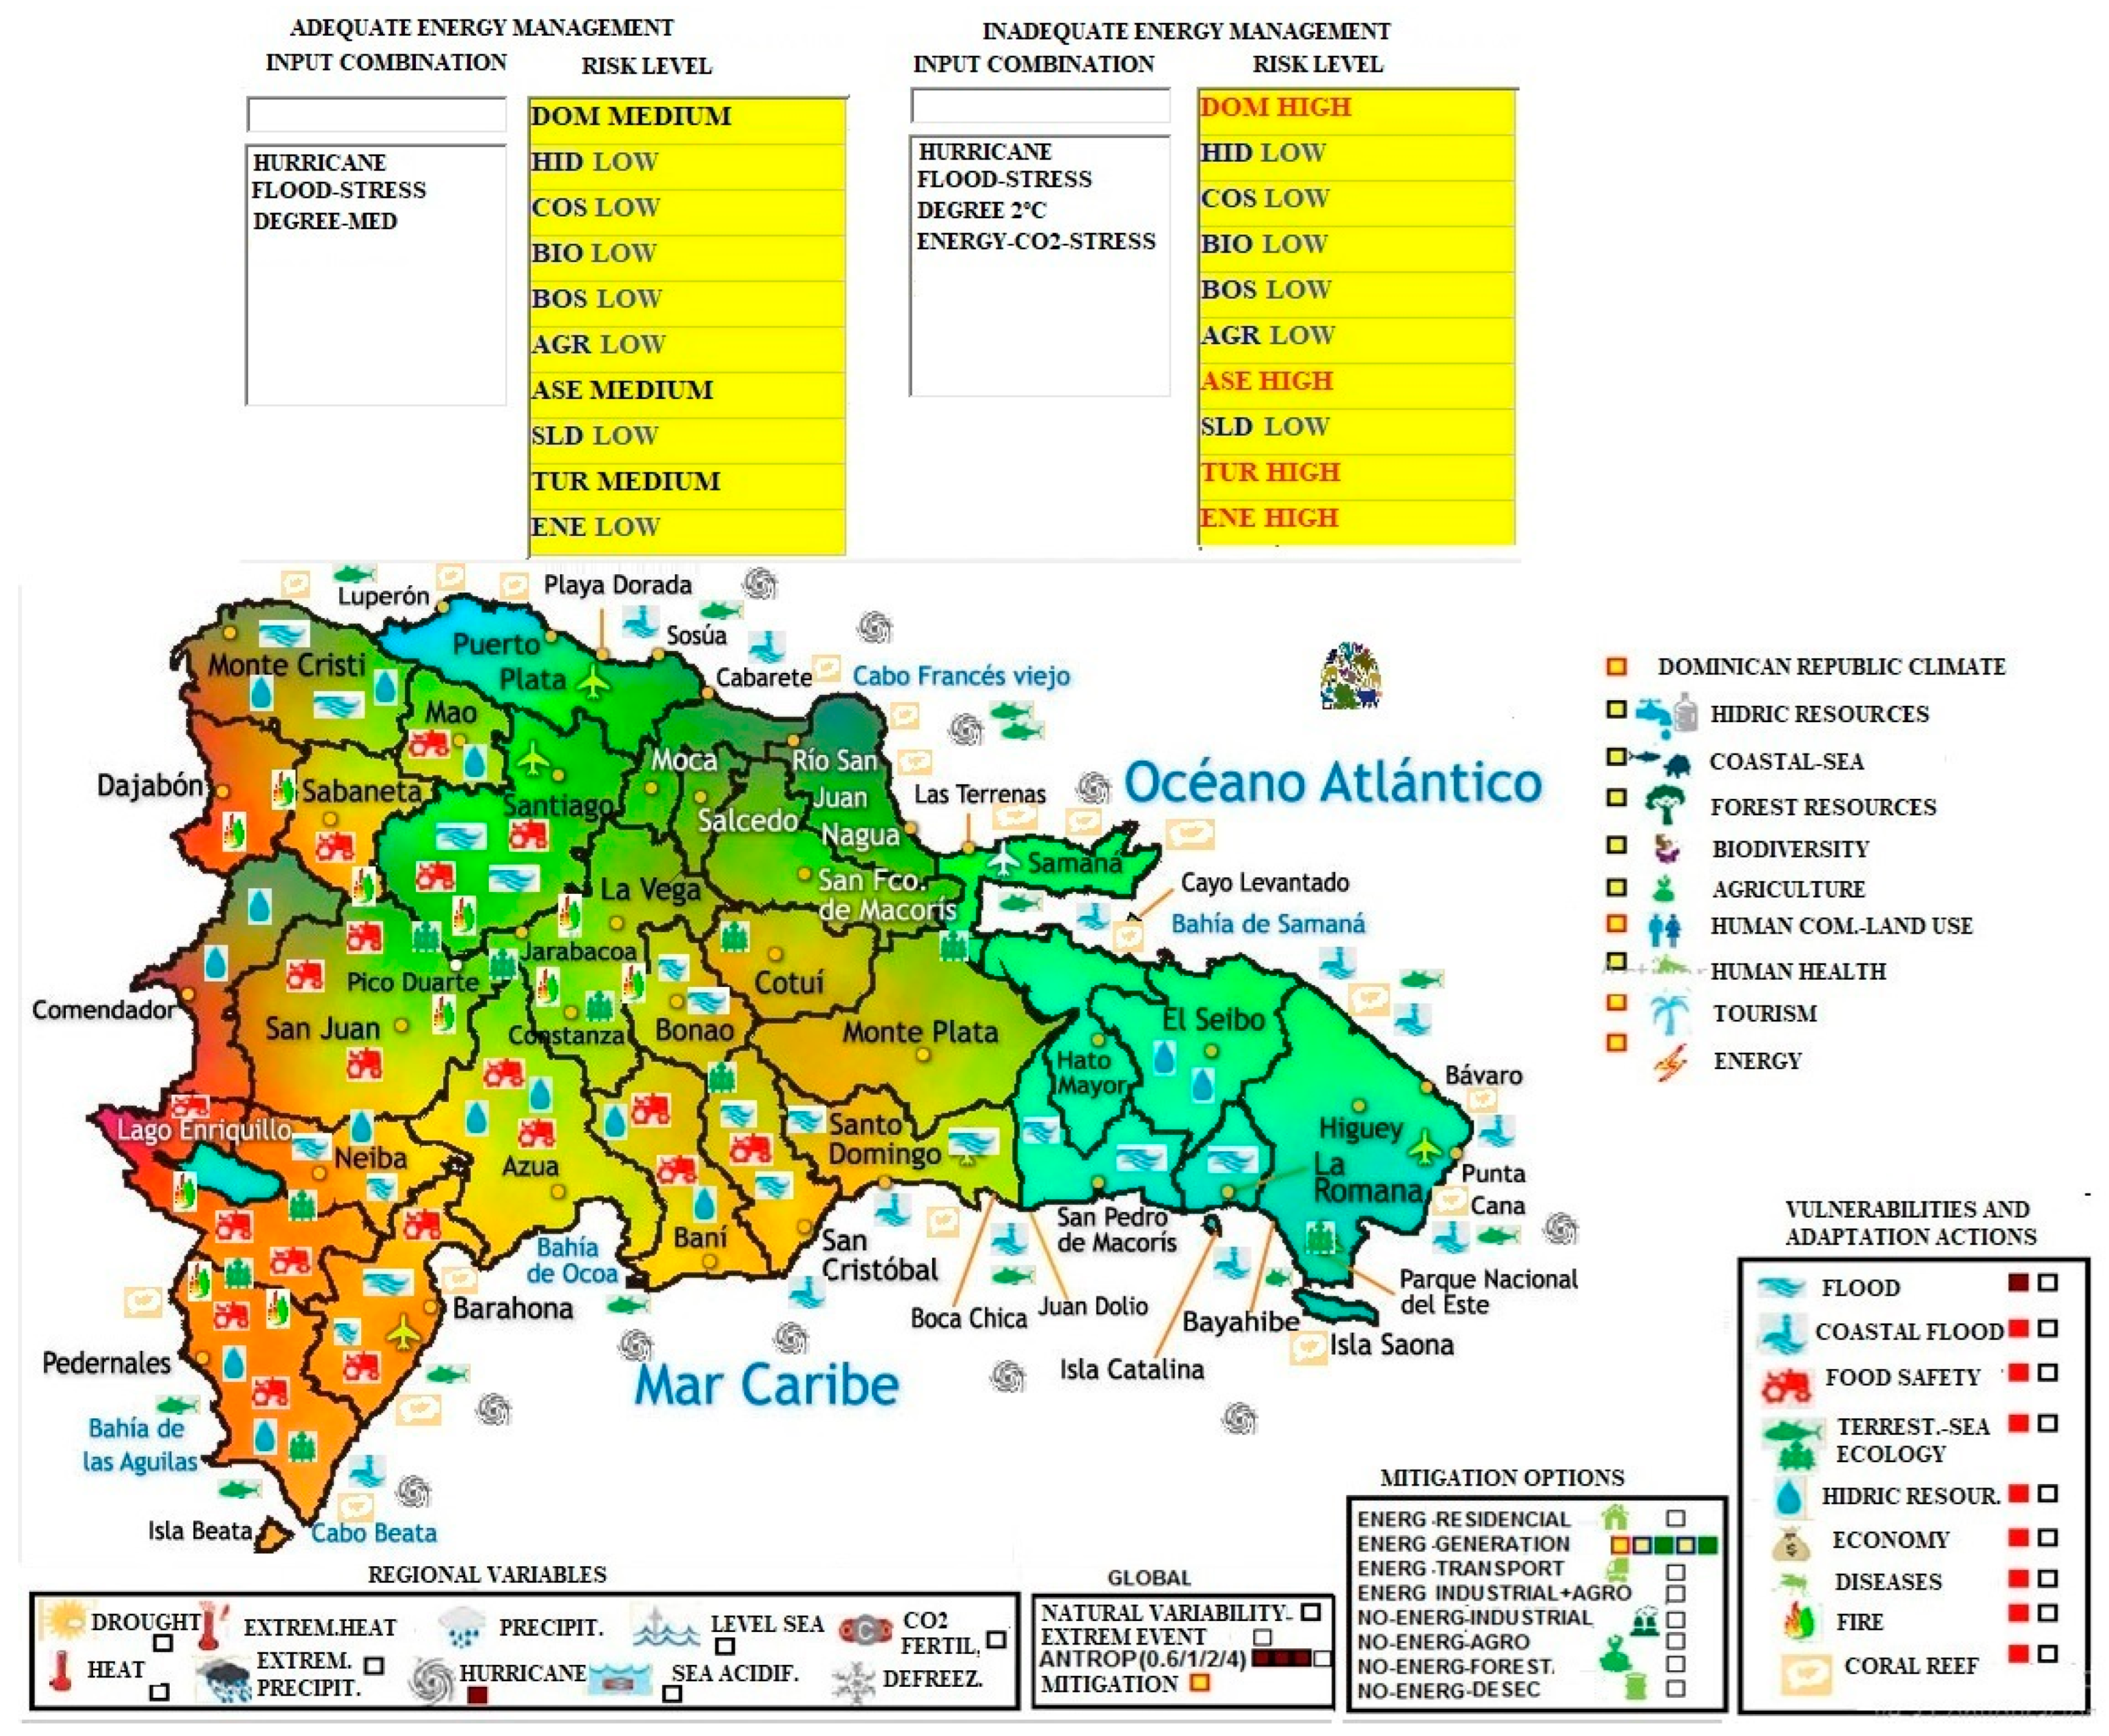
3.1. Simulation of Climate Change Risk Under Various Energy Development Strategies

Energy is the primary driver of atmospheric GHG concentrations, and this research leverages the simulator’s capabilities to model its impacts. The regional scenario for the Dominican Republic serves as a case study. The simulation includes a hazard (HURRICANE), anthropogenic global warming of 1 °C (DEGREE-MED), and a flooding vulnerability (FLOOD-STRESS). A second simulation replicates this scenario but incorporates poor energy management, increasing warming to 2 °C (DEGREE-2 °C) and adding impacts from the variable ENERGY-CO2. Note that poor energy management, which increases CO2 emissions, is modeled globally, as small countries like the Dominican Republic contribute minimally to the global GHG inventory. This scenario is depicted in Figure 7.
The representations of the contributors’ levels on the maps are illustrated in the simulator with boxes according to the following (Table 3) color equivalences.
On the maps, regional variables display threats, while global variables (encompassing natural and anthropogenic variability) and mitigation strategies appear in their respective sections. Vulnerabilities and adaptation actions are similarly presented in designated areas. Risk levels, tied to impacts in the reference case, are also visible on the maps. Analytical outputs provide details not always evident in graphical maps, so both outputs (analytical and graphical) are often needed to fully interpret the results.
In the regional case, mitigation contributors are categorized by primary GHG sources. The ENERG.GENERATION category includes thermal sources (ENERGY-CO2, fossil fuel-based GHG contributors), renewable sources (WIND, HYDRAULIC, SOLAR, BIOMASS), whose failure may lead to fossil fuel substitution, and non-energy GHG sources (NON-ENERGY).
As shown in the right table (top of Figure 7), poor energy management elevates risk to high for several impacts (HUMAN COM.-LAND USE, TUR-Tourism, ENE-Energy), resulting in a high risk for the Dominican Republic (DOM). Conversely, effective management maintains a medium risk level (left table, top of Figure 7). The regional map at the bottom of Figure 7 illustrates the distribution of hazards, vulnerabilities, and risks under poor energy management, highlighting obvious flood vulnerability (brown box, bottom right, FLOOD) and a practically certain hurricane hazard (HURRICANE).
Energy systems benefit from some adaptation measures, but thermal energy is impacted by rising temperatures (affecting cold source efficiency) and hurricanes (disrupting fossil fuel transport). Other vulnerabilities (bottom right of Figure 7), excluding FLOOD, escalate to very high levels (red boxes) due to warming, a common driver across all vulnerabilities.
The simulator is a versatile tool for modeling combinations of global and local variables, assessing their impacts on climate risk, and evaluating potential mitigation measures. To support decision-making, the system integrates combined maps displaying key parameters. Figure 8 exemplifies this capability, overlaying maps of population density, poverty distribution, cyclone threats, and flood vulnerabilities based on the simulated scenario’s requirements.

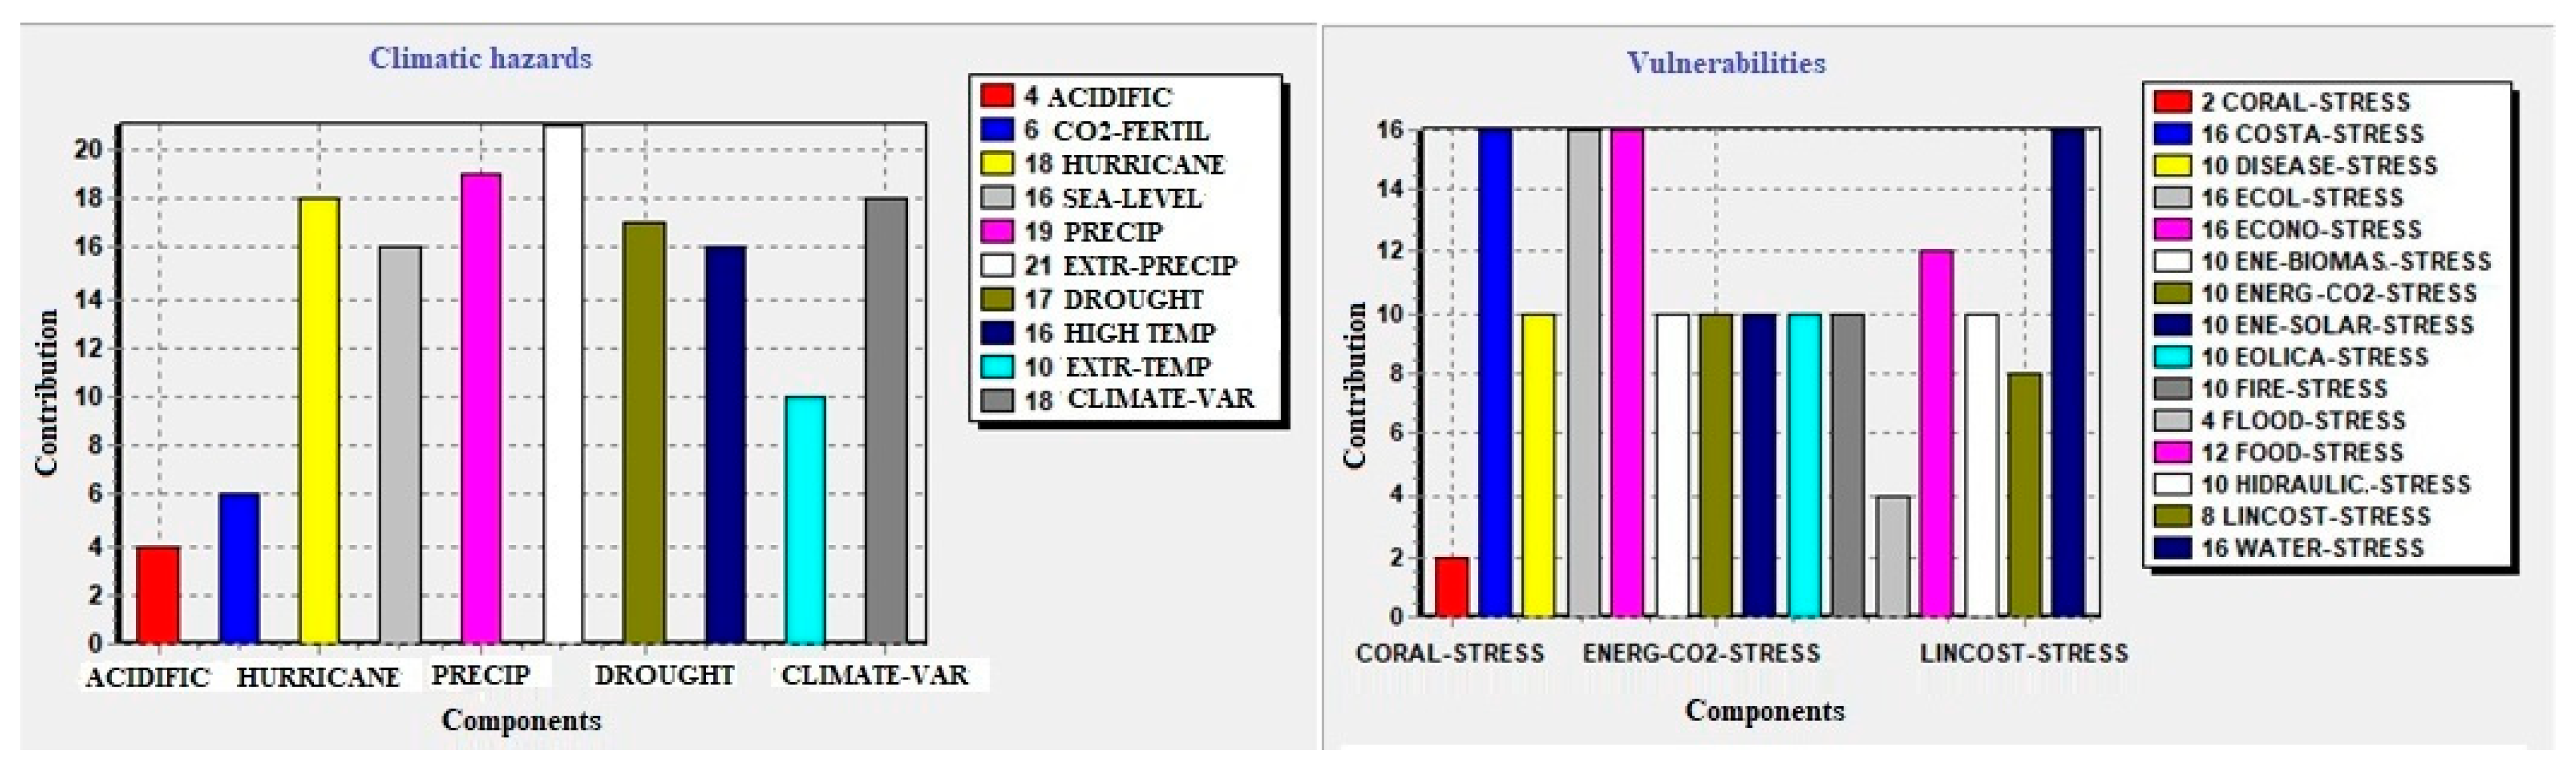
3.2. Study on the Model’s Level of Interrelation

The regional scenario enables analysis of the model’s interrelation levels. By applying the importance formula outlined in the methodology, the results are presented in Figure 9.
Among the modeled climate hazards, extreme precipitation, hurricanes, and precipitation exhibit the highest interrelation and weight. For vulnerabilities, coastal zones, water resources, economy, and ecology are the most significant. This analysis for the Dominican Republic highlights priority areas for disaster risk management and climate change adaptation, focusing on specific hazards and vulnerabilities.

3.3. Simulation at the Local Scale

3.3.1. Flood Disaster Management in Greater Santo Domingo

In the Dominican Republic, the simulator has proven effective for specific scenarios in Greater Santo Domingo, particularly for flood disaster management. It has been applied to flood-prone zones across several municipalities, including informal settlements such as La Yuca, La 800ta, and Capotillo (National District), Los Mina and Los Tres Brazos (Santo Domingo Este), Los Coordinadores and Villa Mella (Santo Domingo Norte), and Pueblo Chico and Juan Guzmán (Santo Domingo Este). A graphical output of the simulator for Greater Santo Domingo is presented in Figure 10.
Historical data informed the model’s inputs. Rainfall is classified as Very Likely, while flood vulnerabilities are rated medium, reflecting effective adaptation measures (e.g., sewerage improvements in several areas). This hazard–vulnerability combination results in high risk levels across the evaluated areas. Notably, interlinked vulnerabilities impact the economy, food security, diseases, and water resources. Increasing the database’s resolution enables more detailed matrices and localized results, potentially requiring higher-resolution maps.

3.3.2. Flood Disaster Management in Infrastructure Networks

At the local level, the simulator models infrastructure networks for flood disaster management. Current capabilities rely on field-collected data and information from network operators. However, there is limited practice among entities in the Dominican Republic for gathering such data. The lack of detailed satellite map data further constrains local-scale modeling.
An example of the simulator’s capacity to manage flood risks in infrastructure networks is shown in Figure 11.
The simulation models a hypothetical sector of the Dominican Republic’s electricity grid, incorporating critical infrastructure: an airport (AER-1), a seaport (MAR-1), a liquefied fuel gas station (EGLP-1), and a petrol station (EGASO-1). The grid was modeled to account for internal failures, reserve capacities among interconnected power sources, and climatic impacts from heavy precipitation and hurricanes.
Heavy precipitation, rated Very Likely during the rainy season, combined with high flood vulnerability in low-lying areas, results in high risk for the infrastructure network, determined by the highest-risk component. The airport (AER-1) incurs high risk due to flooding affecting its redundant power supplies (SE69-2 and SE69-3). The seaport (MAR-1) faces medium risk, as only one of its two power redundancies (SE69-1) is impacted, while its backup source (SE138-1) in a higher, flood-resistant area remains operational. The fuel stations (EGLP-1 and EGASO-1) exhibit very low risk, as their power supply (SE138-1) is unaffected. The simulator detects both direct hazard impacts and indirect effects through the infrastructure network, even when damage occurs remotely.

4. Discussion

4.1. Analysis of the Conceptual Apparatus

A primary challenge in integrating climate risk information lies in the heterogeneity of the conceptual frameworks employed for its assessment, which vary across different methodologies. Table 4 synthesizes the diverse approaches utilized to quantify climate risk.
GIZ [44] highlights persistent ambiguities and inconsistencies in the conceptualization of risk within the Fifth IPCC Assessment Report [1,2], which hinder its practical application. These challenges stem primarily from the limited understanding of the statistical probability of long-term climate change impacts on a global scale, introducing significant uncertainty into risk assessments. In contrast, the Fourth IPCC Assessment Report [1,2] defines risk parameters with greater statistical consistency, as it focuses on individual events and exposed entities. Numerous vulnerability studies have predominantly emphasized population sensitivity and national adaptive capacity to address these vulnerabilities [39,40], thereby underrepresenting other natural and socioeconomic systems affected by climate change, as addressed in both the Fourth and Fifth IPCC reports [1,2,42]. This lack of consensus underscores the need to systematically leverage accumulated knowledge on climate risk in the coming years.
Recent national communications on climate change increasingly incorporate climate risk assessments aligned with the conceptual refinements proposed in the Fifth IPCC Report. Key references [1,2,33,34,35,36,37,38,39] provide the simulator with parameter combinations that define risk, expressed as levels of vulnerability or risk directly.
Conceptual analysis reveals an absence of agreement on the definitions of risk-related terminology throughout its evolution. The conceptual framework most aligned with the simulator is that of the Chilean disaster risk reduction manual [30]. For the Boolean risk model proposed (see Equations (2) and (3)), the hazard term (probability of a physical event) is retained, while the vulnerability term encompasses exposure (presence of the target) and sensitivity (susceptibility to damage), with adaptive capacity integrated into the equation. Terms for warming and mitigation are explicitly included. Consistent with existing models, mitigation strategies are framed as long-term and global, whereas adaptation measures are localized and modeled on a smaller scale. This approach yields a formulation that integrates global (warming and mitigation) and local (hazards, vulnerabilities, and adaptations) risk dimensions, without relying on exhaustive local indicator quantification, which demands extensive and diverse data [1,2,44,45]. Nevertheless, residual and local impact risk data derived from these sources are critical inputs for the simulator.

4.2. Direct Modeling of Climate Risk Levels

The literature review indicates that directly modeling climate risk levels using a Boolean approach represents an innovative departure from existing systems [4,6,7], which typically assess climate risk indirectly. Matrix-based modeling approaches that estimate risk or vulnerability levels lack computational tools to support their implementation [1,2,42,44].
The multirisk or multihazard concept is fundamental to the simulator’s design. Its databases, developed from extensive consultations [1,2,33,34,35,36,37,38,39,40], systematically organize combinations of hazards and vulnerabilities, their interrelationships, and their associations with various impacts. Similar approaches are noted in works by Gallina et al. and Tiepolo et al., with Gallina employing comparable Boolean methodologies [48,49].

4.3. Relationship Between Information Volume and Model Objectivity

The interrelationships among the model’s multiple variables mirror the synergies documented in the consulted references [1,2,33,34,35,36,37,38,39,40]. The volume of information processed significantly influences model quality, as it enhances the interconnectivity of components. The derived importance values suggest that comprehensive models, with robust interconnections, are critical for effective decision-making in climate risk management, ensuring the optimal impact of interventions.
To develop increasingly comprehensive climate models, integrating broad expert knowledge is essential. Employing artificial intelligence tools, particularly those based on natural language processing [50], is recommended for synthesizing extensive information. The methodological framework developed facilitates the incorporation of such capabilities, enabling scalable climate modeling (global, regional, or local). While this research marks initial progress, the continued advancement of computational analysis tools will be pivotal for achieving highly objective models.

4.4. Relationship Between Physical Modeling and Climate Simulation

Climate projections rely on sophisticated computational programs supported by high-performance computing clusters. These models typically apply physical laws to represent incorporated variables. For instance, three-dimensional ocean–atmosphere models, such as those developed with PRECIS [7], simulate temperature under various emission scenarios, both globally and regionally [11].
As an example, to model a high greenhouse gas emission scenario (radiative force of 8.5 W/m2), a global warming increase of 4 °C (DEGREE-4 °C) is projected, likely resulting in severe droughts and sea level rise (DROUGHT and SEA LEVEL). These conditions, represented as simulator inputs, are illustrated in Figure 12.
Global climate risk is projected to reach a critical level, driven by consistently high risk across nearly all regions (see red boxes indicating each region on the map). Under these conditions, all identified vulnerabilities reach an evident level (brown box in the map area), reflecting their interdependence with the near-certain progression of global warming (see boxes on the map and the legend in the bottom right).
Research on clean energy development is exemplified by studies on primary energy source combinations in China, where renewable energy sources (RESs) predominate [51]. Additional clean development strategies emphasize improvements in energy efficiency [52]. These proposed clean mechanisms can be generically integrated into the simulator.
Climate risk studies employing physical modeling alongside probabilistic parameters are documented in works by several authors [53,54,55]. These studies utilize parameters analogous to those required for the simulator, combining outcomes from probabilistic and deterministic models with historical hazard data.

4.5. Comparison with Other Simulators

A comparative analysis of coastal flooding scenarios, driven by sea level rise and storm surge, was conducted for the Dominican Republic. In the ASER simulator, the inputs included the hazards SEA LEVEL rise and HURRICANE, with vulnerabilities linked to COASTS and COASTLINE, under a temperature increase of 2 °C. These conditions were replicated using similar inputs in the EN-ROADS simulator [6]. The comparative results, illustrated in Figure 13, demonstrate consistency between both simulators regarding predicted coastal flooding levels in the Dominican Republic. Unlike EN-ROADS, the ASER simulator provides graphical map representations for all simulations. However, the ASER simulator does not encompass analyses of economic growth, detailed energy policy development, reforestation, or other factors included in EN-ROADS.

4.6. Simulation with Real-Time Interactive Maps

The optimal approach for studying climate change and its associated hazards would involve real-time interactive maps, complemented by detailed predictive models for risk assessment. However, technical constraints and resource limitations have impeded such efforts in several countries, notably the absence of digital climate risk maps in Cuba and the Dominican Republic [56]. In the absence of advanced mapping capabilities, less sophisticated tools that leverage available models, forecasts, and real-time published studies are recommended to address these risks. Such data can serve as critical inputs for the simulator. High-resolution maps would enhance simulation accuracy, enabling the precise assessment of local impacts currently evaluated with lower precision.
Modeling infrastructure networks using satellite maps [8,9,10,11,12] poses significant challenges due to the unavailability of satellite imagery for regions like the Dominican Republic. As an alternative, the detailed modeling of networks and their interdependencies has been achieved through coded links and redundancy analysis, focusing primarily on network failures. The capabilities developed for local scales, as detailed in Section 3.3.2, demonstrate how interactions between climatic events and infrastructure networks can be modeled within the simulator’s current constraints. These capabilities align with those reported in other studies [8,9,10,11,12], though they fall short of the potential offered by layered satellite data. The capabilities of the simulator, from the point of view of fault propagation, are similar to those achieved in PSAs [32]. Notably, this approach addresses only physical or functional impacts (failure or degradation) on infrastructure networks, excluding economic impact modeling.

4.7. Considerations of Uncertainties

The distributions of residual and potential impacts, particularly in global scenarios, have been explicitly derived from IPCC expert consensus on estimated risk levels under optimistic and pessimistic adaptive capacity conditions [1,2]. For regional scenarios, risk distributions are approximated based on extensive literature reviews [33,34,35,36,37,38,39], analogies with documented behaviors [1,2], and adjustments tailored to specific study contexts (e.g., comparing vulnerabilities across global and regional scenarios).
The spatial distribution of impacts, drawn from IPCC reports [1,2], underpins the simulator’s ability to capture the gradation of residual and potential impacts across global regions, addressing the challenges noted by GIZ [44]. Incorporating Na-Tech events remains a challenge due to the absence of fragility curves [13,14]. This limitation is mitigated by adopting specialized methodologies and simplified fragility evaluation criteria based on hazard intensity, as proposed by Koks and Pant et al. [9].
The simulator’s databases require periodic updates to align with the latest publications and models, including updates to IPCC reports, their interactive atlas, and recent global surface synoptic map models [1,2,57,58]. The interpretation of simulator outputs should acknowledge their preliminary nature, treating results as focal points for further analysis. Decision-making in disaster risk management and climate change adaptation should involve expert consultation and, where necessary, supplementary data.

5. Capabilities and Limitations of the Simulator Summary

5.1. Capabilities

The simulator enables the identification and quantification of key risk contributors using a matrix-based methodology, critical for prioritizing high-impact risk management strategies (aligned with Pareto principles). It supports a dual risk assessment approach: one addressing climate risk tied to global warming levels and another focused on disaster management for extreme weather events. The climate risk module leverages IPCC projections and national communications, while the disaster management module integrates hazard, vulnerability, and adaptation data using complementary methodologies embedded in the tool.
The simulator operates across multiple scales: global (representing climate risks by geographic regions), regional (categorizing risks by impact types), and local (detailing risks in cities or smaller areas). In higher-resolution local models, it incorporates infrastructure networks, their interdependencies, and Na-Tech event scenarios.
System scalability depends on designing region- or locality-specific matrices (global matrices are universally applicable), enabling tailored applications in new contexts. Analysts, with appropriate training, can develop these matrices and graphical outputs. The Dominican Republic case study illustrates this process, which can be replicated for other regions, extending the tool’s applicability. A key feature is its adaptation to the technological constraints of the Dominican Republic, where limited satellite data and institutional data collection capacity restrict simulator inputs.

5.2. Limitations

The current configuration of the climate risk simulator presents the following limitations:
-
Input–output interfaces are designed for expert users, requiring specialized training for result interpretation. Generalizing its use to broader audiences is not advisable at this stage.
-
The system operates on standalone computer stations (ASER is installed on-site or remotely), necessitating careful database and reference map updates for each station.
-
Current databases at regional and local scales combine manually curated data from extensive literature [33,34,35,36,37,38,39,40] with AI-assisted validation. While cross-referencing confirms consistency for regional models (Dominican Republic, Cuba, Honduras), uncertainties arise when extrapolating data across scales (global to regional, regional to local), potentially introducing inaccuracies as resolution increases. These issues highlight areas for future database improvements, particularly regarding sample size, biases, and external validity.
-
The lack of layered satellite maps at local and regional scales and inadequate information from infrastructure managers can affect the quality of the relevant databases, including the consideration of the interdependent infrastructure systems [8,9,10,11,12].
AI integration is limited to database updates. While AI-based climate risk forecasting systems exist [59,60], they do not cover the Dominican Republic, which is developing its own AI-driven simulator.

6. Conclusions

This study presents a robust climate risk modeling framework for the Dominican Republic using a multivariate simulator. Built on systemic approaches and Boolean logic, the simulator enhances climate risk representation by integrating hazard, vulnerability, and exposure factors across diverse scenarios.
The tool effectively identifies key risk contributors, highlighting the exacerbating effects of inadequate mitigation strategies and reliance on fossil fuels, which amplify global temperature rise and its associated impacts. Analysis of infrastructure interdependencies reveals how fragile infrastructure in the Dominican Republic propagates risks across critical sectors, including water supply, transportation, energy, and human settlements. Region-specific impact analyses provide actionable insights for risk management and targeted adaptation and mitigation strategies. Comparisons with established models like EN-ROADS and PRECIS confirm the simulator’s consistency and validity, underscoring its potential for climate policy development and strategic planning. With trained administrators designing analytical and graphical databases, the simulator’s applications can extend to other regions.
Further improvements are needed, including enhanced spatial and temporal resolution, real-time data integration, and refined modeling of infrastructure interdependencies. This research significantly advances climate risk analysis in the Dominican Republic, offering a sophisticated decision-making tool for adaptation and mitigation. Its implementation can bolster resilience to extreme climate events and support evidence-based policy formulation. The simulator lays the groundwork for ongoing efforts to develop an AI-based climate risk forecasting and disaster management tool.

Author Contributions

Conceptualization, A.T.V. and U.J.H.; methodology, A.T.V. and U.J.H.; software, A.T.V.; validation, A.T.V., J.C.S.R., Y.E.A.R. and U.J.H.; formal analysis, ATR, J.C.S.R. and Y.E.A.R.; investigation, A.T.V., J.C.S.R., Y.E.A.R. and U.J.H.; resources, A.T.V. and U.J.H.; data curation, A.T.V., J.C.S.R. and Y.E.A.R.; writing—original draft preparation, A.T.V. and U.J.H.; writing—review and editing, A.T.V., J.C.S.R., Y.E.A.R. and U.J.H.; visualization, A.T.V., J.C.S.R. and Y.E.A.R.; supervision, A.T.V. and U.J.H.; project administration, A.T.V. and U.J.H.; funding acquisition, U.J.H. All authors have read and agreed to the published version of the manuscript.

Funding

This research received funds from the Fellowship Programmer of Coalition for Disaster Resilient Infrastructure (CDRI; 2401282227) and from the Fondo Dominicano de Ciencia y Tecnología (FONDOCYT; 2024-2-3D16-0839). The Ministry of Higher Education, Science and Technology of the Dominican Republic (MESCyT) provided the Ph.D. fellowship for J.S.R and Y.A.R.

Institutional Review Board Statement

Not applicable.

Informed Consent Statement

Not applicable.

Data Availability Statement

Data are available upon request.

Acknowledgments

This work was conducted as part of INTEC’s Doctorate program on Environmental Sciences.

Conflicts of Interest

The authors declare no conflicts of interest.

Abbreviations

The following abbreviations are used in this manuscript:
PSAProbabilistic safety analysis
CCClimatic change
ASERSimulator for risk-based sustainability studies
IPCCIntergovernmental Panel on Climate Change
GHGGreenhouse gas
CO2Carbon dioxide
EN-ROADSSimulator of CC developed by the Massachusetts Institute of Technology
RESRenewable sources
PRECISProviding Regional Climates for Impacts Studies
HadCM3, ECHAM4GHG emission-removal scenarios using by PRECIS
AFRICA, ASIA, AUSTRALASIA, NORTH AMERICA, CENTRAL-SOUTH AMERICA, SMALL ISLANDS, POLAR REGIONS and OCEANSCodes to identify the region of the world
WATER RESOURCES, COASTAL ZONES, BIOLOGICAL DIVERSITY, FORESTS, AGRICULTURE, HUMAN SETTLEMENTS-LAND USE, HUMAN HEALTH, TOURISM, ENERGYCodes to identify the regional impacts
DROUGHT, TEMP-EXTREM, PRECIP, SEA-LEVEL, FER-TIL-CO2, TEMP, PRECIP-EXTREM, HURRICANE, ACIDIFICATIONCodes to identify the hazards
COSTA-STRESS, FLOOD-STRESS, WATER-STRESS, RATE-STRESS, DISEASE-STRESS, FIRE-STRESS, ECOL-STRESS, FOOD-STRESS, ECONO-STRESS, CORAL-STRESSCodes to identify the vulnerabilities. The identification of adaptive actions modifies the STRESS code by the MANAGE code
DEGREE-PRES, DEGREE-MED, DEGREE-2 °C, DEGREE-4 °CLevels of global warming
WFWeight factor
Na-TechTechnological Accidents due to Natural phenomena

References

  1. IPCC. Climate Change 2014: Synthesis Report. Contribution of Working Groups I, II and III to the Fifth Assessment Report of the Intergovernmental Panel on Climate Change; Core Writing Team, Pachauri, R.K., Meyer, L.A., Eds.; IPCC: Geneva, Switzerland, 2014; p. 151. [Google Scholar]
  2. IPCC. Climate Change 2023: Synthesis Report. Contribution of Working Groups I, II and III to the Sixth Assessment Report of the Intergovernmental Panel on Climate Change; Core Writing Team, Lee, H., Romero, J., Eds.; IPCC: Geneva, Switzerland, 2023; p. 184. [Google Scholar] [CrossRef]
  3. Miettinen, J. Nuclear Power Plant Simulators: Goals and Evolution. 2008, pp. 107–133. Available online: https://inis.iaea.org/records/3r401-t4h42 (accessed on 13 January 2025).
  4. National Geographic. The Climate Bathtub. Available online: https://www.ngenespanol.com/fotografia/banera-climatica/ (accessed on 13 January 2025).
  5. Nguyen, T.; Brandstatter, J.; Kapoor, A.; Gupta, J.K.; Grover, A. ClimaX: A Foundation Model for Weather and Climate. 2023. Available online: https://proceedings.mlr.press/v202/nguyen23a/nguyen23a.pdf (accessed on 13 January 2025).
  6. Massachusetts Institute of Technology (MIT). The En-ROADS Climate Solutions Simulator. Available online: https://www.climateinteractive.org/en-roads/ (accessed on 13 January 2025).
  7. Met Office. PRECIS: A Regional Climate Modelling System. Available online: https://www.metoffice.gov.uk/research/applied/international/precis (accessed on 13 January 2025).
  8. Chao, Z.; Kong, J.; Simonovic, S. Modeling joint restoration strategies for interdependent infrastructure systems. PLoS ONE 2013, 13, e0195727. [Google Scholar] [CrossRef]
  9. Koks, E.; Pant, R.; Thacker, C.; Hall, J.W. Understanding Business Disruption and Economic Losses Due to Electricity Failures and Flooding. Int. J. Disaster Risk Sci. 2019, 10, 421–438. [Google Scholar] [CrossRef]
  10. Nguyen, D.N.; Usuda, Y.; Imamura, F. Gaps in and Opportunities for Disaster Risk Reduction in Urban Areas through International Standardization of Smart Community Infrastructure. Sustainability 2024, 16, 9586. [Google Scholar] [CrossRef]
  11. Koks, E.; Pant, R.; Husby, T.; Többen, J.; Osterhaven, J. Multiregional Disaster Impact Models: Recent Advances and Comparison of Outcomes; Advances in Spatial and Economic Modeling of Disaster Impacts; Springer: Cham, Switzerland, 2019. [Google Scholar] [CrossRef]
  12. Cardona, O.; Bernal, G.; Villegas, C.; Molina, J.; Herrera, S.; Marulanda, M.; Rincón, D.; Grajales, S.; Marulanda, P.; González, D.; et al. Multi-Hazard Disaster Risk Model of Infrastructure and Buildings at the Global Level; Background Report; INGENIAR: Risk Intelligence for the CDRI Flagship Report: Bogotá, Colombia, 2023. [Google Scholar]
  13. Jiang, X.; Mori, N.; Tatano, H.; Yang, L. Simulation-based exceedance probability curves to assess the economic impact of storm surge inundations due to climate change: A case study in Ise Bay, Japan. Sustainability 2019, 11, 1090. [Google Scholar] [CrossRef]
  14. Valente, M.; Ricci, F.; Cozzani, V. A systematic review of Resilience Engineering applications to Natech accidents in the chemical and process industry. Reliab. Eng. Syst. Saf. 2025, 255, 110670. [Google Scholar] [CrossRef]
  15. National Investment System, Ministry of Social Development and Family, Government of Chile. Manual of Scales for the Estimation of the Disaster Risk Index of Threat by Forest Fires. 2022. Available online: https://sni.gob.cl/storage/docs/Manual_de_escalas_IRD_amenaza_por_Incendios_Forestales_-sep_2022.pdf (accessed on 17 January 2025).
  16. National Investment System, Ministry of Social Development and Family, Government of Chile. Manual of Scales for the Estimation of the Disaster Risk Index of Hazard by Mass Removal by Flows. 2022. Available online: https://sni.gob.cl/storage/docs/Manual_de_escalas_IRD_amenaza_por_Remocion_en_masa_-sep2022.pdf (accessed on 17 January 2025).
  17. National Investment System, Ministry of Social Development and Family, Government of Chile. Manual of Scales for the Estimation of the Tsunami Hazard Disaster Risk Index. 2022. Available online: https://sni.gob.cl/storage/docs/Manual_de_escalas_IRD_amenaza_por_Tsunami_-sep2022.pdf (accessed on 17 January 2025).
  18. Nutrition Institute of Central America and Panamá. Distance Learning Diploma in Food and Nutritional Security, Unit 1 to 4; INCAP Publication MDE-154. 2024. Available online: https://es.scribd.com/document/128396579/Unidad-1-Diplomado-SAN-1 (accessed on 17 January 2025).
  19. Official Journal of the Generalitat Valenciana. Annex III—Methodology for Fire Risk Analysis; No. 8181/30.11.2017. 2017. Available online: https://mediambient.gva.es/documents/162905929/165019001/Anexo III/2dd4d462-b17e-4163-a6ae-21d3210cdf76 (accessed on 17 January 2025).
  20. Infante, F.; Forteza, S.; Ramos, O.; Fernández, J. Analysis of the Factors of Territorial Economic Vulnerability with a Neutrosophic Approach. Econ. Bus. 2024, 15, 137–150. [Google Scholar]
  21. Miyamoto International, Inc. Propuesta Plan de Reducción de Riesgos de Desastres Portoviejo, USAID/BHA EBRP II 72OFDA19GR00224. 2021. Available online: https://es.readkong.com/page/propuesta-plan-de-reducci-n-de-riesgos-de-desastres-8702775 (accessed on 17 January 2025).
  22. AEMET. Table of Thermal Sensation Values for Cold and Heat; Spanish Government. 2024. Available online: https://www.aemet.es/es/conocermas/montana/detalles/sensaciontermica (accessed on 17 January 2025).
  23. Valderrábano, M.; Nelson, C.; Nicholson, E.; Etter, A.; Carwardine, J.; Hallett, J.; McBreen, J.; Botts, E. Using Ecosystem Risk Assessment Science in Ecosystem Restoration: A Guide to Applying the Red List of Ecosystems to Ecosystem Restoration; IUCN: Gland, Switzerland, 2021. [Google Scholar] [CrossRef]
  24. United Nations Convention Framework on Climatic Change. Human health. In GCE Training Materials: Vulnerability and Adaptation Assessment. 2024. Available online: https://unfccc.int/sites/default/files/resource/Chapter_2_updated_2021.pdf (accessed on 17 January 2025).
  25. CCA. Rapid Vulnerability Assessment Tool for North American Marine Protected Areas; Commission for Environmental Cooperation: Montreal, QC, Canada, 2017; p. 32. Available online: https://cec.org/files/documents/publications/11739-north-american-marine-protected-area-rapid-vulnerability-assessment-tool-en.pdf (accessed on 17 January 2025).
  26. CONANP–CEGAM-WWF-Carlos Slim Foundation Alliance. Tool for Rapid Diagnosis of Vulnerability to Climate Change in Protected Natural Areas; Ministry of Environment and Natural Resources: Mexico City, Mexico, 2015; Available online: https://conanp.gob.mx/conanp/dominios/cambio_climatico/documentos/Herramienta-Vulnerabilidad-para-diagnostico-rapido.pdf (accessed on 17 January 2025).
  27. Giraldo Buitrago, L.C. Variación espacio-temporal de la calidad del agua del río Aburrá- Medellín a partir de la conductividad eléctrica y su uso como indicador de calidad. Revista EIA 2022, 19, 3805. [Google Scholar] [CrossRef]
  28. Ocean Carbon and Biogeochemistry Project. Ocean Acidification Whoi.Edu/OCB-OA, 20 Facts About Ocean Acidification. 2024. Available online: https://www.whoi.edu/fileserver.do?id=165564&pt=2&p=150429 (accessed on 17 January 2025).
  29. Centella-Artola, A.; Fonseca-Rivera, C.; González-García, I. New automated climate service for monitoring meteorological drought in Cuba. Cuba. J. Meteorol. 2023, 29, 4. [Google Scholar]
  30. National Investment System, Ministry of Social Development and Family, Government of Chile. Complementary Methodology for the Evaluation of Disaster Risk in Public Infrastructure Projects. 2022. Available online: https://sni.gob.cl/storage/docs/220311_Metodologia_RRD.pdf (accessed on 17 January 2025).
  31. Torky, M.; Gad, I.; Darwish, A.; Hassanien, A.E. Artificial Intelligence for Predicting Floods: A Climatic Change Phenomenon. In The Power of Data: Driving Climate Change with Data Science and Artificial Intelligence Innovations; Hassanien, A.E., Darwish, A., Eds.; Springer: Cham, Switzerland, 2018. [Google Scholar] [CrossRef]
  32. Alrammah, I. Application of probabilistic safety assessment (PSA) to the power reactor innovative small module (PRISM). Nucl. Eng. Technol. 2022, 54, 3324–3335. [Google Scholar] [CrossRef]
  33. Fernández Márquez, A.; Pérez de los Reyes, R. Evaluation of the Cuban Environment; GeoCuba: Havana, Cuba, 2014. [Google Scholar]
  34. Arrastía Ávila, M.A.; Limia Martínez, M.E. Energy and Climate Change; Editorial Academia: Havana, Cuba, 2011. [Google Scholar]
  35. INSMET. Third National Communication of the Republic of Cuba to the United Nations Framework Convention. 2020. Available online: https://unfccc.int/documents/266604 (accessed on 17 January 2025).
  36. Vega, R.; Guevara, A. Impact of Climate Change and Adaptation Measures in Cuba; Institute of Meteorology, Environmental Agency, Ministry of Science, Environment and Technology: Havana, Cuba, 2013; p. 430. ISBN 978-959-300-039-0. [Google Scholar]
  37. Martinó Soto, Y.J.; Franco, C.; Guerrero, S.; González de Gutiérrez, Z.; Reyna Alcántara, E.; Mermet, M.L.; Consejo Nacional para el Cambio Climático y Mecanismo de Desarrollo Limpio (CNCCMDL); Naciones Unidas para el Desarrollo (PNUD). Tercera comunicación nacional de República Dominicana para la convención marco de las Naciones Unidas sobre cambio climático. Santo Domingo: Ministerio de Medio Ambiente y Recursos Naturales (MIMARENA). República Dominicana. Ministerio de Medio Ambiente y Recursos Naturales. 2017. Available online: https://opacbiblioteca.unibe.edu.do/cgi-bin/koha/opac-detail.pl?biblionumber=48663 (accessed on 13 February 2025).
  38. National Autonomous University of Honduras (UHAH); Honduran Institute of Earth Sciences (IHCIT). Climatic and Risk Management Atlas of Honduras; Universidad Nacional Autónoma de Honduras: Tegucigalpa, Honduras, 2012. [Google Scholar] [CrossRef]
  39. Rivas, M.; Ismael, A. Contribution to the Study of Vulnerability to Climate Change in Mexico. Ph.D. Thesis, Universidad Nacional Autónoma de México, Mexico City, Mexico, 2012. Available online: https://repositorio.unam.mx/contenidos/ficha/contribucion-al-estudio-de-la-vulnerabilidad-al-cambio-climatico-en-mexico-77477 (accessed on 17 January 2025).
  40. Andean Development Corporation. Vulnerability and Adaptation to Climate Change Index in the Latin American and Caribbean Region. Available online: https://scioteca.caf.com/handle/123456789/517 (accessed on 17 January 2025).
  41. Chen, X.; Rong, F.; Li, S. Driving Force–Pressure–State–Impact–Response-Based Evaluation of Rural Human Settlements’ Resilience and Their Influencing Factors: Evidence from Guangdong, China. Sustainability 2024, 16, 813. [Google Scholar] [CrossRef]
  42. IPCC. Report of Working Group II-Impact, Adaptation and Vulnerability, 4th Report. 2007. Available online: https://archive.ipcc.ch/publications_and_data/ar4/wg2/es/tssts-5-3.html (accessed on 17 January 2025).
  43. Orúe Valdés, S.; Camejo Ginebra, J. Technological hazard, vulnerability and risk studies for the management of hazardous chemical substances: Their role in disaster risk management. Cub@: Environment and Development. Electron. J. Environ. Agency 2018, 18, 35. [Google Scholar]
  44. Federal Ministry for Economic Cooperation and Development. The Vulnerability Book Concept and Guidelines for Standardized Vulnerability Assessment; GIZ: Adelphi, MD, USA, 2017; EURAC. [Google Scholar]
  45. Quiñones-Bustos, C.; Bull, M.T.; Oyarzo-Vera, C. Seismic and Coastal Vulnerability Assessment Model for Buildings in Chile. Buildings 2021, 11, 107. [Google Scholar] [CrossRef]
  46. CIIFEN. Definition of Risk. Available online: https://ciifen.org/definicion-de-riesgo/ (accessed on 17 January 2025).
  47. Aznar-Crespo, P.; Aledo, A.; Ortiz, G.; Vallejos-Romero, A. Generative processes of social vulnerability to flood risk: A proposal for the strategic management of social impacts. Curr. Sociol. 2023, 72, 672–696. [Google Scholar] [CrossRef]
  48. Gallina, V.; Torresan, S.; Zabeo, A.; Critto, A.; Glade, T.; Marcomini, A. A multi-risk methodology for the assessment of climate change impacts in coastal zones. Sustainability 2020, 12, 3697. [Google Scholar] [CrossRef]
  49. Tiepolo, M.; Bacci, M.; Braccio, S.; Bechis, S. Multi-hazard risk assessment at community level integrating local and scientific knowledge in the Hodh Chargui, Mauritania. Sustainability 2019, 11, 5063. [Google Scholar] [CrossRef]
  50. Chen, X.; Xie, H.; Tao, X. Vision, status, and research topics of Natural Language Processing. Nat. Lang. Process. J. 2022, 1, 100001. [Google Scholar] [CrossRef]
  51. Liu, B.; Chen, J.; Wang, H.; Wang, Q. Renewable Energy and Material Supply Risks: A Predictive Analysis Based on AnLSTM Model. Front. Energy Res. 2020, 8, 163. [Google Scholar] [CrossRef]
  52. Kouloukoui, D.; De Oliveira Marinho, M.; Da Silva Gomes, S.; Kiperstok, A.; Torres, E.A. Corporate climate risk management and the implementation of climate projects by the world’s largest emitters. J. Clean. Prod. 2019, 238, 117935. [Google Scholar] [CrossRef]
  53. Yu, I.; Park, K.; Lee, E.H. Flood risk analysis by building use in urban planning for disaster risk reduction and climate change adaptation. Sustainability 2021, 13, 13006. [Google Scholar] [CrossRef]
  54. Salata, S.; Ronchi, S.; Giaimo, C.; Arcidiacono, A.; Pantaloni, G.G. Performance-based planning to reduce flooding vulnerability insights from the case of Turin (North-West Italy). Sustainability 2021, 13, 5697. [Google Scholar] [CrossRef]
  55. Tran, T.X.; Liu, S.; Ha, H.; Bui, Q.D.; Nguyen, L.Q.; Nguyen, D.Q.; Luu, C. A Spatial Landslide Risk Assessment Based on Hazard, Vulnerability, Exposure, and Adaptive Capacity. Sustainability 2024, 16, 9574. [Google Scholar] [CrossRef]
  56. Smithers, R.J.; Gardner, A.; Dworak, T. Assessing Climate Change Risks and Vulnerabilities (Climate Risk Assessment), A DIY Manual; Version 1; EU Mission on Adaptation to Climate Change; European Union: Brussels, Belgium, November 2023. [Google Scholar]
  57. Calderón, A.; Francisco, N.; López, R. Climate Change Vulnerability Index of the Republic of Panama. Available online: https://transparencia-climatica.miambiente.gob.pa/wp-content/uploads/2021/10/03-Indice-de-Vulnerabilidad-al-Cambio-Climatico (accessed on 17 January 2025).
  58. National Weather Service. National Oceanic and Atmospheric Administration. Available online: https://www.weather.gov/ (accessed on 17 January 2025).
  59. Alsumayt, A.; El-Haggar, N.; Amouri, L.; Alfawaer, Z.M.; Aljameel, S.S. Smart Flood Detection with AI and Blockchain Integration in Saudi Arabia Using Drones. Sensors 2023, 23, 5148. [Google Scholar] [CrossRef] [PubMed]
  60. Jones, A.; Kuehnert, J.; Fraccaro, P.; Meuriot, O.; Ishikawa, T.; Edwards, B.; Stoyanov, N.; Remy, S.L.; Weldemariam, K.; Assefa, S. AI for climate impacts: Applications in flood risk. npj Clim. Atmos. Sci. 2023, 6, 63. [Google Scholar] [CrossRef]
Figure 1. Algorithm of climate risk simulator ASER.
Sustainability 17 04638 g001
Figure 2. Systemic conceptual pattern of global risk.
Sustainability 17 04638 g002
Figure 3. Hazard vs. vulnerability matrix according to IPCC scales.
Sustainability 17 04638 g003
Figure 4. Example information from IPCC for the case of small islands.
Sustainability 17 04638 g004
Figure 5. Boolean representation of the risk outputs in the form of an event tree.
Sustainability 17 04638 g005
Figure 6. Link between information from the consulted references and the simulator database.
Sustainability 17 04638 g006
Figure 7. Comparative case of energy management in a regional scenario.
Sustainability 17 04638 g007
Figure 8. Geographic distribution of flood vulnerabilities and hurricane hazard probability for the Dominican Republic.
Sustainability 17 04638 g008
Figure 9. Level of importance of contributors to climate risk in the regional case.
Sustainability 17 04638 g009
Figure 10. Flood risk in Greater Santo Domingo.
Sustainability 17 04638 g010
Figure 11. Disaster management for infrastructure network affected by heavy rains and flooding.
Sustainability 17 04638 g011
Figure 12. Climate projection representation with global warming 4 °C.
Sustainability 17 04638 g012
Figure 13. Comparison of runs between ASER and EN-ROADS to simulate coastal flooding under similar starting conditions.
Sustainability 17 04638 g013
Table 1. Examples of analytical coding used in the climate risk matrix.
TermsCodes
Hazards:DROUGHT, TEMP-EXTREM, SEA-LEVEL, FERTIL-CO2, TEMP, HEAVY-PRECIP, PRECIP, HURRICANE, ACIDIFICATION
Vulnerabilities:COSTA-STRESS, FLOOD-STRESS, WATER-STRESS, RATE-STRESS, DISEASE-STRESS, FIRE-STRESS, ECOL-STRESS, FOOD-STRESS, ECONO-STRESS, CORAL-STRESS
Note: codes facilitate the identification of terms in matrices and maps.
Table 2. Equivalence risk level—weight factor.
Risk LevelAssigned Weight Factor (WF)Risk LevelAssigned Weight Factor (WF)
O6M3
VH5L2
H4VL1
Note: The risk levels are described in Figure 3.
Table 3. Equivalence between color—contributor classification.
Color Contributor Classification
Sustainability 17 04638 i001Hazard, Global, and Mitigation: PC—Practically Certain
Vulnerability, Adaptation Action, and Risk: O—Obvious
Sustainability 17 04638 i002Hazard, Global, and Mitigation: VL—Highly Likely Practically Certain
Vulnerability, Adaptation Action, and Risk: VH—Very High
Sustainability 17 04638 i003Hazard, Global and Mitigation: L—Likely
Vulnerability, Adaptation Action, and Risk: H—High
Sustainability 17 04638 i004Hazard, Global, and Mitigation: LU—As likely as Unlikely
Vulnerability, Adaptation Action, and Risk: M—Medium
Sustainability 17 04638 i005Hazard, Global, and Mitigation: U—Unlikely.
Vulnerability, Adaptation Action, and Risk: L—Low
Sustainability 17 04638 i006Hazard, Global, and Mitigation: VU—Very Unlikely.
Vulnerability, Adaptation Action, and Risk: VL—Very Low
Sustainability 17 04638 i007Hazard, Global, and Mitigation: EU—Extremely Unlikely
Vulnerability, Adaptation Action, and Risk: I—Insignificant
Table 4. Approaches for calculating climate risk.
Risk ApproachStarting Reference Source and Observation
Risk is a combination of hazards and vulnerabilitiesSource: Cuban Environmental Agency [43]. Hazards include the probability and severity with which they occur; vulnerabilities contain susceptibilities to said hazards of different types (structural, non-structural, functional, economic, ecological). The quantification system is based on hazard vs. vulnerability matrices. This method of risk study is known as HVR (Hazard, Vulnerability, and Risk).
System damage is a stress factor for the affected system stateSource: Federal Ministry for Economic Cooperation and Development [44]. This is a generic approach to risk, which has been the basis for the design of various approaches.
Risk is expressed as vulnerabilitySource: 4th IPCC report. Climate Science and Resilience Centre [42]. Vulnerability includes exposure (contains hazards), sensitivity, and adaptive capacity. Source: Vulnerability studies [40,42]. Vulnerability is the sum of the exposure (includes hazards) and sensitivity indices, subtracting from this sum the adaptive capacity. In some cases, vulnerabilities have been calculated for different future GHG emission scenarios [40]. This approach respects the considerations of disaster risk reduction [45].
Risk includes hazards, exposure, and vulnerabilitySource: 5th IPCC report [1,2,44,45]. Hazard: the potential for a physical or man-made event. Exposure: the presence of targets to be affected in the area of incidence. Vulnerability: the propensity or predisposition to be negatively affected (includes sensitivity and response capacity). Sensitivity: the degree to which a system or species is affected. Response capacity: the capacity of people, institutions, organizations, and systems to face, manage, and overcome adverse conditions.
Risk includes hazards, vulnerability, and resilience.Source: CIIFEN and Aznar-Aledo [46,47]. In these cases, the terms for calculating risk are multiplied by including hazard and vulnerability (incorporating exposure and sensitivity), all of which are then divided by resilience (response and adaptive capacity). With the response capacity executed, the residual impact is obtained. Considering the non-execution of adaptive capacity, the potential impact is obtained.
Risk includes hazards, vulnerability, and resilience failure.The manual designed in Chile for the calculation of the Disaster Reduction Index is the closest to the proposed approach for quantifying risk. It shows accentuated similarities when using the three terms of threat, vulnerability, and resilience. The final expression uses the intensity of the hazard, the manifestation of vulnerability, and the failure of resilience [30].
Disclaimer/Publisher’s Note: The statements, opinions and data contained in all publications are solely those of the individual author(s) and contributor(s) and not of MDPI and/or the editor(s). MDPI and/or the editor(s) disclaim responsibility for any injury to people or property resulting from any ideas, methods, instructions or products referred to in the content.

