Article

Worries About Air Pollution from the Unsustainable Use of Studded Tires and Cruise Ships—A Preliminary Study on the Relationship Between Worries and Health Complaints Due to Seasonal Pollution

by
Yvonne Höller
1,*,
Lada Zelinski
1,
Leon Daði Sesseljuson
1,
Ara Dan Pálmadóttir
1,
Asia Latini
1,2,
Audrey Matthews
3,
Ásta Margrét Ásmundsdóttir
4,
Lárus Steinþór Guðmundsson
5 and
Ragnar Pétur Ólafsson
6
1
Faculty of Psychology, University of Akureyri, 600 Akureyri, Iceland
2
Faculty of Psychology, University la Sapienza Rome, 00185 Rome, Italy
3
Faculty of Nursing, University of Akureyri, 600 Akureyri, Iceland
4
Faculty of Natural Resource Sciences, University of Akureyri, 600 Akureyri, Iceland
5
Faculty of Pharmaceutical Sciences, University of Iceland, 107 Reykjavík, Iceland
6
Faculty of Psychology, University of Iceland, 107 Reykjavík, Iceland
*
Author to whom correspondence should be addressed.
Sustainability 2025, 17(10), 4634; https://doi.org/10.3390/su17104634
Submission received: 15 March 2025 / Revised: 9 May 2025 / Accepted: 16 May 2025 / Published: 19 May 2025
(This article belongs to the Section Health, Well-Being and Sustainability)

Abstract

:
The relationship between ambient particulate matter (PM) and mental health conditions is well established. No study so far has investigated whether different sources of air pollution are associated with distinctive worries. We recruited n = 47 citizens living in an area with seasonal air pollution from studded tires (winter) and cruise ships (summer). We asked about seasonal well-being, symptoms of insomnia, migraine, and eco-anxiety, as well as worries about air pollution. Participants were more worried about air pollution from cruise ships as compared to studded tires (p = 0.013), which stands in contrast to PM caused by studded tires being more severe. There were significant correlations between worries about outdoor air pollution and insomnia symptoms (p = 0.003), worries about indoor air pollution and migraine symptoms (p < 0.001), worries about air pollution from studded tires and eco-anxiety (p = 0.001), and worries about air pollution from cruise ships and symptoms of migraine (p = 0.001). The low participation rate limits generalizability but is a result by itself because of the highly controversial topic of studded tires. We hypothesize that participation in studies set out to demonstrate negative effects of particulate matter needs to be strategically planned when the overall opinion of the population to be studied is positive towards the source of the hazardous pollution. Additionally, we hypothesize that the contribution of air pollution from different sources receives a varying degree of attention from the population. Further research into the relation between attitudes towards the unsustainable use of studded tires and perceived vs. real air pollution might help to design effective campaigns to influence decision-making.

1. Introduction

About 4.2 million deaths in 2015, or 7.6% globally, could be attributed to ambient air pollution alone, making ambient particulate matter the overall fifth-ranking mortality risk factor [1]. Deaths due to ambient air pollution increased from 2015 to 6.7 million in 2019 because of an increase in air pollution and an increase in non-communicable diseases [2]. Particulate matter consists of a mixture of solid and liquid particles in the air (e.g., dust, smoke, dirt) with chemical constituents including sulfate, nitrate, ammonium, organic carbon, silicon, and sodium ion, among others [3,4]. While the coarse fraction includes particles with a diameter of 10 μm or less (PM10), the particularly health-damaging fine fraction includes particles smaller than 2.5 μm (PM2.5) [5]. Particulate matter was shown to increase the risk for lung cancer independently of smoking [6]. The increased risk for respiratory conditions, including allergies, asthmatic attacks, lung cancer, and chronic obstructive pulmonary disease, due to air pollution [7,8] is only the tip of the iceberg. Migraine attacks [9], middle ear infections [10], and cardiovascular diseases [11,12] were associated with particulate matter. Contributions to the most common neurological disorders, such as stroke [13], Alzheimer’s disease, and Parkinson’s disease, have been documented [14,15]. In addition, there is growing evidence for a relationship between air pollution and poor mental health [16], including increased risk for attention deficit hyperactivity disorder [17,18], depression [19,20], anxiety [17,20,21], and—although debatable—suicide risk [20,22,23,24]. Notably, impacts of particulate matter on sleep include shortened sleep duration [25,26], increased sleep disturbance among children [27], and increased insomnia symptoms after long-term exposure [28]. Implications for sleep are of special importance since disordered sleep is a mediator for many other negative health effects, including migraine [29], anxiety [30], and depression [31,32,33].
Microglia inflammation in the brain was shown to be caused by traffic-related particulate matter [34]. Neuroinflammation is the most likely candidate for mediating the relation between particulate matter and poor mental health [14].
In addition to direct mental health effects, worries about air pollution play a role. Worries about negative impacts on the immediate environment and health have been documented in local communities that are exposed to human activity that leads to ecological consequences on biodiversity, habitat destruction, water, and air quality [35]. Worries about air pollution are more common among people living in metropolitan counties [36]. Within this context, it is of note that eco-anxiety, usually defined as worry in view of global climate change, was associated with a multitude of mental health factors such as depression, anxiety, post-traumatic stress disorder, stress, and insomnia [37].
Air pollution was found to impact voting behavior, suggesting that worries due to poor air quality govern decision-making in the population [38]. This is interesting since the general population has more control over some sources of air pollution than over others. Whereas air pollution due to natural sources such as dust from erosion or volcanoes is almost inevitable, human-made sources due to different forms of vehicle emission are at least to a certain extent preventable. Two major examples of avoidable contributors to air pollution are maritime transport and the use of studded tires. Maritime transport, and in particular cruise ship traffic, is one of the leading sources of air pollutants in port cities and towns [39]. While cruise ships emit different types of pollutants (e.g., discharge of organic and hazardous waste), their main air pollutants consist of particulate matter as well as nitrogen oxide (NO2) and sulphur dioxide (SO2) [39]. The fact that air quality is negatively impacted by emissions from heavy cruise ship traffic has been emphasized through case studies conducted in port cities located within different parts of the world, including, for example, Croatia [39], Canada [40], and Norway [41]. While port cities are exposed to cruise ships’ environmental impact, the local population is not directly involved in the decision-making on the number of cruise ships arriving. Cruise ship tourism is not only impacting local air quality but also contributing to climate change on a global level due to the unsustainable nature of this CO2-intensive transportation [42]. In contrast to the low level of control over cruise ship tourism, a major contributing source of local air pollutants is caused by the individual decision of citizens to use studded tires [43]. Studded tires are thought to provide an additional level of grip by increasing the friction between the tires and the ice-covered road; however, in dry and wet conditions where their use is redundant, road abrasion and tire wear result in unnecessary particulate matter release. More concretely, within a study that examined a Scandinavian studded passenger car from a life cycle perspective, it was noted that the main reason in favor of studded tires (i.e., the prevention of road accidents) was largely outweighed by the negative human health impacts, such as particulate matter emission [44]. Concretely, the study found that studded tires saved between 60 and 770 life-years in Sweden, while 570 to 2200 life-years are lost due to air pollution.
While both cruise ship traffic and studded tire use are contributors to air pollution, they rarely occur within the same location, making a comparison of their effects challenging. Moreover, to our knowledge, there has been no study that examined health factors and health risk perceptions in relation to these different human-made sources of air pollution. Akureyri, a small town in the north of Iceland, offers ideal conditions to fill this research gap [45]. Increasing cruise ship arrivals in the summer months [46] and the use of studded tires past the winter months are common in Akureyri. In this town, according to the measurements of the environmental agency [47], the annual average of PM10 in 2022 was 26.3 μg/m3, but in the time period from the first of October to the sixth of December, it was 71.3 μg/m3. More specifically, the health limit of a 24 h average of 45 μg/m3 was exceeded on 21 days in the year 2022, and the 24 h average was larger than 10 μg/m3 on 155 days in the same year. In contrast with the media attention and the concerns of the local population, current measurement settings by the environmental agency do suggest higher pollution during the studded tire season as compared to the cruise-ship season (see Figure 1) [47].
Nevertheless, cruise ships are important pollutants, and the arrival of 269 cruise ships (250,000 passengers) [48] with most of them arriving between May and September [49] to the small town of Akureyri (about 20,000 inhabitants) is very likely to have an impact on the local ecosystem.
Recent research suggests that a lack of individual precautions on minimizing exposure to air pollution for vulnerable groups such as cancer survivors might be due to little knowledge about the negative impacts [50]. In the context of the health belief model, it was found that worries, perceived threat, and intention to take precautions against negative health effects from air pollution are interrelated [51]. Worry about air pollution is an important factor in behavior change with respect to personal safety precautions [52]. Thus, worries about air quality are not only negative but might benefit the affected individual.
However, it is less researched whether worries about air pollution depend on the source of air pollution. This is an important aspect, as worries might impact not only protective behavior [51,52] but also political decision-making [38]. In Iceland, media reports about air pollution due to cruise ships and studded tires receive a varying response. While a ban on studded tires would come with more advantages than disadvantages [44], it is not within reach because of a lack of political will to improve public health at the expected cost of election votes. Moreover, both types of air pollution are seasonal, which might lead to seasonal symptoms and worries, hence only seasonal disposition to change behavior.
To successfully prevent air pollution, worries about different sources of air pollution must be investigated systematically with respect to their relation to various health symptoms. Increased recognition and awareness of the relationship between air pollution from specific sources and health risks may support the public discussion towards realistic perceptions of the problem, guide political decision-making, and therefore, eventually reduce not only the cost of physical [53] but also mental health.
To examine the relation between worries about air pollution from cruise ships and studded tires and mental health, we performed a survey among the inhabitants of Akureyri, which offers the unique option to assess both sources of pollution. We examined (i) eco-anxiety, (ii) symptoms of insomnia, (iii) seasonality, with an emphasis on seasonal symptoms of depression, and (iv) migraine. We selected these four domains because they are related to air pollution, and they are also closely interrelated. By investigating seasonal well-being, we took into account the seasonal occurrence of the sources of air pollution, where cruise ships and studded tires impact air quality at mostly disjoint times of the year.

2. Materials and Methods

2.1. Data Collection

The original aim of the SAD air study (website: https://www.unak.is/english/research/research-projects/sad-air-rannsoknaverkefni, accessed on 14 March 2025) was to recruit a cohort of at least n = 150 participants (18–75 years) who lived in the harbor district in Akureyri, known as Oddeyrin, where a total of about 1200 people live. A control group of n = 150 (18–75 years) should have been recruited from Giljahverfi, with about 2000 inhabitants. Compared to Oddeyrin, the air pollution in Giljahverfi was expected to be lower because of the distance to the port and lower number of busy streets. Giljahverfi is located slightly above the town, while the port district Oddeyrin is also close to the industrial area of the town and is, therefore, also exposed to heavier traffic. Moreover, the ring road passes through Oddeyrin. Recruitment was initiated by delivering a paper version of a letter of invitation to every residency in the two neighborhoods in Akureyri in April 2023 (~1200 letters).
Further recruitment was performed via publication of an advertisement in the local newspaper Dagskráin, which is delivered for free once a week to every household in the whole town. Finally, because of a lack of participation so far, we contacted 53 residents in the target areas via phone calls. Of those 53 people, 29 people answered the phone, and of those 29 people, 14 people agreed to participate, 9 people declined, and 6 people indicated they no longer lived in those areas.

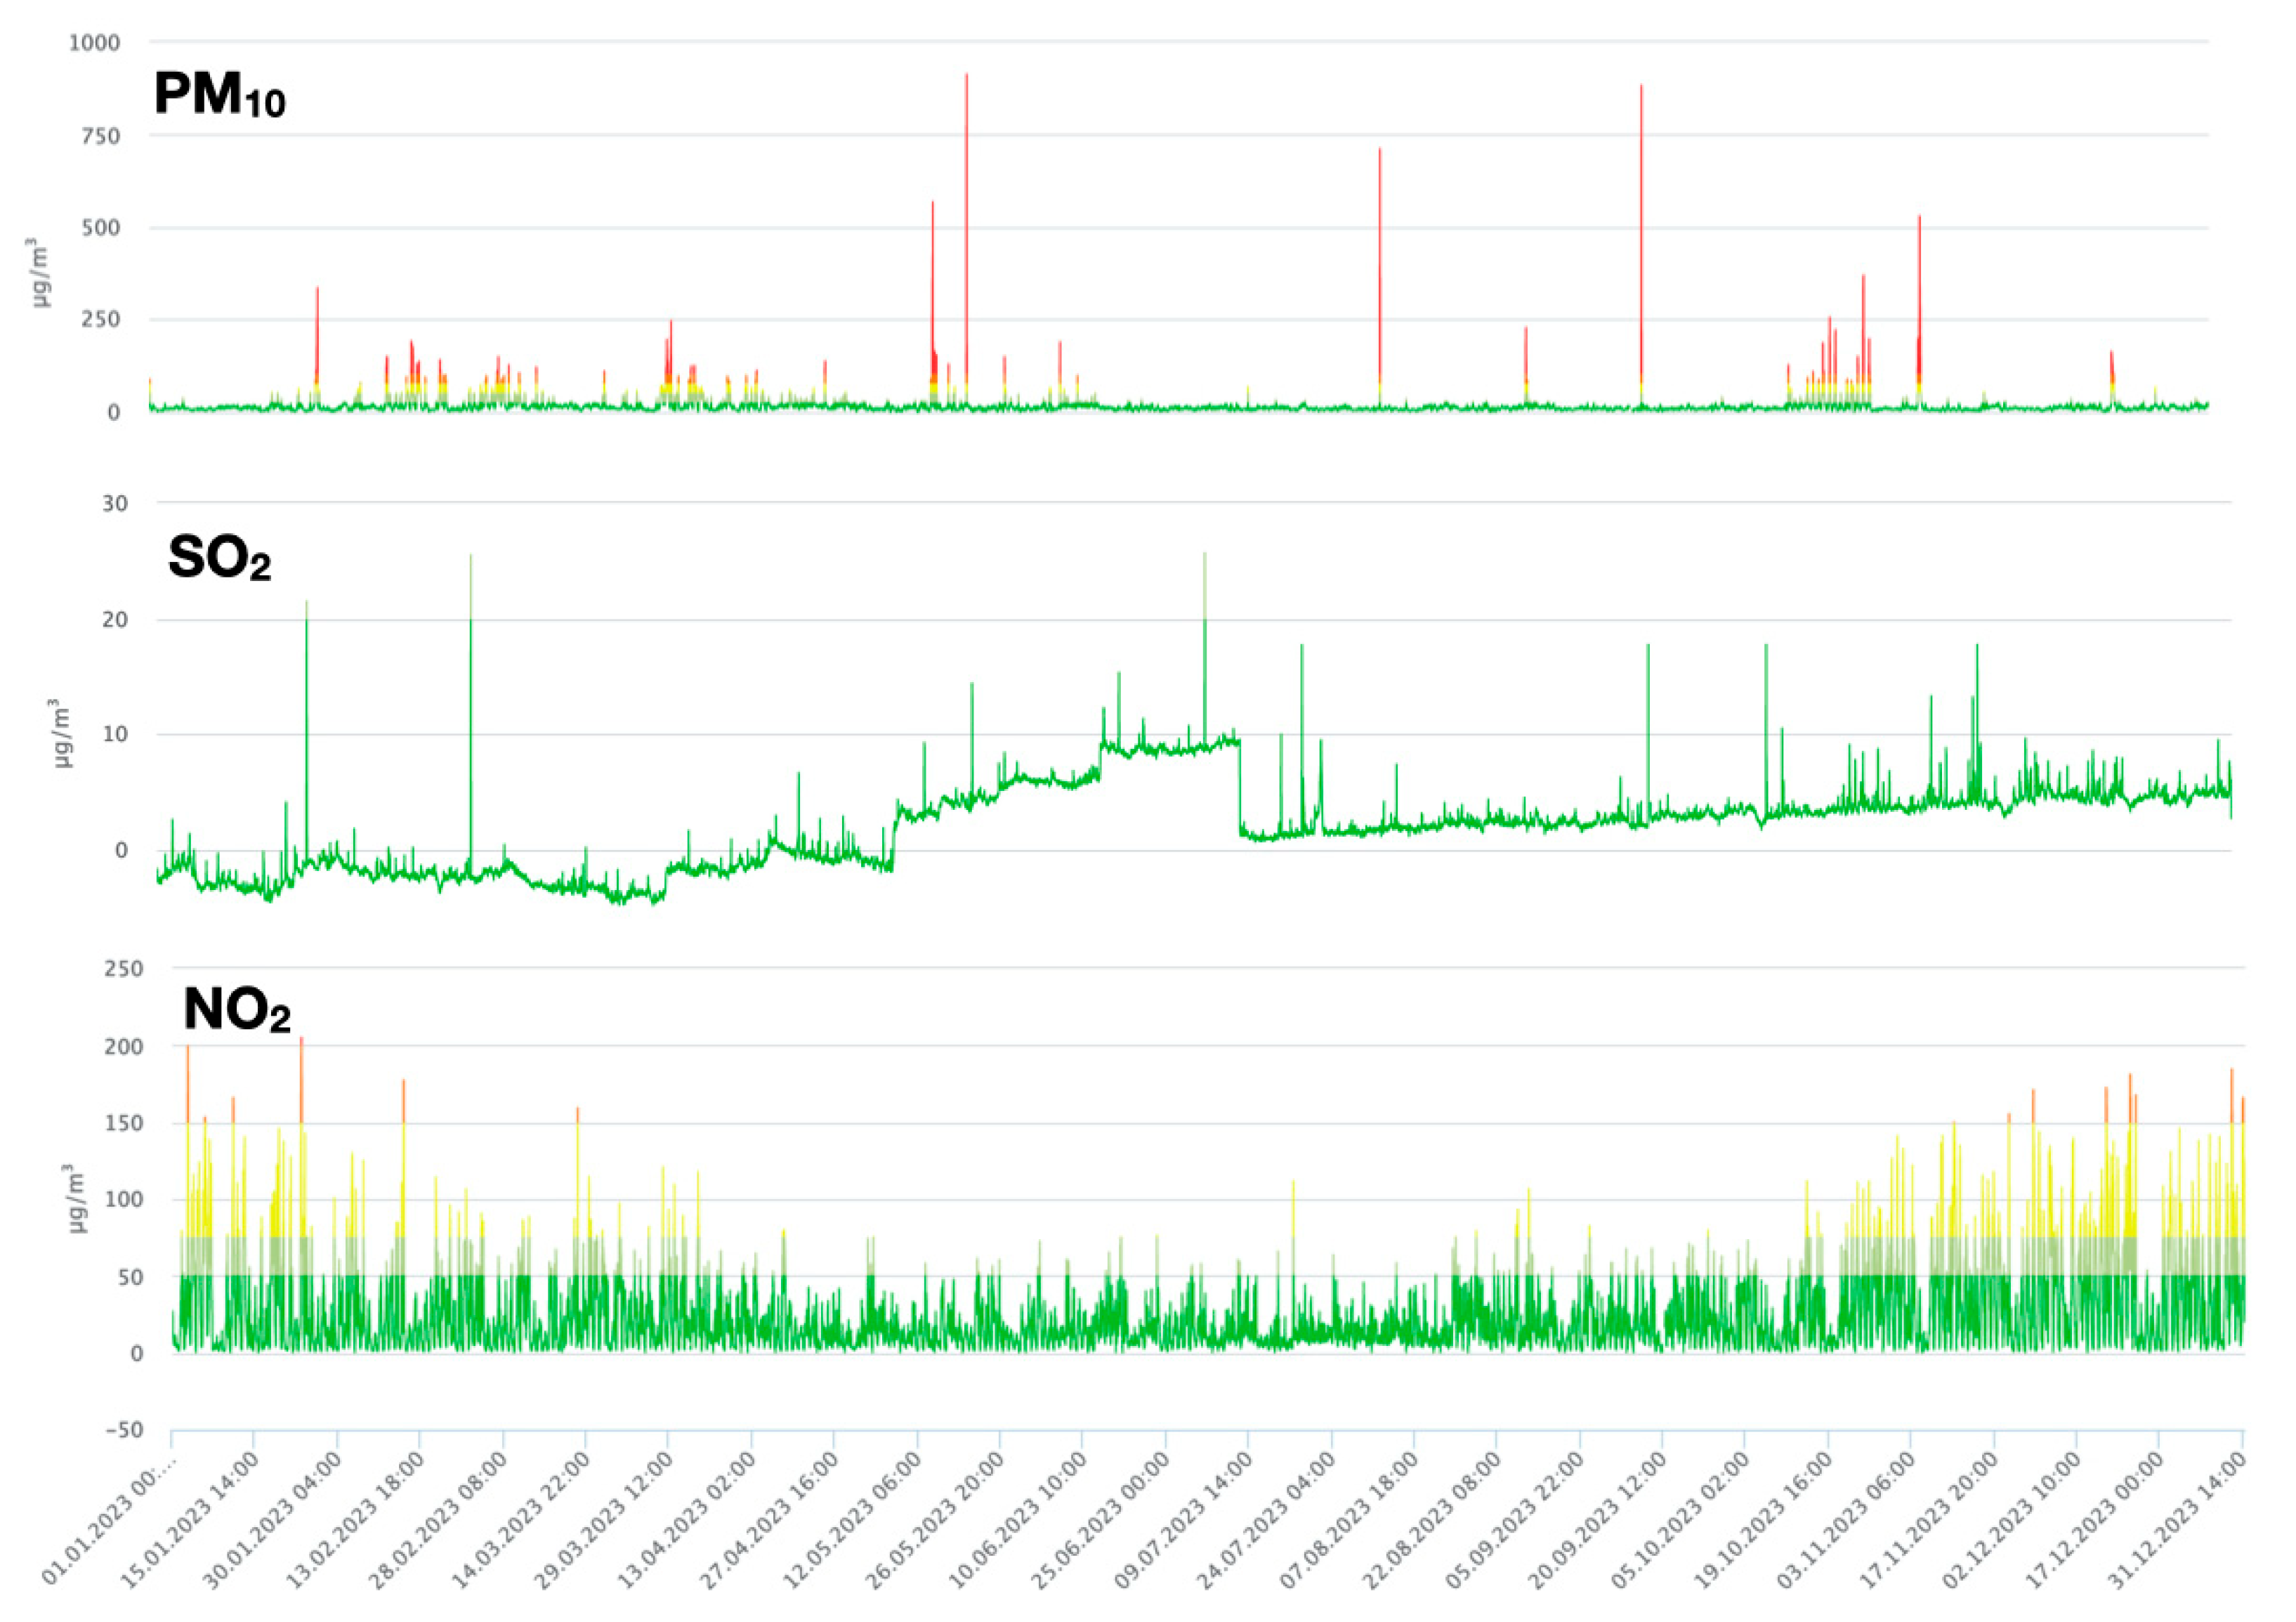
2.2. Air Pollution Measurements in Recruitment Timeframe

To confirm levels of air pollution, we used two sources of information. First, we accessed the measurements performed by the Icelandic Environmental Agency (https://loftgaedi.is/, accessed on 30 May 2023) from the date when the first participant filled in the questionnaire until the last date a participant filled in the questionnaire (19 April 2023–25 May 2023). The Environmental Agency operates a stationary outdoor air quality measurement device located at Strandgata, close to the cultural center “Hof”. This location is close both to the cruise ship docking station and the busiest street, Glerágata. The device measures PM10 every hour.
Secondly, measurements were conducted with the mobile air quality measurement device “BQ30—CO2 Air Quality Monitor and Particle Measuring Device”, Trotec, Heinsberg, Germany, which has a light scattering detector for PM10 and PM2.5. We measured air quality at the nursery school and the school in Giljahverfi between 17.04.23 and 22.05.23 a total of 58 times, or 29 times at each of the two locations. In Oddeyrin, we measured 70 times, or 35 times each at the busiest street, Glerárgata (at the restaurant Greifinn), and at the port where the cruise ships dock (at Eimskip) between 17.04.23 and 17.05.23. Measurement times were conducted with an emphasis on the times when kids at school/nursery school play outside and the busy hour when people drive to work or home from work at 9–10 am and 15–17:30.
Figure 2 marks the locations of measurements on the map of the town.

2.3. Survey

The survey was implemented in Microsoft Forms. After a written informed consent statement, we asked for the home address (in order to determine the exposure to pollution from the closest busy street), whether participants have spent the last 3 months at home or abroad, demographic information including age, gender, working situation, living situation, proficiency in Icelandic, whether participants have spent time abroad in the last 3 months and, if so, how long and where, own indication of mental or neurological diseases, regular medication intake, use of nicotine, consumption of caffeine, alcohol consumption according to the Alcohol Use Disorder Identification Test—Consumption (AUDIT-C [54]), body height and weight, and diet. Next, participants were asked to fill in the following questionnaires:
The Seasonal Pattern Assessment Questionnaire (SPAQ [55]) was validated in Iceland [56], with a resulting sensitivity of 94%, specificity of 73%, and positive predictive value of 45% for seasonal affective disorder and subsyndromal seasonal affective disorder combined. The SPAQ questionnaire assesses the extent of seasonal fluctuations participants experience in their mood and behavior. Six questions within the SPAQ questionnaire ask participants about their experience of seasonal changes in mood, weight, sleep, appetite, energy, and socializing. The sum of the scores of those six questions results in the Global Seasonality Score (GSS), which can range from 0 to 24 and was used for the purpose of the present study. The questionnaire also contained questions regarding the degree to which seasonal fluctuations are experienced as a problem and which month they feel best or worst, gain and lose weight, sleep most and least, socialize most and least, and eat most and least. Lastly, the questionnaire asks the participants how different weather conditions (such as rain, sun, wind, etc.) affect their mood and energy. A value of 11 and higher indicates elevated seasonal symptoms.
The Bergen insomnia scale (BIS) [57] has 6 items and was constructed to meet the current formal clinical criteria for diagnosing insomnia. The Icelandic version has an acceptable internal consistency (Cronbach’s alpha = 0.76) [58]. The 6 items address sleep onset, maintenance of sleep, early morning awakening, feeling rested, daytime impairment, and dissatisfaction with sleep. The BIS has good psychometric properties and was validated against subjective as well as polysomnographic data. The Icelandic version has been validated in a prior study [58]. For the present analysis, we added up the responses to the 6 questions of the BIS and used this score as an ordinal variable indicating sleep problems. Additionally, we determined the number of participants who scored 3 or above on at least one of the first four items and 3 or above on at least one of the last two items, which would indicate insomnia [57].
The three-item ID Migraine screener [59] asks about headaches causing disability, nausea, and sensitivity to light. If an individual answers yes on at least two of the three items, a migraine diagnosis is likely. Based on this criterion, the ID Migraine screener was reported to have a sensitivity of 0.81, a specificity of 0.75, a positive predictive value of 0.93, and good test-retest reliability, with a kappa of 0.68 [59]. For the present analysis, we translated the items to Icelandic. For the analysis, we added up the responses to the 3 questions and used this score as an ordinal variable indicating migraine likelihood.
The Hogg eco-anxiety scale (HEAS) [60] is a 13-item questionnaire using a 4-point Likert scale from 1 to 4, capturing the four dimensions of eco-anxiety: affective symptoms, rumination, behavioral symptoms, and anxiety about one’s negative impact on the planet. The subscales demonstrate excellent internal reliability (alpha > 0.82 for all subscales). Construct validity was shown to be good with respect to eco-anxiety being correlated (r = 0.38) with general anxiety but being a unique construct, distinct from general anxiety [60]. Stability over time was found to range between an Intraclass Correlation coefficient of 0.55 and 0.74 for the 4 subscales [60]. The scale was translated to Icelandic by the authors of this paper. Within the present analysis, we added up the responses to the 13 questions of the HEAS and used this score as an ordinal variable indicating eco-anxiety.
Worries were assessed by using 2 questions from the Health Information National Trends Survey, Cycle 2, by the National Institutes of Health, U.S. Department of Health and Human Services, 2012 [36]. The Health Information National Trends Survey (HINTS) is a survey supported by the National Cancer Institute in the US. We utilized 1 question from the 2012 iteration of the HINTS 4 Cycle 2 and modified 2 answer options to satisfy the purpose of the present study. Concretely, we asked about worries about indoor air pollution, outdoor air pollution, air pollution from studded tires, and air pollution from cruise ships. Participants answered these questions on a 4-point Likert scale ranging from “I am not worried at all” to “I am very worried”.

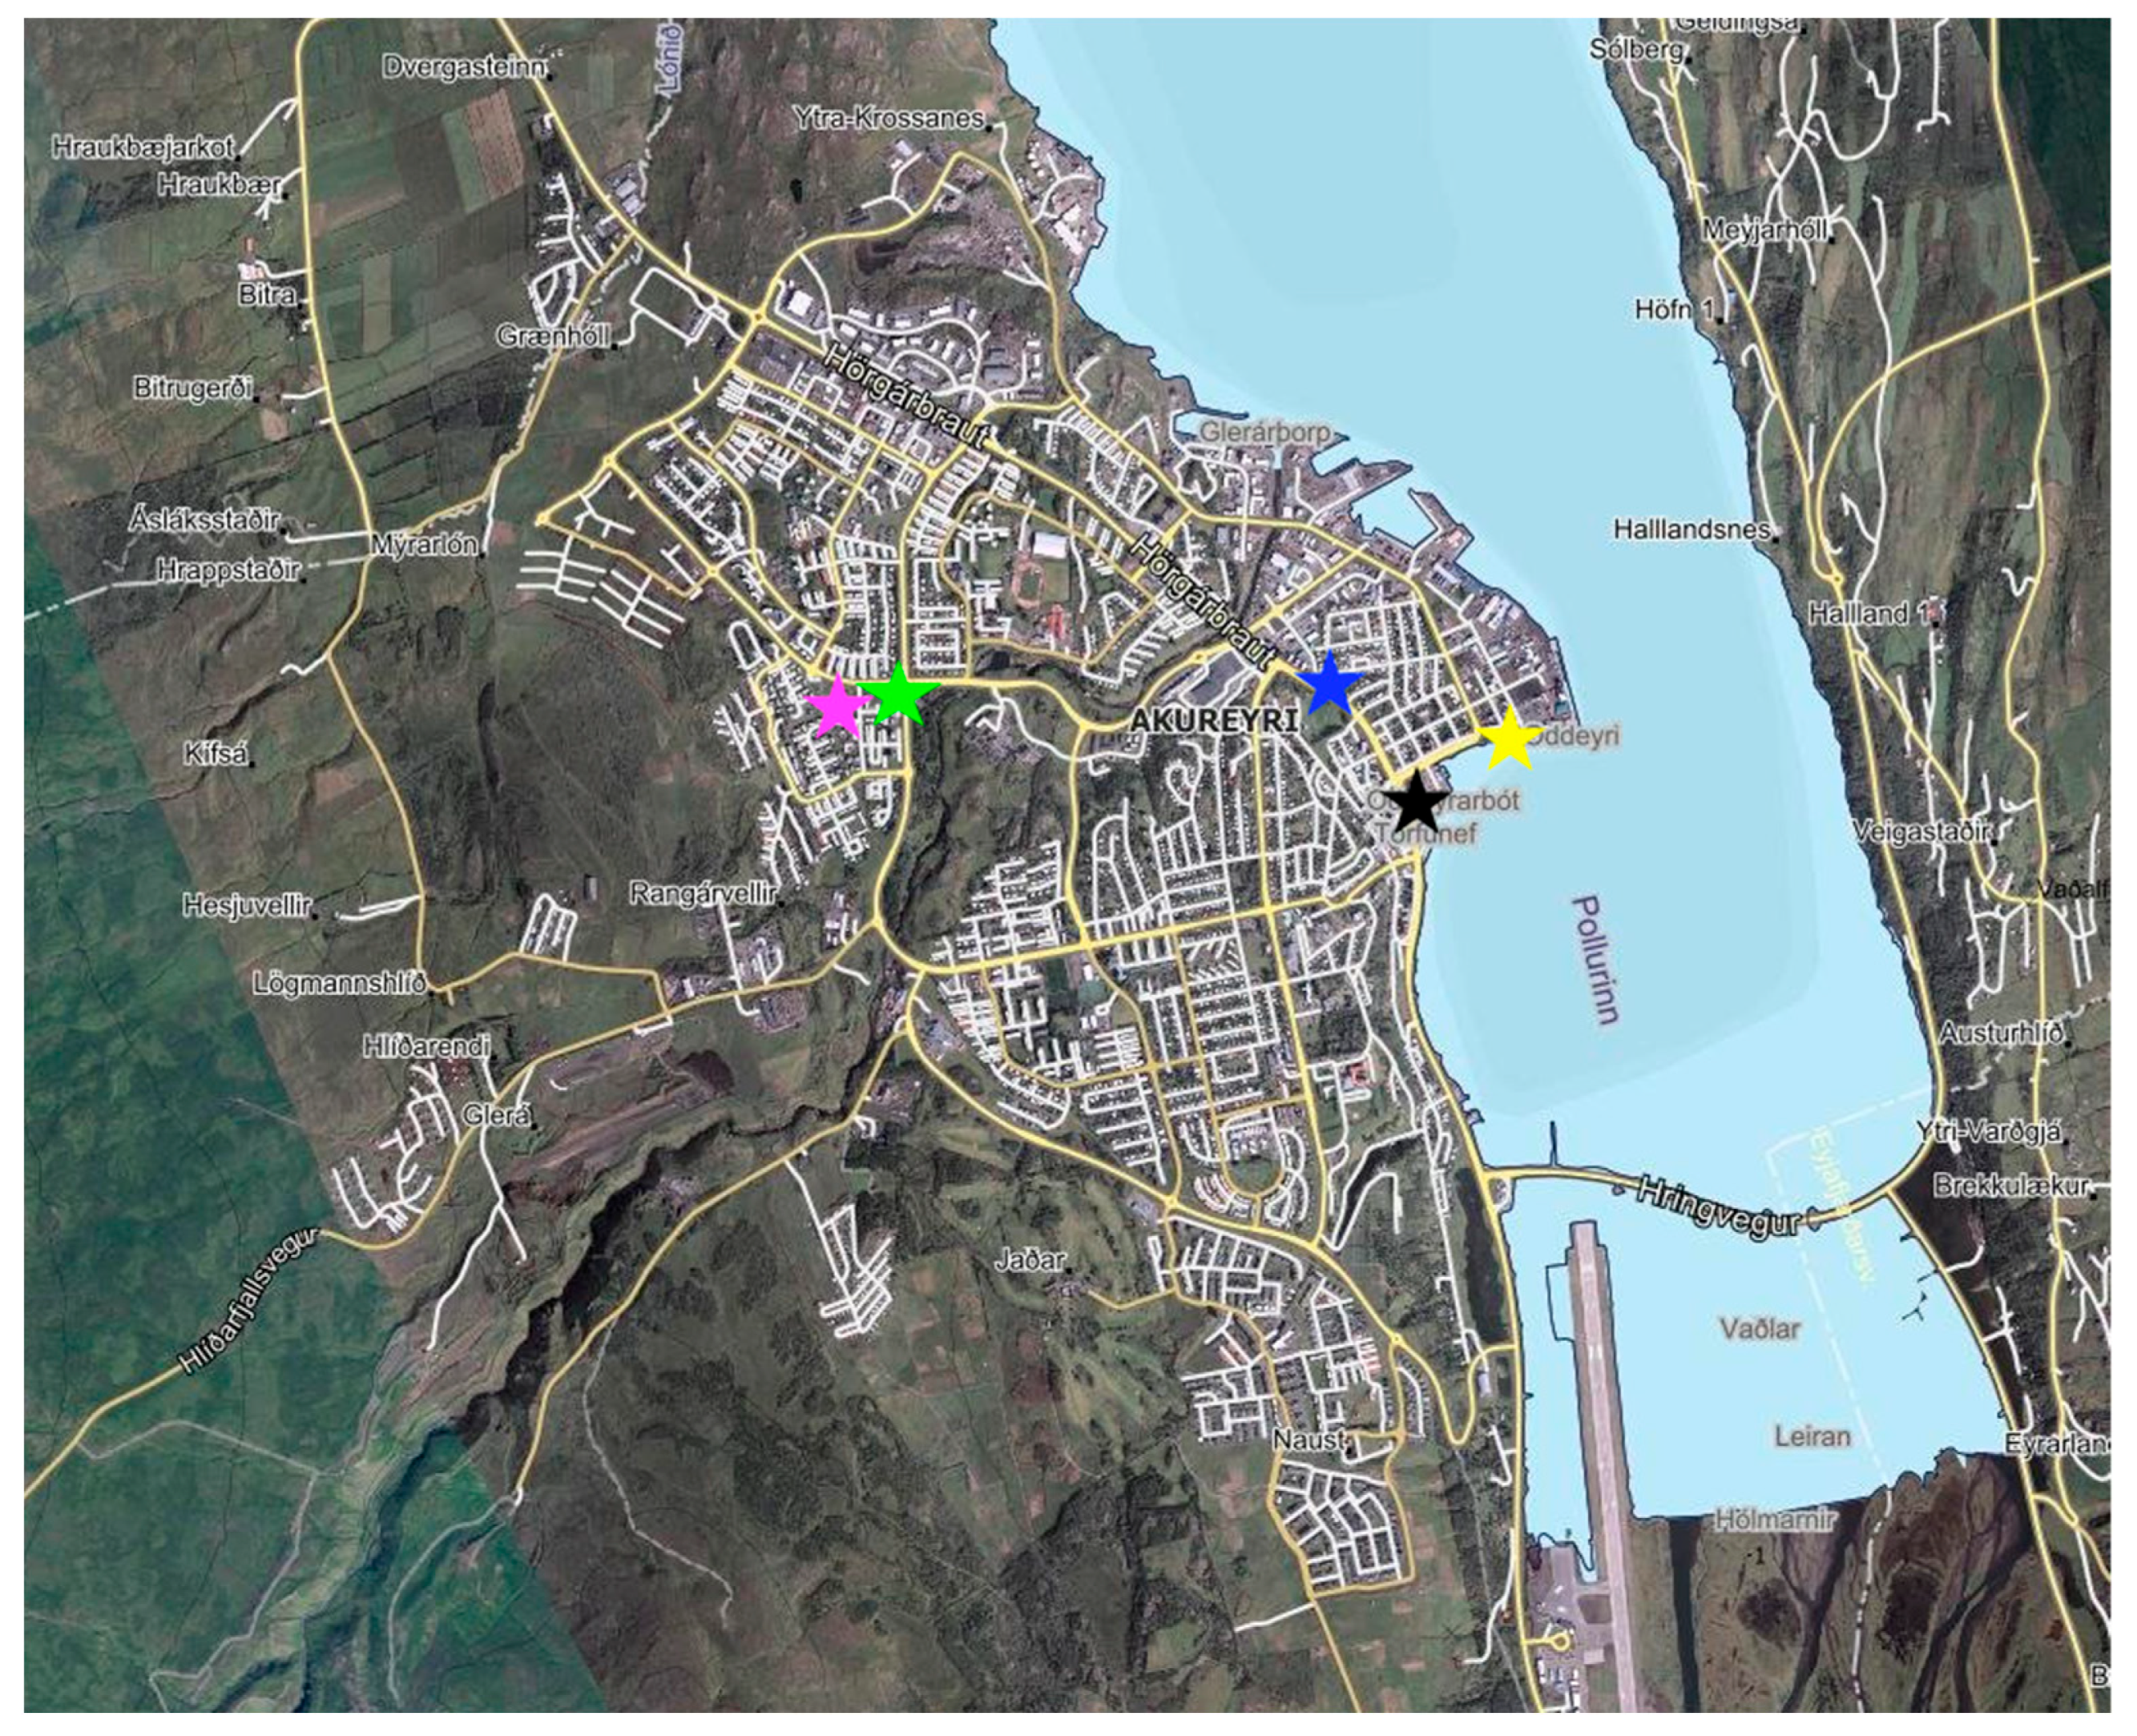
2.4. Neighborhood Analysis

Each participant was assigned a neighborhood corresponding to the address they provided in the survey. The neighborhoods were based on existing neighborhoods in Akureyri, and larger neighborhoods were split into smaller areas. Each neighborhood was also assigned a number corresponding to the distance of that neighborhood or area from the port. This was performed by measuring the distance in a straight line from the port to each neighborhood, the point furthest and closest to the port was used to calculate the average distance from the port. The neighborhoods were then grouped into 7 categories where group 1 included neighborhoods closest to the port and group 7 included neighborhoods furthest away. Furthermore, we used a map of the town that highlights the more trafficked streets and used that map to calculate the straight-line distance from the home address given by participants and the nearest busy street. This calculation was completed manually for each participant who provided information regarding their address.

2.5. Statistical Analysis

All statistics were completed in R (version 4.2.1 (2022-06-23)—“Funny-Looking Kid”) and R Studio (version 2022.02.3+492 “Prairie Trillium”).
Relations between worries about indoor vs. outdoor air pollution and about air pollution from studded tires vs. cruise ships were examined using chi-square tests.
We were interested in whether the worries about these different categories of air pollution differed from each other. To this end, we performed multiple Wilcoxon signed-rank tests for dependent samples.
Then, for each of the variables of interest—HEAS, GSS, MIG, BIS, alcohol consumption, and caffeine intake—we performed 4 Spearman correlations with the variables indicating worries about air pollution (indoors, outdoors, from studded tires, and from cruise ships). Since this resulted in 24 tests, we interpreted the resulting p-values at the Bonferroni-Holm corrected alpha levels to control for the multiple comparison error.
Since the assessed types of air pollution are seasonal, with cruise ships arriving from April to September and studded tires being driven from October to May, we also investigated the relation between worries about air pollution (indoor, outdoor, from studded tires, from cruise ships) and the participants’ indication of in which month they usually feel best or worst, gain and lose weight, sleep most and least, socialize most and least, and eat most and least.
In order to control for the distance of the home address from the closest busy street, we performed Spearman correlation tests between distance in meters and the health variables of interest (HEAS, GSS, MIG, BIS, AUDIT-C, and caffeine intake) as well as the variables indicating worries about air pollution (indoors, outdoors, from studded tires, and from cruise ships).

3. Results

3.1. Sample

There were 47 participants through the recruitment process of the SAD air study who participated between April and June 2023 with an age range from 20 to 92 and a mean age of 54.04 (SD = 16.69). The sample consisted of 18 men and 27 women (2 people did not indicate their gender).
Most people indicated working 31–40 h a week (n = 14) or even more than 40 h a week (n = 13), while n = 4 worked 21–30 h, n = 3 worked 11–20 h, and n = 10 worked 0–10 h. There were 5 participants who indicated they worked shifts.
There were 15 participants who indicated they had been abroad during the last 3 months; most of them (n = 11) for at most 1 week, 2 people were away for 2 weeks, and 2 people for 3 weeks. All the areas where participants went to were in Europe (n = 4 Spain, n = 1 France, n = 3 Germany, n = 3 Denmark, n = 2 UK, n = 1 Poland, n = 1 Portugal).
There were 5 participants who self-reported mental or neurological disorders, among which there was n = 1 brain tumor; all others reported depression, and n = 3 of them reported additional anxiety. Moreover, 8 participants reported sleep problems. Self-reported medication included medication for high blood pressure (n = 9), asthma (n = 1), attention deficit hyperactivity disorder (n = 1), anxiety (n = 1), bladder disorder (n = 1), depression (n = 1), pain (n = 1), reflux (n = 1), and sleep disorder (n = 1).
Most participants were non-smokers; 4 indicated they use nicotine. In the sample, 14 never drank alcohol, 14 drank once a month, 8 answered 2–4 times a month, 7 answered 2–3 times a week, and 1 more often. There were 30 who indicated they never binge drink alcohol (binge drinking is defined as drinking 6 or more drinks at a time), 11 who binge drink less often than once a month, 1 who binge drinks about monthly, and 1 who binge drinks weekly. Regarding how much they would drink on a typical occasion where alcohol was drunk, there were 20 who said they usually drink 1–2 units of alcohol, 5 indicated they drink 3–4 units, and 1 indicated they drink more than that.

3.2. Air Pollution in Recruitment Timeframe

According to the measurements of the environmental agency, the overall average of PM10 across all hours and days in the time frame of interest was 17.2 μg/m3, thus, exceeding the WHO-recommended health limits for 24 h averages ([61] <5 μg/m3 PM2.5 and <15 μg/m3 PM10). Our point measurements of PM2.5 and PM10 in the time frame of recruitment at other places in town were considerably higher and can be found in Table 1. Particulate matter measurements were consistently higher in Oddeyrin as compared to Giljahverfi.

3.3. Health Complaints and Worries

Table 2 gives descriptive statistics for the responses on the four questionnaires used. The data shows that dispersion of symptoms of seasonality, insomnia, migraine, and eco-anxiety was covering well the range of possible answers on the employed scales. These ranges were comparable to what would be expected in a community sample.
Table 3 gives counts for the questions on worries about air pollution.
While there was no significant relation between worries about air pollution outdoors and indoors (chi-squared(6) = 11.19; p = 0.083), the relation between worries about air pollution from studded tires and cruise ships is highly significant (chi-squared(9) = 38.42; p = <0.001), indicating that participants were rather likely to worry to a similar amount about both sources of air pollution.
As compared to indoor air pollution, participants were significantly more worried about outdoor air pollution (Wilcoxon test statistic V = 55; p = 0.0006), air pollution from studded tires (Wilcoxon test statistic V = 59; p = 0.004), and air pollution from cruise ships (Wilcoxon test statistic V = 6; p = 0.00004). There was no difference in the extent of worries about outdoor air pollution and air pollution from studded tires (Wilcoxon test statistic V = 81; p = 0.829). However, participants were more worried about air pollution from cruise ships as compared to outdoor air pollution (Wilcoxon test statistic V = 27; p = 0.005) and as compared to air pollution from studded tires (Wilcoxon test statistic V = 26; p = 0.013). There were significant positive correlations between worries about outdoor air pollution and insomnia symptoms, worries about indoor air pollution and migraine symptoms, worries about air pollution from studded tires and eco-anxiety, and worries about air pollution from cruise ships and symptoms of migraine (see Table 4), but no significant correlations between any of the worries subscales with the alcohol consumption index and daily caffeine consumption.
Table 5 shows the frequencies of people indicating to feel best or worst, gain and lose most weight, sleep the most and least, socialize the most and least, and eat the most and least for all seasons: spring (March–May), summer (June–August), fall (September–November), and winter (December–February). Please note that participants could tick all the months separately, so they often counted in more than one season. Most people felt best during the summer, and most people felt worst in the winter.

3.4. Distance from Pollution Sources

There were 15 participants who lived in the harbor district, Oddeyrin, which is closest to the harbor, and 27 in the control district, Giljahverfi, which is far away from the harbor (4 indicated they lived somewhere else and were excluded from the comparison of neighborhoods). These 2 groups did not differ significantly by their distance to the closest busy street (t(26.42) = −0.72; p = 0.478). When comparing these two groups in terms of their scores on seasonality, insomnia, eco-anxiety, migraine, alcohol use, caffeine intake, and the four types of worries about air pollution, they did not differ significantly according to Wilcoxon rank sum tests.
Among all participants who indicated their home address (9 did not disclose it), the minimum distance was 27 m to the next busy street, and the maximum was 295 m. On average, people lived 108.55 m away from the next busy street (SD = 67.67 m). When examining the relationship between the distance from the nearest busy street and the recorded health variables of seasonality, insomnia, eco-anxiety, migraine, alcohol use, and caffeine intake, as well as the four types of worries with a Spearman‘s correlation method, no significant correlations emerged.

4. Discussion

Air quality in Iceland is said to be good, which is only true for part of the year. According to our data and the data from the environmental agency, levels of particulate matter exceed WHO-recommended health limits [61] in urban areas such as Akureyri during certain parts of the year. The present study investigated the relation between worries about seasonal air pollution from studded tires and cruise ships and seasonality, insomnia, migraine, and eco-anxiety. While the sample size recruited limits generalizability, the recruitment difficulties encountered need to be communicated to other scientists in the field to facilitate better recruitment in other studies. In the following, we will first discuss the possible results based on the limited sample and then attempt to give recommendations on how to improve the limited recruitment success in future studies.

4.1. Worries About Air Pollution from Different Sources

According to our data, worries about air pollution were focused on outdoor air pollution, suggesting that indoor air pollution was less perceived as an imminent threat. Worries about outdoor air pollution sources, i.e., studded tires and cruise ships, were significantly related, with worries about air pollution from cruise ships being highest. Our data on worries can be interpreted as indirect measures for risk perception [62].
The subjective overrating of the hazards from outdoor air pollution compared to indoor air pollution stands in strong discrepancy to research from other areas in the world where indoor air quality is often a much more serious problem [63]. Not all common sources for poor indoor air quality are relevant in Iceland, where radon activity is generally lower [64], cigarette smokers are rare in international comparison [65], and houses are heated with green geothermal energy, which is also used to produce electricity; thus, indoor pollution from unvented kerosene and gas space heaters, woodstoves, fireplaces, and gas stoves is almost nonexistent. However, associations between unhealthy indoor air quality due to mold-infested building materials and self-assessed health have been documented previously in Iceland [66]. Data on indoor pollution from chemicals is less well researched in Iceland and, hence, less described in the media, which possibly explains why indoor air pollution was perceived as less important by the study participants.
More propensity to worry about air pollution from cruise ships as compared to air pollution from studded tires stands in strong contrast to the data from the environmental agency [47], according to which air pollution is higher in the period when studded tires cause a dramatic surge of particulate matter as compared to the relatively good air quality in the cruise ship period. The environmental agencies’ air quality measurement is performed close to the busiest street of the town, which is also close to the port but further away from the cruise ships than the cars. This circumstance might lead to an underestimation of air pollution from cruise ships. Moreover, while studded tires clearly impact ambient particulate matter levels, cruise ships emit other pollutants such as NO2 and SO2. Nevertheless, it is possible that the public perception of imminent threat by air pollution from these two sources is not in agreement with the actual threat. This finding highlights the need for targeted information campaigns to address the worries about specific sources of air pollution that are perceived as particularly alarming by the public. Specifically, better documentation of the air pollution from cruise ships as well as targeted information about the negative health impacts from particulate matter caused by studded tires are highly warranted. Population-level data has been analyzed with respect to the impact of volcanic activity on respiratory diseases and deaths [67]. In contrast, a systematic estimation of the negative health impact of high levels of particulate matter caused by the use of studded tires as measured by the environmental agency (Figure 1) on the urban population in Iceland is lacking. Given the comparably high levels of pollution, the effects on physical and mental health can be assumed to be comparable to other regions in the world where other sources of particulate matter cause a wide variety of negative health consequences.
The discrepancy between the public attention to various sources of air pollution is also interesting in light of the level of control citizens have about the here assessed two different sources of air pollution. While the decision about the number of cruise ships coming to town is taken by a small group of local decision makers, citizens could decide on whether to use studded tires and, thus, contribute to overall better air. The way individuals perceive and respond to worries about uncontrollable events or circumstances, compared to risks associated with their own behavior, has been investigated in other studies on risk perception and control, notably based on perceived control theory. Related research on this issue was performed on risk perceptions about the harms associated with cigarette smoking, where risk perception is often found to be lower as compared to the actual health risks [68], and the impact of bans on smoking is perceived as a violation of personal rights [69], somewhat in analogy to the perception of a possible ban of studded tires [44]. Similarly, a study on New York taxi drivers found that awareness of the exposure to high air pollution levels was limited [70]. It was also noted that risk perception with respect to air pollution is not entirely rational since risk is assessed based on cognitive skills and emotional appraisals [5]. A study in Kansas documented that pollution perception and health concern were related to air quality alert knowledge, but not with exposure [71], and smokers were found to note air pollution less likely than non-smokers [72]. We could speculate that those who contribute to the pollution tend to underestimate the level of pollution. Furthermore, it was previously documented that risk perception is lower if the activity that causes the risk is financially rewarding [73]. In Akureyri, the group of people benefitting from the cruise ship industry is rather small, but studded tires are less costly as compared to high-quality winter tires that would provide the same or superior level of driving safety in severe winter road conditions [74].
Prior research [75] also suggests that media reports might play a role in the differential worries that may reflect differential perception of risk. While some studies suggest that adequate information on bad air quality can affect behavior [52], other studies point out that under certain circumstances this information is only effective to increase awareness, but not in changing behavior towards reducing negative health impacts, as shown in a study implementing low-cost sensors in homes to measure the effect of wood burning [76].

4.2. Worries About Air Pollution and Their Relation to Mental Health Indicators

While worries about air pollution showed no significant association with seasonality, i.e., seasonal symptoms of mood, sleep, fatigue/energy, social behavior, and appetite, insomnia symptoms were related to worries about outdoor air pollution, eco-anxiety was associated with worries about air pollution from studded tires, and migraine symptoms were associated with worries about air pollution from cruise ships, as well as worries about indoor air pollution.
Eco-anxiety is associated with several factors, including insomnia and overall lower-rated health [37]. Eco-anxiety is also conceptualized in a framework of so-called eco-distress, composed of eco-anger, eco-grief, and eco-worry [77]. Pollution from studded tires is also related to driving cars, which might drive eco-anxiety because of the negative impact of the CO2 caused by cars on the climate.
The association between worries as an indicator for risk perception and symptoms of insomnia and migraine can be explained by two factors. It is possible that the association is driven by actual harm induced by exposure to air pollution. However, our study cannot provide a direct link between level of exposure and health symptoms since we could not show a relation between distance to sources of air pollution and any of the examined health variables. This might be due to the limitations of our methodology since we did not measure at the participant’s home or the nearest busy street, so no further conclusion can be made about whether actual air pollution is the reason for the symptoms or not. The second factor that can plausibly explain insomnia and possibly migraine is the worry itself. Worries are clearly linked to insomnia, especially worries about sleep [78] but also general tendencies of negative thinking [79]. There is also indication that worries can increase the risk for migraine attacks, as worries were identified as the mediating factor in the association between anxiety, depression, and migraine [80].

4.3. Seasonality of Air Pollution and Seasonal Variations in Health and Well-Being

Although none of the assessed worries would correlate with seasonality as a general index for seasonal symptoms, we also documented participants’ indications of seasonal preferences with respect to several variables, including mood. According to the frequencies of indications of feeling worst and best, in absolute number, the cruise ship season in the summer was the overall best season, while the winter was the overall worst season. The summer is the season where no studded tires cause air pollution, while winter is the season where no cruise ships arrive to Akureyri. Spring and fall have some overlap of the two sources of pollution. From this we cannot draw the conclusion that people feel worse during the winter because of the studded tires causing more particulate matter than the cruise ships in summer; however, at least we can conclude that the air pollution from cruise ships during the summer does not govern overall well-being to an extent that it would be measurable in terms of seasonality.
It needs to be noted in this context that seasonality is typically measured to detect seasonal affective disorder, which is most common during the winter [81,82,83].

4.4. Challenging Recruitment: Is It the Topic?

The main limitation of the present study is the small sample size. However, other than being a simple limitation, it might also be a result. In this study, we put more effort and financial resources into recruitment than for other studies we ran in our research group—nevertheless, the recruitment rate was extremely low as compared to other studies we conducted in the area on non-controversial topics. For example, in the EPiC SAD study, the response rate was around 20%, but in the present study, it was only about 4%. A gradual fall in participation rate in health surveys in Europe has been reported previously. This trend in declining response rates will further limit studies on controversial topics where participation rate is generally lower than the national average participation rate. However, we strongly suspect that the title of the study kept most people from participating. Specifically, when recruiting participants, the title of the study was shown in the advertisement in the newspaper, in the letters sent to potential participants’ homes, and on the study website. The title of the study might have directly impacted the willingness to participate, since it mentioned the potential connection between studded tires, air quality, and health. In Iceland use of studded tires is restricted, and in 2023, the City of Reykjavik declared that their use is undesirable [84]. Thus, there is public effort in inducing a gradual shift towards not using studded tires in Iceland. However, the major part of the population in Akureyri is reluctant to change studded tires out for non-studded winter tires, as the most recent count in Akureyri in April 2025 yielded that 85% of cars run on studded tires [85]. The low participation rate in our study may indicate how controversial the issue of studded tire use is, especially in the northen part of Iceland, where winter conditions are harsher compared to the south. Some of the people invited to take part in this study may have feared that just by taking part they could increase the chance of studded tires being banned in Akureyri. In this town, the use of studded tires is restricted to the season from 01 November to 14 April. However, even the local police in Akureyri announced not to punish the use of studded tires until May [86,87]. The low participation rate in our study may indicate how controversial the issue of studded tire use is, especially in the northern part of Iceland, where winter conditions are harsher compared to the south.
In contrast to the public opinion on studded tires, there is broad consensus in the local population that cruise ships pollute the area [88]. The relatively large group of citizens not benefitting from the narrow economic impact of cruise ships would prefer a drastic reduction in ship arrivals. In contrast, the number of citizens that openly criticize the use of studded tires and would prefer a ban on them is very small. No reliable data on this discrepancy of public opinions exists in Iceland and comparable Nordic regions, warranting future research. Most importantly, with better knowledge of the impact of the title of a study on participation rates in research tackling a highly controversial issue, future studies can be designed better in their wording to avoid low participation rates despite considerable effort, as in the present case.

4.5. Limitations

The main limitation of the study is the small sample size, which prevents generalizations to the population of Iceland and beyond. However, the study results can be seen as a pilot indicator for results that could be obtained by extending the study to different regions in and outside of the country. In addition to the small sample size, there are several limitations regarding the methods of measurement.
First, with respect to the measurement of air quality, it must be acknowledged that our measurements did not provide a systematic picture of the actual air quality in the local districts where the study participants lived. The investigation into the distance from pollution sources revealed no significant differences in health outcomes between participants residing near and far from busy streets. However, we did not measure air pollution in each busy street that was close to a participant’s home. Therefore, the negative finding might be explained by the rather local distribution of air pollution. However, it is even more likely that the presumably great variation of exposure over the course of different activities, such as commuting to/from work and the choice of transportation (walking, biking, or car), might be the cause for the lack of an association. Further research should invest in personalized exposure measurement, completed in previous studies where study participants were equipped with air quality measurement devices.
Also related to the air quality measurements conducted in this study, it is possible that the measurements overestimate the actual air pollution, especially since the measured values of PM were significantly higher than the average obtained from the environmental agency. However, our data were not continuously sampled but rather aimed at gathering local values for peak pollution times of the day. Moreover, it was documented previously that hot spots of pollution yield higher values than central air quality measurements [70].
Additionally, it must be noted that the present study relied solely on self-reported health problems, which are somewhat unreliable. Specifically, self-reported health problems associated with increased worries about air pollution are likely to suffer from poor reliability, as it was reported that the concerns themselves influence symptom reporting, perceptions of current health, medication use, and visits to health care providers [89]. Thus, the concerns and health reports are not independent and may be rather driven by the worries than actual health issues. Future studies should be designed to accurately measure individual exposure to air pollution combined with objective measurements of health. This is especially relevant as we obtained information on self-reported other health conditions and the regular intake of medication that might be of interest to the presented research questions, but the inhomogeneity of these conditions and pharmaceutical agents paired with the low reliability of self-reported health data prevented us from conducting further quantitative analysis.
In relation to the small sample, there were several aspects that we could not analyze due to small subsamples. Specifically, only 4 participants were tobacco users. Smoking is not very common in Iceland, but the combined impact of particulate matter and smoking, especially regarding indoor air quality [90], should be taken into account in future studies with larger sample sizes.

5. Conclusions

While the conclusions from the present study are overall limited by a small sample size, low response rate, and the methods of measurement, the data point at worries about air pollution present in the population of a small town exposed to high levels of PM due to studded tires and to presumably high levels of air pollution from a significant number of cruise ships arriving at the port. The study also suggests that a potential discrepancy in public attention to these two sources of air pollution should be investigated in more detail with respect to the questionable relation between awareness of pollution and its source, as well as the willingness to change the current situation. Most importantly, the study draws the attention of researchers to the special care needed when designing surveys on controversial issues such as studded tires. The wording of the study invitation might limit participation, which was likely the reason for the low participation in the present case rate despite considerable recruitment effort. The data also provided hints towards health symptoms being associated with worries about air pollution. Although this finding is limited by the small sample size, it can inform future studies on the issue in other locations with a similar complex interrelation between the source of pollution, worries, and controversial opinions on the matter. Finally, we propose corrective measures to minimize the impact of pollution caused by land and sea traffic on human health, such as the permanent ban of studded tires and the limitation of the number of cruise ships. These measures would not only improve the health of local populations but also lead to more sustainable practices in the global context.

Supplementary Materials

The following supporting information can be downloaded at: https://www.mdpi.com/article/10.3390/su17104634/s1, Table S1: DataSADairanonymous.xlsx.

Author Contributions

Conceptualization, Y.H., L.S.G. and R.P.Ó.; data curation, L.Z. and L.D.S.; formal analysis, Y.H. and L.D.S.; Funding acquisition, Y.H. and L.Z.; Investigation, L.D.S., A.D.P., A.L., A.M. and Á.M.Á.; methodology, Y.H. and L.Z.; project administration, A.D.P.; resources, Y.H.; software, Y.H.; supervision, R.P.Ó.; validation, L.Z.; visualization, Y.H.; writing—original draft, Y.H. and L.Z.; writing—review and editing, Y.H., L.S.G. and R.P.Ó. All authors have read and agreed to the published version of the manuscript.

Funding

This research was funded by the research fund of the University of Akureyri, grant number R2320. The APC was funded by the research fund of the University of Akureyri.

Institutional Review Board Statement

The study was conducted in accordance with the Declaration of Helsinki and approved by the National Bioethics Committee of Iceland (protocol code 23-024-S1 on 15 March 2023).

Informed Consent Statement

Informed consent was obtained from all subjects involved in the study.

Data Availability Statement

The original contributions presented in this study are included in the article/Supplementary Material Table S1: DataSADairanonymous.xlsx. Further inquiries can be directed to the corresponding author.

Acknowledgments

Thanks to Þuríður Elva Eggertsdóttir for contributing important references about air pollution and insomnia.

Conflicts of Interest

The authors declare no conflicts of interest.

Abbreviations

The following abbreviations are used in this manuscript:
AUDIT-CAlcohol User Disorder Identification Test
BISBergen insomnia scale
HEASHogg eco-anxiety scale
HINTSHealth Information National Trends Survey
NO2nitrogen oxide
PMparticulate matter
SO2sulphur dioxide
SPAQSeasonal Pattern Assessment Questionnaire
WHOWorld Health Organization

References

  1. Cohen, A.J.; Brauer, M.; Burnett, R.; Anderson, H.R.; Frostad, J.; Estep, K.; Balakrishnan, K.; Brunekreef, B.; Dandona, L.; Dandona, R.; et al. Estimates and 25-Year Trends of the Global Burden of Disease Attributable to Ambient Air Pollution: An Analysis of Data from the Global Burden of Diseases Study 2015. Lancet 2017, 389, 1907–1918. [Google Scholar] [CrossRef]
  2. Fuller, R.; Landrigan, P.J.; Balakrishnan, K.; Bathan, G.; Bose-O’Reilly, S.; Brauer, M.; Caravanos, J.; Chiles, T.; Cohen, A.; Corra, L.; et al. Pollution and Health: A Progress Update. Lancet Planet. Health 2022, 6, e535–e547. [Google Scholar] [CrossRef] [PubMed]
  3. Kelly, F.J.; Fussell, J.C. Size, Source and Chemical Composition as Determinants of Toxicity Attributable to Ambient Particulate Matter. Atmos. Environ. 2012, 60, 504–526. [Google Scholar] [CrossRef]
  4. Harrison, R.M.; Yin, J. Particulate Matter in the Atmosphere: Which Particle Properties are Important for its Effects on Health? Sci. Total Environ. 2000, 249, 85–101. [Google Scholar] [CrossRef]
  5. Cori, L.; Donzelli, G.; Gorini, F.; Bianchi, F.; Curzio, O. Risk Perception of Air Pollution: A Systematic Review Focused on Particulate Matter Exposure. Int. J. Environ. Res. Public Health 2020, 17, 6424. [Google Scholar] [CrossRef]
  6. Li, J.; Li, W.X.; Bai, C.; Song, Y. Particulate Matter-induced Epigenetic Changes and Lung Cancer. Clin. Respir. J. 2017, 11, 539–546. [Google Scholar] [CrossRef] [PubMed]
  7. Riedl, M.A. The Effect of Air Pollution on Asthma and Allergy. Curr. Allergy Asthma Rep. 2008, 8, 139–146. [Google Scholar] [CrossRef]
  8. Kim, K.; Jahan, S.A.; Kabir, E. A Review on Human Health Perspective of Air Pollution with Respect to Allergies and Asthma. Environ. Int. 2013, 59, 41–52. [Google Scholar] [CrossRef]
  9. Sabour, S.; Harzand-Jadidi, S.; Jafari-Khounigh, A.; Zarea Gavgani, V.; Sedaghat, Z.; Alavi, N. The Association between Ambient Air Pollution and Migraine: A Systematic Review. Environ. Monit. Assess. 2024, 196, 271. [Google Scholar] [CrossRef]
  10. Thompson, J. Airborne Particulate Matter: Human Exposure and Health Effects. J. Occup. Environ. Med. 2018, 60, 392–423. [Google Scholar] [CrossRef]
  11. Mills, N.L.; Donaldson, K.; Hadoke, P.W.; Boon, N.A.; MacNee, W.; Cassee, F.R.; Sandström, T.; Blomberg, A.; Newby, D.E. Adverse Cardiovascular Effects of Air Pollution. Nat. Clin. Pract. Cardiovasc. Med. 2009, 6, 36–44. [Google Scholar] [CrossRef] [PubMed]
  12. Fiordelisi, A.; Piscitelli, P.; Trimarco, B.; Coscioni, E.; Iaccarino, G.; Sorriento, D. The Mechanisms of Air Pollution and Particulate Matter in Cardiovascular Diseases. Heart Fail. Rev. 2017, 22, 337–347. [Google Scholar] [CrossRef]
  13. Lisabeth, L.D.; Escobar, J.D.; Dvonch, J.T.; Sánchez, B.N.; Majersik, J.J.; Brown, D.L.; Smith, M.A.; Morgenstern, L.B. Ambient Air Pollution and Risk for Ischemic Stroke and Transient Ischemic Attack. Ann. Neurol. 2008, 64, 53–59. [Google Scholar] [CrossRef]
  14. Block, M.L.; Calderón-Garcidueñas, L. Air Pollution: Mechanisms of Neuroinflammation and CNS Disease. Trends Neurosci. 2009, 32, 506–516. [Google Scholar] [CrossRef]
  15. Shi, L.; Wu, X.; Danesh Yazdi, M.; Braun, D.; Abu Awad, Y.; Wei, Y.; Liu, P.; Di, Q.; Wang, Y.; Schwartz, J.; et al. Long-Term Effects of PM2.5 on Neurological Disorders in the American Medicare Population: A Longitudinal Cohort Study. Lancet Planet. Health 2020, 4, e557–e565. [Google Scholar] [CrossRef]
  16. Buoli, M.; Grassi, S.; Caldiroli, A.; Carnevali, G.S.; Mucci, F.; Iodice, S.; Cantone, L.; Pergoli, L.; Bollati, V. Is there a Link between Air Pollution and Mental Disorders? Environ. Int. 2018, 118, 154–168. [Google Scholar] [CrossRef] [PubMed]
  17. Shim, J.; Byun, G.; Lee, J. Exposure to Particulate Matter as a Potential Risk Factor for Attention-Deficit/Hyperactivity Disorder in Korean Children and Adolescents (KNHANES 2008–2018). Int. J. Environ. Res. Public health 2022, 19, 13966. [Google Scholar] [CrossRef] [PubMed]
  18. Park, J.; Sohn, J.H.; Cho, S.J.; Seo, H.Y.; Hwang, I.; Hong, Y.; Kim, K. Association between Short-Term Air Pollution Exposure and Attention-Deficit/Hyperactivity Disorder-Related Hospital Admissions among Adolescents: A Nationwide Time-Series Study. Environ. Pollut. (1987) 2020, 266, 115369. [Google Scholar] [CrossRef]
  19. Zhang, Z.; Zhao, D.; Hong, Y.S.; Chang, Y.; Ryu, S.; Kang, D.; Monteiro, J.; Shin, H.C.; Guallar, E.; Cho, J. Long-Term Particulate Matter Exposure and Onset of Depression in Middle-Aged Men and Women. Environ. Health Perspect. 2019, 127, 77001. [Google Scholar] [CrossRef]
  20. Braithwaite, I.; Zhang, S.; Kirkbride, J.B.; Osborn, D.P.J.; Hayes, J.F. Air Pollution (Particulate Matter) Exposure and Associations with Depression, Anxiety, Bipolar, Psychosis and Suicide Risk: A Systematic Review and Meta-Analysis. Environ. Health Perspect. 2019, 127, 126002. [Google Scholar] [CrossRef]
  21. Yue, J.; Liu, H.; Li, H.; Liu, J.; Hu, Y.; Wang, J.; Lu, L.; Wang, F. Association between Ambient Particulate Matter and Hospitalization for Anxiety in China: A Multicity Case-Crossover Study. Int. J. Hyg. Environ. Health 2020, 223, 171–178. [Google Scholar] [CrossRef] [PubMed]
  22. Hwang, I.Y.; Choi, D.; Kim, J.A.; Choi, S.; Chang, J.; Goo, A.J.; Ko, A.; Lee, G.; Kim, K.H.; Son, J.S.; et al. Association of Short-Term Particulate Matter Exposure with Suicide Death among Major Depressive Disorder Patients: A Time-Stratified Case-Crossover Analysis. Sci. Rep. 2022, 12, 8471. [Google Scholar] [CrossRef]
  23. Chirico, F.; Magnavita, N. Letter to the Editor (January 1, 2019) Concerning the Paper “Impact of Air Pollution on Depression and Suicide”. Int. J. Occup. Med. Environ. Health 2019, 32, 413–414. [Google Scholar] [CrossRef] [PubMed]
  24. Gładka, A.; Rymaszewska, J.; Zatoński, T. Impact of Air Pollution on Depression and Suicide. Int. J. Occup. Med. Environ. Health 2018, 31, 711–721. [Google Scholar] [CrossRef] [PubMed]
  25. Zanobetti, A.; Redline, S.; Schwartz, J.; Rosen, D.; Patel, S.; O’Connor, G.T.; Lebowitz, M.; Coull, B.A.; Gold, D.R. Associations of PM10 with Sleep and Sleep-Disordered Breathing in Adults from Seven U.S. Urban Areas. Am. J. Respir. Crit. Care medicine 2010, 182, 819–825. [Google Scholar] [CrossRef]
  26. Yu, H.; Chen, P.; Paige Gordon, S.; Yu, M.; Wang, Y. The Association between Air Pollution and Sleep Duration: A Cohort Study of Freshmen at a University in Beijing, China. Int. J. Environ. Res. Public Health 2019, 16, 3362. [Google Scholar] [CrossRef]
  27. Abou-khadra, M. Association between PM^sub 10^ Exposure and Sleep of Egyptian School Children. Sleep Breath. 2013, 17, 653. [Google Scholar] [CrossRef]
  28. Xu, J.; Zhou, J.; Luo, P.; Mao, D.; Xu, W.; Nima, Q.; Cui, C.; Yang, S.; Ao, L.; Wu, J.; et al. Associations of Long-Term Exposure to Ambient Air Pollution and Physical Activity with Insomnia in Chinese Adults. Sci. Total Environ. 2021, 792, 148197. [Google Scholar] [CrossRef]
  29. Tiseo, C.; Vacca, A.; Felbush, A.; Filimonova, T.; Gai, A.; Glazyrina, T.; Hubalek, I.A.; Marchenko, Y.; Overeem, L.H.; Piroso, S.; et al. Migraine and Sleep Disorders: A Systematic Review. J. Headache Pain 2020, 21, 126. [Google Scholar] [CrossRef]
  30. Zhou, F.; Li, S.; Xu, H. Insomnia, Sleep Duration, and Risk of Anxiety: A Two-Sample Mendelian Randomization Study. J. Psychiatr. Res. 2022, 155, 219–225. [Google Scholar] [CrossRef]
  31. Riemann, D.; Krone, L.B.; Wulff, K.; Nissen, C. Sleep, Insomnia, and Depression. Neuropsychopharmacology 2020, 45, 74–89. [Google Scholar] [CrossRef] [PubMed]
  32. Li, L.; Wu, C.; Gan, Y.; Qu, X.; Lu, Z. Insomnia and the Risk of Depression: A Meta-Analysis of Prospective Cohort Studies. BMC Psychiatry 2016, 16, 375. [Google Scholar] [CrossRef] [PubMed]
  33. Baglioni, C.; Battagliese, G.; Feige, B.; Spiegelhalder, K.; Nissen, C.; Voderholzer, U.; Lombardo, C.; Riemann, D. Insomnia as a Predictor of Depression: A Meta-Analytic Evaluation of Longitudinal Epidemiological Studies. J. Affect. Disord. 2011, 135, 10–19. [Google Scholar] [CrossRef] [PubMed]
  34. Bai, K.; Chuang, K.; Chen, C.; Jhan, M.; Hsiao, T.; Cheng, T.; Chang, L.; Chang, T.; Chuang, H. Microglial Activation and Inflammation Caused by Traffic-Related Particulate Matter. Chem.-Biol. Interact. 2019, 311, 108762. [Google Scholar] [CrossRef]
  35. Kafu-Quvane, B.; Mlaba, S. Assessing the Impact of Quarrying as an Environmental Ethic Crisis: A Case Study of Limestone Mining in a Rural Community. Int. J. Environ. Res. Public health 2024, 21, 458. [Google Scholar] [CrossRef]
  36. Ammons, S.; Aja, H.; Ghazarian, A.A.; Lai, G.Y.; Ellison, G.L. Perception of Worry of Harm from Air Pollution: Results from the Health Information National Trends Survey (HINTS). BMC Public Health 2022, 22, 1–1254. [Google Scholar] [CrossRef]
  37. Boluda-Verdú, I.; Senent-Valero, M.; Casas-Escolano, M.; Matijasevich, A.; Pastor-Valero, M. Fear for the Future: Eco-Anxiety and Health Implications, a Systematic Review. J. Environ. Psychol. 2022, 84, 101904. [Google Scholar] [CrossRef]
  38. Bellani, L.; Ceolotto, S.; Elsner, B.; Pestel, N. The Political Fallout of Air Pollution. Proc. Natl. Acad. Sci. USA 2024, 121, e2314428121. [Google Scholar] [CrossRef]
  39. Celic, J.; Valcic, S.; Bistrovic, M. Air Pollution from Cruise Ships. In Proceedings of the Proceedings ELMAR-2014, Zadar, Croatia, 10–12 September 2014; pp. 1–4. [Google Scholar] [CrossRef]
  40. Poplawski, K.; Setton, E.; McEwen, B.; Hrebenyk, D.; Graham, M.; Keller, P. Impact of Cruise Ship Emissions in Victoria, BC, Canada. Atmos. Environ. (1994) 2011, 45, 824–833. [Google Scholar] [CrossRef]
  41. Simonsen, M.; Gössling, S.; Walnum, H.J. Cruise Ship Emissions in Norwegian Waters: A Geographical Analysis. J. Transp. Geogr. 2019, 78, 87–97. [Google Scholar] [CrossRef]
  42. Lloret, J.; Carreño, A.; Carić, H.; San, J.; Fleming, L.E. Environmental and Human Health Impacts of Cruise Tourism: A Review. Mar. Pollut. Bull. 2021, 173, 112979. [Google Scholar] [CrossRef]
  43. Johansson, C.; Norman, M.; Gidhagen, L. Spatial & Temporal Variations of PM10 and Particle Number Concentrations in Urban Air. Environ. Monit. Assess. 2007, 127, 477–487. [Google Scholar] [PubMed]
  44. Furberg, A.; Arvidsson, R.; Molander, S. Live and Let Die? Life Cycle Human Health Impacts from the use of Tire Studs. Int. J. Environ. Res. Public Health 2018, 15, 1774. [Google Scholar] [CrossRef] [PubMed]
  45. Guðmundsson, G.; Finnbjörnsdóttir, R.G.; Jóhannsson, Þ.; Rafnsson, V. Loftmengun Á Íslandi Og Áhrif Hennar Á Heilsu Manna. Laeknabladid 2019, 2019, 443–452. [Google Scholar] [CrossRef]
  46. Fridriksson, J.; Wise, N.; Scott, P. Iceland’s Bourgeoning Cruise Industry: An Economic Opportunity or a Local Threat? Local Econ. 2020, 35, 143–154. [Google Scholar] [CrossRef]
  47. Environmental Agency Iceland. Air Quality Information System Iceland; Environmental Agency Iceland: Reykjavik, Iceland, 2024. [Google Scholar]
  48. Icelandic Tourist Board. Skemmtiferðaskip; Icelandic Tourist Board: Reykjavik, Iceland, 2023. [Google Scholar]
  49. Harbour Akureyri. Cruise Ships Arrivals Table Akureyri; Harbour Akureyri: Akureyri, Iceland, 2024. [Google Scholar]
  50. Waters, A.R.; Warner, E.L.; Vaca Lopez, P.L.; Kirchhoff, A.C.; Ou, J.Y. Perceptions and Knowledge of Air Pollution and its Health Effects among Caregivers of Childhood Cancer Survivors: A Qualitative Study. BMC Cancer 2021, 21, 1070. [Google Scholar] [CrossRef]
  51. Chen, Y.; Liu, X. Determinants of Beijing Residents’ Intentions to Take Protective Behaviors Against Smog: An Application of the Health Belief Model. Health Commun. 2023, 38, 447–459. [Google Scholar] [CrossRef]
  52. D’Antoni, D.; Auyeung, V.; Walton, H.; Fuller, G.W.; Grieve, A.; Weinman, J. The Effect of Evidence and Theory-Based Health Advice Accompanying Smartphone Air Quality Alerts on Adherence to Preventative Recommendations during Poor Air Quality Days: A Randomised Controlled Trial. Environ. Int. 2019, 124, 216–235. [Google Scholar] [CrossRef] [PubMed]
  53. Kheirbek, I.; Haney, J.; Douglas, S.; Ito, K.; Caputo, S.; Matte, T. The Public Health Benefits of Reducing Fine Particulate Matter through Conversion to Cleaner Heating Fuels in New York City. Environ. Sci. Technol. 2014, 48, 13573–13582. [Google Scholar] [CrossRef]
  54. Bush, K.; Kivlahan, D.R.; McDonell, M.B.; Fihn, S.D.; Bradley, K.A. The AUDIT Alcohol Consumption Questions (AUDIT-C): An Effective Brief Screening Test for Problem Drinking. Arch. Intern. Med. 1998, 158, 1789–1795. [Google Scholar] [CrossRef]
  55. Rosenthal, N.E. Seasonal Pattern Assessment Questionnaire (SPAQ). 1987. Available online: https://med-fom-ubcsad.sites.olt.ubc.ca/files/2013/11/SPAQ-SAD.pdf (accessed on 14 March 2025).
  56. Magnusson, A. Validation of the Seasonal Pattern Assessment Questionnaire (SPAQ). J. Affect. Disord. 1996, 40, 121–129. [Google Scholar] [CrossRef]
  57. Pallesen, S.; Bjorvatn, B.; Nordhus, I.H.; Sivertsen, B.; Hjørnevik, M.; Morin, C.M. A New Scale for Measuring Insomnia: The Bergen Insomnia Scale. Percept. Mot. Ski. 2008, 107, 691–706. [Google Scholar] [CrossRef]
  58. Höller, Y.; Gudjónsdottir, B.E.; Valgeirsdóttir, S.K.; Heimisson, G.T. The Effect of Age and Chronotype on Seasonality, Sleep Problems, and Mood. Psychiatry Res. 2021, 297, 113722. [Google Scholar] [CrossRef] [PubMed]
  59. Lipton, R.B.; Dodick, D.; Sadovsky, R.; Kolodner, K.; Endicott, J.; Hettiarachchi, J.; Harrison, W. A Self-Administered Screener for Migraine in Primary Care: The ID Migraine Validation Study. Neurology 2003, 61, 375–382. [Google Scholar] [CrossRef] [PubMed]
  60. Hogg, T.L.; Stanley, S.K.; O’Brien, L.V.; Wilson, M.S.; Watsford, C.R. The Hogg Eco-Anxiety Scale: Development and Validation of a Multidimensional Scale. Glob. Environ. Change 2021, 71, 102391. [Google Scholar] [CrossRef]
  61. World Health Organization. WHO Global Air Quality Guidelines: Particulate Matter (PM2.5 and PM10), Ozone, Nitrogen Dioxide, Sulfur Dioxide and Carbon Monoxide; WHO: Geneva, Switzerland, 2021. [Google Scholar]
  62. Bergstra, A.D.; Brunekreef, B.; Burdorf, A. The Mediating Role of Risk Perception in the Association between Industry-Related Air Pollution and Health. PLoS ONE 2018, 13, e0196783. [Google Scholar] [CrossRef]
  63. United States Environmental Protection Agency; Office of Air and Radiation; U.S. Consumer Product Safety Commission. The Inside Story: A Guide to Indoor Air Quality. Available online: https://www.epa.gov/indoor-air-quality-iaq/inside-story-guide-indoor-air-quality (accessed on 14 March 2025).
  64. Óskarsson, F.; St. Ásgeirsdóttir, R. Radon in Icelandic Cold Groundwater and Low-Temperature Geothermal Water. Procedia Earth Planet. Sci. 2017, 17, 229–232. [Google Scholar] [CrossRef]
  65. Statistics Iceland, H.I. Iceland among Countries with Fewest Smokers; Statistics Iceland: Reykjavik, Iceland, 2017. [Google Scholar]
  66. Sigurjónsson, B.Þ. The Relationship between Housing Dampness and Mold and Self-Assessed Health. Master’s Thesis, Health Economics at the Faculty of Economics, School of Social Sciences, University of Iceland, Reykjavik, Iceland, 2016. [Google Scholar]
  67. Carlsen, H.K.; Ilyinskaya, E.; Baxter, P.J.; Schmidt, A.; Thorsteinsson, T.; Pfeffer, M.A.; Barsotti, S.; Dominici, F.; Finnbjornsdottir, R.G.; Jóhannsson, T.; et al. Increased Respiratory Morbidity Associated with Exposure to a Mature Volcanic Plume from a Large Icelandic Fissure Eruption. Nat. Commun. 2021, 12, 2161. [Google Scholar] [CrossRef]
  68. Kaufman, A.R.; Twesten, J.E.; Suls, J.; McCaul, K.D.; Ostroff, J.S.; Ferrer, R.A.; Brewer, N.T.; Cameron, L.D.; Halpern-Felsher, B.; Hay, J.L.; et al. Measuring Cigarette Smoking Risk Perceptions. Nicotine Tob. Res. 2020, 22, 1937–1945. [Google Scholar] [CrossRef]
  69. Do, E.K.; Fallavollita, W.L.; Bonat, B.; Fugate-Laus, K.; Rossi, B.C.; Fuemmeler, B.F. Student Attitudes Toward Tobacco use and Tobacco Policies on College Campuses. J. Community Health 2020, 45, 751–760. [Google Scholar] [CrossRef]
  70. Gany, F.; Bari, S.; Prasad, L.; Leng, J.; Lee, T.; Thurston, G.D.; Gordon, T.; Acharya, S.; Zelikoff, J.T. Perception and Reality of Particulate Matter Exposure in New York City Taxi Drivers. J. Expo. Sci. Environ. Epidemiol. 2017, 27, 221–226. [Google Scholar] [CrossRef]
  71. Reames, T.G.; Bravo, M.A. People, Place and Pollution: Investigating Relationships between Air Quality Perceptions, Health Concerns, Exposure, and Individual- and Area-Level Characteristics. Environ. Int. 2019, 122, 244–255. [Google Scholar] [CrossRef]
  72. Nikolopoulou, M.; Kleissl, J.; Linden, P.F.; Lykoudis, S. Pedestrians’ Perception of Environmental Stimuli through Field Surveys: Focus on Particulate Pollution. Sci. Total Environ. 2011, 409, 2493–2502. [Google Scholar] [CrossRef] [PubMed]
  73. Tilt, B. Perceptions of Risk from Industrial Pollution in China: A Comparison of Occupational Groups. Hum. Organ. 2006, 65, 115–127. [Google Scholar] [CrossRef]
  74. Félag Íslenskra Bifreiðaeigenda. Vetrardekkja Könnun FÍB; Félag Íslenskra Bifreiðaeigenda: Reykjavik, Iceland, 2021. [Google Scholar]
  75. Brody, S.D.; Peck, B.M.; Highfield, W.E. Examining Localized Patterns of Air Quality Perception in Texas: A Spatial and Statistical Analysis. Risk Anal. 2004, 24, 1561–1574. [Google Scholar] [CrossRef]
  76. Boso, À.; Álvarez, B.; Oltra, C.; Garrido, J.; Muñoz, C.; Hofflinger, Á. Out of Sight, Out of Mind: Participatory Sensing for Monitoring Indoor Air Quality. Environ. Monit. Assess. 2020, 192, 104. [Google Scholar] [CrossRef]
  77. Christodoulou, N.; Laaidi, K.; Geoffroy, P.A. Eco-Anxiety: Towards a Medical Model and the New Framework of Ecolalgia. Bipolar Disord. 2024, 26, 532–547. [Google Scholar] [CrossRef]
  78. Muthuraman, K.; Sankaran, A.; Subramanian, K. Association between Sleep-Related Cognitions, Sleep-Related Behaviors, and Insomnia in Patients with Anxiety and Depression: A Cross-Sectional Study. Indian J. Psychol. Med. 2024, 46, 228–237. [Google Scholar] [CrossRef]
  79. Olatunji, B.O.; Knowles, K.A.; Cox, R.C.; Cole, D.A. Linking Repetitive Negative Thinking and Insomnia Symptoms: A Longitudinal Trait-State Model. J. Anxiety Disord. 2023, 97, 102732. [Google Scholar] [CrossRef]
  80. Peres, M.F.P.; Mercante, J.P.P.; Tobo, P.R.; Kamei, H.; Bigal, M.E. Anxiety and Depression Symptoms and Migraine: A Symptom-Based Approach Research. J. Headache Pain 2017, 18, 37. [Google Scholar] [CrossRef] [PubMed]
  81. Han, L.; Wang, K.; Cheng, Y.; Du, Z.; Rosenthal, N.E.; Primeau, F. Summer and Winter Patterns of Seasonality in Chinese College Students: A Replication. Compr. Psychiatry 2000, 41, 57–62. [Google Scholar] [CrossRef] [PubMed]
  82. Rosenthal, N.E.; Sack, D.A.; Gillin, J.C.; Lewy, A.J.; Goodwin, F.K.; Davenport, Y.; Mueller, P.S.; Newsome, D.A.; Wehr, T.A. Seasonal Affective Disorder: A Description of the Syndrome and Preliminary Findings with Light Therapy. Arch. Gen. Psychiatry 1984, 41, 72–80. [Google Scholar] [CrossRef] [PubMed]
  83. Kasper, S.; Wehr, T.A.; Bartko, J.J.; Gaist, P.A.; Rosenthal, N.E. Epidemiological Findings of Seasonal Changes in Mood and Behavior: A Telephone Survey of Montgomery County, Maryland. Arch. Gen. Psychiatry 1989, 46, 823–833. [Google Scholar] [PubMed]
  84. Town of Reyjavík, I. Let’s Not use Studded Tires in Reykjavík. 2024. Available online: https://reykjavik.is/en/news/2023/lets-not-use-studded-tires-reykjavik (accessed on 14 March 2025).
  85. Ólafsson, Á. Rafrænn Teljari Fylgist Með Nagladekkjanotkun Á Akureyri [Digital Monitoring of the Use of Studded Tires in Akureyri]. ruv.is 2025. Available online: https://www.ruv.is/frettir/innlent/2025-04-09-rafraenn-teljari-fylgist-med-nagladekkjanotkun-a-akureyri-441115 (accessed on 14 March 2025).
  86. Hinriksdóttir; Rakel. Lögreglan: Stutt Í Sektir Fyrir Naglana [Police: Short Time Until Studded Tires Will be Fined]. 2025. Available online: https://www.akureyri.net/is/moya/news/logreglan-stutt-i-sektir-fyrir-naglana (accessed on 14 March 2025).
  87. Stefánsson, I. Hvetja Akureyringa Til Að Skipta Út Nagladekkjunum. [Motivate Inhabitants of Akureyri to Change Studded Tires]. kaffid.is 2021. Available online: https://www.kaffid.is/hvetja-akureyringa-til-ad-skipta-ut-nagladekkjunum/ (accessed on 14 March 2025).
  88. Jósefsdóttir, S.D. Akureyringar Ósáttir Við Reykmengun: Fólk Er Komið Með Nóg [“People in Akureyri Not Satisfied with Air Pollution: “People have had enough”]. visir.is 2023. Available online: https://www.visir.is/g/20232436675d/akureyringar-osattir-vid-reykmengun-folk-er-komid-med-nog- (accessed on 14 March 2025).
  89. Filipkowski, K.B.; Smyth, J.M.; Rutchick, A.M.; Santuzzi, A.M.; Adya, M.; Petrie, K.J.; Kaptein, A.A. Do Healthy People Worry? Modern Health Worries, Subjective Health Complaints, Perceived Health, and Health Care Utilization. Int. J. Behav. Med. 2010, 17, 182–188. [Google Scholar] [CrossRef]
  90. Tane, E.G.; Amorós-Pérez, A.; Martínez-Gómez, L.; Román-Martínez, M.C.; Lillo-Ródenas, M.A. Review and Comparative Analysis of the Particulate Matter Generated in Conventional Cigarettes and Heated Tobacco Products—Mainstream and Environmental Emissions. Environ. Adv. 2024, 16, 100552. [Google Scholar] [CrossRef]
Figure 1. Extract from the environmental agency measurements of air quality located in Strandgata, 600 Akureyri, Iceland [47]. The x-axis shows the timeline from 1 January 2023 to 31 December 2023, and the y-axis shows the concentration of PM10, SO2, and NO2 in μg/m3. Line coloring corresponds to the health limits recommended by the Icelandic Environmental agency, with green representing healthy air quality, yellow bad air quality, and red health endangering air quality.
Sustainability 17 04634 g001
Figure 2. Location of air pollution measurements in the town. Magenta: School in Giljahverfi; Green: Nursery school in Giljahverfi; Blue: Busy street Glerágata/restaurant Greifinn; Yellow: Port/Eimskip; Black: Strandgata/Hof.
Sustainability 17 04634 g002
Table 1. Air pollution in recruitment timeframe.
LocationsPM2.5PM10
MeanSDMeanSD
Oddeyrin:466.26509.63611.33653.85
Port361.69409.55496564.6
Main street570.83580.38726.66722.12
Giljahverfi:174.41316242.28366.62
Nursery school148.27255.7229.92349.69
School197.07363.15252.52385.92
Particulate matter (PM) concentrations are shown in μg/m3.
Table 2. Descriptive statistics for the questionnaires used.
QuestionnaireMedianMinMaxMeanSDn Above Threshold
Seasonality: GSS40154.713.91n = 5; >10
Insomnia: BIS1004210.989.66n = 18
Migraine: MIG0030.781.04n = 5; >2
Eco-anxiety: HEAS10384.196.65-
Alcohol consumption: AUDIT-C20102.442.25n = 1; >7
Caffeine per day20102.352.02-
GSS: General seasonality score, BIS: Bergen insomnia scale, MIG: Migraine screener, HEAS: Hogg eco-anxiety scale, AUDIT-C: Alcohol Use Disorder Identification Test.
Table 3. Counts of answers to the question “How much do you worry that each of the following will harm your health?”.
ItemNot at Alla LittleSomea Lot
Outdoor air pollution1118151
Indoor air pollution261090
Air pollution from studded tires1414152
Air pollution from cruise ships138168
Table 4. Relation between worries and symptoms of seasonality, insomnia, migraine, and eco-anxiety.
Seasonality
GSS
Insomnia
BIS
Migraine
MIG
Eco-Anxiety HEASAlcohol AUDIT-CCaffeine per Day
Worries about air pollution…rhoprhoprhoprhoprhoprhop
outdoors0.090.5680.430.003 *0.370.0140.400.008−0.070.640−0.190.220
indoors0.240.1130.310.0360.570.00005 *0.300.054−0.180.261−0.080.626
from studded tires0.010.9400.250.1000.310.0390.480.001 *<0.010.987−0.050.730
from cruise ships−0.030.8810.220.1460.460.001 *0.260.088−0.060.696−0.010.960
GSS: General seasonality score, BIS: Bergen insomnia scale; MIG: Migraine-ID screener, HEAS: Hogg eco-anxiety scale; AUDIT-C: AUDIT-C: Alcohol Use Disorder Identification Test, rho: Spearman correlation coefficient; * significant at the Bonferroni-Holm corrected level.
Table 5. Counts of people (out of n = 47) indicating to feel best or worst, gain and lose the most weight, sleep the most and least, socialize the most and least, and eat the most and least for all seasons: spring (March–May), summer (June–August), fall (September–November), and winter (December–February).
ItemSpringSummerFall Winter
Feel best2236146
Feel worse611431
Gain the most weight47828
Lose the most weight1118712
Sleep most451729
Sleep less113076
Socialize more23261620
Socialize less46829
Eat most59730
Eat least9131513
Disclaimer/Publisher’s Note: The statements, opinions and data contained in all publications are solely those of the individual author(s) and contributor(s) and not of MDPI and/or the editor(s). MDPI and/or the editor(s) disclaim responsibility for any injury to people or property resulting from any ideas, methods, instructions or products referred to in the content.

