1. Introduction
Global warming is a major challenge currently facing humanity [
1], and a global consensus has indicated that the increase in the concentration of greenhouse gases, represented by carbon dioxide, is the main cause of climate warming. Accordingly, all countries have implemented energy-saving and emission-reduction measures to cope with this common challenge. With China’s carbon emissions surpassing those of the US in 2006, the former became the country with the largest carbon emissions for 14 consecutive years. China’s carbon emissions are significantly ahead of the US’, which is the second largest in the world [
2]. As China is considered the leader of developing countries, reducing this country’s carbon emissions is important for promoting the sustainable growth of the domestic economy and is an important initiative to cope with global climate change. For this reason, the Chinese government has proposed the “dual carbon” goal to achieve carbon peak before 2030 and carbon neutrality before 2060.
Due to the aforementioned background, research related to carbon emissions has become a popular topic. Numerous scholars have conducted research from multiple perspectives, and novel research findings continue to emerge: Examining how contractual mechanisms coordinate sustainable supply chains under carbon emission goals and market uncertainty [
3]. Evaluating the economic and environmental impact of carbon tax and carbon trading policies in a single-vendor single-buyer inventory model [
4]. Examining the impact of China’s new urbanization policy on urban carbon emissions [
5]. Studying how to optimize urban transport solutions for enhanced energy efficiency and reduced carbon emissions. [
6]. Predicting carbon emissions and assessing carbon reduction policies [
7]. Numerous studies show that multidimensional driver analysis and robust emission forecasting have consistently remained focal research areas in decarbonization studies [
8,
9,
10].
Transportation has become one of the major carbon emission sectors in China, currently ranking as the third-largest source of carbon emissions in the country [
11]. This sector, which accounts for 9% to 10% of the country’s total carbon emissions annually, has shown a year-on-year increase in emission proportions and has been identified as a key priority for decarbonization efforts. Meanwhile, reducing carbon emissions has also been identified as a key objective in the development of low-carbon transportation. In the research on driving factors of carbon emissions, scholars have utilized such methods as spatial correlation analysis [
12], the logarithmic mean Divisia index (LMDI) method [
13], and the stochastic impacts by regression on population, affluence, and technology (STIRPAT) model [
14] to investigate energy intensity [
15], energy structure, production input, output structure [
16], and population [
17], among others. These factors play dominant roles in carbon emissions in the transportation industry. Fan [
18] classified the influence of related factors into positive drivers, negative drivers, and general constituents according to the contribution rate of carbon emissions. For the research on carbon peak prediction, most scholars have mainly relied on the establishment of prediction models to predict the time of carbon peak and portray the path of carbon peak. Moreover, the methods commonly used by academics for carbon emission prediction mainly include the gray prediction, STIRPAT, system dynamics, and time series models. Chai et al. [
19], Yin [
20], and Wang et al. [
14] used the STIRPAT, gray prediction, and system dynamics models, respectively, to forecast carbon emissions. Among the time series models, the most commonly used is the autoregressive integrated moving average (ARIMA) model [
21].
With the vigorous development of machine learning technology, numerous new algorithms have emerged, among which the support vector machine (SVM) stands out and demonstrates significant advantages. SVM has achieved increasing usage in the engineering, environment, and computing disciplines [
22,
23,
24]. SVM, as an algorithm suitable for learning small sample data, is highly compatible with the characteristics of small sample datasets commonly used in the field of carbon emissions. At present, the SVM model has also been gradually applied to carbon emission prediction [
25,
26]. Given that the prediction accuracy of an SVM model generally depends on the proper selection of its parameters, the model must be optimized to achieve better performance compared with other models. Moreover, its strong robustness is particularly critical. This model needs to effectively deal with individual-year data anomalies caused by external factors, such as policy adjustments and economic fluctuations, thereby ensuring the stability and accuracy of predictions.
The existing literature indicates that predictive analyses on SVM models incorporating whale optimization algorithm (WOA-SVM) representations exhibit excellent performance in the engineering and agriculture fields. Zhou et al. [
27] found that the optimized WOA-SVM is the best model among all proposed models in classifying tunnel squeezing and has the highest accuracy compared with other unoptimized individual classifiers (e.g., SVM, ANN, and GP). Zhou [
28] compared the WOA-SVM model with SVM, decision tree (DT), k-nearest neighbors (KNN), and the SVM combined with the loop optimization algorithm (LOA-SVM) model. He proved that WOA-SVM has a high prediction accuracy, and that the analysis speed is fast and has good repeatability. Zhou et al. [
29] evaluated the performance of SVM and its hybrid models (i.e., PSO-SVM, WOA-SVM) for daily ET
0 estimation across China’s diverse climatic zones and found that the WOA-SVM model outperforms others with superior accuracy and efficiency. However, this method has not yet been applied in the field of carbon emission prediction.
Therefore, this study applies the WOA-SVM method to carbon emission prediction. In particular, the current study constructs the WOA-SVM model and analyzes its accuracy and applicability. The model, combined with scenario analysis, predicts carbon emission trends in Jiangsu Province’s transportation sector under low-carbon, standard, and high-carbon scenarios. This study aims to explore a high-precision prediction method and to provide methodological guidance and data support for advancing carbon measurement and reduction efforts in the transportation sector.
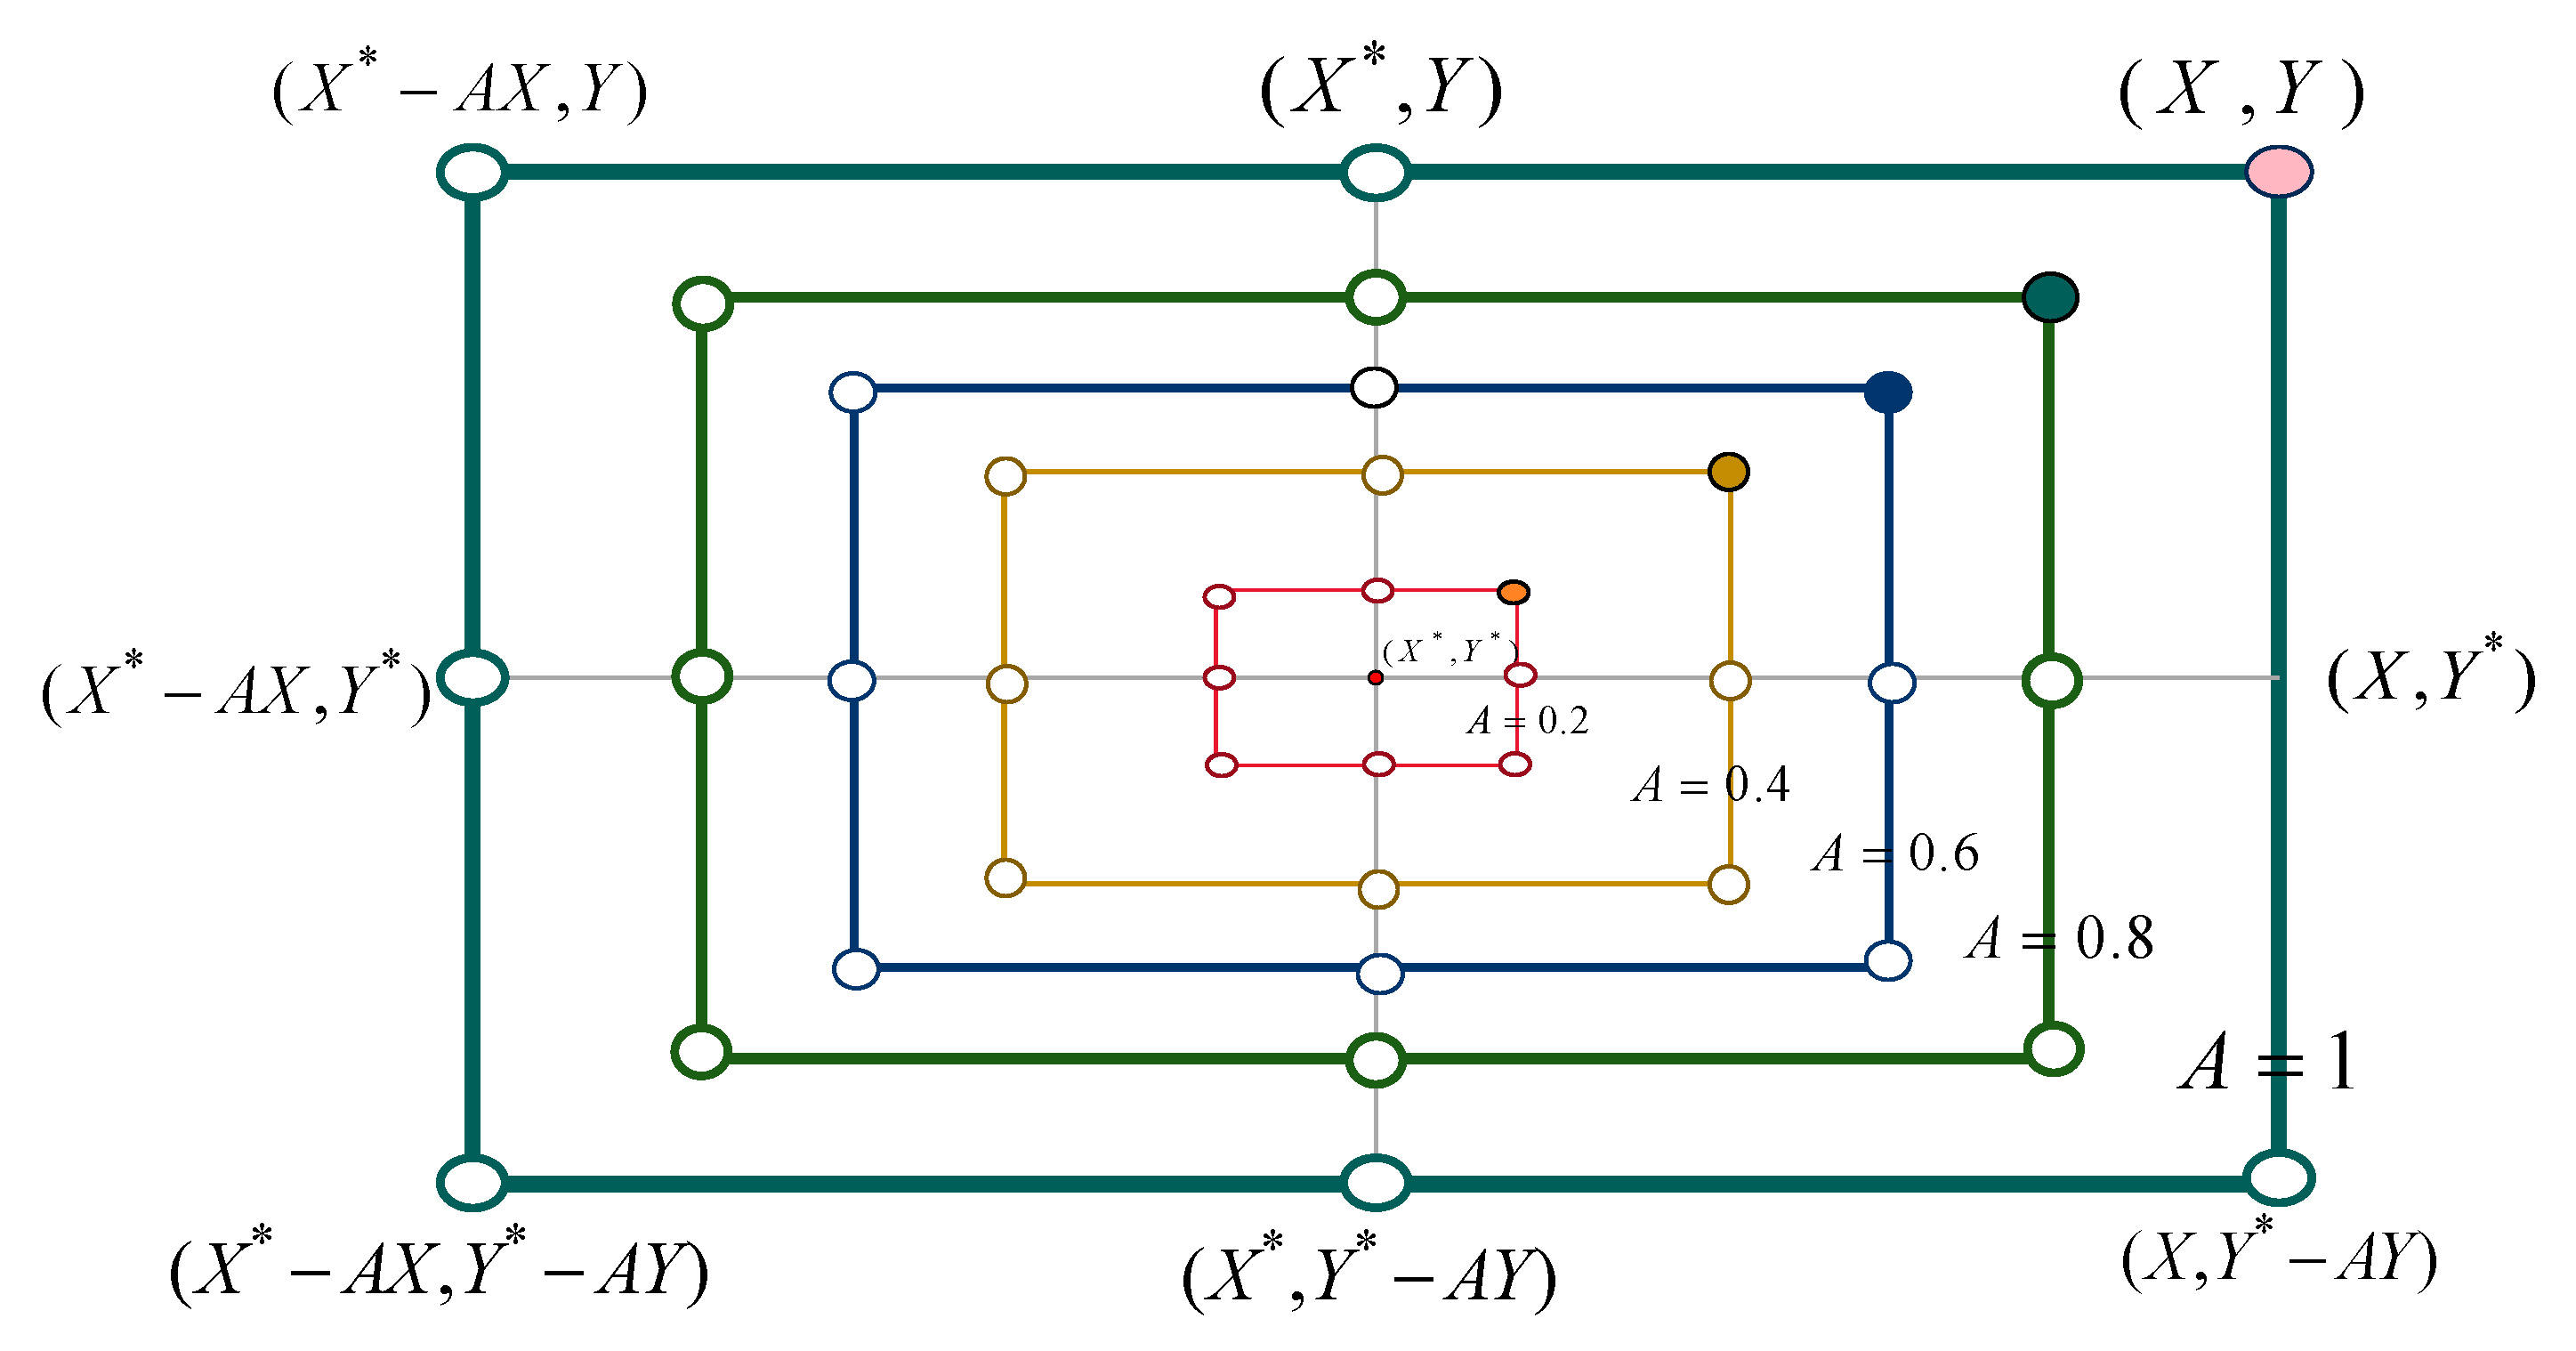
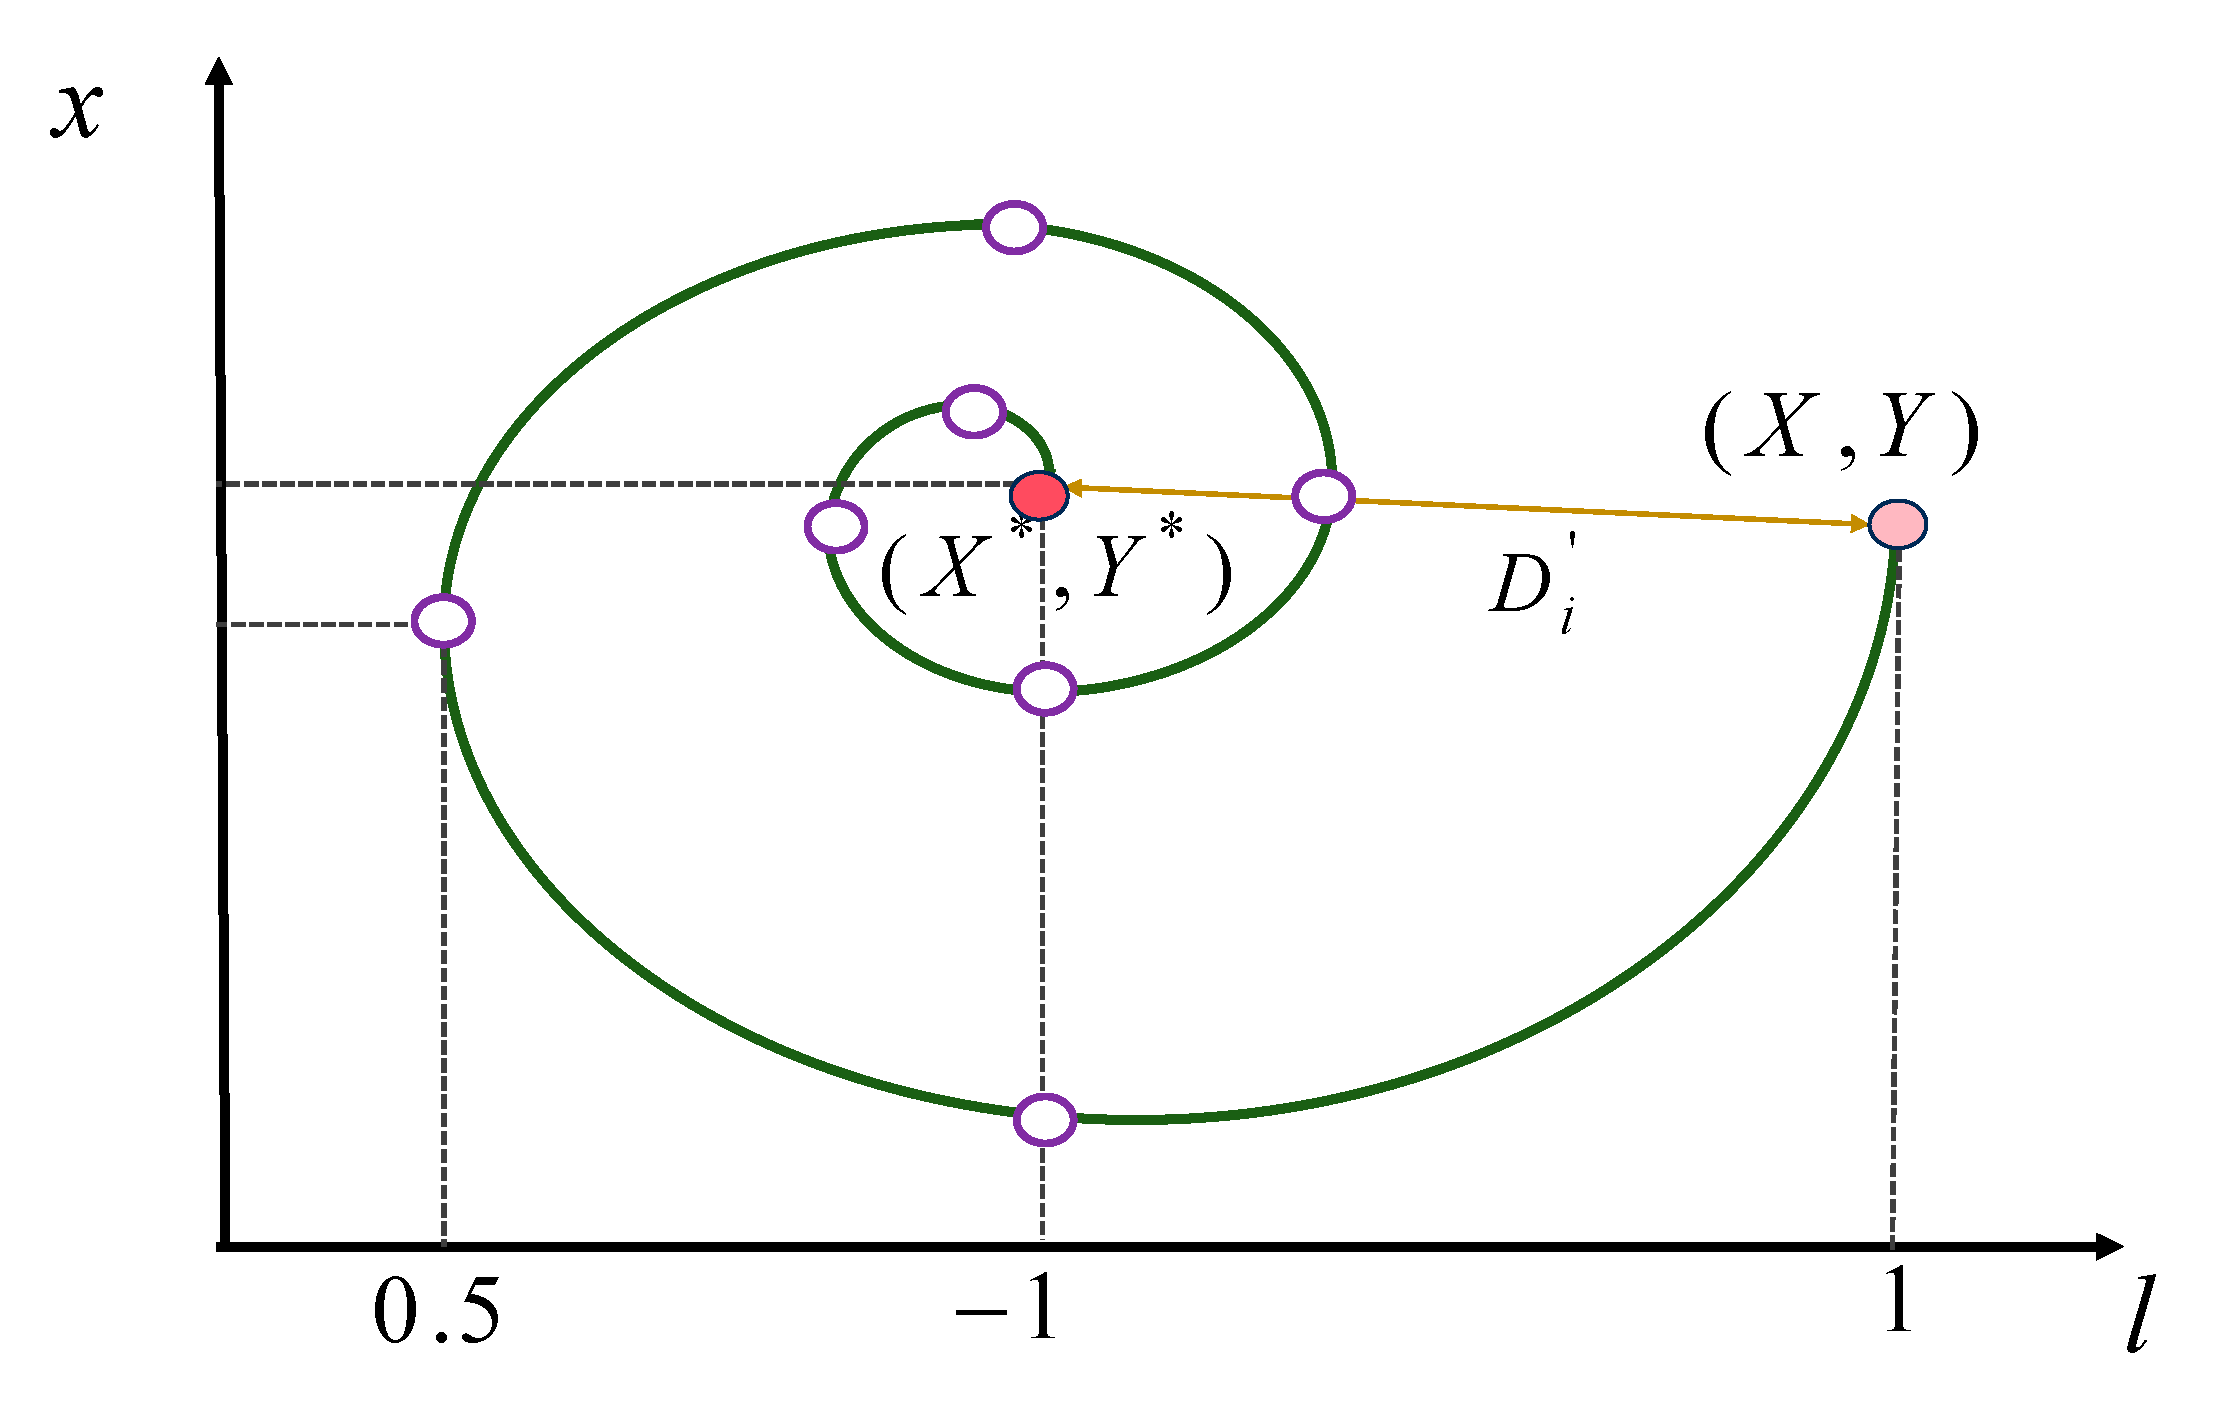
The innovative aspects and main contributions of this study are primarily reflected in the following dimensions. First, in the parameter optimization of SVM, this research abandons the traditional grid search method and pioneers the application of WOA to transportation carbon emission forecasting. This algorithm integrates the breadth of global search with the precision of local search, thereby significantly reducing the risk of converging to the local optima. Second, this research conducts comprehensive performance evaluations and compares WOA-SVM with the unoptimized SVM model, k-nearest neighbors (KNN), Gaussian process regression (GPR), and WOA-SVM models, thereby providing additional intuitive demonstrations of model reliability. Lastly, the current study provides predictions of carbon emission peak times under different scenarios, offering recommendations and references for Jiangsu Province’s transportation sector to achieve its carbon peaking and carbon neutrality goals.
5. Conclusions
This study uses the WOA-SVM prediction model to simulate the carbon emission trends under three scenarios for Jiangsu Province’s transportation industry carbon emissions and to predict the time of carbon peaking. The main conclusions of this study are as follows:
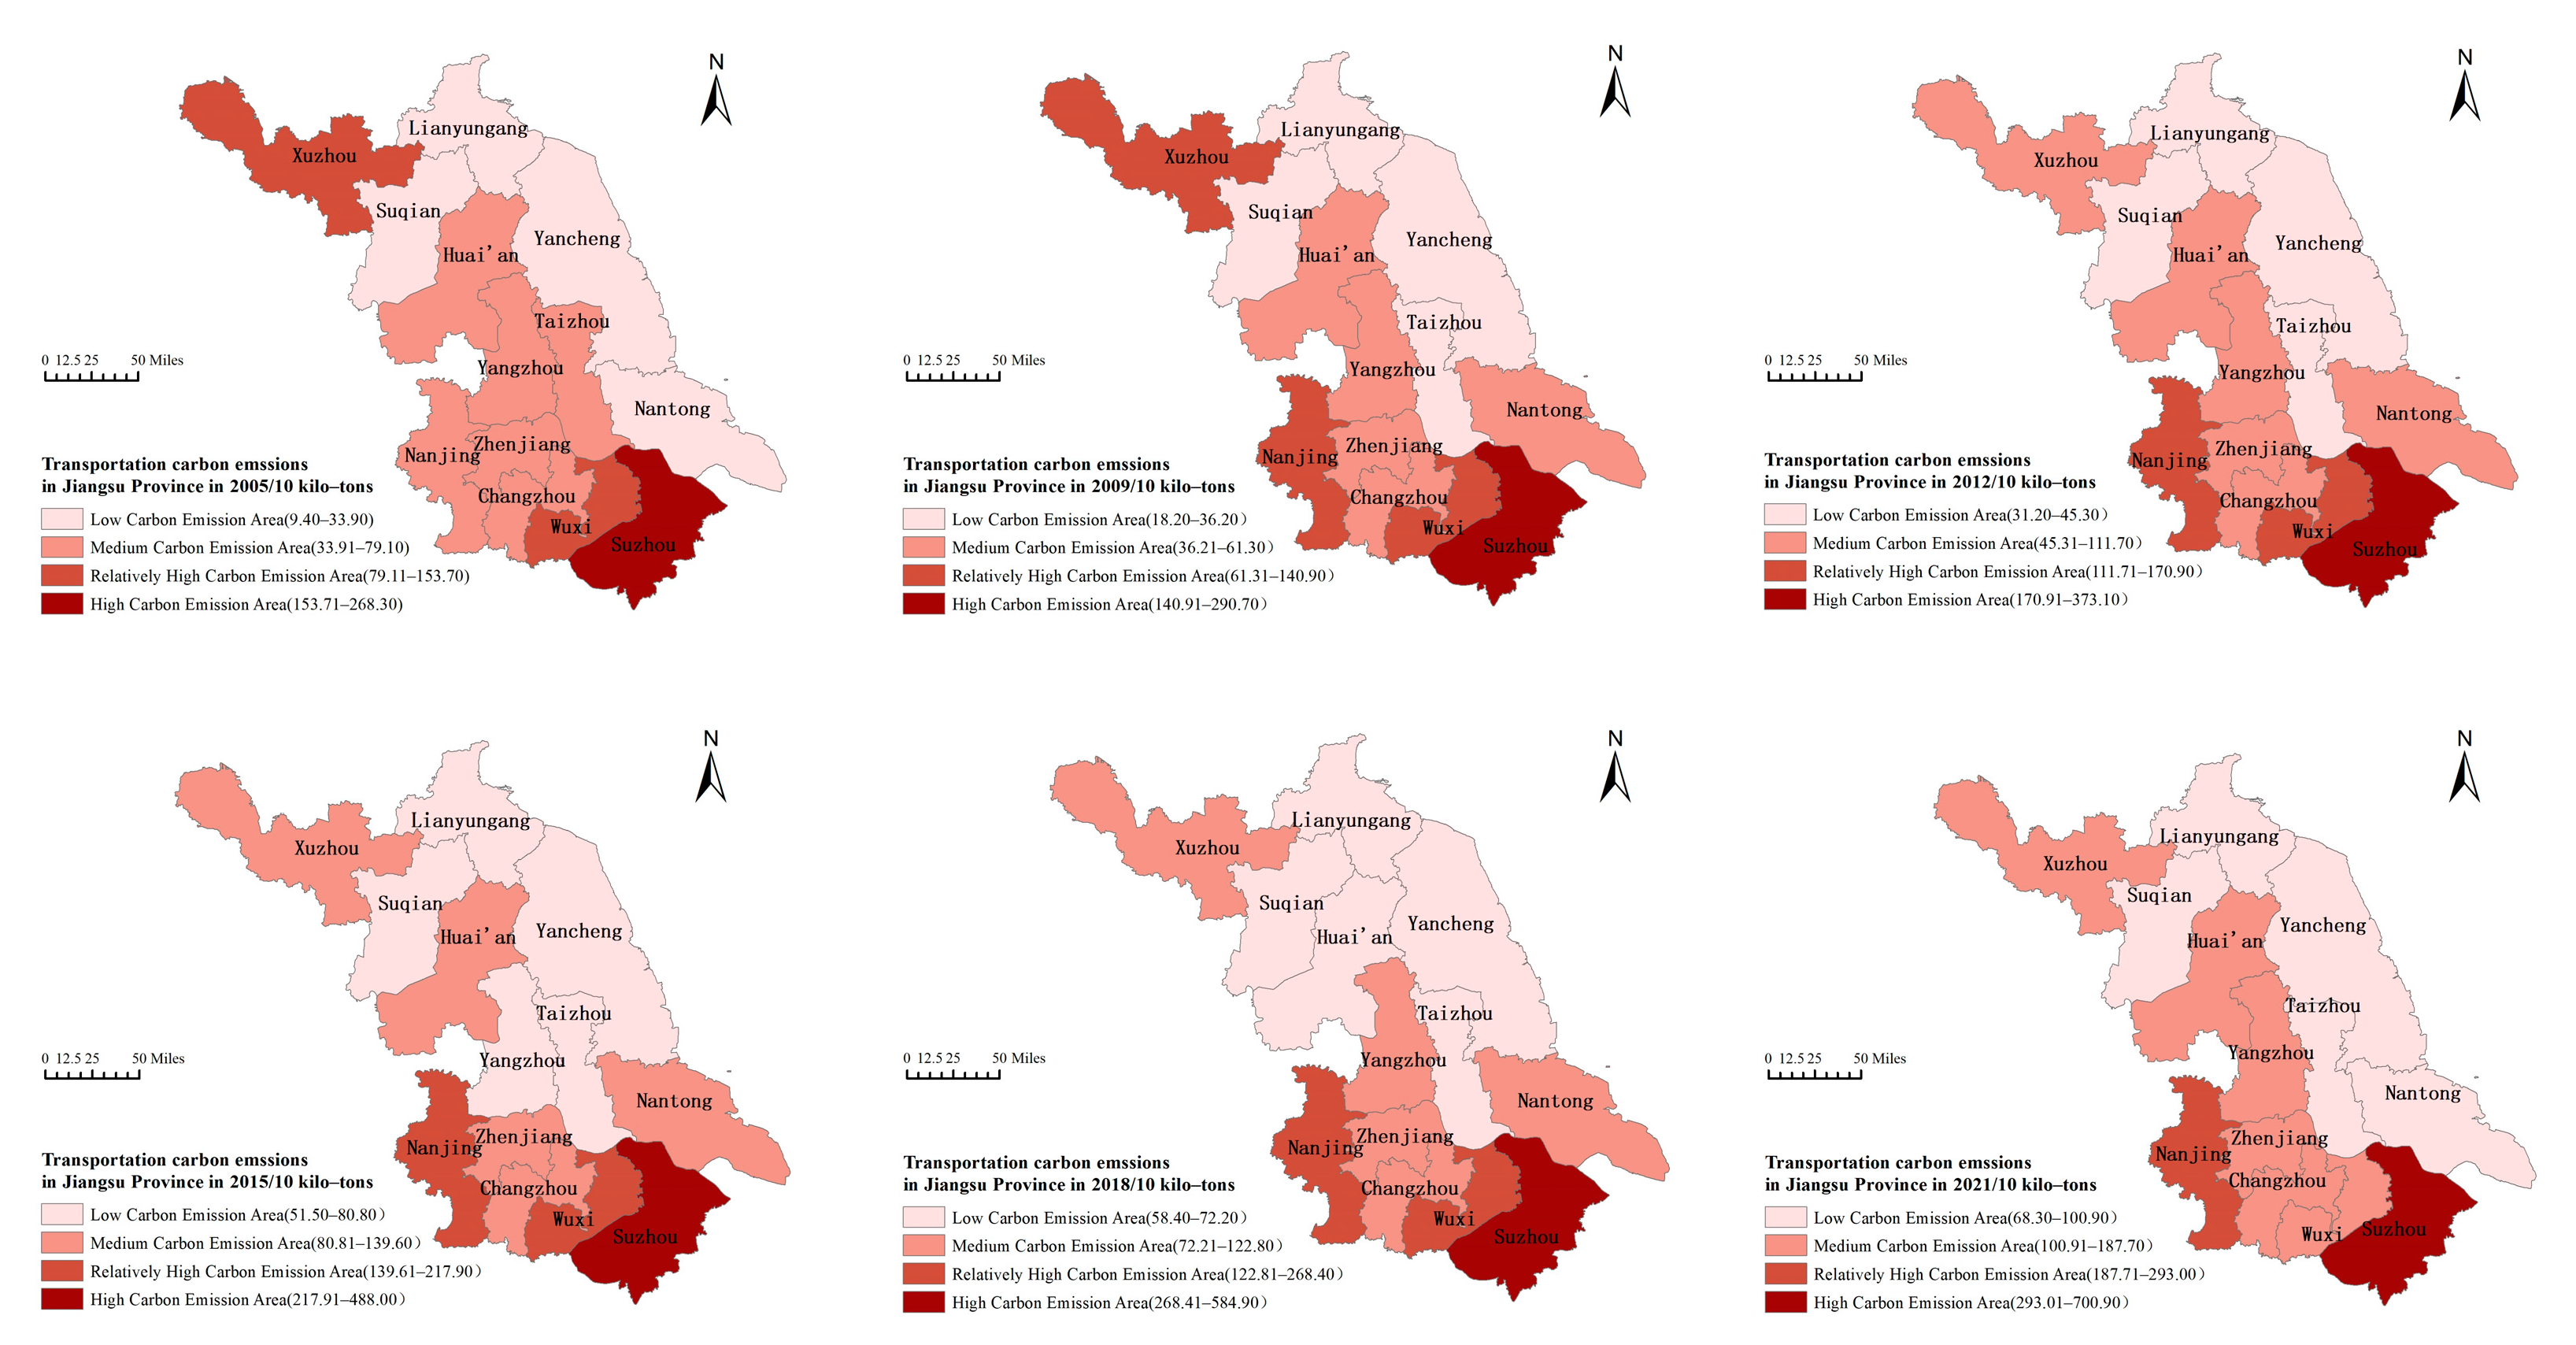
Transport carbon emissions in Jiangsu Province have maintained a continuous upward trend since 2000 but experienced fluctuations after 2019. This study utilized the STIRPAT model as a basis to select eight influencing factors for analysis and prediction since 2000: total population, per capita GDP, motor vehicle ownership, passenger turnover, cargo turnover, urbanization rate, urban green space coverage, and carbon emission intensity. To overcome the adverse effects of variable multicollinearity in the modeling process, this study used principal component analysis to decompose the original eight variables and extract the principal components to establish a regression model. Four principal components were eventually resolved, and the value is 99.628, which explains the model well.
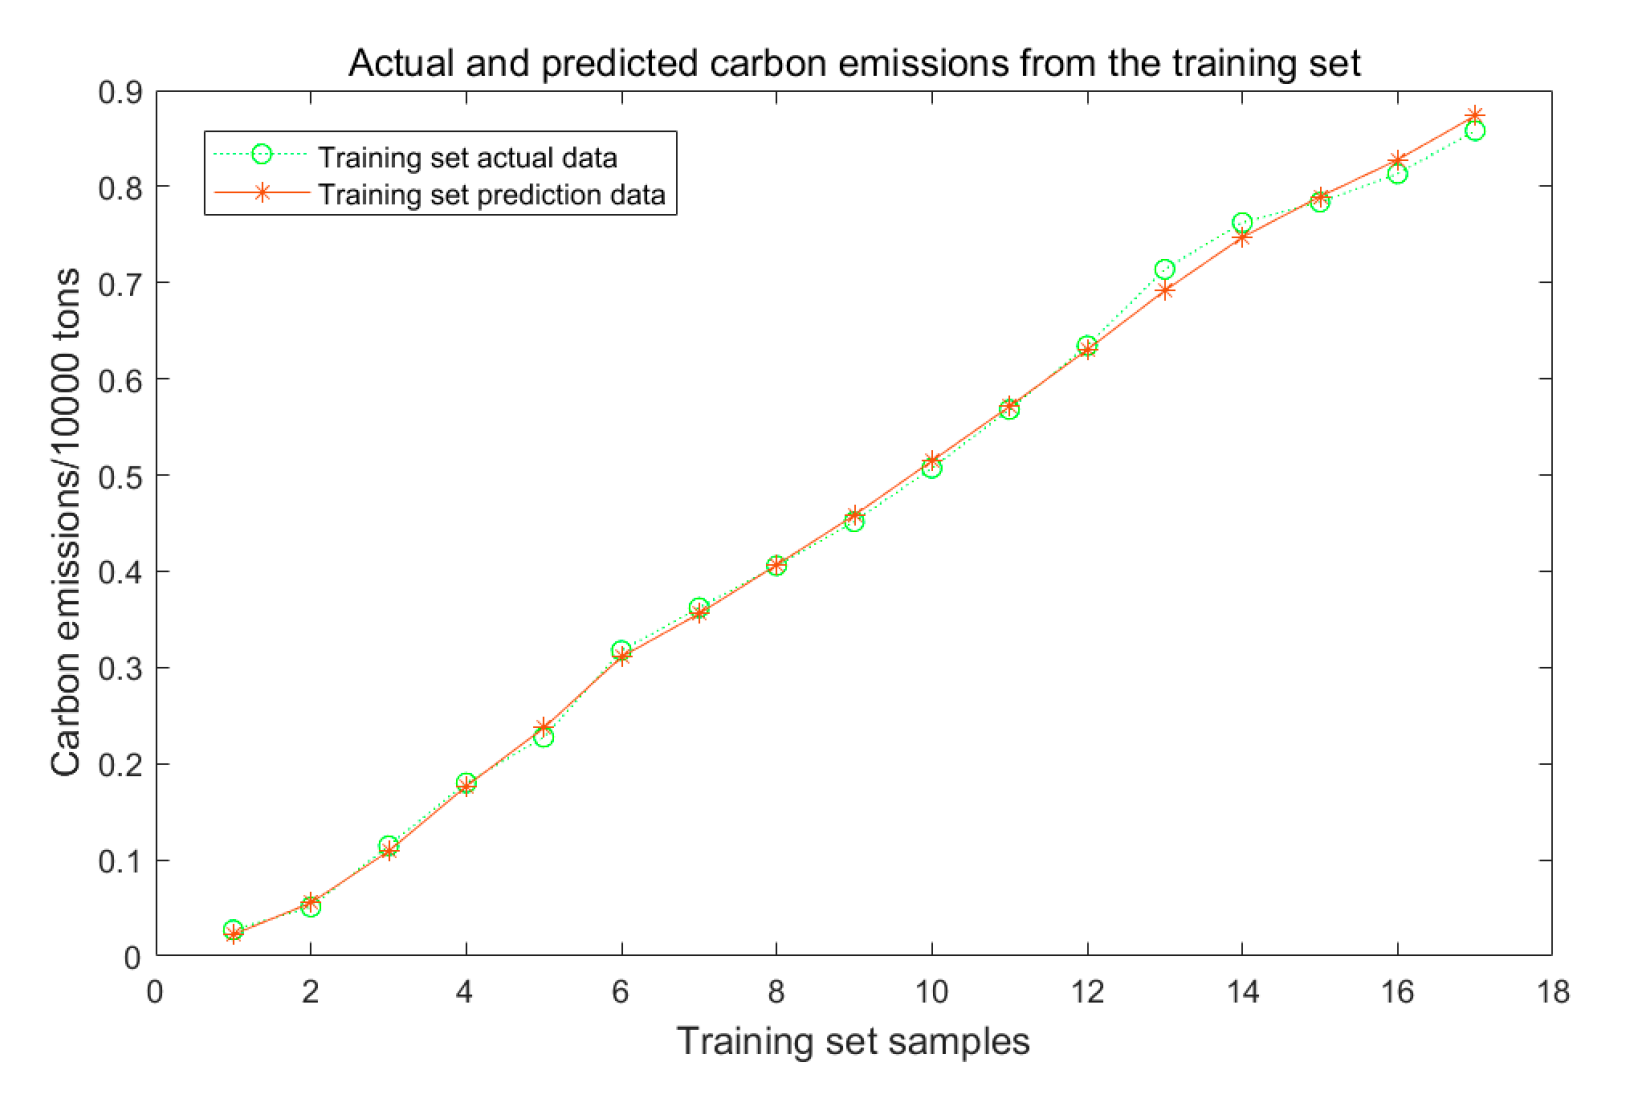
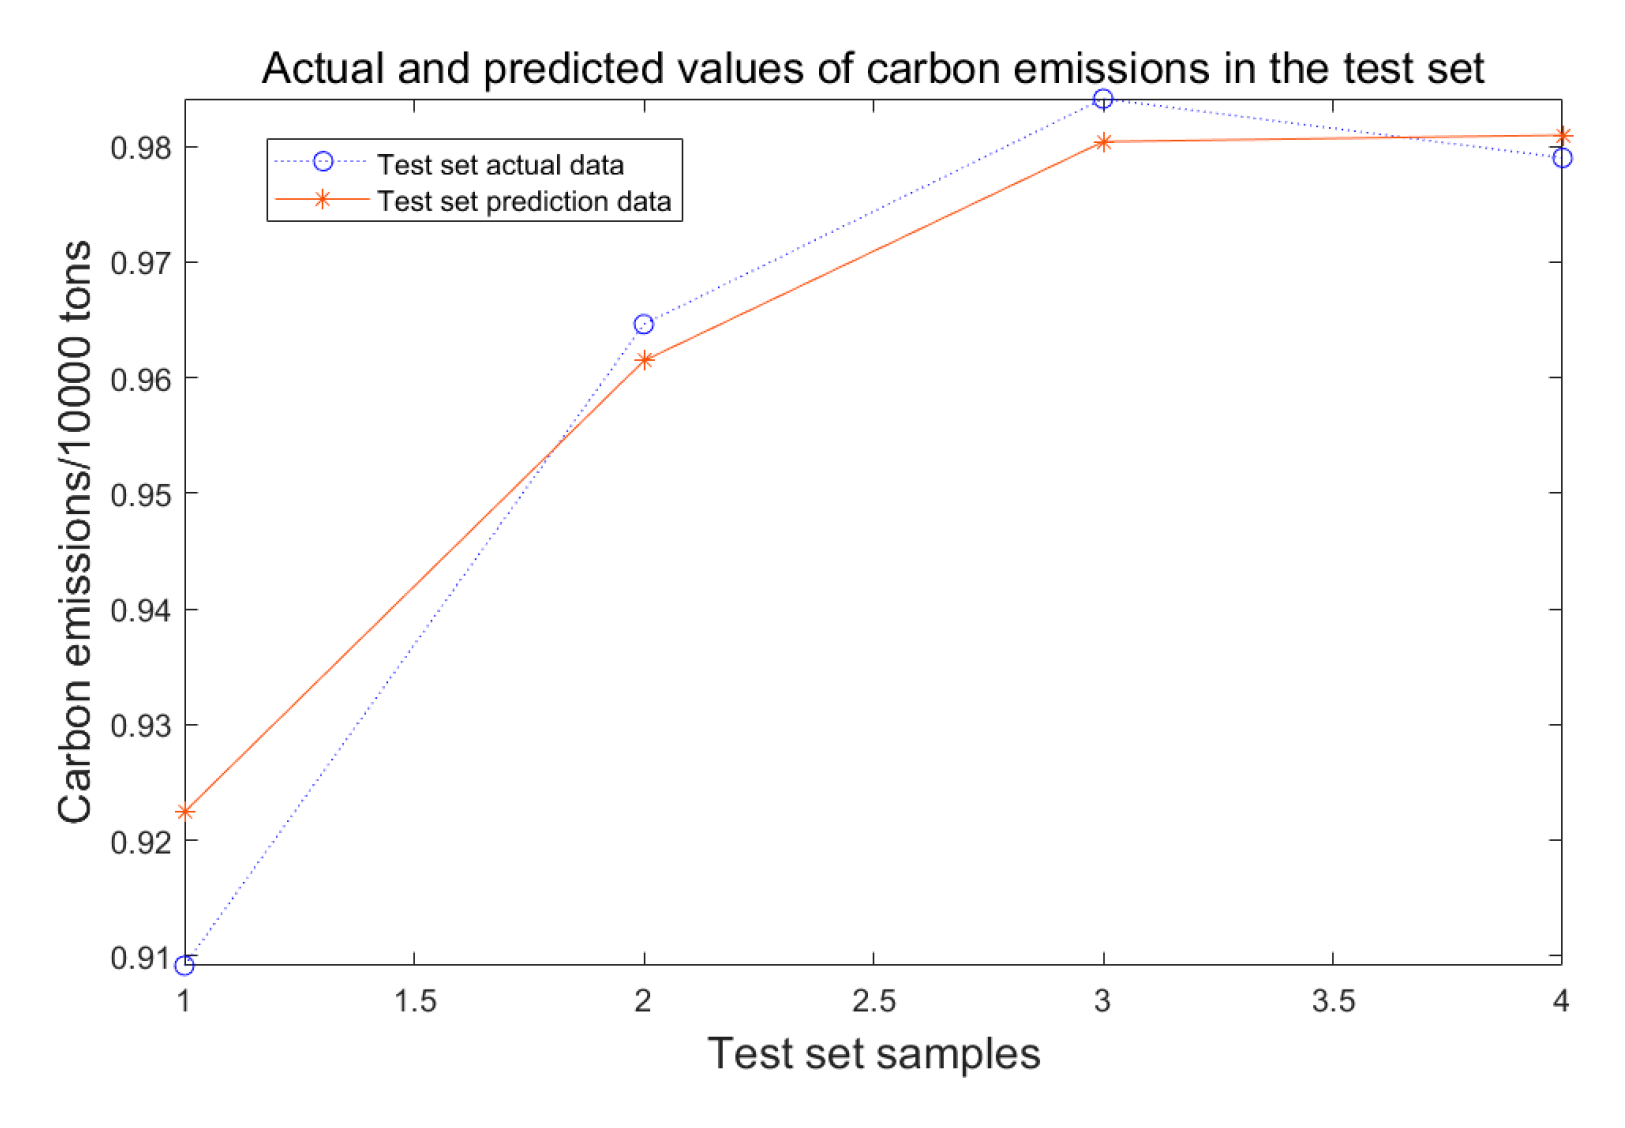
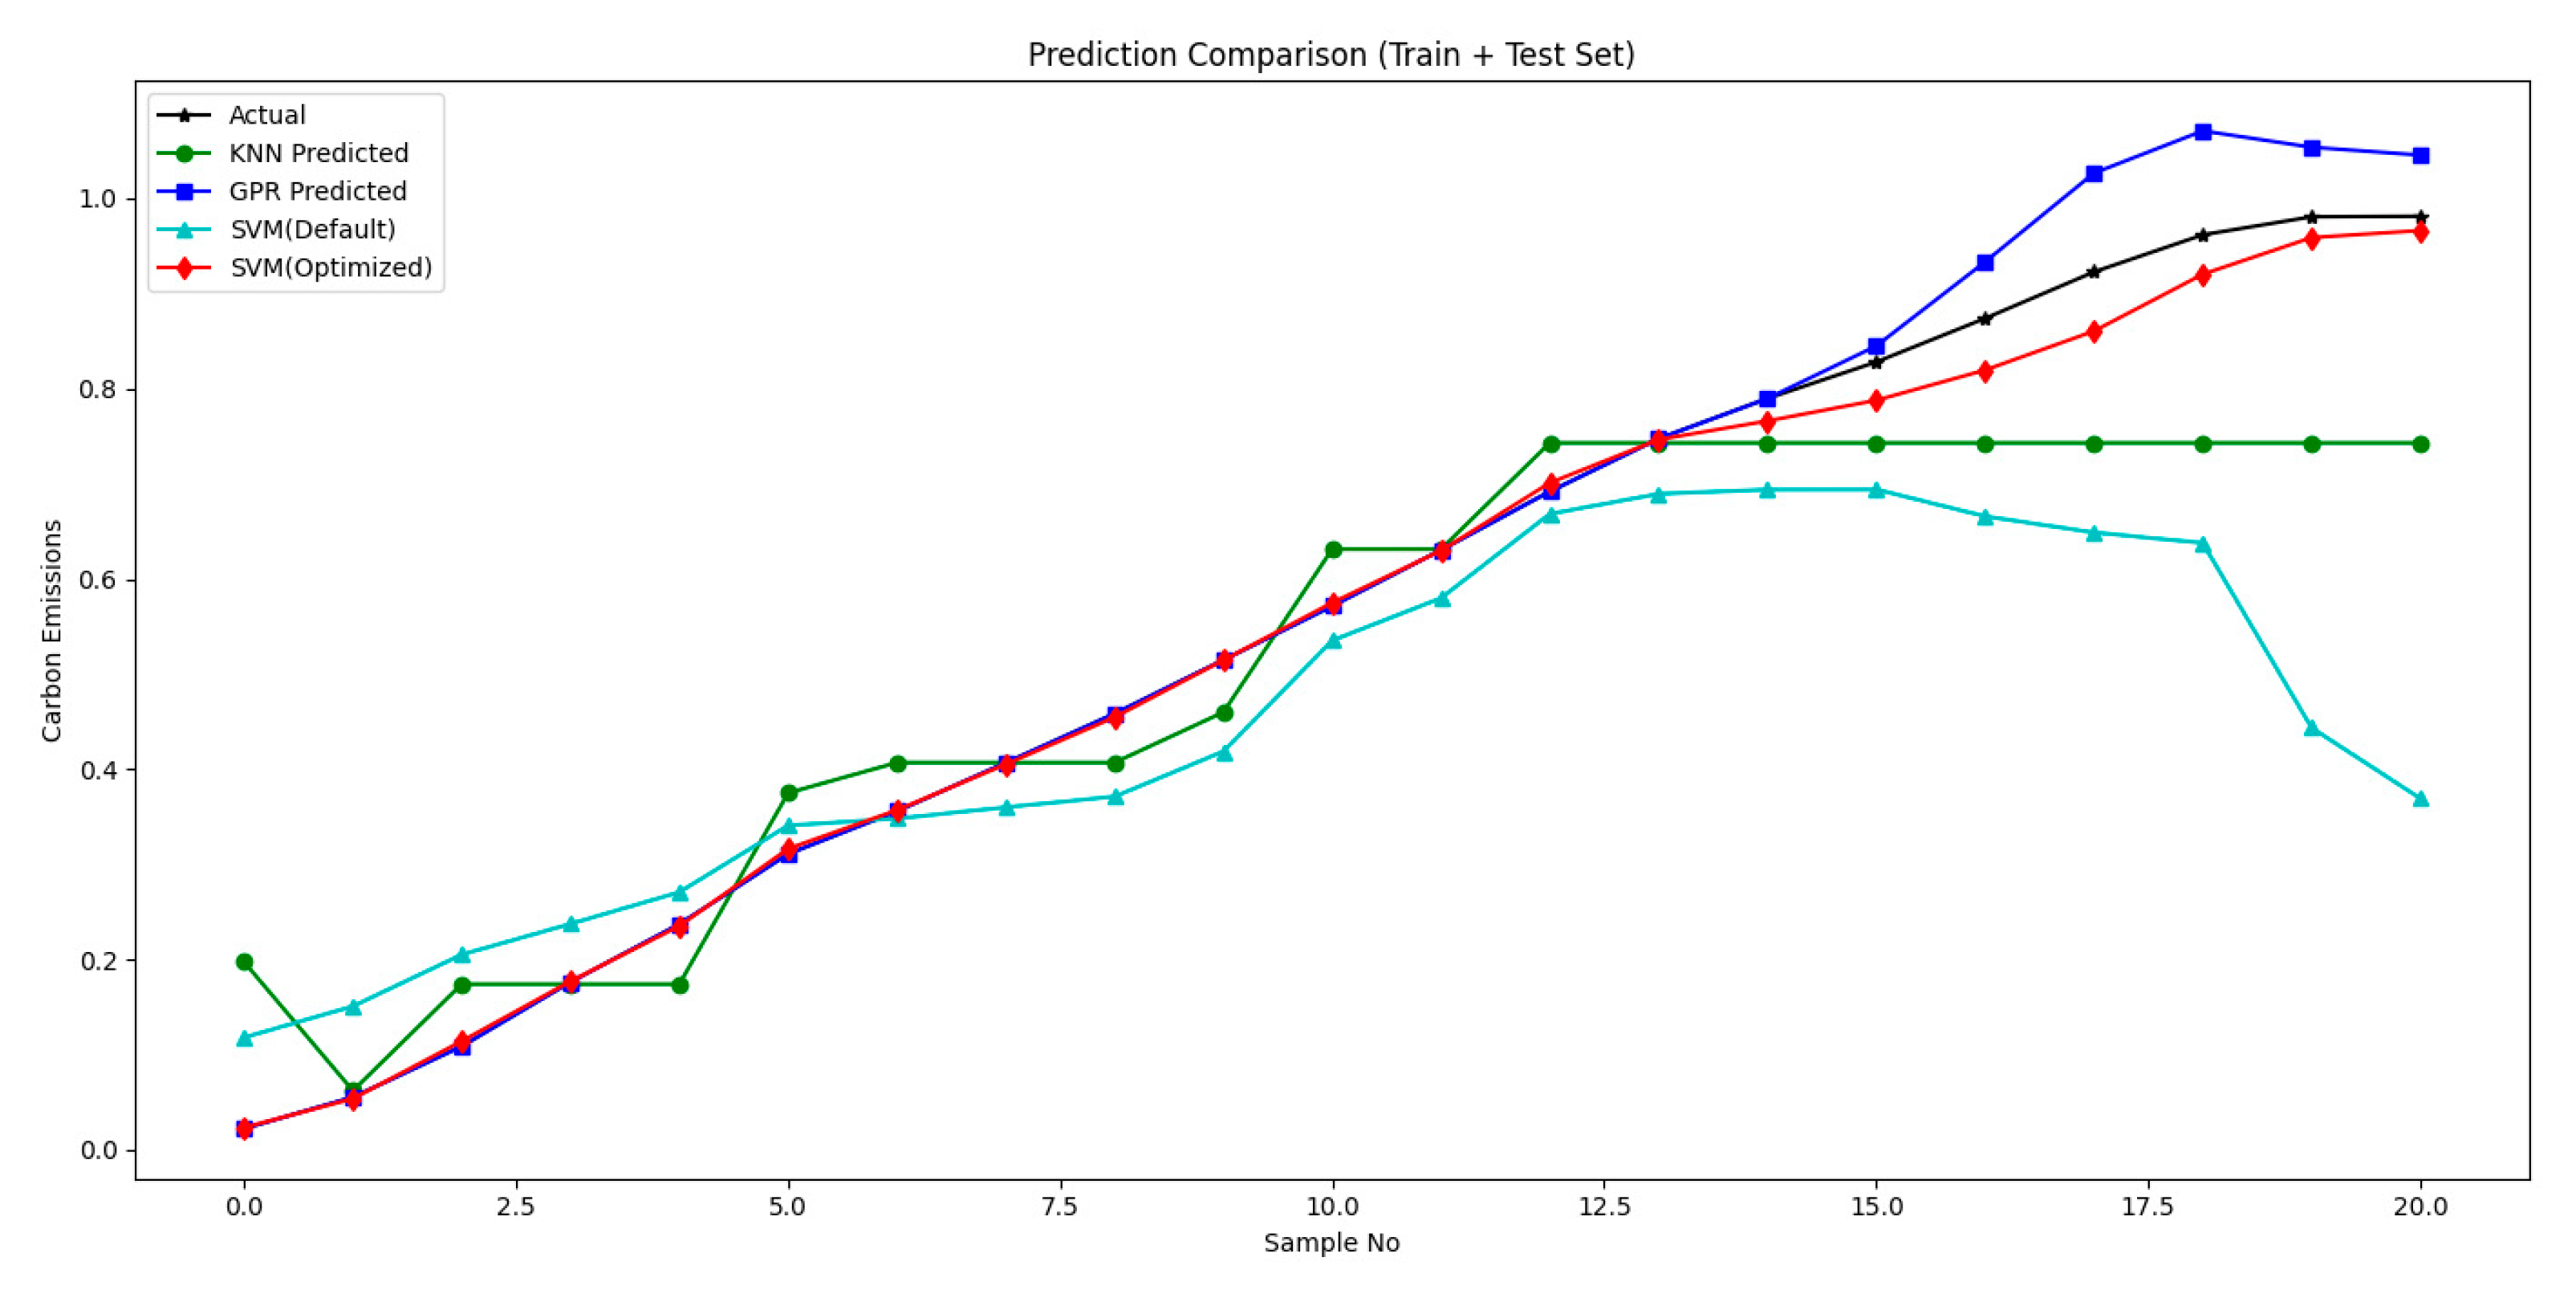
This study conducted an error comparison analysis on the SVM, KNN, GPR, and WOA-SVM prediction models to ensure the accuracy and scientific nature of the research results. The results show that the coefficient of determination (R2) for the WOA-SVM model reached 0.91. It also indicates that the relative errors between simulated and actual carbon emission values remained within 1.5% across all years. These results show that the WOA-SVM model of this study is significantly better than other prediction models in terms of error and correlation coefficient evaluation indicators, thereby improving the credibility of the prediction results.
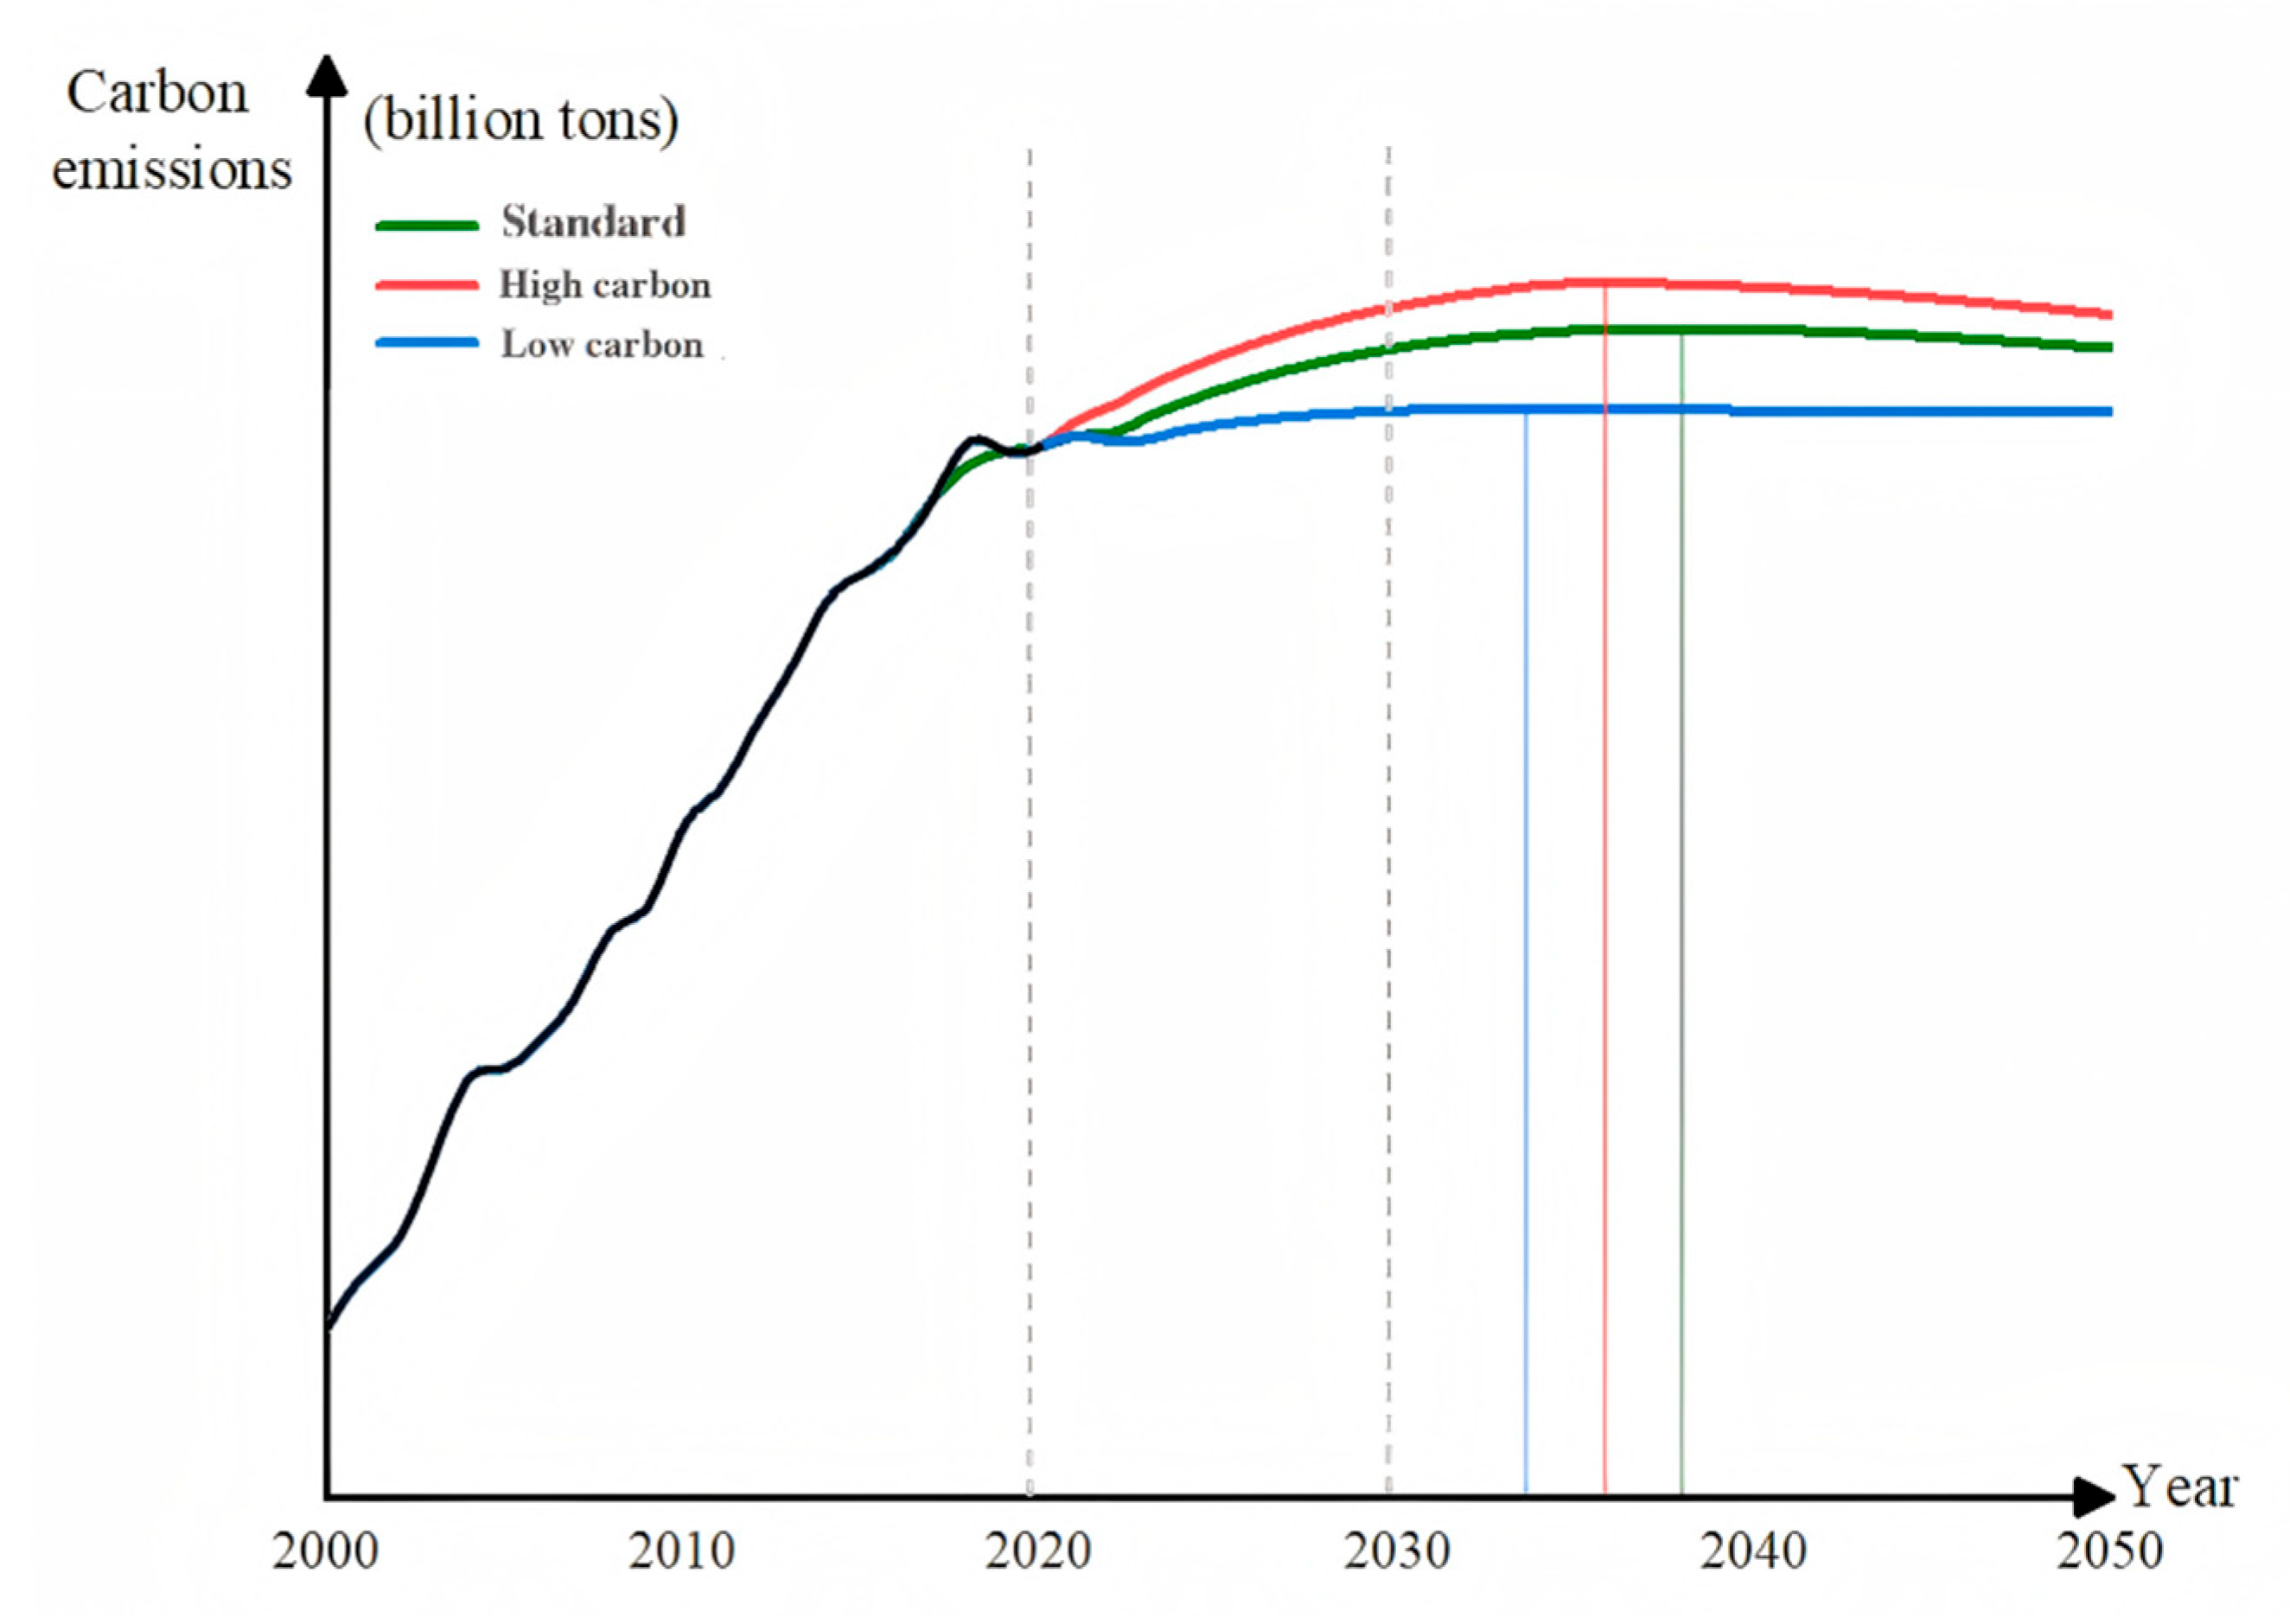
This study conducted a scenario-based forecasting analysis. The results indicate that carbon emissions from the transportation sector in Jiangsu Province are projected to experience slow growth, followed by a carbon peak, after which a sustained decline is expected. Further comparisons reveal that under the baseline scenario, emissions will increase at a low rate until reaching peak levels in 2038. By contrast, under the high-carbon scenario, emissions will increase at a faster pace, peaking in 2036. Under the low-carbon scenario, emission growth will slow further, stabilize earlier, and achieve peak status in 2034, which is closest to the official carbon peak target. Therefore, proactive emission reduction measures and low-carbon policies can significantly reduce carbon emissions and promote sustainable development.
However, this study has some limitations that should be acknowledged. Owing to data availability constraints, this study primarily relies on statistical yearbooks and government-released datasets. Although these sources are authoritative, their limitations include low spatiotemporal resolution, delayed updates, and a lack of cross-validation with multi-source heterogeneous data (e.g., satellite remote sensing, land-use data). Such limitations may introduce quantification biases in key driving factors. Furthermore, existing datasets fail to incorporate 3D indicators, such as building height and density, thereby hindering the exploration of vertical spatial development’s impact mechanisms on carbon emissions and limiting the model’s responsiveness to multidimensional dynamics.
Future research directions may focus on the following aspects:
Establish a cross-regional, multimodal transportation carbon emission database by integrating satellite remote sensing data, real-time traffic monitoring data, and granular energy consumption data. This method will enhance the model’s capacity to characterize complex systems and construct a “space–society–energy” multidimensional data cube.
Incorporate 3D urban indicators to improve the model’s precision in delineating urban morphology–carbon emission correlations.
Develop an adaptive fusion framework by introducing dynamic weights during the WOA encircling predation phase. This strategy will enable the dynamic adjustment of WOA-SVM weights, thereby enhancing fitting accuracy for non-stationary, multimodal carbon emission trends.
Conduct comparative experiments across multiple Chinese provinces to identify the model’s applicability boundaries in regions with diverse economic structures and resource endowments, thereby establishing region-specific prediction paradigms.
