1. Introduction
Livestock farming constitutes a pivotal sector in global agricultural greenhouse gas emissions, responsible for 54–80% of total agricultural emissions [
1]. Methane (CH
4) emissions from ruminant enteric fermentation now exceed the global warming contribution of industrial nitrous oxide (N
2O) emissions [
2]. As the world’s largest livestock producer and consumer, China reported 453 million swine inventories in 2022, with cattle and sheep inventories exceeding 12% of global totals [
3]. The sector’s carbon emissions reached 323 million tons CO
2-equivalent, surpassing Germany’s total agricultural emissions by 180%. This “large-scale inefficiency” positions livestock systems as a critical focus for China’s dual-carbon targets [
4]. Post-2018 African swine fever outbreaks have intensified challenges, where accelerated intensive farming has exacerbated manure management pressures and energy consumption, revealing acute conflicts between traditional practices and environmental carrying capacity [
5].
Existing scholarship has advanced our understanding of carbon accounting and driving mechanisms. Lifecycle assessments by Bausano et al. identified feed production and land-use changes as contributors to 78% of embodied emissions [
6]. Chinese researchers including Zhang et al. documented a 23% decline in provincial emission intensity from 2000 to 2018, albeit with widening regional disparities [
7]. Three critical research gaps persist in the current literature. First, traditional metrics like coefficient of variation and Gini index inadequately characterize nonparametric distribution features such as multimodality and heavy-tailedness, limiting explanations of spatial heterogeneity in technology diffusion. Second, static applications of Tapio decoupling models neglect dynamic interactions between policy interventions and market fluctuations. Despite the 2015 Livestock Scale Farming Pollution Prevention Regulation elevating national manure utilization to 75% [
8], current research lacks quantification of differential impacts across farm scales. Third, the predominant use of exploratory spatial data analysis (ESDA) restricts mechanistic understanding of economic spillovers.
This study addresses these gaps through a tripartite framework integrating dynamic assessment, distribution evolution, and spatial interaction. We investigated four core scientific questions: (1) how China’s livestock emissions evolve spatiotemporally under intensive farming and regional disparities; (2) whether technological lock-ins transcend linear Environmental Kuznets Curve assumptions; (3) how policy innovations like carbon markets reshape regional decoupling elasticity through factor allocation efficiency; and (4) through which pathways spatial spillovers exacerbate regional emission disparities.
Methodologically, this research pioneers three innovations: the integration of kernel density estimation with Theil index decomposition to characterize emission intensity distribution dynamics; application of Spatial Durbin Models (SDMs) to quantify local-neighboring economic variable interactions; and development of a multi-phase dynamic assessment model using decoupling elasticity coefficients to identify critical policy intervention timings. Practically, the findings inform differentiated regional governance and carbon market design, facilitating China’s transition toward low-carbon efficiency while contributing actionable insights to global agricultural climate governance.
3. Results
3.1. Livestock Carbon Emissions
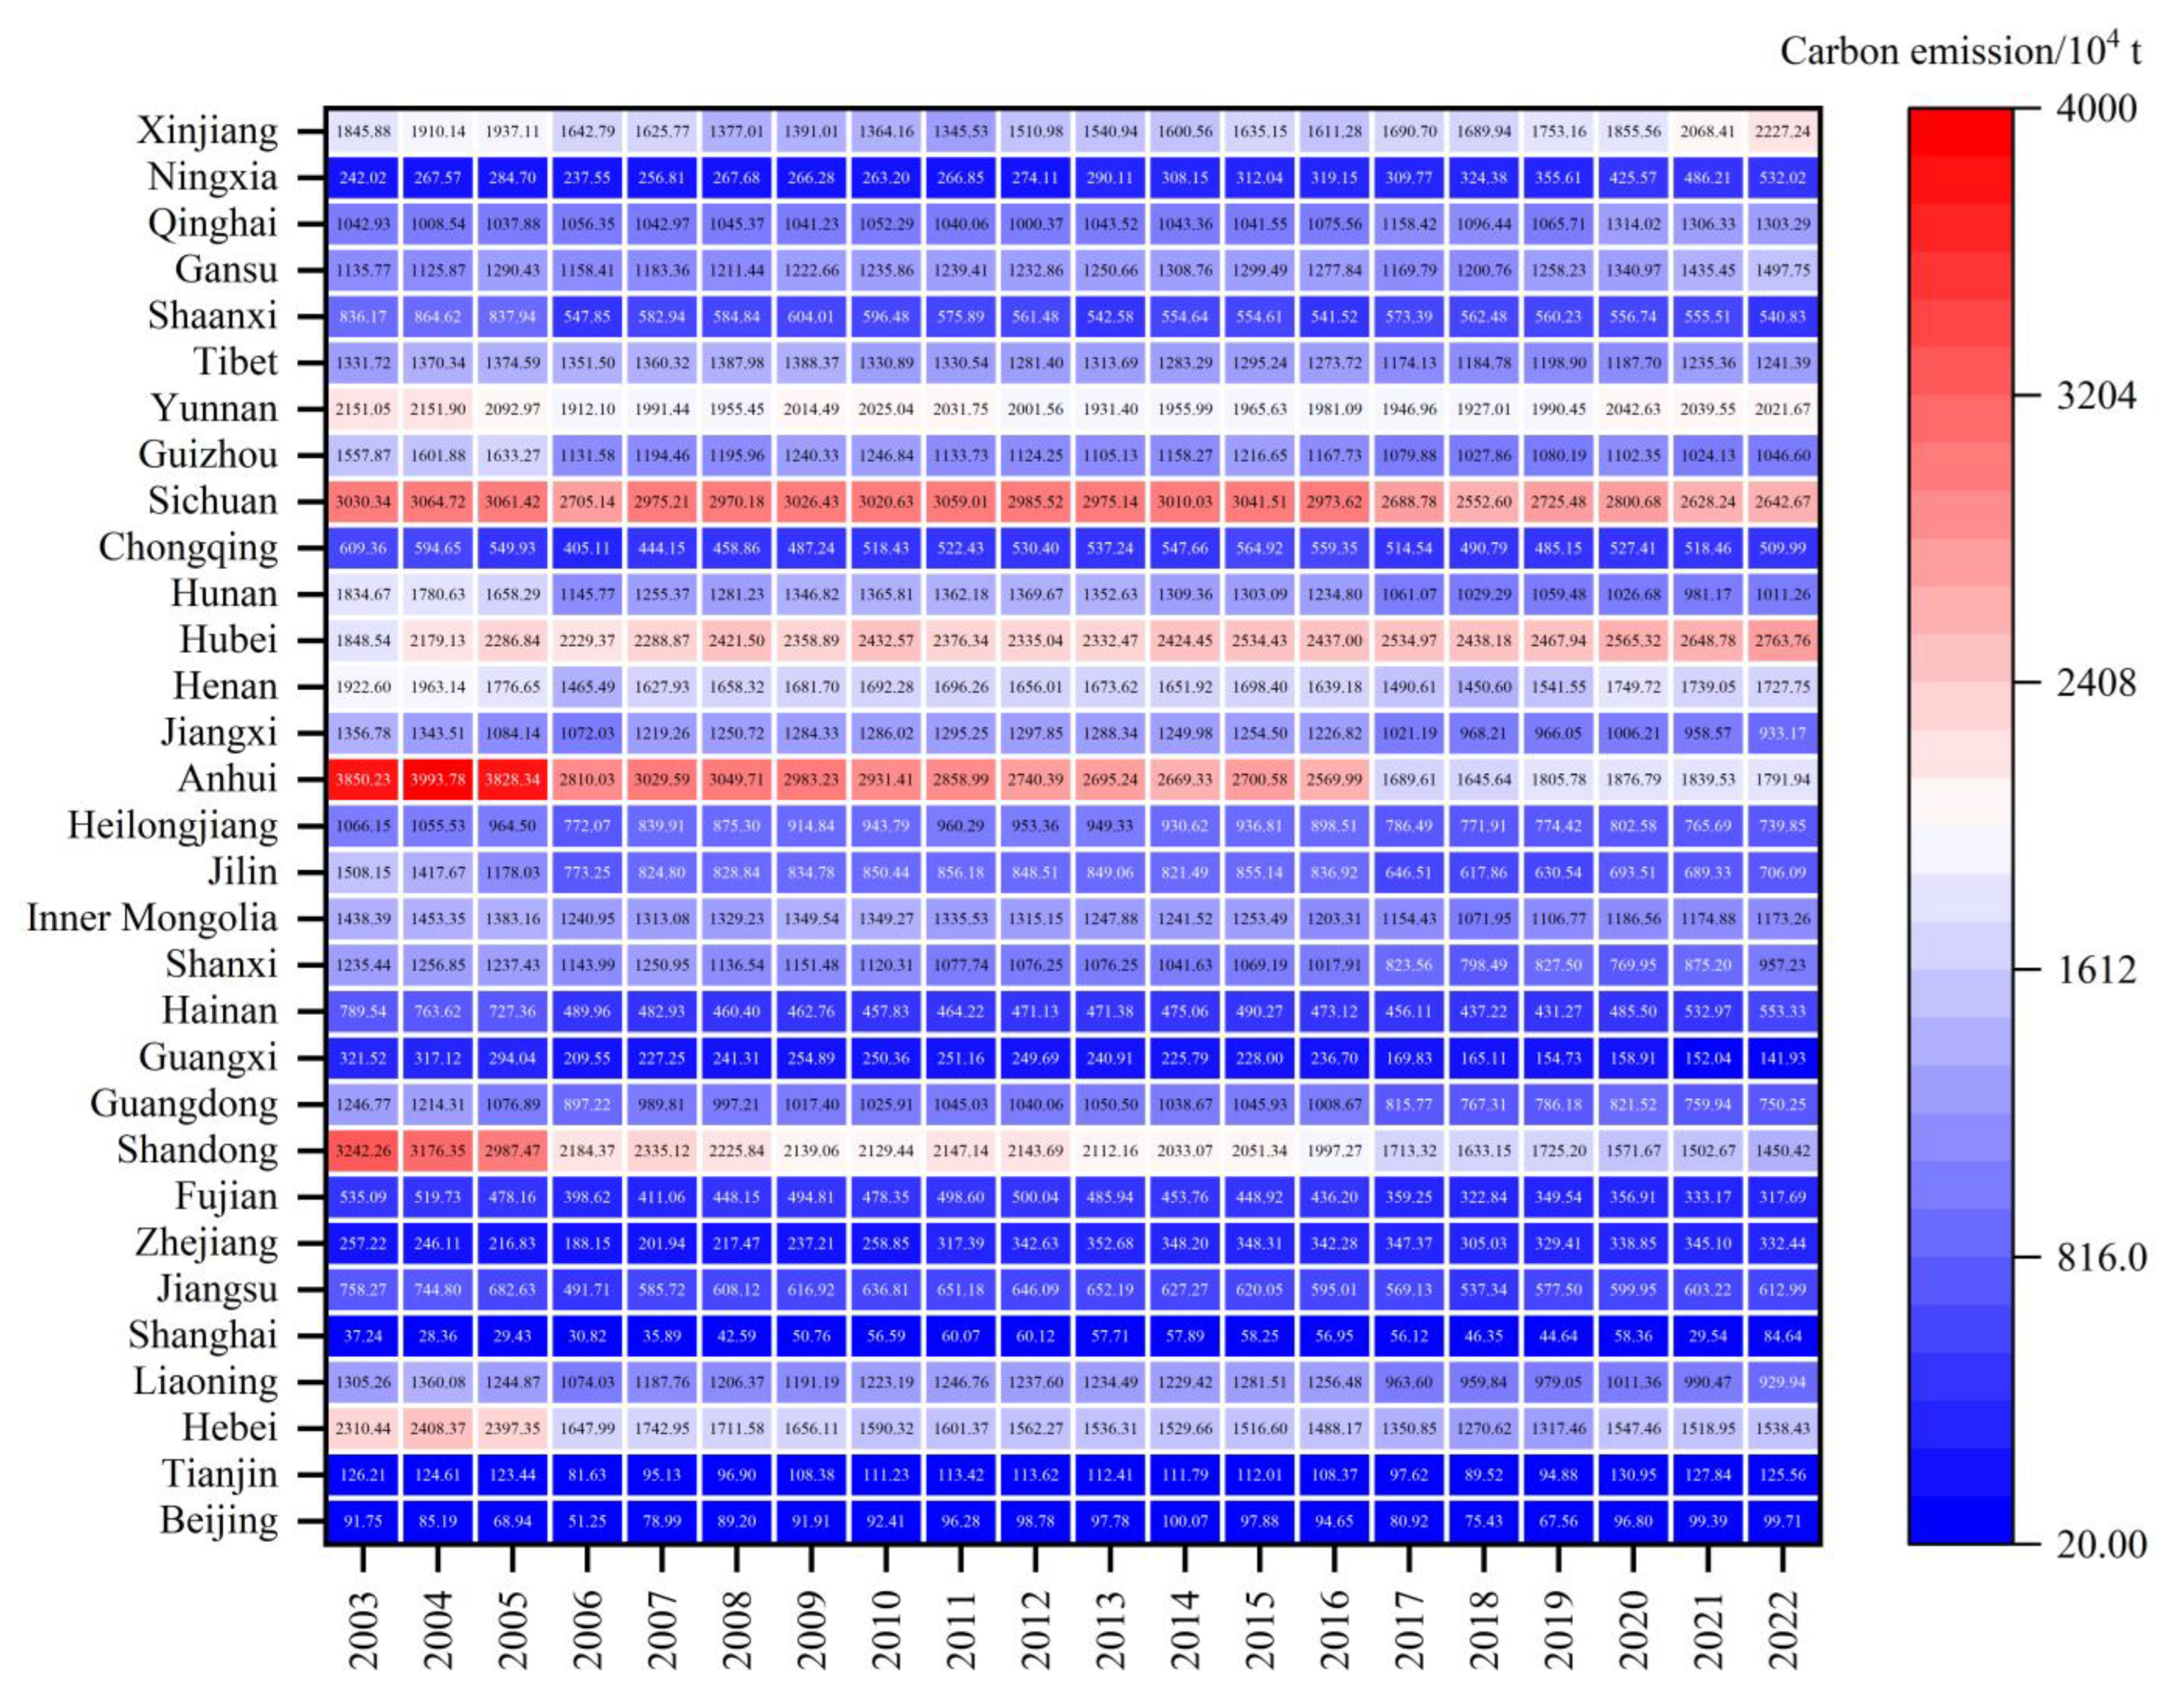
China’s livestock carbon emissions demonstrated a fluctuating yet overall declining trajectory between 2003 and 2022, decreasing by 6.5% from 34,560.88 × 10
4 t to 32,305.07 × 10
4 t. Three notable inflection points marked this trend: reductions of 2.1% in 2006, 1.8% in 2014, and 1.3% in 2020, though a marginal 0.1% rebound occurred in 2022, underscoring the non-linear nature of emission mitigation. These fluctuations were closely linked to China’s policy cycles, particularly the implementation of successive Five-Year Plans (FYPs). The FYPs serve as comprehensive national development strategies that define economic, social, and environmental priorities over five-year periods, playing a pivotal role in guiding low-carbon transitions (
Figure 2).
During the 13th Five-Year Plan period (2016–2020), enhanced environmental regulations and targeted initiatives—such as manure recycling programs and methane capture technologies—contributed to a 3.2% cumulative decline in livestock carbon emissions. In contrast, the initial phase of the 14th Five-Year Plan (2021–2022) saw a slight 0.6% increase, reflecting policy adjustments aimed at stabilizing livestock production following external shocks, including pandemic-related disruptions.
Regional patterns revealed profound spatial restructuring. Traditional livestock hubs like Henan, Shandong, and Hebei provinces achieved remarkable reductions of 53.5%, 50.0%, and 46.3%, respectively, collectively slashing their national emission share from 28.4% to 15.0%. Henan’s emissions plummeted from 3850.23 × 104 t to 1791.94 × 104 t, while Shandong halved its output through technological modernization. Meanwhile, developed megacities exemplified deep decarbonization: Shanghai reduced emissions by 77.1% to 28.54 × 10⁴ t, and Beijing cut emissions by 42.9%, their combined national contribution dwindling from 0.67% to 0.25% through stringent energy reforms and carbon trading mechanisms.
Contrasting these successes, pastoral regions exhibited concerning growth trajectories. Inner Mongolia’s emissions surged 49.5% to 2763.76 × 104 t, while Xinjiang’s doubled to 2068.41 × 104 t, largely driven by the relocation of emission-intensive livestock operations from eastern provinces. This east-to-west transfer, often incentivized by land availability and lower regulatory costs, helped reduce emissions in developed regions but increased environmental pressures in less-regulated western areas. Qinghai witnessed a 34.7% increase as well, collectively elevating pastoral provinces’ share of national emissions from 8.3% to 15.0%—a clear westward shift in emission hotspots.
In addition, even non-traditional livestock areas faced emerging challenges. For example, Zhejiang Province saw a 29.3% increase in emissions, reaching 332.44 × 10⁴ t, not due to industrial relocation, but as a result of localized expansion of specialized breeding industries. This reflects a complex dynamic: while modernization generally improves production efficiency, it can also increase total emissions in the absence of stringent environmental controls, especially when scale and intensification outpace mitigation measures. These findings highlight that agricultural modernization, depending on its form and context, can either reduce or increase carbon emissions, underscoring the importance of coupling industrial upgrades with effective carbon governance.
This spatial polarization underscores the dual pressures of industrial restructuring and regional development disparities. While technological interventions successfully decoupled emissions from production growth in eastern hubs, western regions became absorption zones for emission-intensive activities, exacerbated by lagging environmental regulations and resource dependency. The 2022 rebound particularly signals vulnerabilities in sustaining long-term mitigation, potentially linked to pandemic recovery policies favoring livestock security over climate considerations.
3.2. Decoupling Relationship Analysis
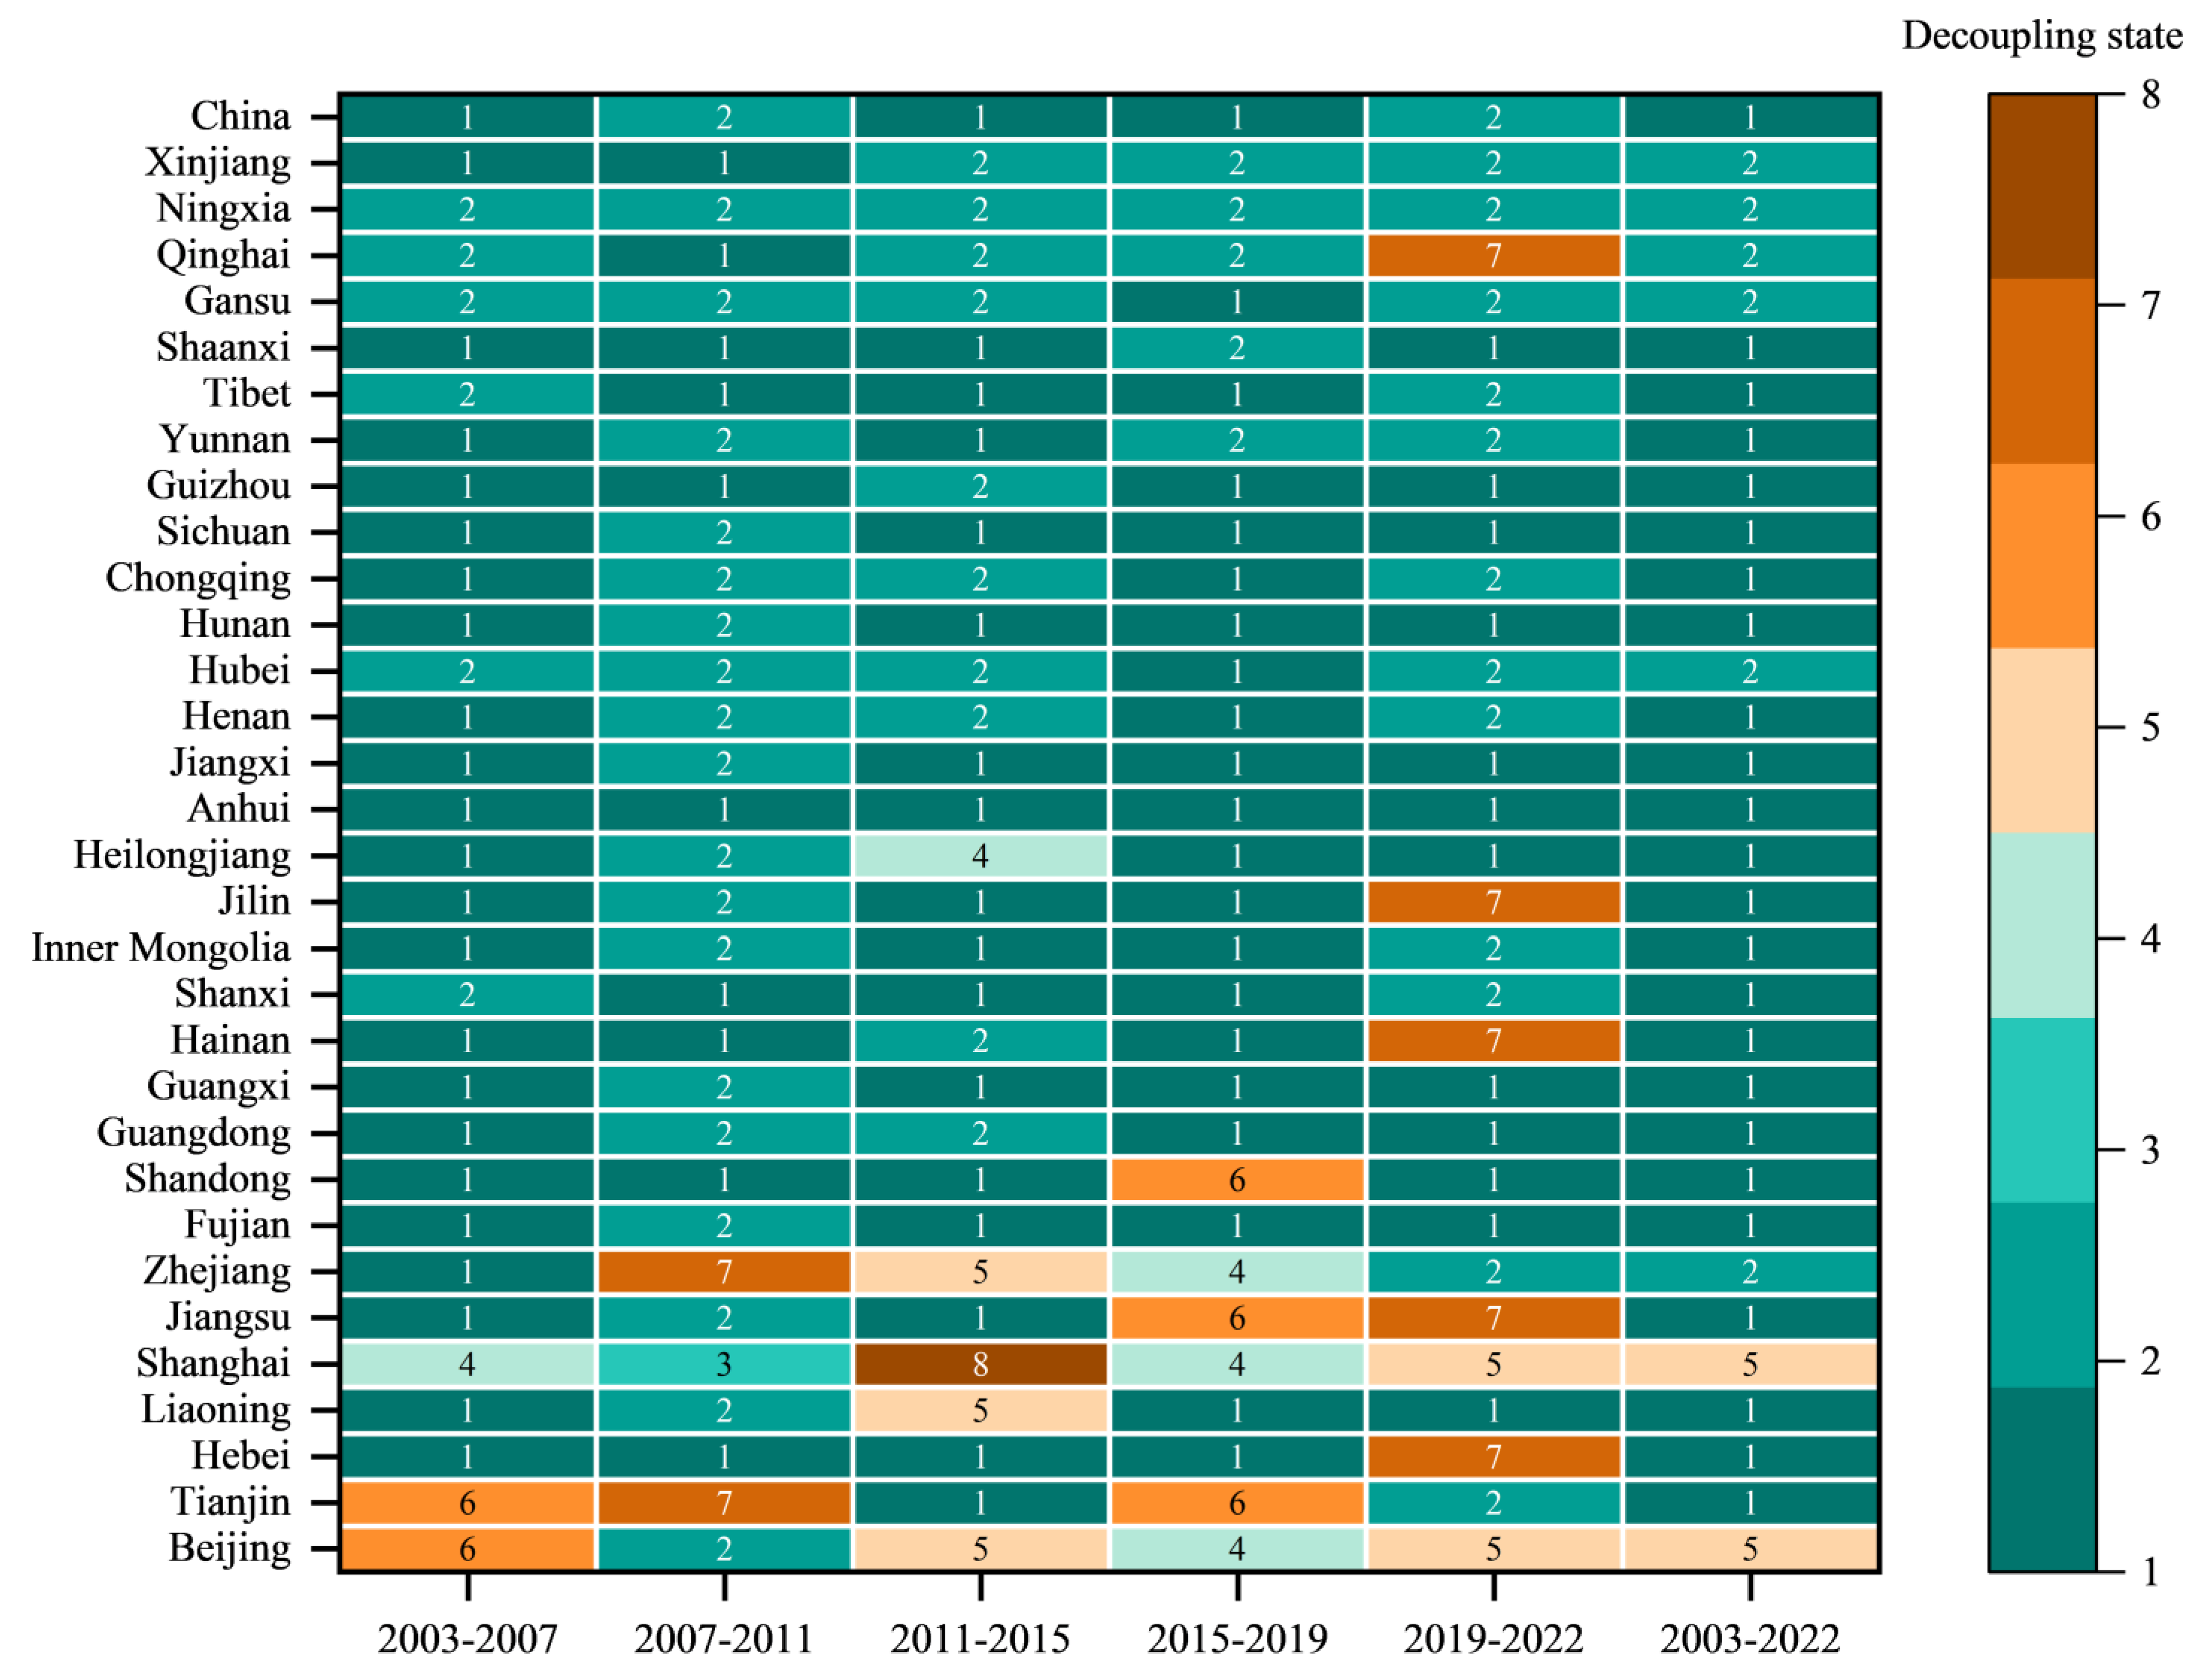
The decoupling relationship between livestock carbon emissions and economic growth across China’s 31 provinces demonstrates significant spatial–temporal differentiation and dynamic evolution. Overall, strong decoupling has been the dominant state throughout various periods, reflecting positive outcomes in coordinating carbon emission control with economic growth in most regions. However, fluctuations in decoupling types over time highlight the differentiated impacts of regional development stages, industrial structure adjustments, and policy implementation effectiveness (
Figure 3).
During the period of 2003–2007, the majority of provinces exhibited a strong decoupling status. Regions such as Hebei, Shanxi, Heilongjiang, Shanghai, and Jiangsu, although characterized by both livestock production and industrial activities, showed effective decoupling between livestock-specific carbon emissions and livestock economic output. This sectoral decoupling was derived from independently calculated livestock emission inventories and livestock production values, thus excluding industrial contributions. Conversely, provinces like Beijing, Tianjin, Guangxi, Tibet, Gansu, Qinghai, and Ningxia experienced weak or recessive decoupling, indicating challenges in achieving synergy between carbon reduction and economic development due to weaker economic foundations or a single-industry structure.
In the subsequent period of 2007–2011, the prevalence of strong decoupling declined, with many provinces shifting towards weak decoupling, particularly in the eastern and central regions such as Shandong, Hunan, and Jiangxi. This suggests increased carbon emission pressures amid rapid economic growth. Notably, Tianjin, Jilin, and Inner Mongolia exhibited expansive coupling or expansive negative decoupling, signaling adverse trends where carbon emissions outpaced economic growth, underscoring the urgent need for reinforced green policies.
Between 2011 and 2015, the decoupling patterns further diverged. While provinces like Hubei, Heilongjiang, and Zhejiang maintained strong decoupling, indicating sustained carbon mitigation achievements, others such as Beijing, Shanxi, Jilin, and Inner Mongolia entered states of strong negative decoupling or recessive coupling. This highlights persistent environmental challenges in resource-dependent and heavy industrial regions, where economic expansion incurred significant environmental costs.
The period of 2015–2019 witnessed a partial recovery in decoupling performance, driven by the deepening of China’s ecological civilization strategy. Provinces like Shandong, Fujian, Guangdong, and Chongqing reverted to strong decoupling, reflecting the gradual effectiveness of environmental policies. However, regions such as Tianjin, Inner Mongolia, and Liaoning continued to exhibit recessive or weak negative decoupling, revealing disparities in governance outcomes across provinces.
From 2019 to 2022, although most provinces maintained either strong or weak decoupling, areas like Tianjin, Anhui, Liaoning, Shandong, and Qinghai experienced expansive coupling once again. This suggests heightened carbon rebound pressures amid economic recovery efforts, indicating that the path toward green transformation remains challenging. Additionally, provinces such as Inner Mongolia and Beijing persisted in strong negative decoupling states, underscoring the structural difficulties faced by resource-based economies in reducing carbon emissions.
Over the full period of 2003–2022, a long-term strong decoupling trend was observed in most provinces, including Hebei, Shandong, Jiangsu, Sichuan, and Hubei, demonstrating significant progress in promoting green development within the livestock sector alongside high-quality economic growth. In contrast, provinces like Ningxia, Gansu, and Guangxi remained in a state of weak decoupling, reflecting insufficient momentum in reducing carbon intensity and the need to strengthen green development capacities.
In summary, the decoupling relationship between livestock carbon emissions and economic growth in China reveals characteristics of “overall improvement, localized fluctuations, and regional differentiation”. Moving forward, tailored policies should be implemented based on the dynamic evolution of decoupling types across regions. Efforts must focus on structural adjustments and technological upgrades in resource-dependent areas, consolidating low-carbon advantages in developed eastern regions, and enhancing policy support for green transformation in central and western provinces to advance a coordinated national decarbonization process.
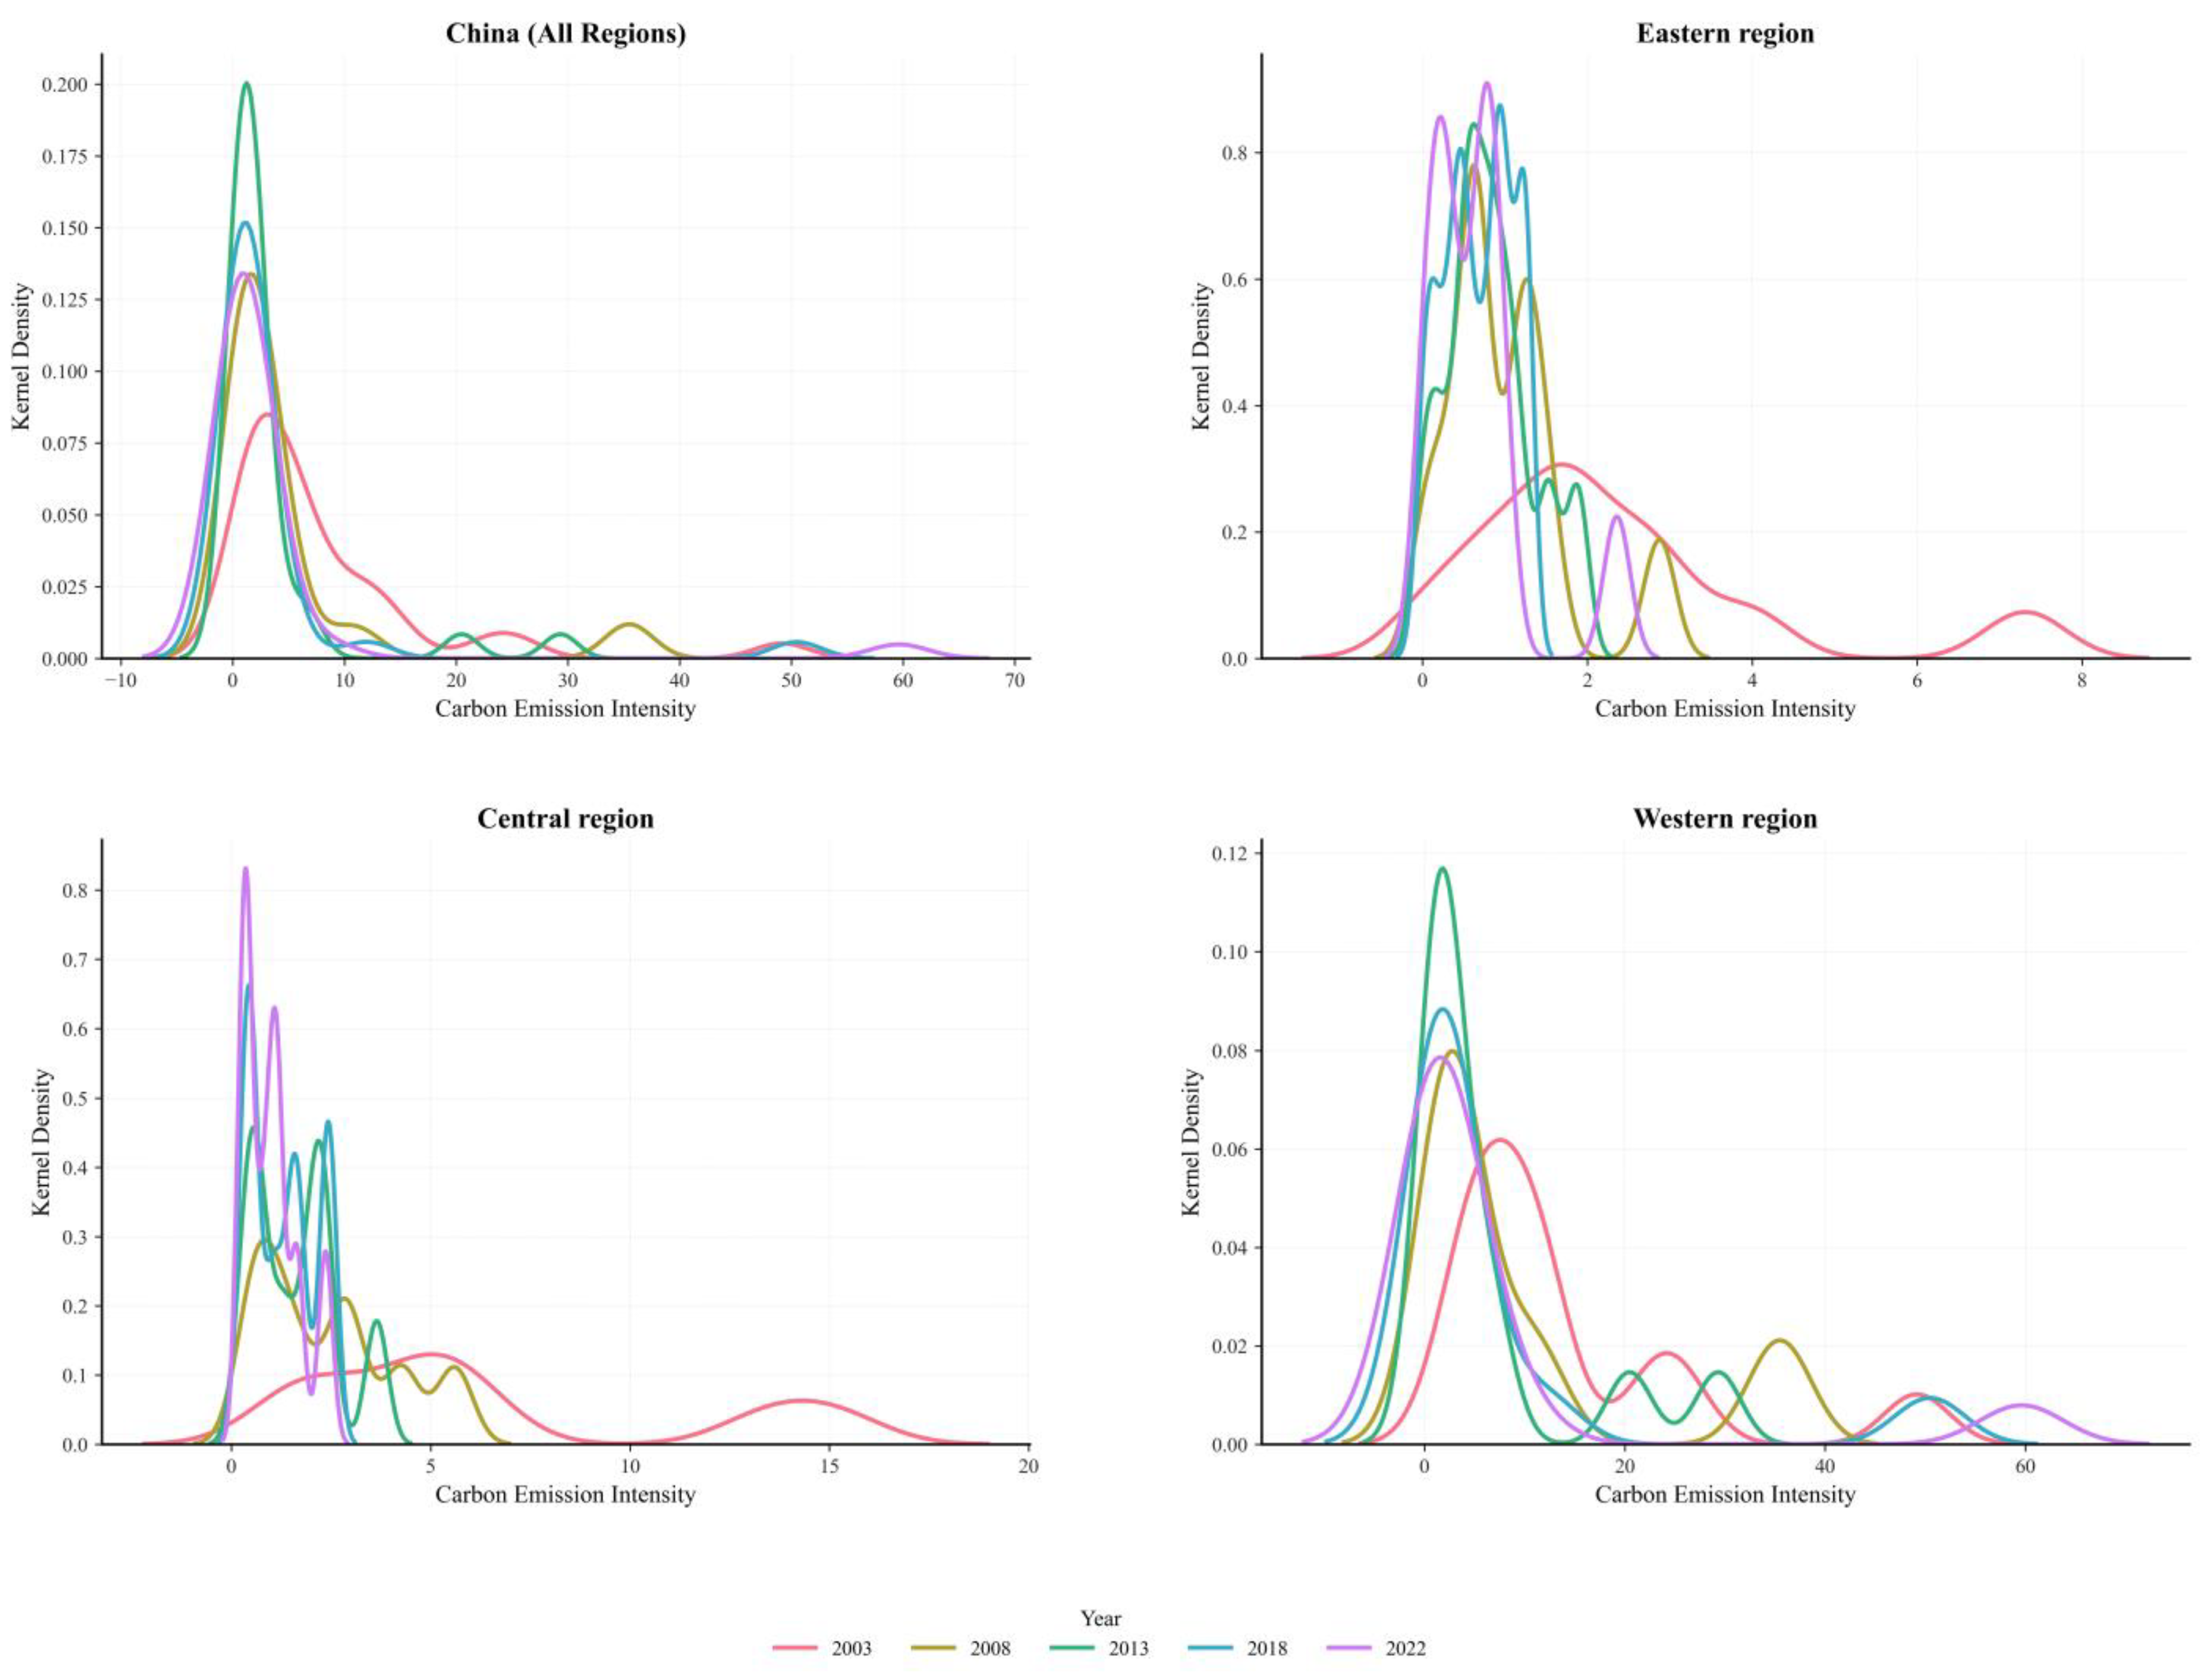
3.3. Kernel Density Estimation Analysis
To reveal the spatiotemporal distribution characteristics and dynamic evolution trends of livestock carbon emission intensity at both national and regional levels in China, this study applies kernel density estimation (KDE) to data from five time points: 2003, 2008, 2013, 2018, and 2022. The results are illustrated in
Figure 4.
At the national level, the kernel density curves demonstrate a clear dynamic pattern characterized by “right-skewed—convergence—dispersion”. In 2003, the curve exhibits a low peak with a wide distribution and significant right-skewness, indicating substantial regional disparities in livestock carbon emission intensities, with some areas maintaining high intensity levels. Over time, particularly in 2013 and 2018, the peak of the curve gradually rises and shifts towards lower intensity values, reflecting a general decline in carbon emission intensity and a reduction in regional differences across the country. However, by 2022, although the main peak remains in the low-intensity range, the tail of the curve extends significantly, and multiple peaks emerge. This suggests a resurgence or increasing heterogeneity in certain regions, potentially driven by differences in development models, structural adjustments in the livestock industry, and uneven enforcement of environmental policies.
In the eastern region, the kernel density curves are predominantly concentrated in the low carbon emission intensity range, reflecting a favorable trend towards intensification and low-carbon development. While the 2003 curve shows noticeable right-skewness with a relatively low peak, indicating early-stage advantages in low-carbon practices alongside internal disparities, from 2008 onwards, the main peak continuously shifts leftward and becomes steeper. By 2018, the distribution is highly concentrated, demonstrating significant achievements in carbon reduction within the livestock sector and strong internal convergence. In 2022, a slight dispersion with an extended tail appears, implying that despite maintaining overall low-carbon advantages, certain areas experienced fluctuations in emission intensity, likely due to industrial transfers or the expansion of large-scale farming operations.
The central region displays pronounced volatility and significant differentiation in its kernel density distribution. Across all observed years, the curves exhibit multiple peaks, with particularly sharp fluctuations in 2022. The dispersed peak positions indicate marked internal disparities in livestock carbon emission intensities and a lack of a unified low-carbon development pathway. Although there is a tendency for the main peak to shift towards lower values between 2003 and 2018, the convergence effect is less pronounced compared to the eastern region. This reflects ongoing challenges related to resource endowments, technological constraints, and inconsistent policy implementation. The intensified multi-peak pattern in 2022 suggests that traditional farming practices remain prevalent in some areas, maintaining high emission intensity levels and underscoring the urgent need for the adoption of green farming technologies and robust carbon management systems.
The western region exhibits a typical pattern of “high dispersion—phased convergence—re-dispersion”. In 2003, the curve is positioned towards lower intensity values with a relatively high peak, indicating generally low livestock carbon emission intensity but persistent regional disparities. As time progresses, particularly in 2013 and 2018, the curve shifts noticeably to the right with a lengthened tail, highlighting a significant increase in carbon emission intensity in certain areas due to accelerated industrialization and modernization of livestock farming. By 2022, the curve demonstrates a long-tail and multi-peak distribution, with prominent peaks in the high-intensity range, reflecting substantial carbon emission pressures amid rapid development and emphasizing the considerable challenges facing low-carbon transitions in the region.
Overall, from 2003 to 2022, livestock carbon emission intensity in China has undergone a dynamic evolution characterized by initial dispersion, subsequent convergence, and renewed heterogeneity across both national and regional scales. The eastern region has steadily advanced low-carbon transitions, continuously optimizing internal emission intensity and serving as a leader in green development. The central region, constrained by structural issues and outdated development models, exhibits significant volatility and lacks a stable reduction trajectory. The western region, driven by industrial expansion, has experienced rising emission intensity and widening regional disparities, necessitating a careful balance between economic growth and ecological protection.
3.4. Theil Index Decomposition Analysis
At the national level (Total), the overall Theil index exhibited a rising trend from 2003, peaking in 2008 at 0.6081, followed by a gradual decline until 2016, when it reached a low of 0.3487. This initial increase suggests a period of widening disparities in livestock carbon emission intensity, driven largely by rapid industrial expansion and uneven adoption of low-carbon practices across regions. The subsequent decline indicates a phase of relative convergence, likely influenced by national environmental policies, technological advancements, and efforts to standardize livestock management practices. However, from 2017 onwards, the index demonstrated moderate fluctuations, reflecting persistent structural heterogeneity despite overall improvements (
Table 3).
A detailed examination of inter-regional differences reveals that the between-region component consistently accounted for the majority of the overall inequality. The inter-regional Theil index (Intraband) rose from 0.2611 in 2003 to a peak of 0.3644 in 2008, mirroring the national trend. This indicates that disparities between the eastern, central, and western regions were the primary contributors to national inequality during this period. After 2008, the inter-regional index steadily declined, reaching 0.1331 by 2022. This downward trajectory suggests enhanced regional coordination and a narrowing gap in carbon emission intensity among broad geographic zones, likely due to the diffusion of best practices and policy-driven homogenization efforts.
In contrast, intra-regional disparities exhibited divergent patterns across the three regions. The eastern region consistently maintained the lowest intra-regional Theil index throughout the study period. Starting at 0.0718 in 2003, it declined steadily to a minimum of 0.0060 in 2014, reflecting a high degree of internal uniformity and effective control over carbon emission intensity. This trend underscores the region’s leadership in implementing low-carbon strategies and its advanced livestock industry structure. However, from 2016 onwards, a modest rebound is observed, with the index rising to 0.0742 by 2022. This resurgence may be attributed to emerging differences driven by localized industrial upgrades, policy shifts, or varying responses to environmental regulations within the region.
The central region displayed a relatively stable yet low Theil index across the timeline, fluctuating within a narrow range. Despite minor increases in certain years, such as 2017 and 2018, the index remained below 0.011 throughout the period. This stability suggests limited internal differentiation, possibly due to the homogeneous nature of livestock practices or uniformly constrained technological adoption across the provinces within this region. Nonetheless, the persistently low index also reflects a potential lack of dynamic progress toward optimized, low-carbon livestock development.
In contrast, the western region exhibited the highest intraband disparities among the three regions. Beginning at 0.1249 in 2003, the Theil index rose sharply, peaking at 0.2136 in 2008. This indicates significant internal inequality, likely driven by uneven economic development, diverse geographical conditions, and varying levels of modernization within the livestock sector. Although the index gradually declined after 2008, reaching 0.1370 in 2016, it remained substantially higher than in the eastern and central regions throughout the study period. The persistent intraband heterogeneity in the west highlights ongoing challenges related to balancing rapid industrial expansion with sustainable environmental practices.
Overall, the evolution of the Theil index for livestock carbon emission intensity in China reflects a complex interplay between national policy interventions, regional development strategies, and sector-specific dynamics. While notable progress has been made in reducing inter-regional disparities, intra-regional inequalities—particularly in the western region—remain a critical concern. The recent uptick in the eastern region’s intra-regional index further emphasizes the need for continuous monitoring and adaptive policy frameworks to address emerging disparities.
In conclusion, achieving sustainable and equitable low-carbon development within China’s livestock industry necessitates a dual focus: reinforcing efforts to harmonize regional development while simultaneously targeting internal imbalances through region-specific strategies. Future policies should prioritize technological diffusion, capacity-building in less-developed areas, and the establishment of flexible regulatory mechanisms that can respond to localized challenges, ensuring long-term carbon efficiency and environmental resilience across all regions.
3.5. Global Spatial Autocorrelation Analysis
Livestock carbon emission intensity exhibited persistent positive spatial autocorrelation throughout 2003–2022, with global Moran’s I values remaining statistically significant (
p < 0.01 annually). However, spatial clustering intensity demonstrated volatile attenuation, as Moran’s I declined 37.6% from 0.1755 (2003) to 0.1095 (2022), punctuated by a transient rebound to 0.1388 in 2018 coinciding with the “13th Five-Year Plan” manure recycling initiatives. Corresponding Z-scores decreased from 3.47 to 2.39, maintaining significance (Z > 1.96) but indicating weakening spatial dependence—a manifestation of persistent yet diminishing geographical inertia in low-carbon technology diffusion (
Table 4).
This spatial autocorrelation decline dynamically interacts with kernel density’s bimodal divergence. The initial high Moran’s I (0.1755) in 2003 aligned with unimodal distribution, reflecting contiguous “high–high” and “low–low” clusters. Policy-driven spatial reorganization emerged post-2013: methane capture adoption in North China’s farming hubs (58% biogas coverage by 2015) created low-carbon agglomerations in Shandong and Henan, while pastoral provinces formed “high-emission clubs” through technological incompatibility. The resultant spatial heterogeneity diluted global autocorrelation, evidenced by Moran’s I fluctuations during 2013–2018.
Notably, 2022’s record-low Moran’s I (0.1095) coincided with variance stabilization at 0.0036—mirroring 2003 levels—signaling a “low-clustering, high-dispersion” spatial configuration. This paradox suggests incomplete spatial spillovers from provincial carbon market pilots, where 78% of interprovincial CCER transactions remained confined within eastern regions. The failure to institutionalize cross-border mitigation cooperation mechanisms has hindered the transformation of local emission reductions into coordinated spatial effects, perpetuating fragmented decarbonization patterns.
3.6. Local Spatial Autocorrelation
Spatiotemporal analysis of LISA cluster maps reveals dynamic geographical heterogeneity in China’s livestock carbon emission intensity, marked by structural shifts in spatial association patterns. In 2003, a contiguous High–High (H-H) cluster dominated the Yellow River Basin, with Henan, Shandong, and Hebei provinces (
p < 0.05) exhibiting a mean intensity of 18.7 tons/CNY 10,000—2.3-fold higher than neighboring regions. Scattered High–Low (H-L) anomalies emerged in the Yangtze River mid-reaches, exemplified by Sichuan Province’s pork production hubs juxtaposed against Yunnan–Guizhou Plateau’s low-intensity zones (
Figure 5).
By 2008, the H-H cluster contracted spatially, with Shandong Peninsula transitioning to non-significance (grey zones), while central Henan maintained strong clustering (Moran’s I = 0.21). Nascent Low–Low (L-L) clusters emerged in the Beijing–Tianjin–Hebei region, where Beijing’s intensity plummeted to 4.2 tons/CNY 10,000, creating a 1:3.5 gradient with Hebei. Accelerated spatial reorganization occurred by 2013, as the Yangtze River Delta formed a consolidated L-L belt; Jiangsu, Zhejiang, and Shanghai reduced the mean intensity by 64% to 2.8 tons/CNY 10,000 through technological symbiosis.
The 2018 pattern demonstrated intensified polarization: a new western H-H axis spanned 127,000 km2 across Inner Mongolia and northern Xinjiang (15.4 tons/CNY 10,000), 4.8-fold higher than eastern agropastoral zones. Simultaneously, the Pearl River Delta’s L-L cluster transcended administrative boundaries, with Guangzhou–Shenzhen–Dongguan achieving sub-1.5 tons/CNY 10,000 intensity—7.2-fold lower than adjacent non-cluster areas (Z = 3.01).
The 2022 spatial configuration exhibited “east-west divergence with multipolar breakthroughs”. Traditional H-H clusters persisted only in Hulunbuir (23.1 tons/CNY 10,000) and Ili Valley (19.8 tons/CNY 10,000), covering 78% less area than in 2003. Eastern coastal L-L clusters expanded across 10 provinces, forming a low-carbon corridor from Beijing–Tianjin–Hebei through the Yangtze/Pearl River Deltas (mean 1.2 tons/CNY 10,000). Sichuan’s transition from an H-L outlier to non-significance (intensity convergence from 2.6× to 1.3× vs. neighbors) validated ecological co-governance in the Chengdu–Chongqing Economic Circle.
Spatial Markov transition analysis identified dynamic cluster shifts: 18% of provinces achieved H-H to L-L transitions (e.g., Shandong), 32% maintained L-L status (e.g., Shanghai–Jiangsu–Zhejiang), while 9% regressed to H-H clusters (e.g., Haixi Prefecture). These shifts demonstrated 74.6% geographical coupling with the Hu Line, underscoring how emission optimization balances population–economic distribution and ecological carrying capacity. The western cluster expansions correlated strongly with pastoral counties, exceeding 80% grassland degradation thresholds, while eastern transitions aligned with metropolitan carbon neutrality roadmaps, achieving 5.8% annual intensity reductions.
3.7. Spatial Durbin Model Results
The spatial econometric analysis revealed differential drivers and spillover effects on livestock carbon emission intensity. Commercial livestock inventory exerted significant local mitigation effects, with a direct elasticity coefficient of −0.353 (
p = 0.001), indicating that each 10,000-unit increase in standardized livestock units reduced local emission intensity by 0.353 tons per CNY 10,000 output. However, its spatial lag term showed insignificant spillover influence (−0.051,
p = 0.274), suggesting limited cross-border technological diffusion through livestock scale adjustments (
Table 5).
Economic development demonstrated stronger decarbonization potential, as per capita GDP’s direct effect reached −0.424 (p = 0.011)—every CNY 10,000 income increase lowered local intensity by 0.424 tons. Conversely, neighboring regions’ economic growth showed weak positive spillovers (0.092), potentially through inter-regional competition for intensive farming investments that partially offset local mitigation gains.
Water resource availability exhibited counterintuitive positive correlations, with direct elasticity of 0.117 (p = 0.034). Each additional 100 million m3 of water resources increased emission intensity by 0.117 tons/CNY 10,000, aligning with pastoral regions’ practices of expanding herds in water-abundant areas despite ecological constraints. The spatial lag term’s insignificance (0.062, p = 0.219) confirmed localized environmental pressure from water-driven production scaling.
Agricultural modernization showed nascent decarbonization potential, as gross agricultural output’s direct effect (−0.154) approached marginal significance (p = 0.264), suggesting unharnessed synergies between crop–livestock integration and emission reduction.
3.8. Effect Decomposition
Commercial livestock inventory’s total effect (−0.401) was predominantly driven by direct mitigation (−0.352, 87.8%), highlighting the primacy of local industrial restructuring over spatial spillovers. Per capita GDP’s total effect (−0.329) masked contrasting mechanisms—strong local decarbonization (−0.424) was partially negated by positive neighboring spillovers (+0.095), revealing tension between regional economic competition and emission coordination. Water resources’ total effect (0.178) emerged exclusively from direct impacts (0.117, 66%), confirming the localized nature of resource-driven emission pressures (
Table 6).
4. Discussion
This study provides a comprehensive analysis of the spatiotemporal dynamics, regional disparities, and spatial spillover effects of carbon emissions within China’s livestock economic system from 2003 to 2022. By integrating decoupling elasticity analysis, kernel density estimation, Theil index decomposition, spatial autocorrelation, and the Spatial Durbin Model (SDM), several critical insights emerge that challenge conventional paradigms of low-carbon agricultural transitions and offer nuanced perspectives for policy and practice.
Firstly, the coexistence of a national decline in total livestock carbon emissions alongside increasing spatial polarization highlights a fundamental contradiction in China’s low-carbon trajectory. While eastern provinces leveraged technological innovation, industrial upgrading, and stringent environmental policies to achieve substantial emission reductions [
22,
23], pastoral and western regions experienced significant emission growth due to industrial relocation, resource-dependent development models, and delayed adoption of green technologies [
24,
25,
26]. This divergence underscores the limitations of one-size-fits-all policy frameworks and emphasizes the necessity for region-specific, adaptive governance mechanisms that account for local ecological capacities and socio-economic contexts.
Compared to countries such as Germany and Denmark, where livestock carbon reduction strategies primarily rely on uniform EU regulatory frameworks [
27,
28], China’s approach demonstrates greater flexibility through its differentiated regional governance. While European models emphasize strict compliance and technological standardization, China has adopted a dynamic “zoned governance” model that balances economic development with ecological constraints, particularly in its pastoral regions. This flexibility is especially evident in the western region, where vast geographical expanses, fragile ecosystems, and a high dependence on traditional livestock practices necessitate tailored interventions. Unlike the more industrialized eastern provinces, the west requires integrated strategies that combine ecological protection with poverty alleviation, infrastructure enhancement, and technological adaptation.
Additionally, the substantial geographical and socio-economic scale of China—as compared to relatively smaller and more homogeneous countries like Denmark or Germany—limits the applicability of rigid, one-size-fits-all regulatory regimes. In smaller states, uniform policies may achieve high compliance due to administrative cohesion and shorter governance chains. However, in China, with its expansive and diverse regions, such rigidity may prove inefficient or counterproductive. Therefore, China’s multi-level, adaptive governance model, which allows for regional experimentation and localized policy innovation, presents a pragmatic solution. These international comparisons highlight China’s unique governance flexibility and offer valuable insights for other large, heterogeneous developing economies seeking to balance economic growth with environmental responsibility.
Secondly, the dynamic evolution of decoupling states reveals that although strong decoupling remains predominant at the national level, regional fluctuations persist, particularly in resource-based and economically less-developed areas. The reappearance of expansive coupling and negative decoupling in provinces such as Inner Mongolia, Qinghai, and parts of the central region reflect structural challenges, including outdated production practices, weak regulatory enforcement, and insufficient market incentives for low-carbon transformation [
29,
30]. In addition, the spatial relocation of animal production from developed eastern regions to the central and western provinces has introduced new complexities. On one hand, such relocation alleviates environmental pressure in densely populated and economically advanced areas, supporting emission reduction goals through regional specialization. On the other hand, it may exacerbate carbon intensity in recipient regions lacking adequate infrastructure, environmental oversight, and technical capacity to manage large-scale livestock operations. For instance, rapid livestock expansion in Inner Mongolia and Xinjiang has outpaced the development of emission control systems, leading to localized emission rebounds despite national-level decoupling gains. To further clarify the interpretation of the decoupling elasticity coefficient (Equation (6)), it is important to note that when the growth rate of carbon emissions equals that of livestock economic output—both in sign and magnitude—the elasticity equals 1. This represents a state of perfect coupling, where carbon emissions and economic growth are proportionally linked. If both are increasing, the state is classified as expansive coupling; if both are decreasing, it is categorized as recessive coupling. These boundary cases highlight scenarios where decarbonization progress is minimal, as emissions closely track economic activity. Including these reference points enhances the interpretability of elasticity values and provides a more nuanced understanding of the coupling dynamics observed in different regions and time periods.
These findings suggest that sustaining long-term decoupling requires not only technological and policy interventions but also institutional reforms that enhance governance capacity, promote green finance, and incentivize behavioral change among stakeholders [
31,
32]. More importantly, a balanced strategy must be adopted that addresses both the benefits and risks of industrial relocation. Integrating environmental impact assessments and carbon responsibility-sharing mechanisms into relocation policies could help ensure that regional development aligns with national low-carbon objectives.
Thirdly, the shift from a unimodal to a bimodal distribution in carbon emission intensity, as evidenced by kernel density analysis, signals the emergence of “low-carbon clusters” in advanced regions and “high-carbon traps” in lagging areas. This pattern indicates that technological diffusion in the livestock sector is constrained by ecological heterogeneity, infrastructural disparities, and economic barriers. Unlike industrial sectors where convergence is often driven by market forces and standardized technologies, livestock systems demand tailored solutions that align with regional environmental conditions and production characteristics. Therefore, fostering localized innovation ecosystems and enhancing knowledge transfer mechanisms are pivotal to overcoming these diffusion bottlenecks [
33,
34].
Furthermore, the Theil index decomposition highlights that while inter-regional disparities have narrowed due to national coordination efforts, intra-regional inequalities—especially in the western region—remain pronounced. The recent uptick in intra-regional disparities within the eastern region also points to emerging challenges associated with industrial restructuring and localized policy implementation gaps. This dual-layered inequality necessitates a balanced policy approach that simultaneously addresses broad regional coordination and fine-tuned intra-regional adjustments.
The spatial econometric findings reinforce the critical role of spatial spillovers in shaping carbon emission dynamics. The significant positive spatial dependence identified by the SDM indicates that economic activities and environmental pressures transcend administrative boundaries, leading to complex inter-regional interactions. The asymmetric spillover effects—where economic growth in neighboring regions can offset local mitigation efforts—highlight the need for integrated cross-jurisdictional governance frameworks. Mechanisms such as carbon liability sharing [
35], eco-compensation schemes [
36], and coordinated carbon market systems [
37] could effectively internalize these externalities and promote collaborative decarbonization efforts.
Lastly, this study acknowledges its limitations, including the exclusion of upstream emissions from feed production [
38] and the reliance on geographical adjacency for spatial weight construction, which may not fully capture economic interdependencies. Future research should adopt a lifecycle perspective and develop hybrid spatial models that incorporate both physical proximity and economic linkages to enhance the robustness of spatial interaction analyses.
In conclusion, China’s livestock sector is undergoing a complex, nonlinear low-carbon transition marked by efficiency gains, persistent regional disparities, and significant spatial interactions. Addressing these challenges requires a multidimensional strategy that integrates technological innovation, differentiated regional policies, market-based incentives, and institutional resilience. The insights from this study not only advance the theoretical understanding of agricultural decarbonization but also provide practical guidance for policymakers striving to achieve sustainable and equitable low-carbon development.


