1. Introduction
Last-mile freight transport is one of the logistics chain’s most polluting and costly areas, and last-mile logistics involves goods delivery from distribution centers to final customers in urban areas. Consequently, innovative strategies and modern technologies in freight transport should be easily implemented in the short term [
1,
2,
3].
Efficiently managing the delivery fleet is essential to ensuring the delivery of goods with quality and speed. Therefore, routing is an intelligent alternative for structured distribution, as it allows for logistics control, flexibility to meet customer needs, the optimization of delivery distance and time, and fuel consumption minimization [
4].
Logistics operations significantly impact various aspects of sustainability, such as the environment, due to pollutant emissions; finance, due to high delivery costs; and society, due to traffic congestion. Thus, sustainable development in various logistics activities has influenced the pursuit of solutions that minimize transportation inconvenience [
5,
6,
7].
Among the alternatives for integration into a sustainable transportation system are electric vehicles (EVs), whose benefits focus on energy efficiency, fleet optimization, and environmental impact reduction [
3,
5,
6]. EVs face challenges regarding routing variants, such as delivery time windows, partial recharge strategies, recharge time, nonlinear charging functions, different charging technologies, a heterogeneous fleet, energy consumption models, dynamic traffic conditions, location routing, and nonlinear tariff functions. Consequently, optimization methods encompass dynamic and uncertain scenarios, as vehicles have limited capacity and autonomy and time window constraints for recharging on journeys [
8].
Nevertheless, methods involving freight transportation logistics must be developed for higher EV use incentives because electric trucks require integration into a delivery infrastructure aligned with charging points. What enables this is the use of the concept of mobility as a service (MaaS), which seeks to promote mobility on demand. MaaS helps to increase network efficiency by optimizing supply and demand, especially during peak hours when some routes or electric stations are underutilized, in addition to minimizing freight transportation costs for companies and reducing traffic congestion [
9].
Hence, this paper is relevant for fostering the transition to electromobility in the transportation sector, efficiently integrating EVs into the logistics chain to minimize costs and maximize utility while showing the customer the best mobility solution according to their travel needs.
In this context, this study developed a methodology to support logistical analysis involving the last mile for electric trucks. The methodology provides mobility as a service, offering a solution that compares routes based on the shortest distance, shortest operation time, and lowest costs for delivering goods from distribution centers to consumers. Additionally, it considers time windows for battery charging and different charging tariffs for recharging electric vehicles. Therefore, the method will provide decision-makers with greater flexibility in choosing routes that best meet delivery objectives.
The remainder of this paper is organized as follows.
Section 2 provides a brief literature review.
Section 3 gives a brief description of the studied problem and outlines the methodology of the study.
Section 4 presents the simulation results, followed by an analysis of the data.
Section 5 develops a discussion of the results.
Section 6 concludes this work.
2. Literature Review
Population growth, e-commerce development, consumer behavior changes, innovation, and sustainability drive last-mile logistics [
10]. However, the delivery process causes externalities, such as pollutant emissions, traffic congestion, and infrastructure wear, which represent an expensive part of the supply chain. In urban centers, these externalities are intensified by high delivery rates. Moreover, it is essential to understand this issue to increase logistics efficiency, minimize externalities, and enhance environmental, economic, and social sustainability [
1,
2,
7].
Introducing electric fleets into last-mile transportation is essential for promoting the transition to sustainable energy sources. According to [
8,
11], the advantages of using EVs for product distribution compared to traditional vehicles include lower pollutant emissions, reduced distribution costs, and the ability to recharge using renewable energy. Similarly, Refs. [
1,
3,
12,
13] evaluated last-mile logistics innovations to reduce externality costs in achieving sustainable logistics and minimize the externalities produced by goods delivery.
However, expanding EV use promotes challenges, such as charging infrastructure development, limited vehicle autonomy, fleet vehicle varieties, and recharging time-window constraints. References [
2,
14] analyzed the strategic, operational, environmental, and routing challenges faced by EV distribution fleets, and Ref. [
15] highlighted the impact of ambient temperature on EV routing decisions in logistics operations. Additionally, Ref. [
6] emphasized that developing vehicular technologies and introducing new business models require new strategies to control the transportation system effectively.
Glodowska [
16] examines the implementation of electromobility in the delivery market. In this regard, a multi-criteria method was used to select the vehicle, and a route simulation program was used to optimize delivery routes, which allowed the calculation of time and distance for each route. The results demonstrate the feasibility of introducing EVs into the delivery market, even if they require some adaptations to current routes.
Moreover, Ref. [
17] helped evaluate the route optimization model to identify the best routes for last-mile delivery EVs for different demands, package densities, and vehicle technologies. Ref. [
18] also emphasized that fleet managers might reduce carbon emissions by up to 30% by using a route optimization model for heavy-vehicle fleets and production reallocation. Finally, Ref. [
19] developed a model that evaluates energy consumption based on vehicle speed.
According to [
20], path optimization is essential for reducing costs and maximizing product distribution profits. Calculating these costs provides the shortest path for each vertex, ensuring the discovery of an optimal path by exploring all available possibilities. Ref. [
21] highlighted Dijkstra’s algorithm for its simplicity, representing an optimal solution to find the shortest path between nodes in a network.
Amini and Karabasoglu [
22] presented a routing strategy for vehicle charging to solve least-cost routing, which uses EVs to communicate with competing charging stations to exchange data, such as electricity cost, energy demand, and arrival time. The EV routing problem is solved to minimize the total trip cost using the Dijkstra algorithm, with input from the EV battery management system, the electricity cost from charging stations, and the traffic conditions of the transportation network.
In [
23], the authors presented the mechanics of dynamic wireless charging for EVs, using mobile energy disseminators (MEDs) that act as mobile charging stations. The proposal of the article was to develop routing that uses MEDs or static charging stations based on Dijkstra’s algorithm. In [
24], a dynamic wireless power transfer (DWPT) deployment model was analyzed. The study presents a total cost minimization problem, which includes the operational and deployment costs of DWPT. Unlike [
23,
24], our model considers variable tariffs at charging stations, which affect the total cost of the route. This is a critical factor in real-world logistics operations, as charging costs can vary significantly depending on the location and time of recharge.
However, the technologies considered in [
23,
24] still face difficulties in being implemented in countries like Brazil due to limitations in the current infrastructure and the high cost of adaptation to support these new recharging models. In other words, our study offers a practical and scalable solution that can be implemented in regions with limited infrastructure. This makes our work more applicable to real-world logistics operations, particularly in developing countries.
In [
25], a system for connected electric vehicles (CEVs) is evaluated, aiming at the application of ride-sharing operations and dynamic network scheduling (V2G). Ride sharing refers to the provision of a transportation service in traffic networks for multiple passengers who have overlapping travel plans. To evaluate the physical distance of the transportation network, the distance from one specific point to another within a region is determined and modeled as a directed graph. However, this study considers dynamic wireless charging for CEVs and does not consider the stopping time for recharging at charging stations, an issue addressed in the current study.
Tzouras et al. [
26] demonstrated that Dijkstra’s algorithm provides an optimized routing system. This method allows the joint application of Dijkstra and combinatorial optimization to solve the traveling salesman problem.
Fox et al. [
27] provided an option to solve the traveling salesman problem through the brute-force algorithm, which tests all possible solutions. Ref. [
28] applied this algorithm so that each iteration could evaluate the total route distance to minimize the distance between destinations while respecting the limited battery capacity of EVs.
Sweda et al. [
29] analyzed the problem of finding the path with the lowest cost for EVs, considering recharging along the route. Ref. [
30] evaluated the energy efficiency in freight transportation using heavy vehicles.
For [
31,
32], users’ charging behavior can significantly impact the performance of the electrical grid. Existing charging patterns and their impact on the grid are determined by user convenience and the cost associated with existing tariffs; so, these patterns are not optimal for the system and significantly impact the grid. Incorporating a pricing structure to encourage users to recharge at off-peak times can minimize peak load demands on the network, leading to optimized infrastructure usage.
The related works listed above show that the electric vehicle problem has been explored in a variety of ways. Electric mobility offers significant advantages, such as reducing the use of natural resources and saving operating costs, but it faces challenges such as long battery recharging times and the limited range of EVs.
This research has explored optimization methods, such as Dijkstra’s algorithm and the traveling salesman problem, to improve the efficiency of heavy vehicle fleets for the last mile, mainly applied to development in Brazil, as well as assessing the impact of recharging during the journey. Therefore, this paper is relevant to driving the transition to electromobility in the transportation sector, presenting a methodology with other route definition alternatives, such as minimizing operating costs and time, and mainly assessing the impact of recharging on future routes.
3. Materials and Methods
Electric truck use aims to maximize transportation efficiency during last-mile goods distribution in logistics. However, due to circulation and parking restrictions in urban centers, the most suitable truck for this application is the small electric truck. Therefore, the modeling proposed in this study used small-sized freight vehicles.
The objective function for optimization comprises the following variables: reducing route distance (D), reducing recharging and goods distribution costs (C), and minimizing routing times (T) considering recharge operations. Equation (1) formulates the proposed mathematical model to solve this problem, where the decision variables xij represent vehicle displacement from i to j (i and j are the specific locations):
The input data for modeling development were initially defined as follows:
Autonomy;
Locations of charging stations, customers, and distribution centers;
Customer service time (h);
Recharge tariffs per kilometer (R$/km);
Nonlinear battery charge rate (0–20%, 20–80%, 80–100%);
Average speed of the vehicle on different types of roads (streets, avenues, and highways).
The restrictions on EV capacity and autonomy, maximum travel time, and vehicle recharging times determined the problem limitations.
According to the model of the work regime of Brazilian industries, it was taken into consideration that the truck must execute a previously defined delivery route during an eight-hour workday. So, only two stops at charging stations were planned to respect the travel time limit and the workday, providing sufficient autonomy to fit the last-mile theory. The defined premises were based on the time limit of the workday and the maximum mileage covered by the truck in urban areas but can be adjusted according to the client’s needs, thus expanding their applicability.
The existence of sufficient chargers at each charging station and their constant availability to meet the demand are assumed. In other words, the vehicle recharges whenever it arrives at any charging station.
Moreover, some resources and characteristics were evaluated and considered during the modeling process, such as the following:
Operation type: goods delivery to end customers;
Product demand: deterministic, as it is known beforehand;
Distribution center: considered a single depot;
Planning horizon: short term, as it occurs daily;
Optimization type: individual route per vehicle.
Route optimization is essential to reduce costs and maximize product distribution profits. Among traditional routing problems, the traveling salesman problem (TSP) stands out. Therefore, it was applied with the proposed methodology to minimize costs and the total traveled distance.
Having a limited number of stops at charging stations per route implies that the brute-force approach can solve TSP, as it typically includes a maximum of two charging stations per route. The algorithm tests all possible solutions, providing the optimal problem resolution [
28].
TSP uses a basic mathematical model, assigning the objective function to minimize the total traveled transportation cost in forming a Hamiltonian path. However, TSP requires a graph representing only the points to be covered. Thus, it is necessary to apply a method that allows the distances between all points of the network to be obtained, and for this purpose, Dijkstra’s algorithm is applied. This algorithm is an optimal solution to find the shortest paths between all vertex pairs.
The traffic network from a distribution center to each end customer is abstracted to form a directed graph. The points represent the distribution center, charging station, and each customer; the graph edges indicate the routes; and the weight of the edge between nodes is the distance of each route [
20].
Method Solution
The proposed system was developed in the Python 3.12.2 language. For the implementation of the Python code, a computer manufactured by Dell Computadores do Brasil LTDA, located in Hortolândia, São Paulo, Brazil, with the following specifications, was used:
Processor: 13th Gen Intel(R) Core (TM) i7-13650HX 2.60 GHz (Intel, Santa Clara, CA, USA);
Installed RAM: 64.0 GB;
Graphics card: nVidia RTX4050 (Nvidia, Sunnyvale, CA, USA);
System type: 64-bit operating system, ×64-based processor.
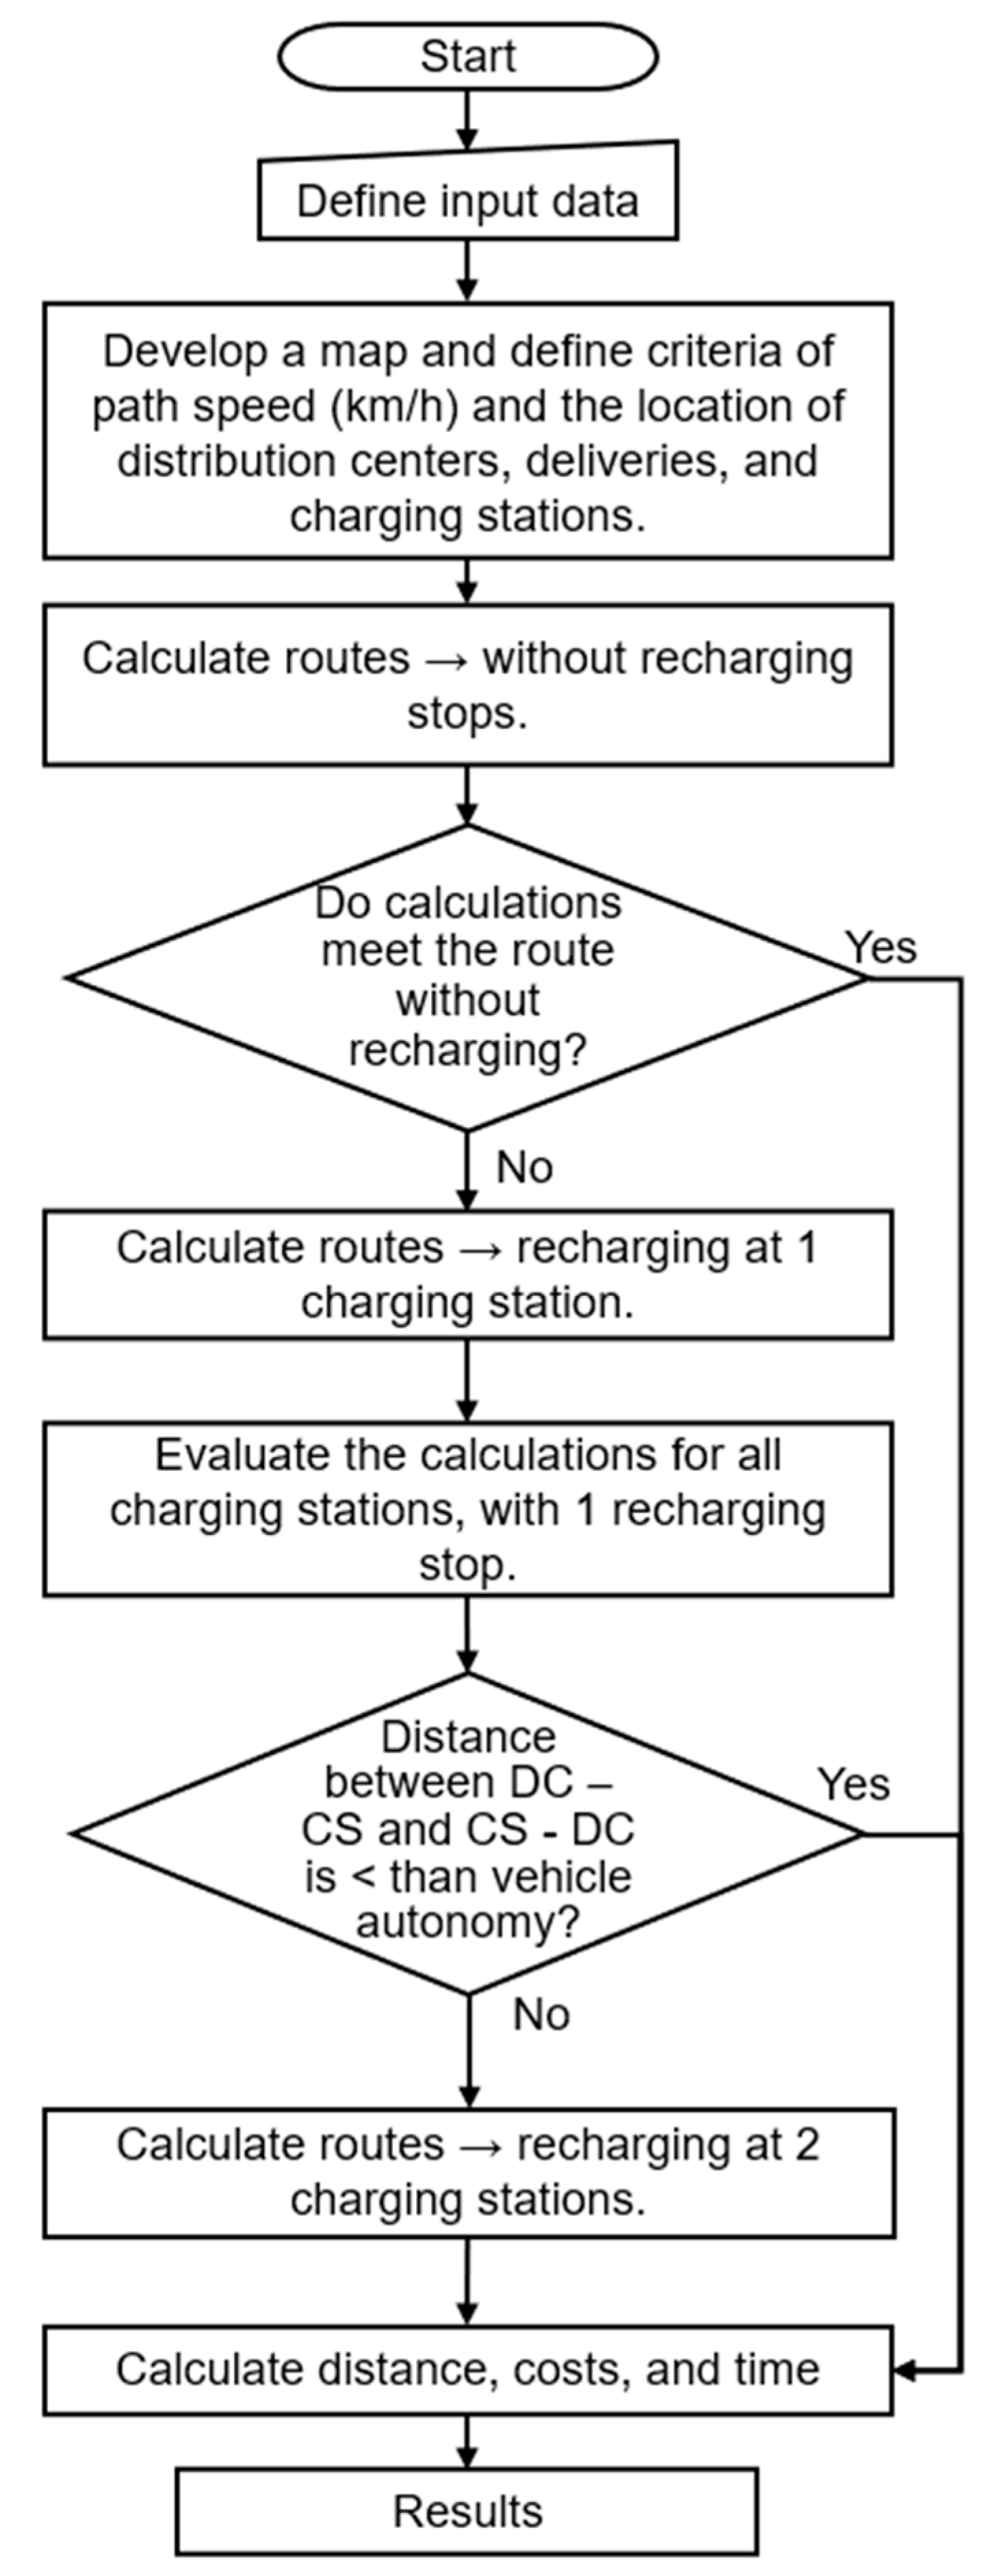
The system algorithm identifies the shortest path from each node to the source node, which is considered visited and added to the path. Dijkstra’s algorithm output lists the shortest paths, providing the shortest and fastest route.
EVs may recharge at charging stations along the route, but this incurs charging costs and additional stop time due to the required recharging time, which must compose the total route costs and time.
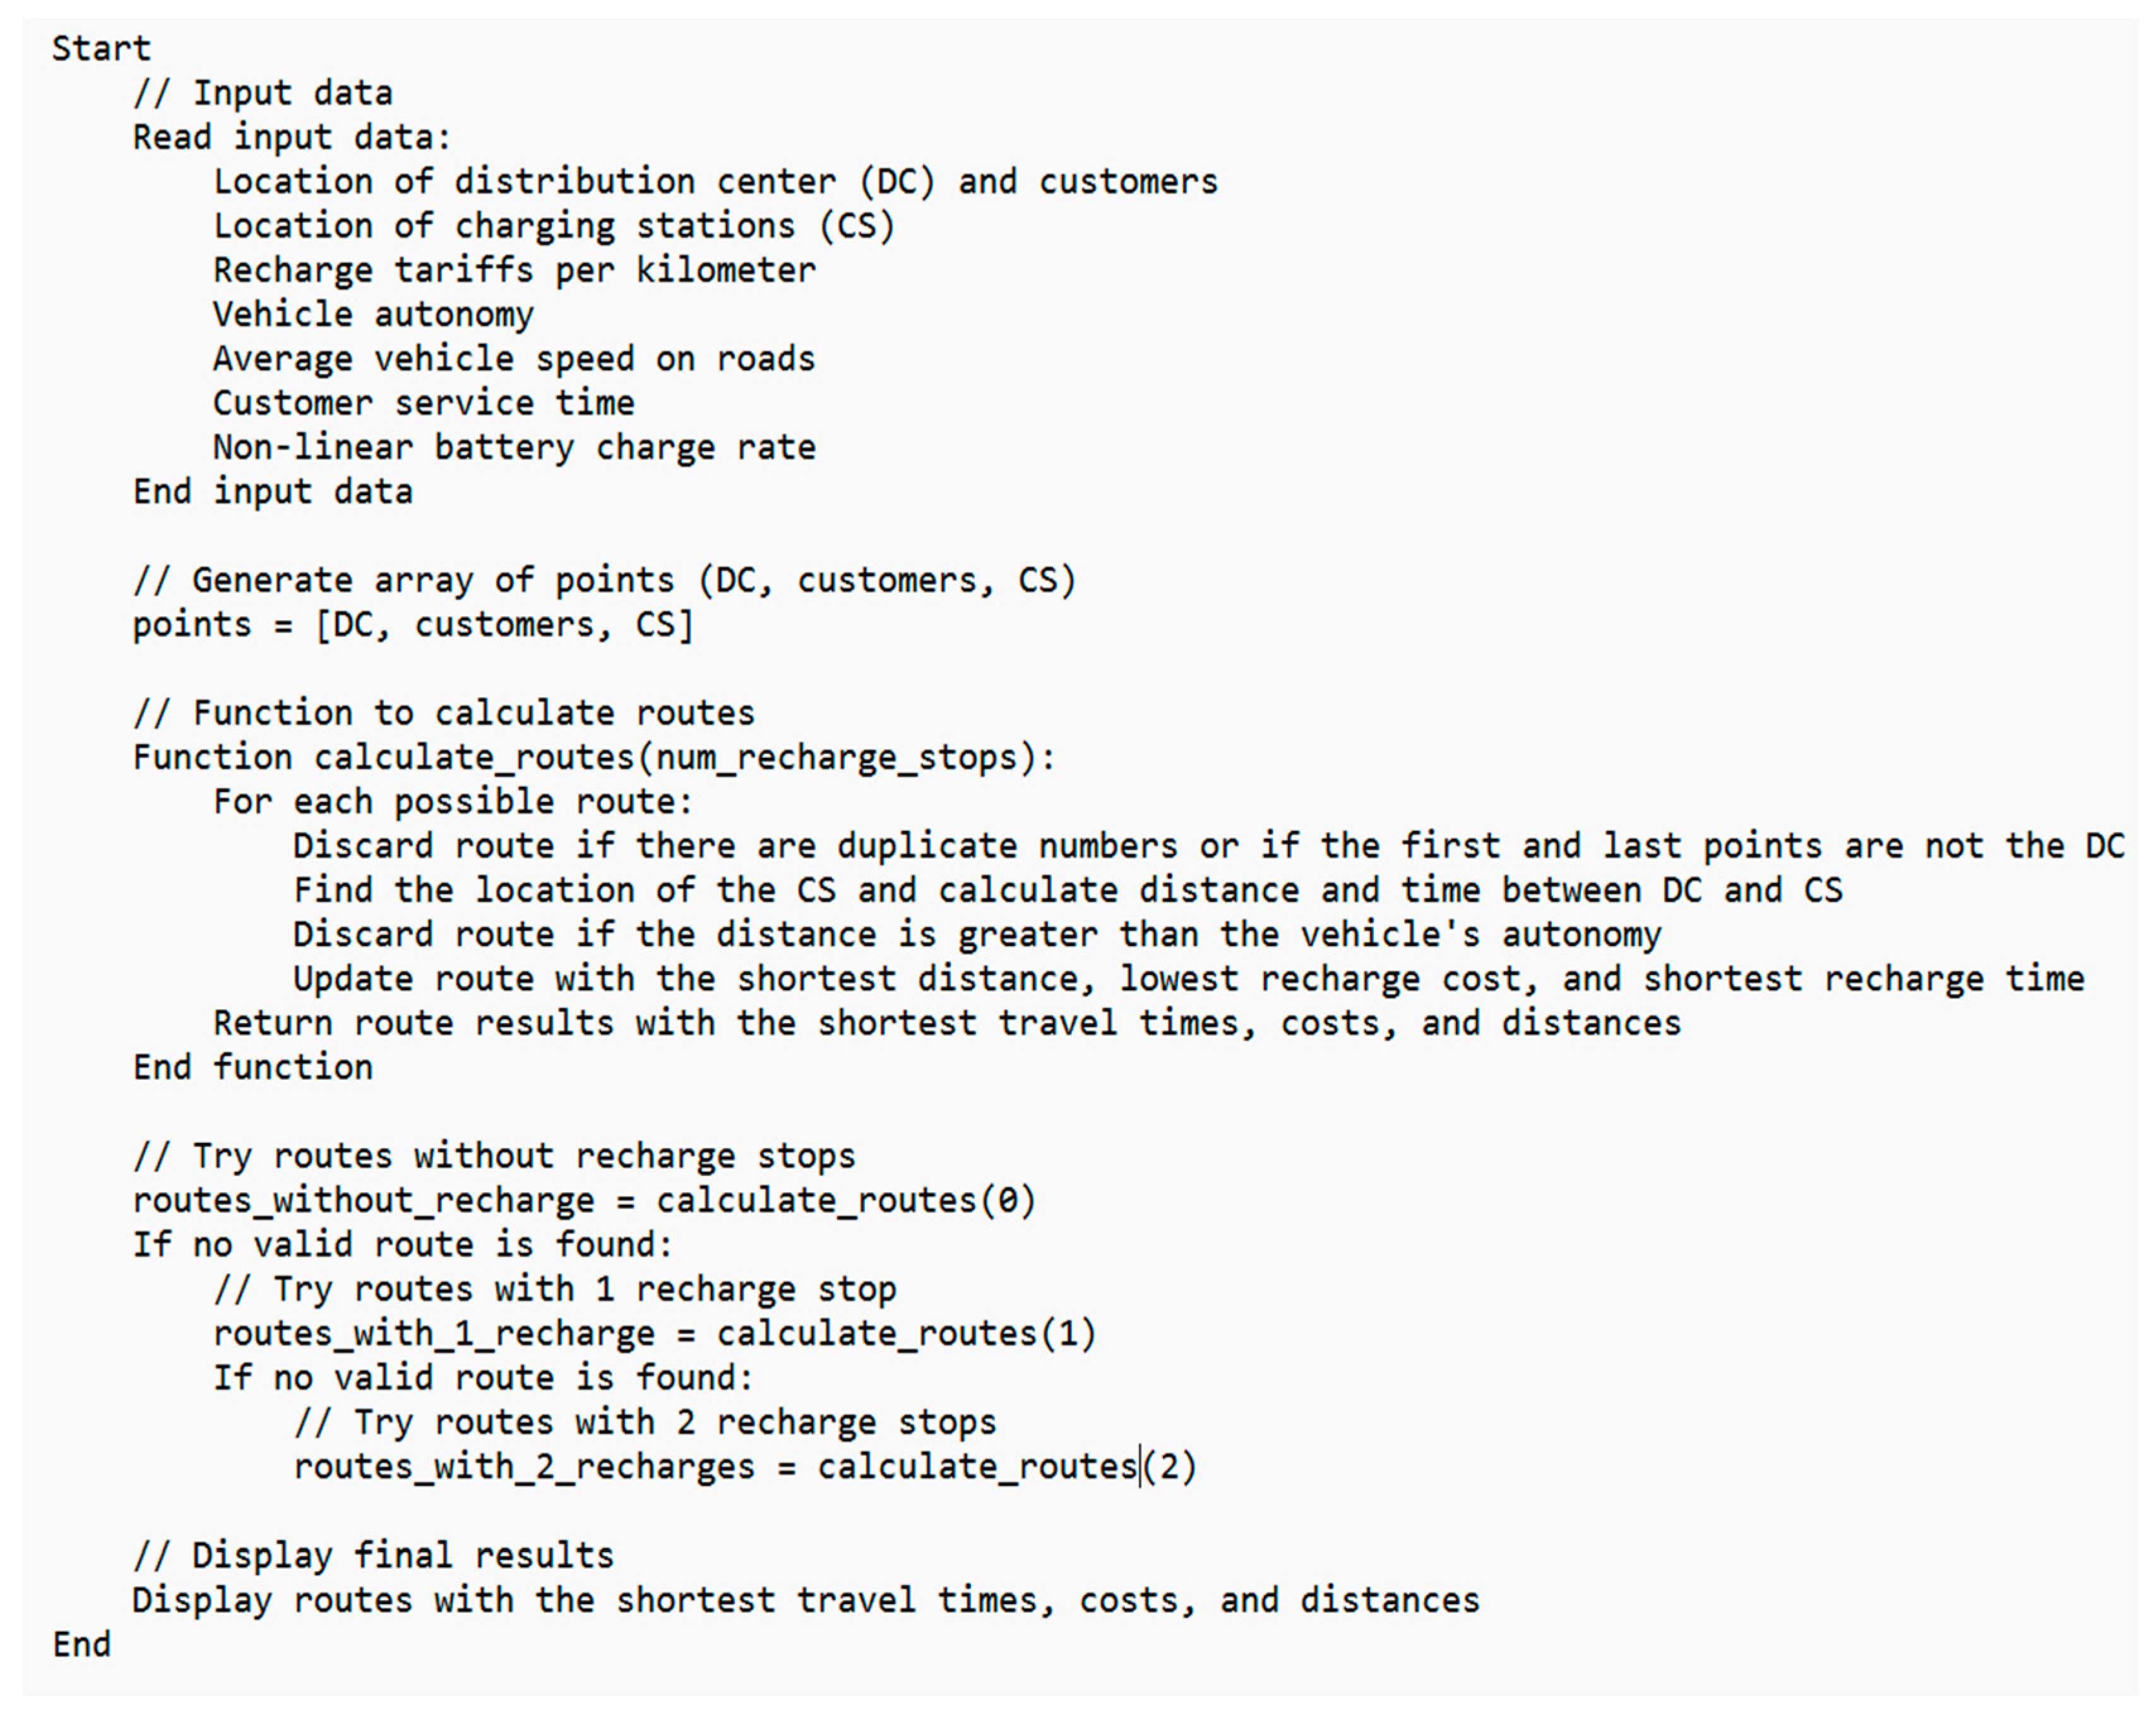
Figure 1 illustrates the route optimization process, showing the basic algorithm function.
The first optimization verifies whether the route covers all the delivery points without recharging. Next, using Equations (2) and (3), each route that is valid is examined to determine if the total route distance (DistT) is greater than or equal to the minimum route distance (MinDist) and if it does not exceed the maximum vehicle autonomy (MaxAut):
Equation (3) evaluates the route with the lowest cost, and Equation (4) calculates the total cost (CostT) using the total distance and recharge costs at the distribution center (DC) (R
$/km):
Equation (3) determines the fastest route. Thus, the calculation of total stop time (TST) represents the stop time for deliveries multiplied by the number of stops added to the total travel time (TimeT), as in Equation (5):
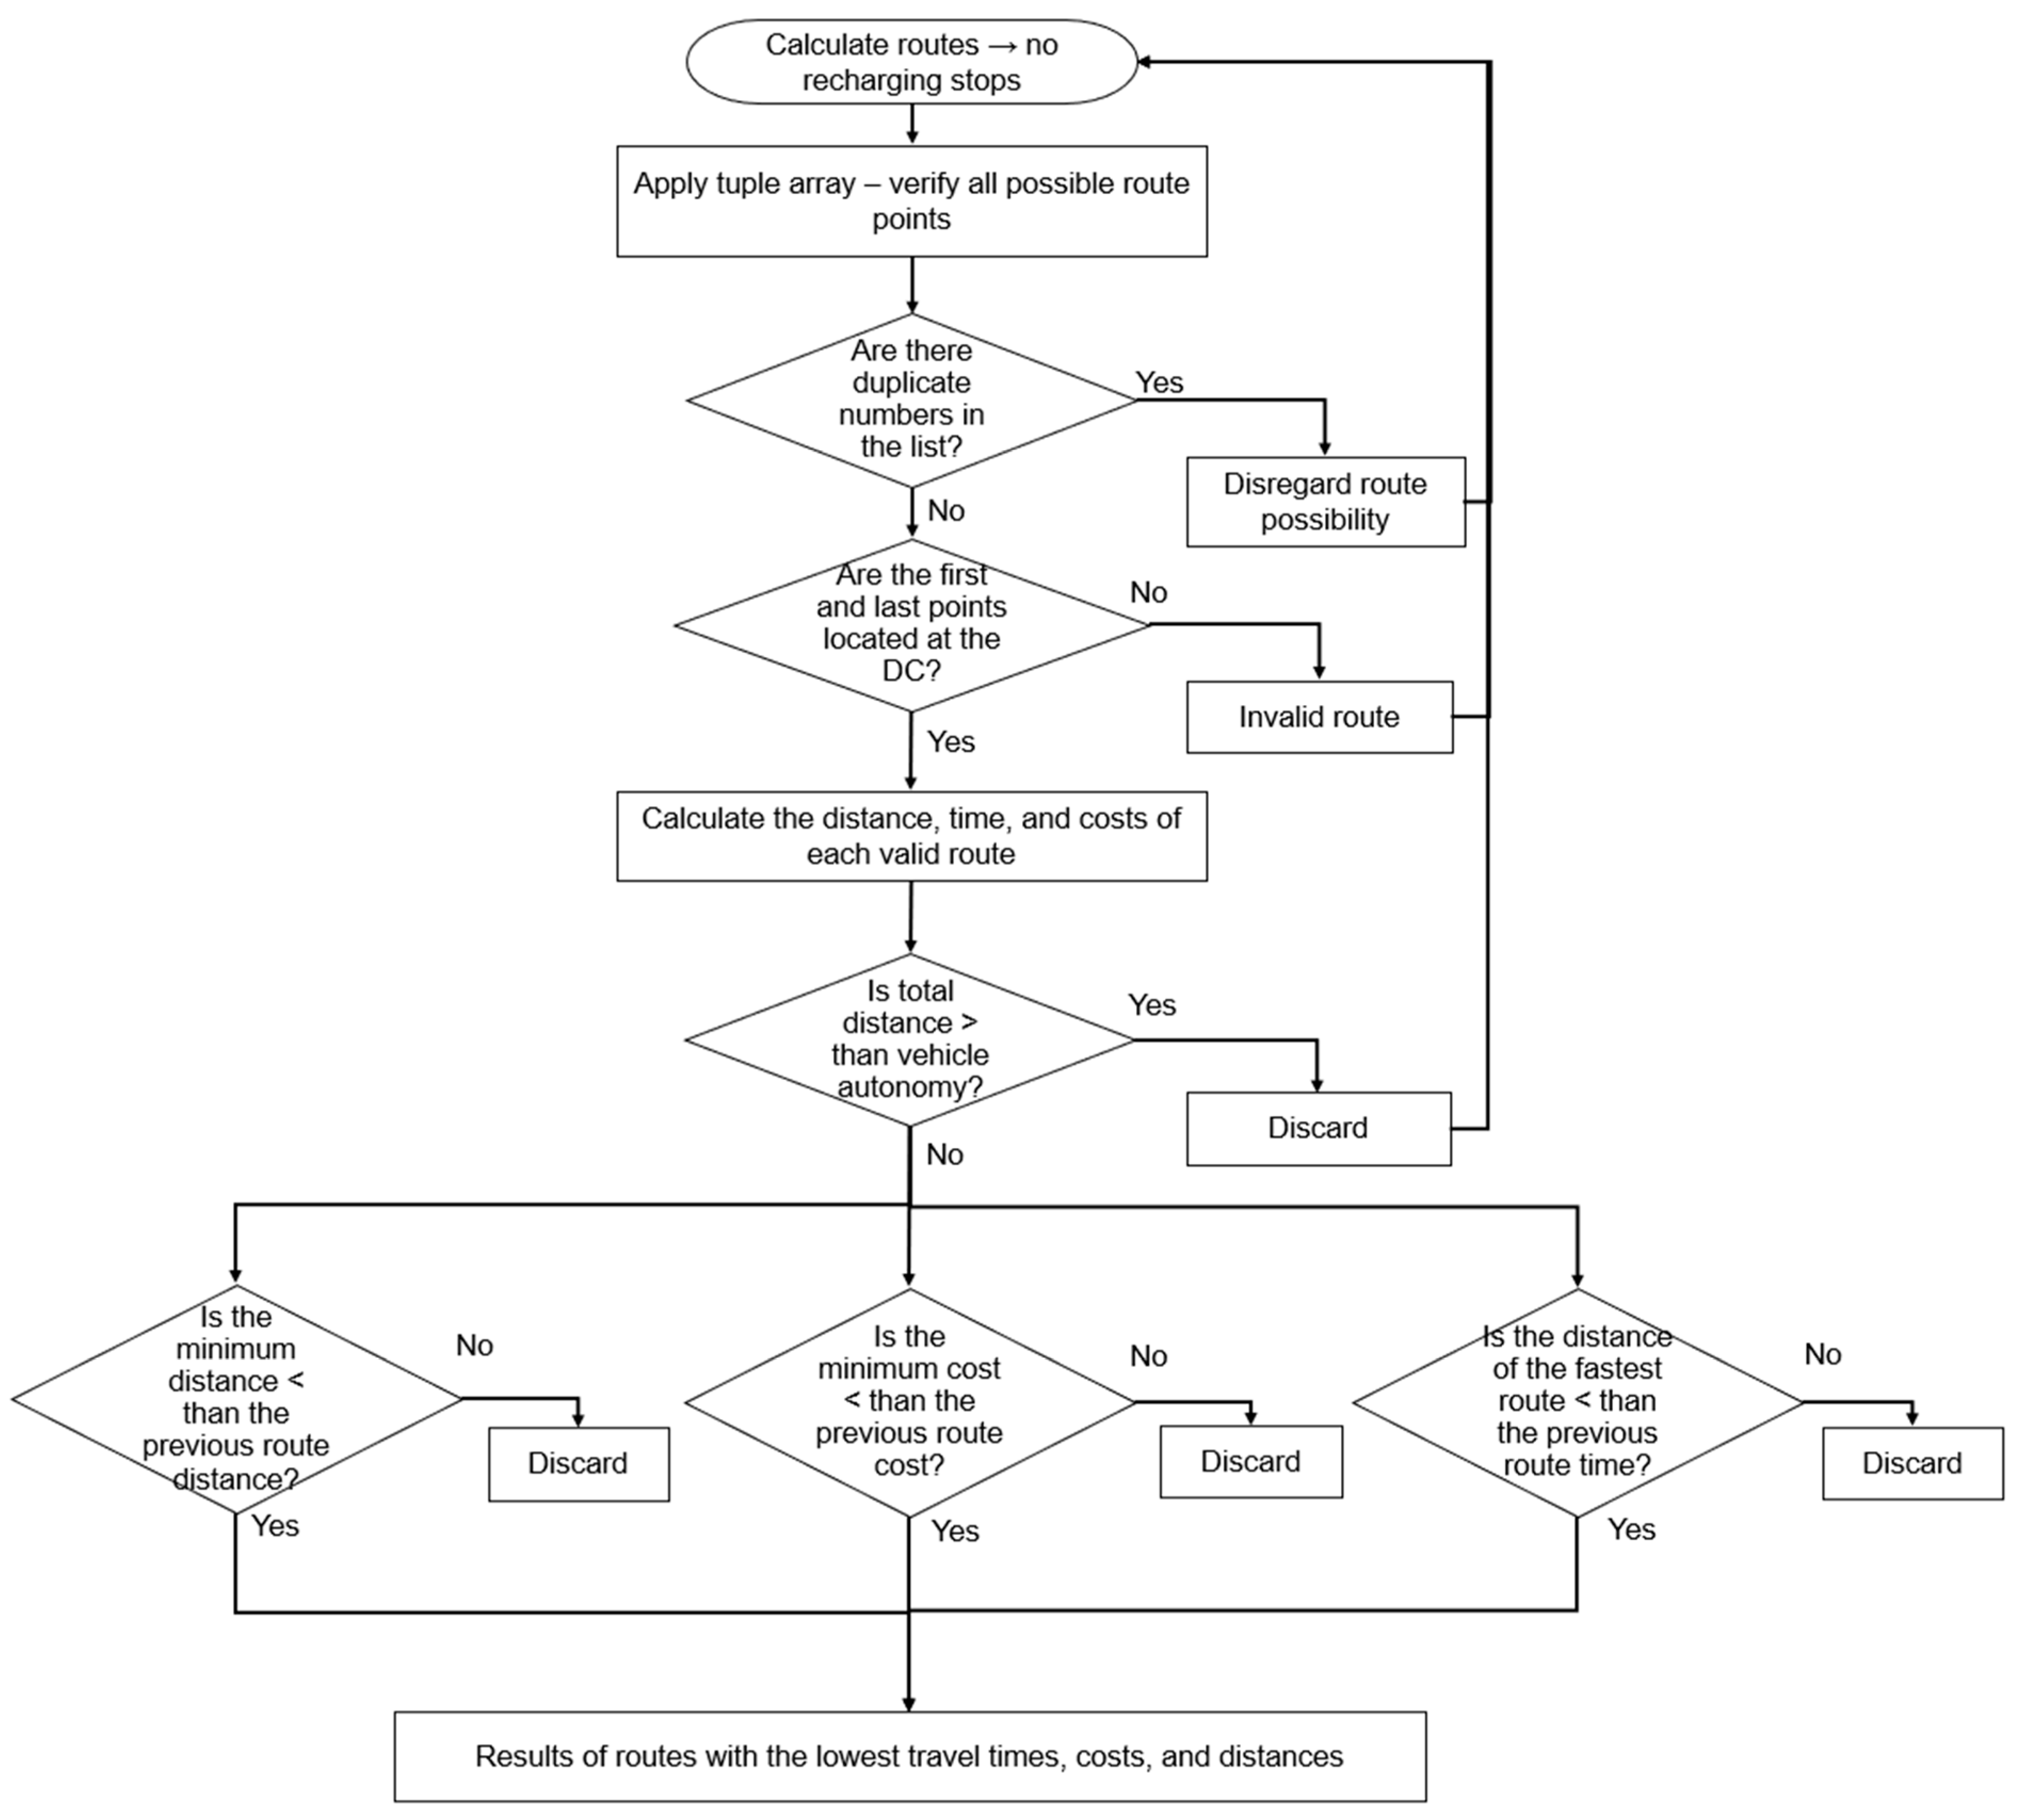
Costs and travel time were calculated after obtaining the route with the shortest distance. Route costs and distance were determined for the fastest route, and route time and distance were calculated for the route with the lowest costs. Both situations were based on the described equations.
Therefore, the flowchart in
Figure 2 illustrates whether the route covers all delivery points without recharging.
The second verification analyzes whether the route covers all the delivery points considering one recharging stop at the charging station. The algorithm searches for the shortest distance between the distribution center and the charging station (DistTa) and between the charging station and the distribution center (DistTb). Then, the total distance of the points is added for the two routes.
The total route distance (DistT) is the sum of DistTa and DistTb. Thus, each valid route verifies that it does not exceed the maximum vehicle autonomy (MaxAut), according to Equations (2), (6), and (7):
The total cost (CostT) is calculated to define route costs, comprising the sum of CostTA and CostTB. CostTA calculates the additional recharge at the charging station (CS) (RechargeCS) based on the required distance to complete the route, as in Equation (8). Meanwhile, CostTB calculates a total recharge at the distribution center with the charging tariff of the consumer unit (R
$/km), according to Equation (9):
The fastest route verifies whether DistTa and DistTb are shorter than or equal to the MaxAut of EVs. Thus, Equation (12) calculates the total route time (TimeT). The total stop time (TST) corresponds to the stop time at the delivery point and the total number of stops. The total recharge time (TRT) converts DistTa and DistTb from kilometers to the equivalent recharge percentage, respecting the charging time in each cycle, as in Equation (10):
The battery state of charge (SOC) influences Equation (11) due to the charging curve, which represents speed fluctuation during charging. This factor indicates the battery charge level as a percentage of its capacity, although some vehicles may charge at a higher rate than others. The percentage variables can be modified according to the behavior of each vehicle, but for this study, it was assumed that the battery should avoid exceeding the 80% or lower 20% range to maintain battery life [
33,
34,
35].
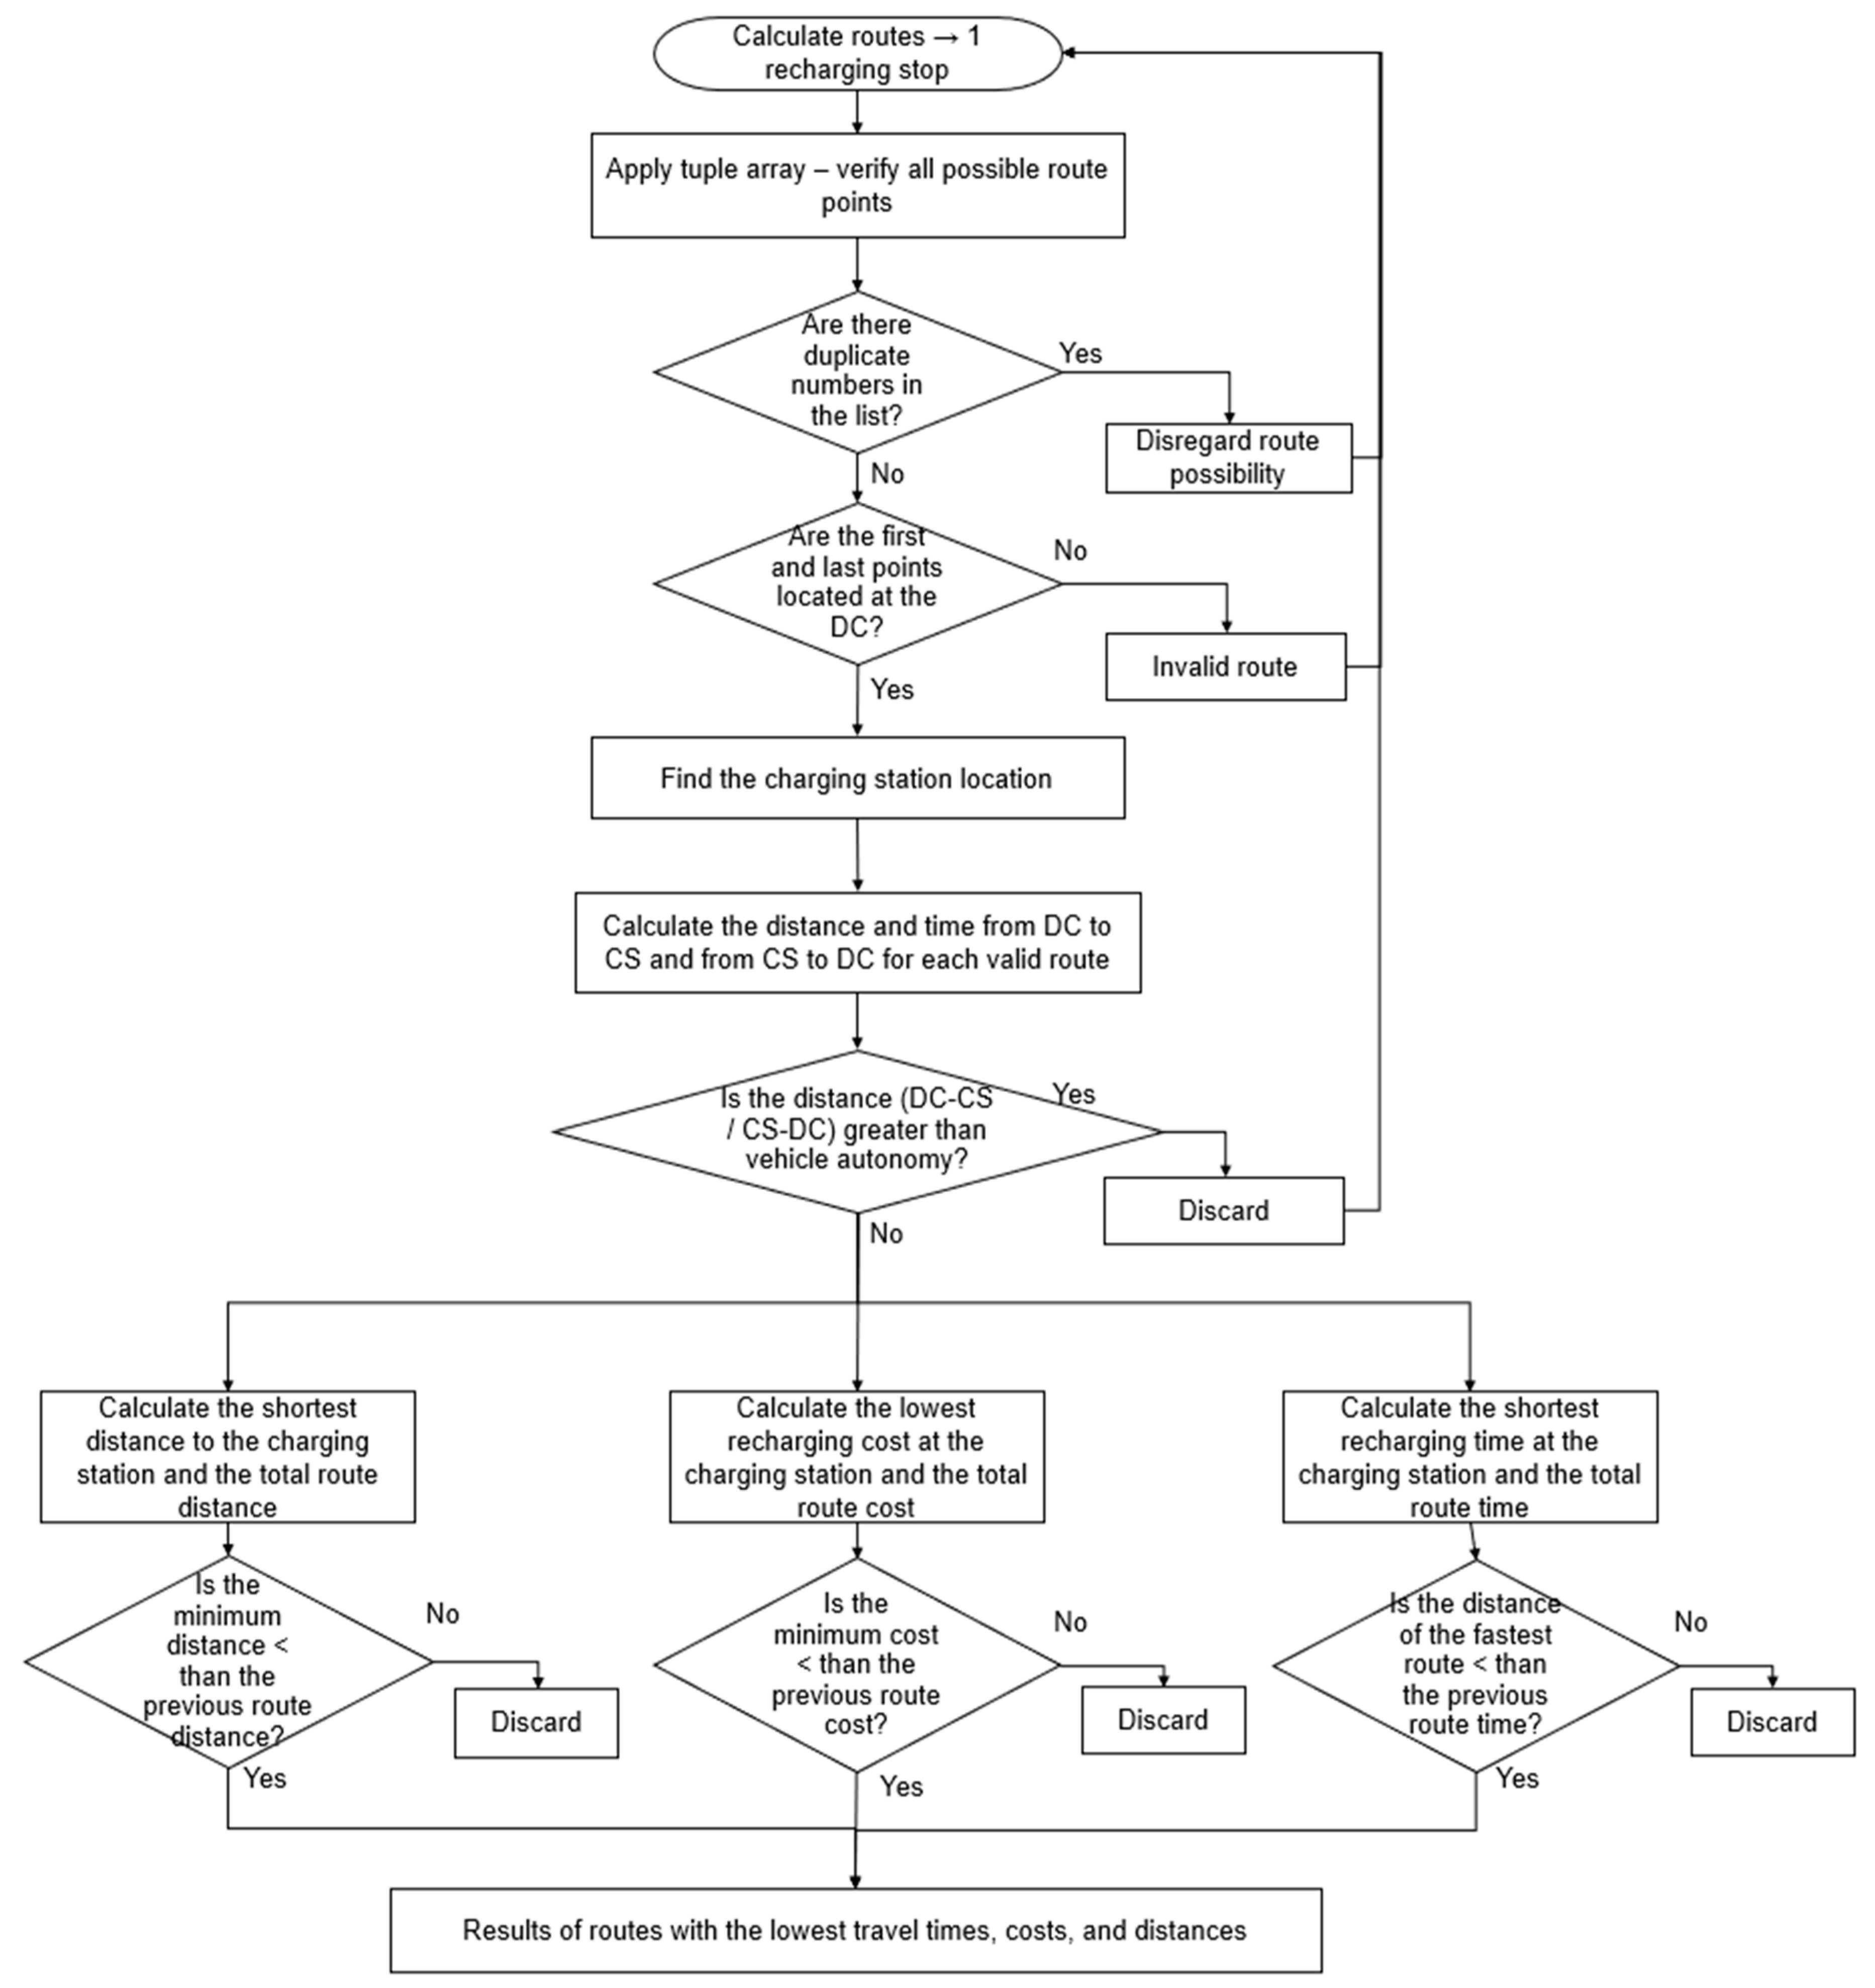
Route costs and time were calculated after obtaining the route with the shortest distance, route costs and distance were determined for the fastest route, and route time and distance were calculated for the route with the lowest costs.
Furthermore, the flowchart in
Figure 3 illustrates whether the route covers all delivery points considering one recharging stop at the charging station.
The third analysis considers the need for two additional recharge stops. Hence, the algorithm searches for the shortest distance between the distribution center and the charging station (A), between charging stations (B), and between the charging station and the distribution center (C). Thus, Equation (13) defines the sum of the total distance for each route, where
i is the starting point and
T is the total number of paths in each route.
Equation (3) and the constraints in Equations (2), (14), (15), and (16) calculate the shortest distance, evaluating whether each valid route exceeds maximum vehicle autonomy (MaxAut):
The algorithm searches the combination of two positions up to all possible charging point combinations, finding the shortest position of recharge points relative to the vehicle location.
Including two recharge stops, the algorithm calculates the costs with different charging rates and conditions related to charging station distances and locations. Put another way, the algorithm determines battery recharge by taking into account variations in charging tariffs; if a lower cost is available, it will fully charge the battery at station 1 and enough at station 2 to reach the distribution center. However, if charging station 1 is more expensive, it only charges enough energy to reach station 2 and then charges the necessary amount to reach the distribution center.
Therefore, the total cost (CostT) calculation is the sum of CostTA, CostTB, and CostTC. If charging station 1 has a lower cost than station 2, the composition of CostT is as follows:
If charging station 2 has a lower cost than station 1, the composition of CostT is as follows:
The fastest route verifies whether DistTa, DistTb, and DistTC are shorter than or equal to the MaxAut EVs. Then, the calculation of total route time (TimeT) is evaluated according to Equation (23), which includes the total time of routes A, B, and C, the total stop time at the delivery point (TST), and the total recharge time (TRT):
The algorithm identifies the current battery percentage and the recharging demand until the next charging point, verifying the recharge time at the charging station (TRT CS). It is noteworthy that the algorithm prioritizes the fastest recharge times. In other words, charging station 1 may refuel 80% to 100% to ensure that charging station 2 does not recharge 0% to 20%, as it would take longer. Hence, the time at charging stations 1 (CS1) and 2 (CS2) may be added to obtain TRT, based on the condition described in Equation (24):
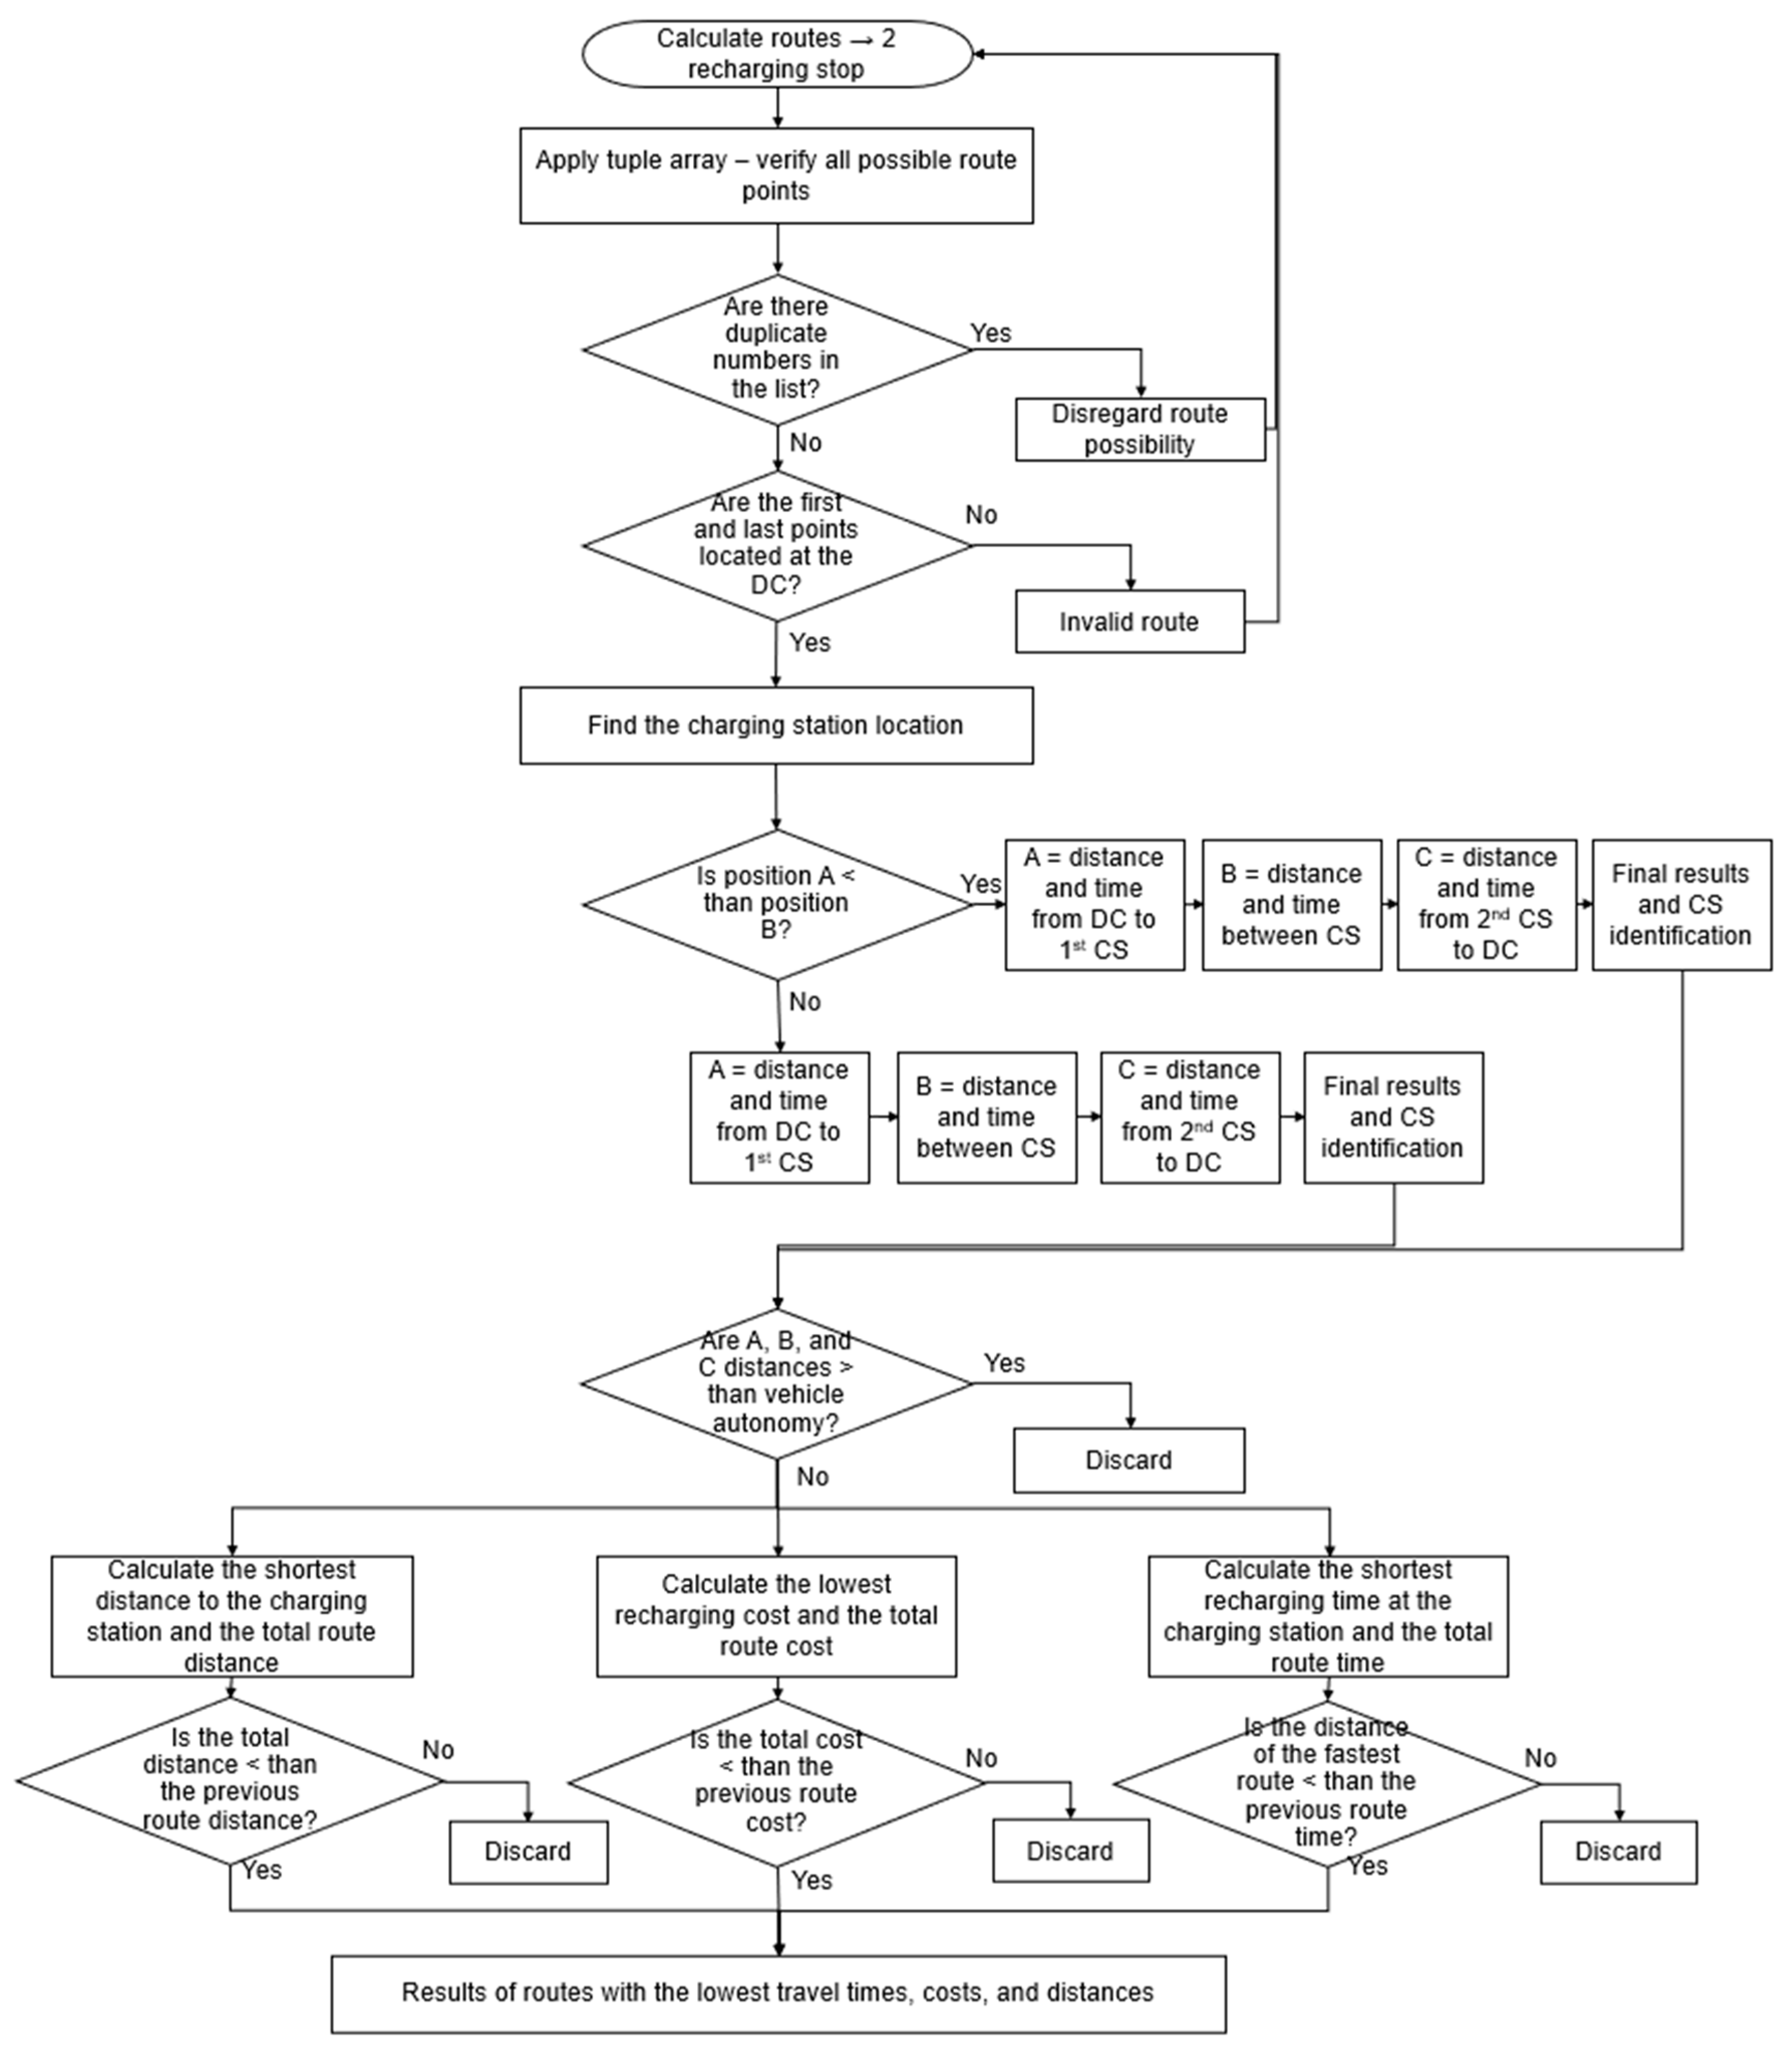
Route costs and time were calculated after obtaining the route with the shortest distance, route costs and distance were determined for the fastest route, and route time and distance were calculated for the route with the lowest costs. This analysis provided the best transportation alternative.
Therefore, the flowchart in
Figure 4 illustrates whether the route meets all the delivery points considering the need for two additional recharging stops at the charging stations.
After the detailed description of each implementation step,
Figure 5 illustrates an algorithmic roadmap, providing a simplified and accessible view of the processes that make up the proposed approach. The purpose of describing the algorithm is to facilitate understanding of the logical sequence of actions to be performed, thus contributing to a better assimilation and replication of the presented methodology.
4. Results
The case study simulated different routing situations to validate the methodology for last-mile route optimization. The simulations occurred under three conditions: two recharging stops, one recharging stop, and no recharging along the route.
4.1. Route Optimization with Two Recharging Stops
Route optimization with two recharging stops occurred when the planned route exceeded the vehicle’s autonomy since one recharge did not provide the necessary energy. Thus, the system identified the need to include two recharging stops during routing.
The proposed case study calculated the battery recharge time and average autonomy based on a small electric truck, model JAC Motors iEV1200T, with a load capacity of 3.50 tons and a battery capacity of 97 kWh [
36].
To define the locations of the distribution center, delivery points, and charging stations, random geographical coordinates were inserted for the region of Rio Grande do Sul, Brazil; but it should be noted that the methodology can be applied in other regions of the world, specified as follows:
Distribution center: −28.266812, −52.362411;
Delivery point 1: −28.235247, −52.380498;
Delivery point 2: −28.315844, −52.778516;
Delivery point 3: −28.388750, −52.699924;
Delivery point 4: −28.804628, −52.506756;
Delivery point 5: −28.847121, −51.871711;
Delivery point 6: −29.172479, −51.514779;
Charging station 1: −28.233630, −52.384654;
Charging station 2: −28.297492, −52.748277;
Charging station 3: −28.798167, −52.515064;
Charging station 4: −29.193387, −51.543094.
The average stop time per delivery point was based on [
37]. Thus, the input data are presented below:
The truck departs from the distribution center with a fully charged battery (100%);
Recharge tariffs per kilometer (R$/km): distribution center, R$1.00; charging station 1, R$2.50; charging station 2, R$3.10; charging station 3, R$2.90; and charging station 4, R$2.60.
Average stop time of 10 min per delivery point;
Autonomy: 200 km
Average vehicle speed on roads: speed of 35 km/h in streets, 50 km/h in avenues, and 60 km/h on highways;
Battery charging time in each phase. There are three charging time ranges for the charging curve relative to battery percentage: 0–20%—2 min for each 1% of the battery; 20–80%—0.5 min for each 1% of the battery; and 80–100%—1.5 min for each 1% of the battery.
Optimization was simulated for one distribution center and six delivery points, as the trucks were small with limited cargo capacity. Additionally, four charging stations were included with different charging tariffs, and the limit of recharging stops was two charging stations. Some input data were randomly mixed during the simulations to evaluate the efficiency of the developed algorithm.
The results for the delivery routing were obtained as described in
Table 1. The simulation resulted in three possibilities for stops at the charging stations adapted to the scenario. Each of these possibilities resulted in three routes: the route with the lowest cost, the route with the shortest time, and the route with the shortest distance.
Additionally, it was possible to obtain a summary of the best results generated by the optimized routes with the shortest time, lowest cost, and shortest distance, as detailed in
Table 2. The summary of the best alternatives allows the company to select the priority that best aligns with its objectives and the needs of the end customer.
The proposed simulation exceeds the employee’s working hours. Based on the results obtained, the person responsible has the option of evaluating the need to serve all customers defined for that route or offering an additional amount to the employee to work for a longer period than necessary.
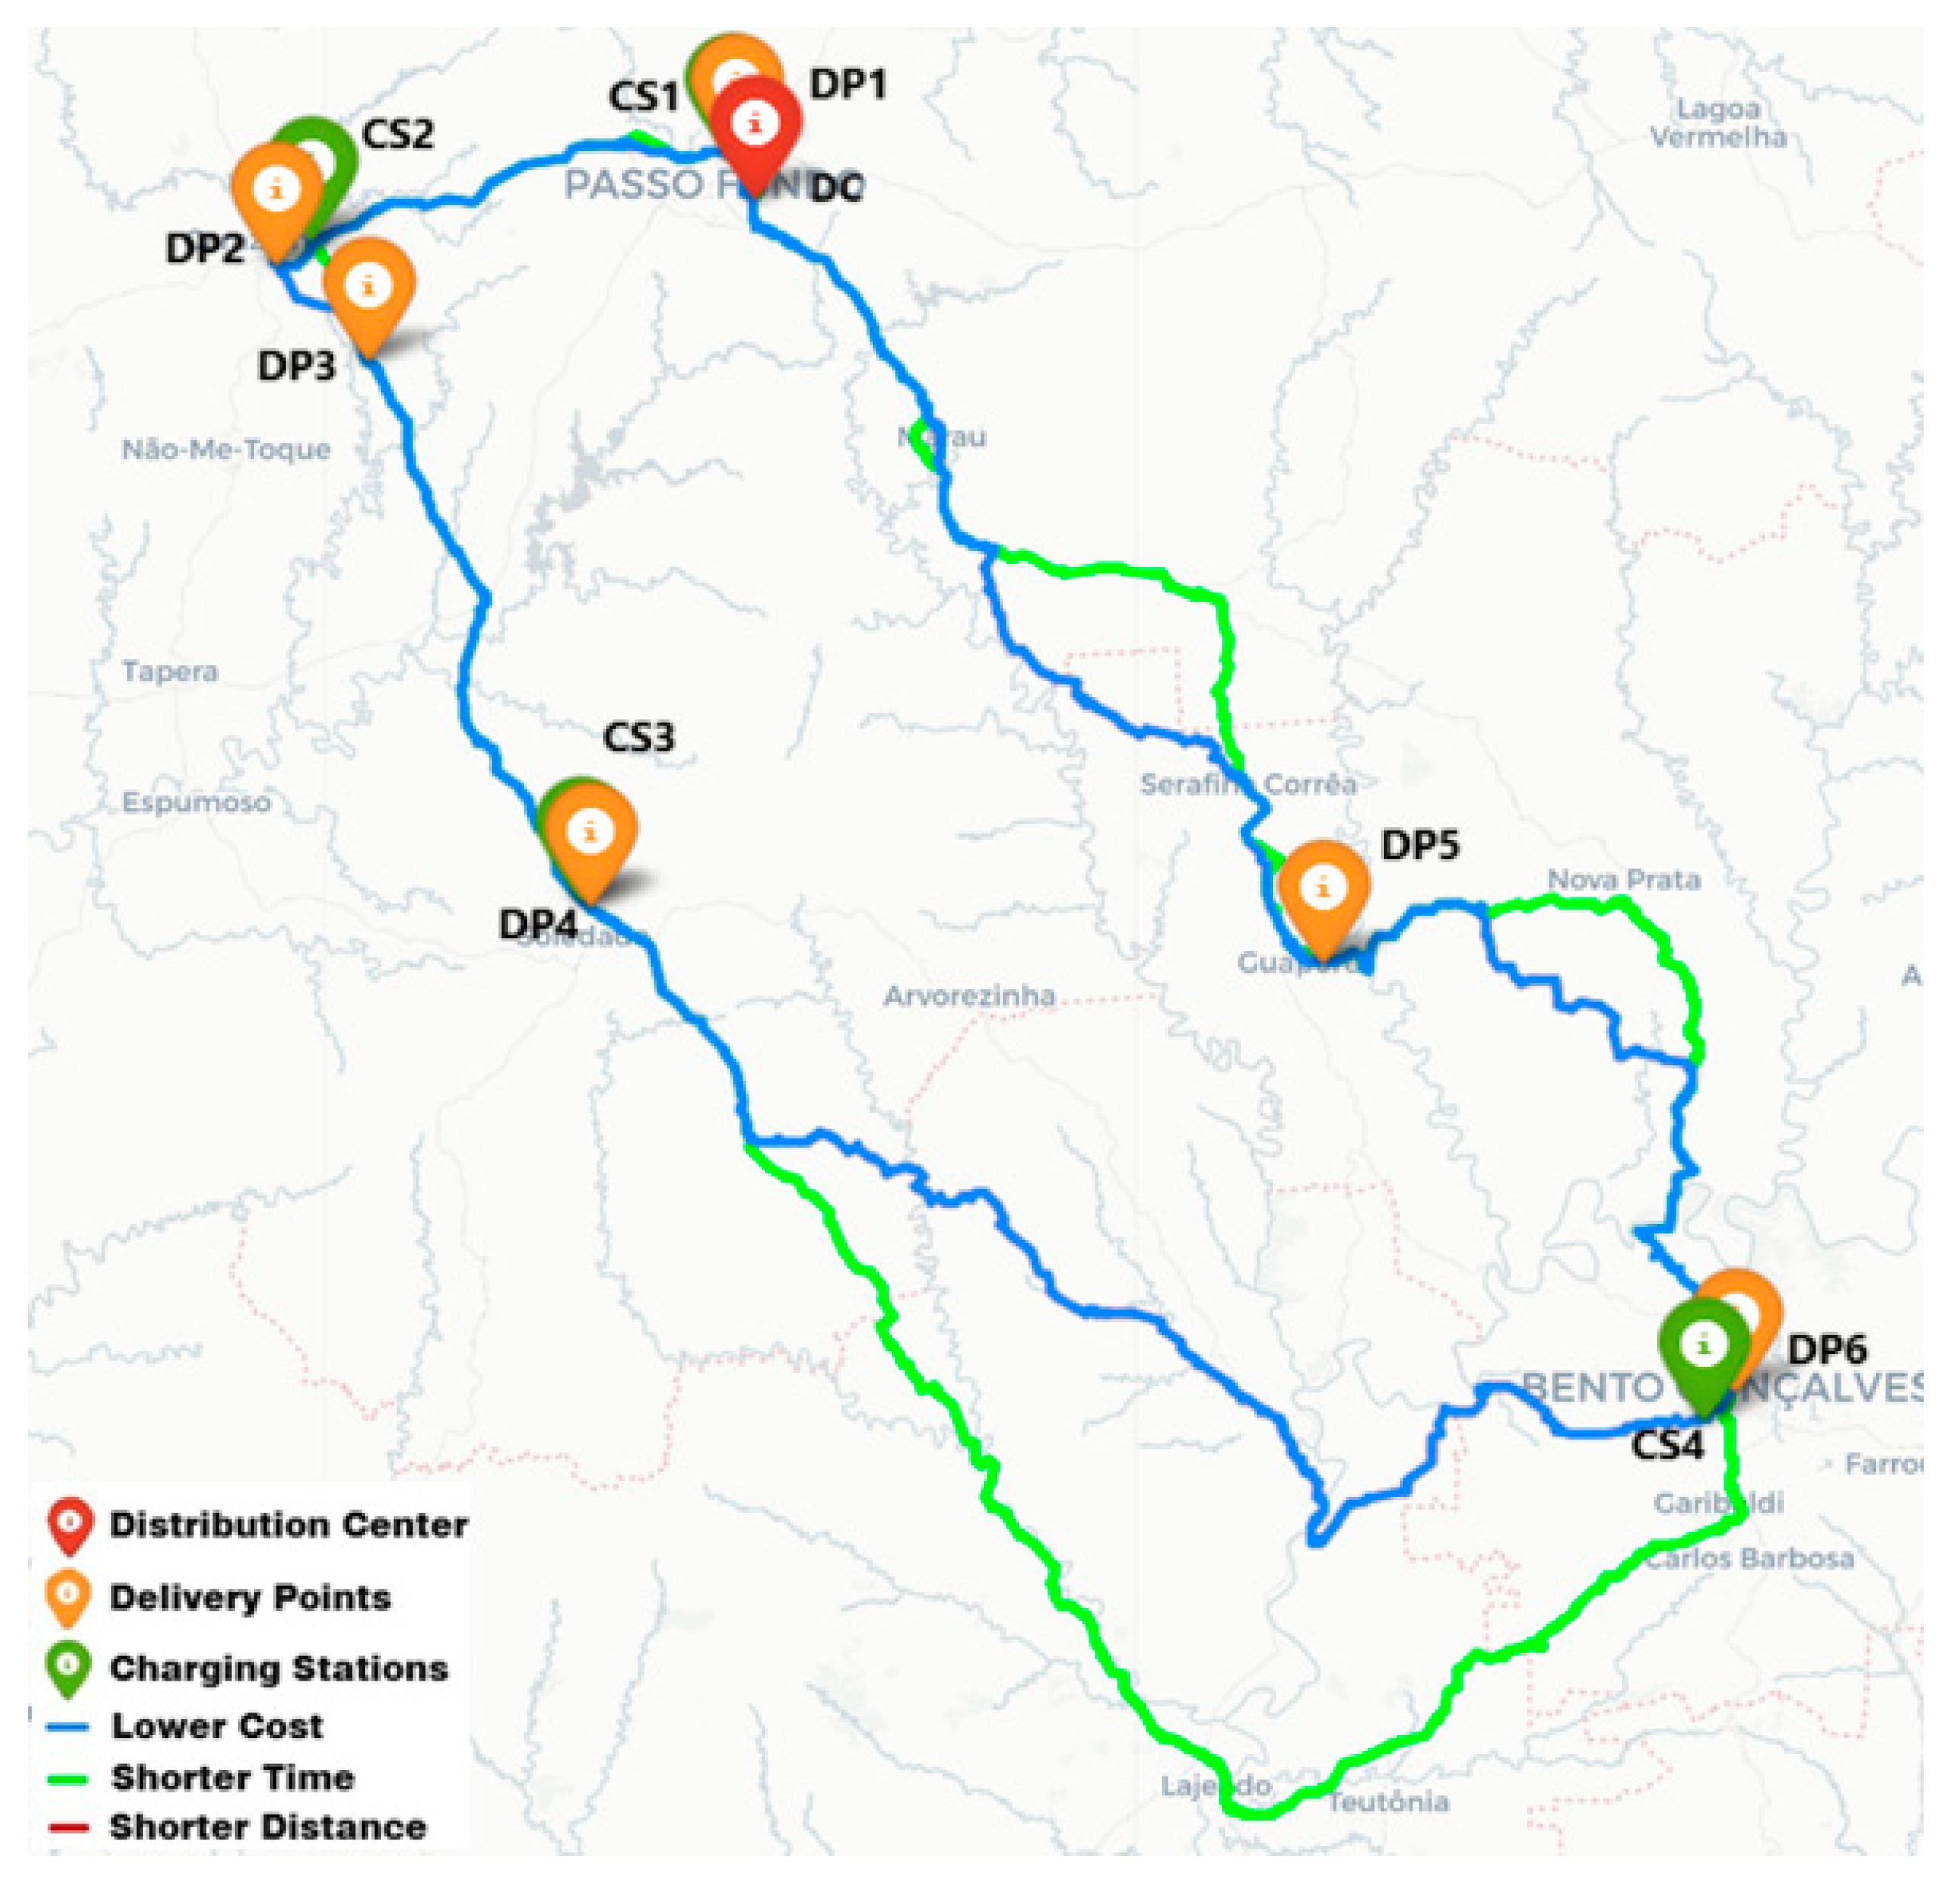
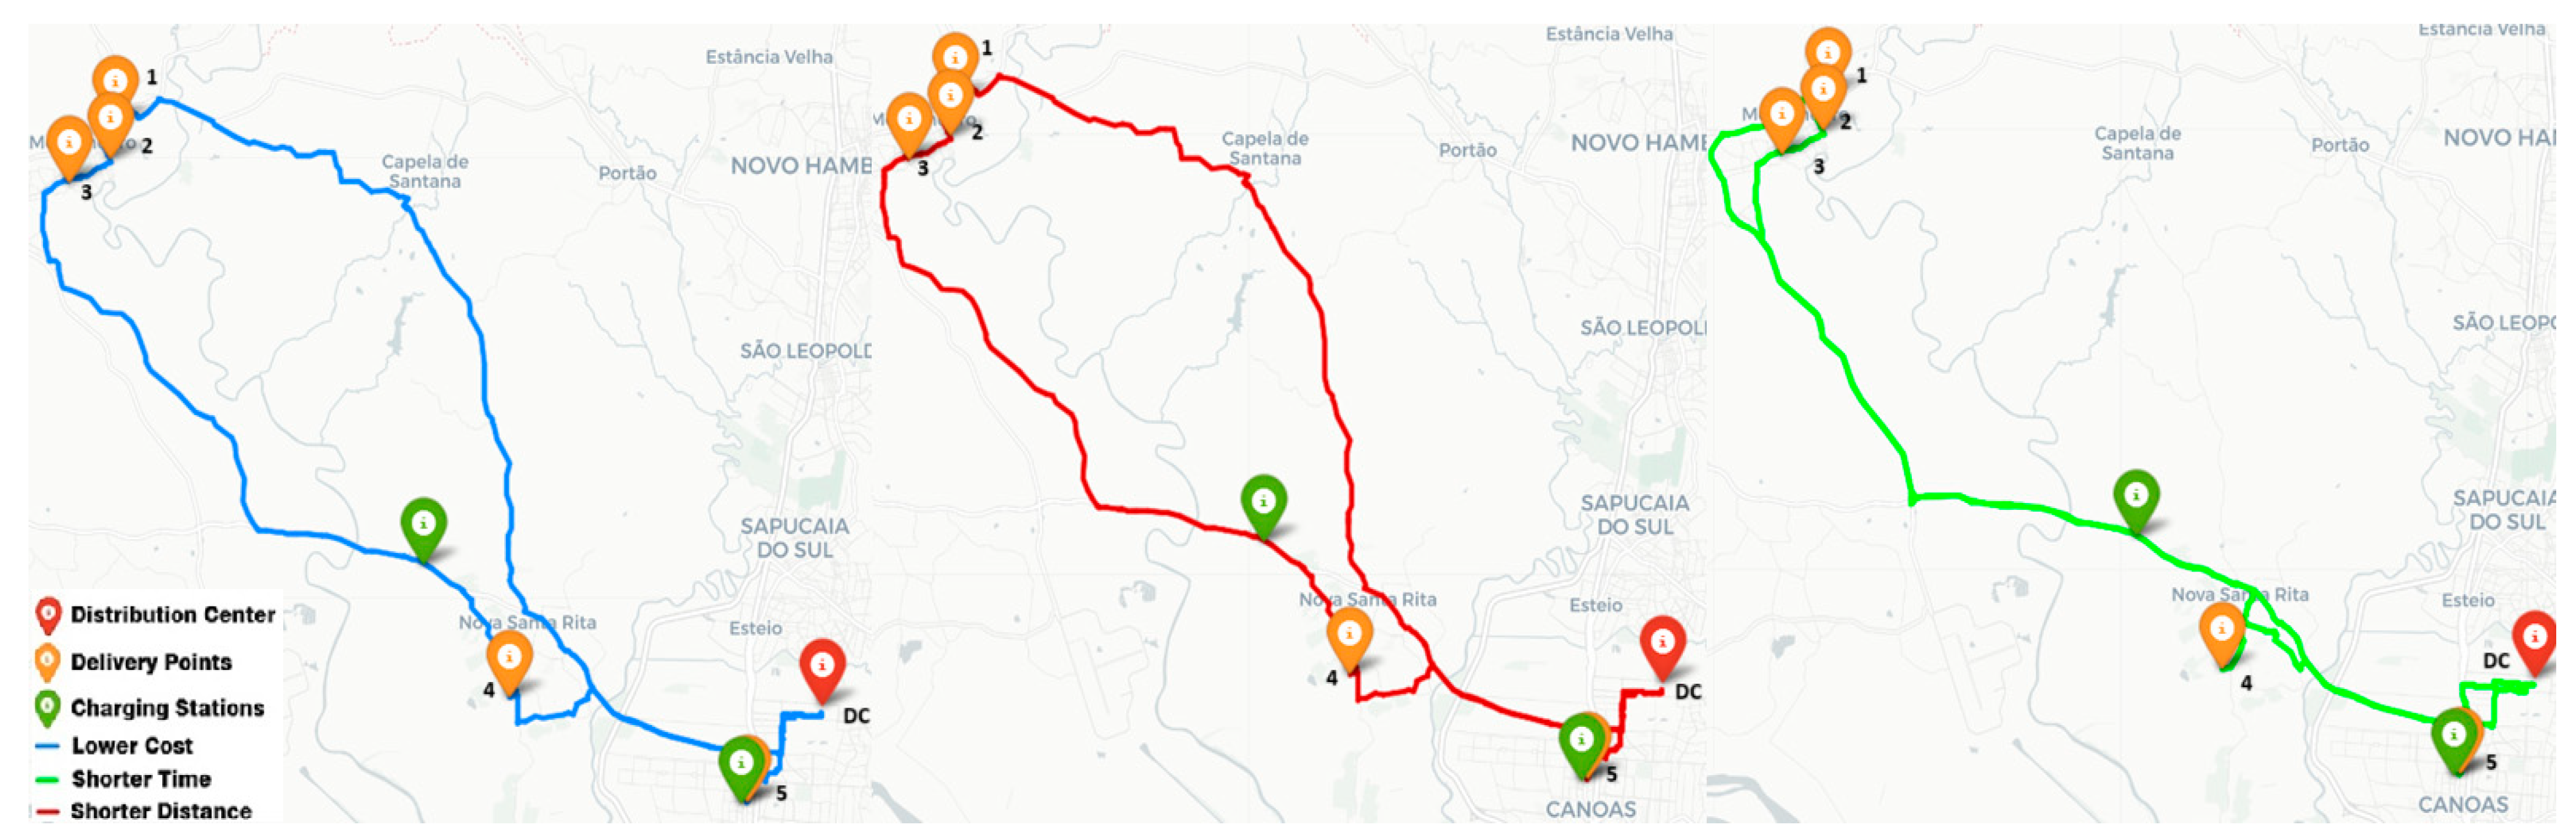
Finally, the map in
Figure 6 with the three best-planned routes was generated. The route is selected at the discretion of the driver’s decision-making or the company’s logistics department. However, it was impossible to visualize the route with the shortest distance because its results were identical to the route with the lowest costs, which overlapped. Additionally, the distance of the fastest route is longer than the route with the shortest distance, meaning that the fastest route may not always correspond to the shortest-distance route.
In the map in
Figure 6, the traced colors represent the following routes: blue for the lowest cost, green for the shortest time, and red for the shortest distance. Regarding the points, the distribution center is marked in red, the charging stations in green, and the delivery points in orange.
Figure 7 illustrates the details of each optimized route, the order in which goods are delivered to customers, and when to stop to recharge.
In the second simulation, involving two recharge stops, the following geographical coordinates were introduced to identify the distribution center, delivery points, and charging stations:
Distribution center: −29.173658577927945, −51.24436715655656;
Delivery point 1: −29.161003613392147, −51.194717296259945;
Delivery point 2: −29.122566164135502, −51.1219781990175;
Delivery point 3: −29.03039399644967, −51.18437368046384;
Delivery point 4: −28.93617533545165, −51.544115978701996;
Delivery point 5: −28.94704278597342, −51.553172046744905;
Charging station 1: −29.17178234344912, −51.21126229407253;
Charging station 2: −29.04429173650056, −51.18099996755684;
Charging station 3: −28.92516362349411, −51.539938317760516;
Charging station 4: −29.20911102287891, −51.28532449407541.
The following input data were considered:
Recharge tariffs per kilometer (R$/km): distribution center, R$0.40; charging station 1, R$2.00; charging station 2, R$2.00; charging station 3, R$2.00; and charging station 4, R$2.00;
Autonomy: 100 km;
Average vehicle speed on roads: speed of 35 km/h in streets, 50 km/h in avenues, and 60 km/h on highways;
Customer service time: 10 min per delivery point;
Nonlinear battery charge rate (0–20%, 20–80%, 80–100%): 0–20%—2 min for each 1% of the battery; 20–80%—0.5 min for each 1% of the battery; and 80–100%—1.5 min for each 1% of the battery.
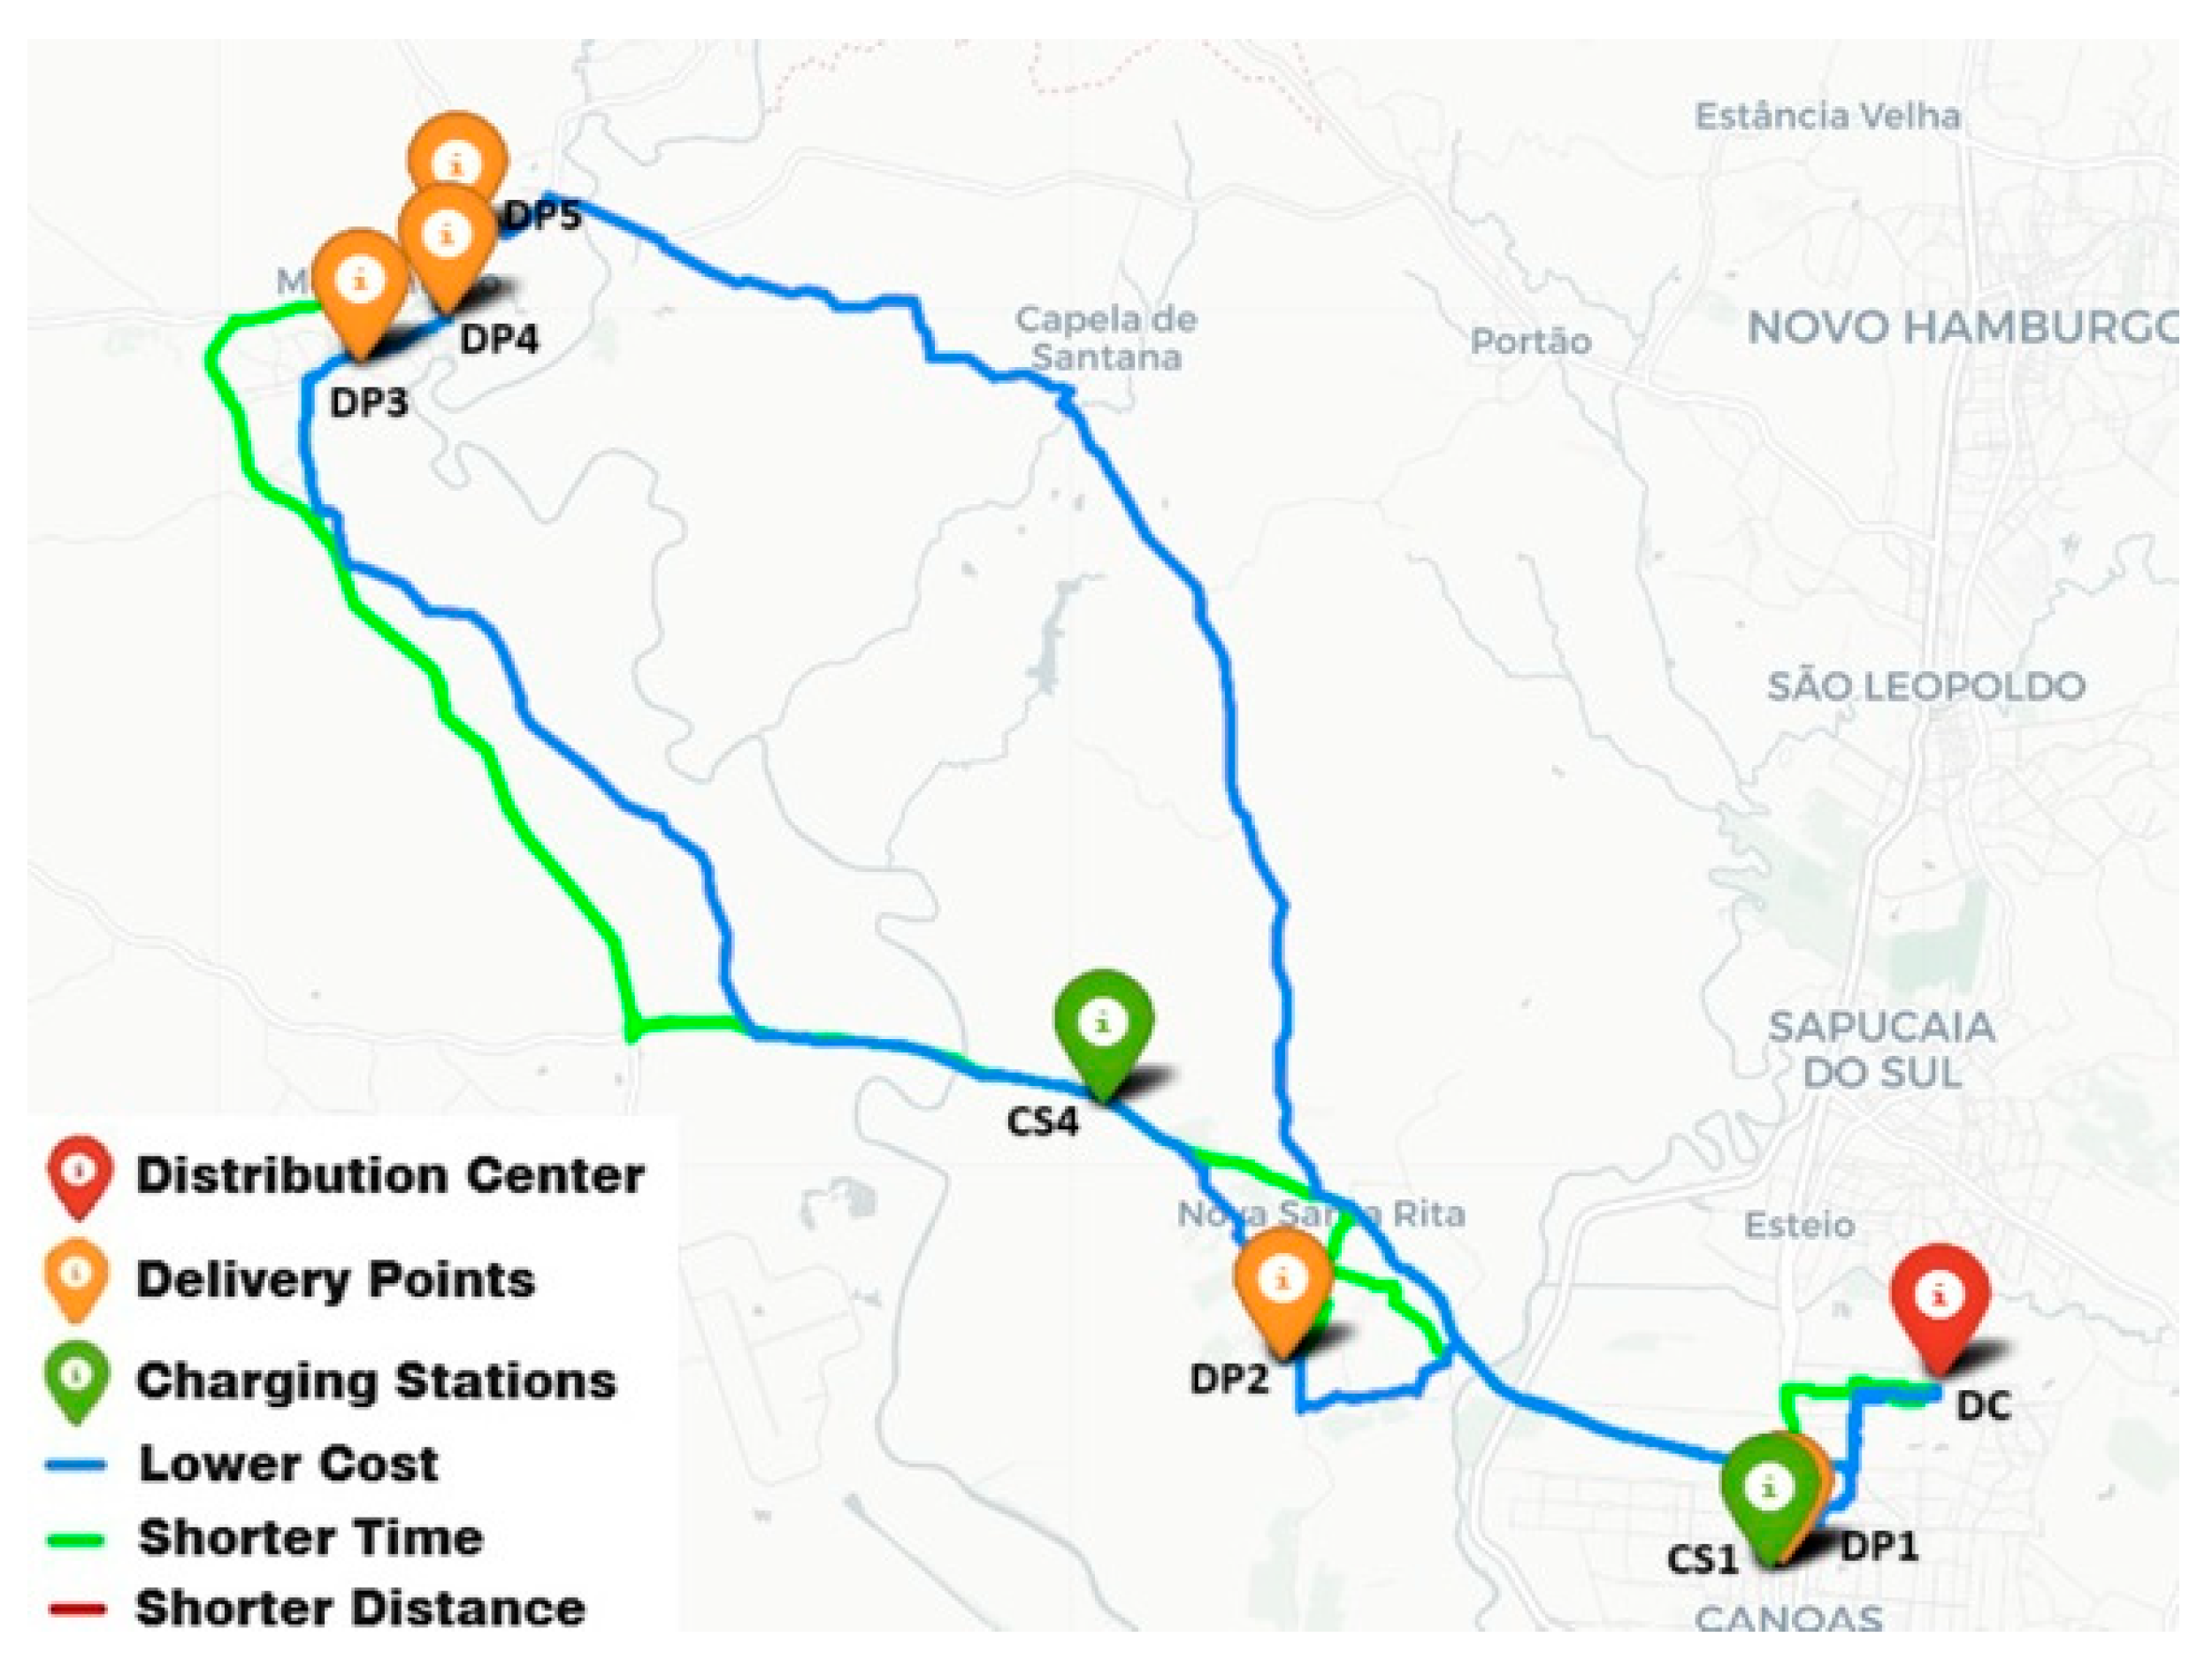
Table 3 highlights the best results obtained.
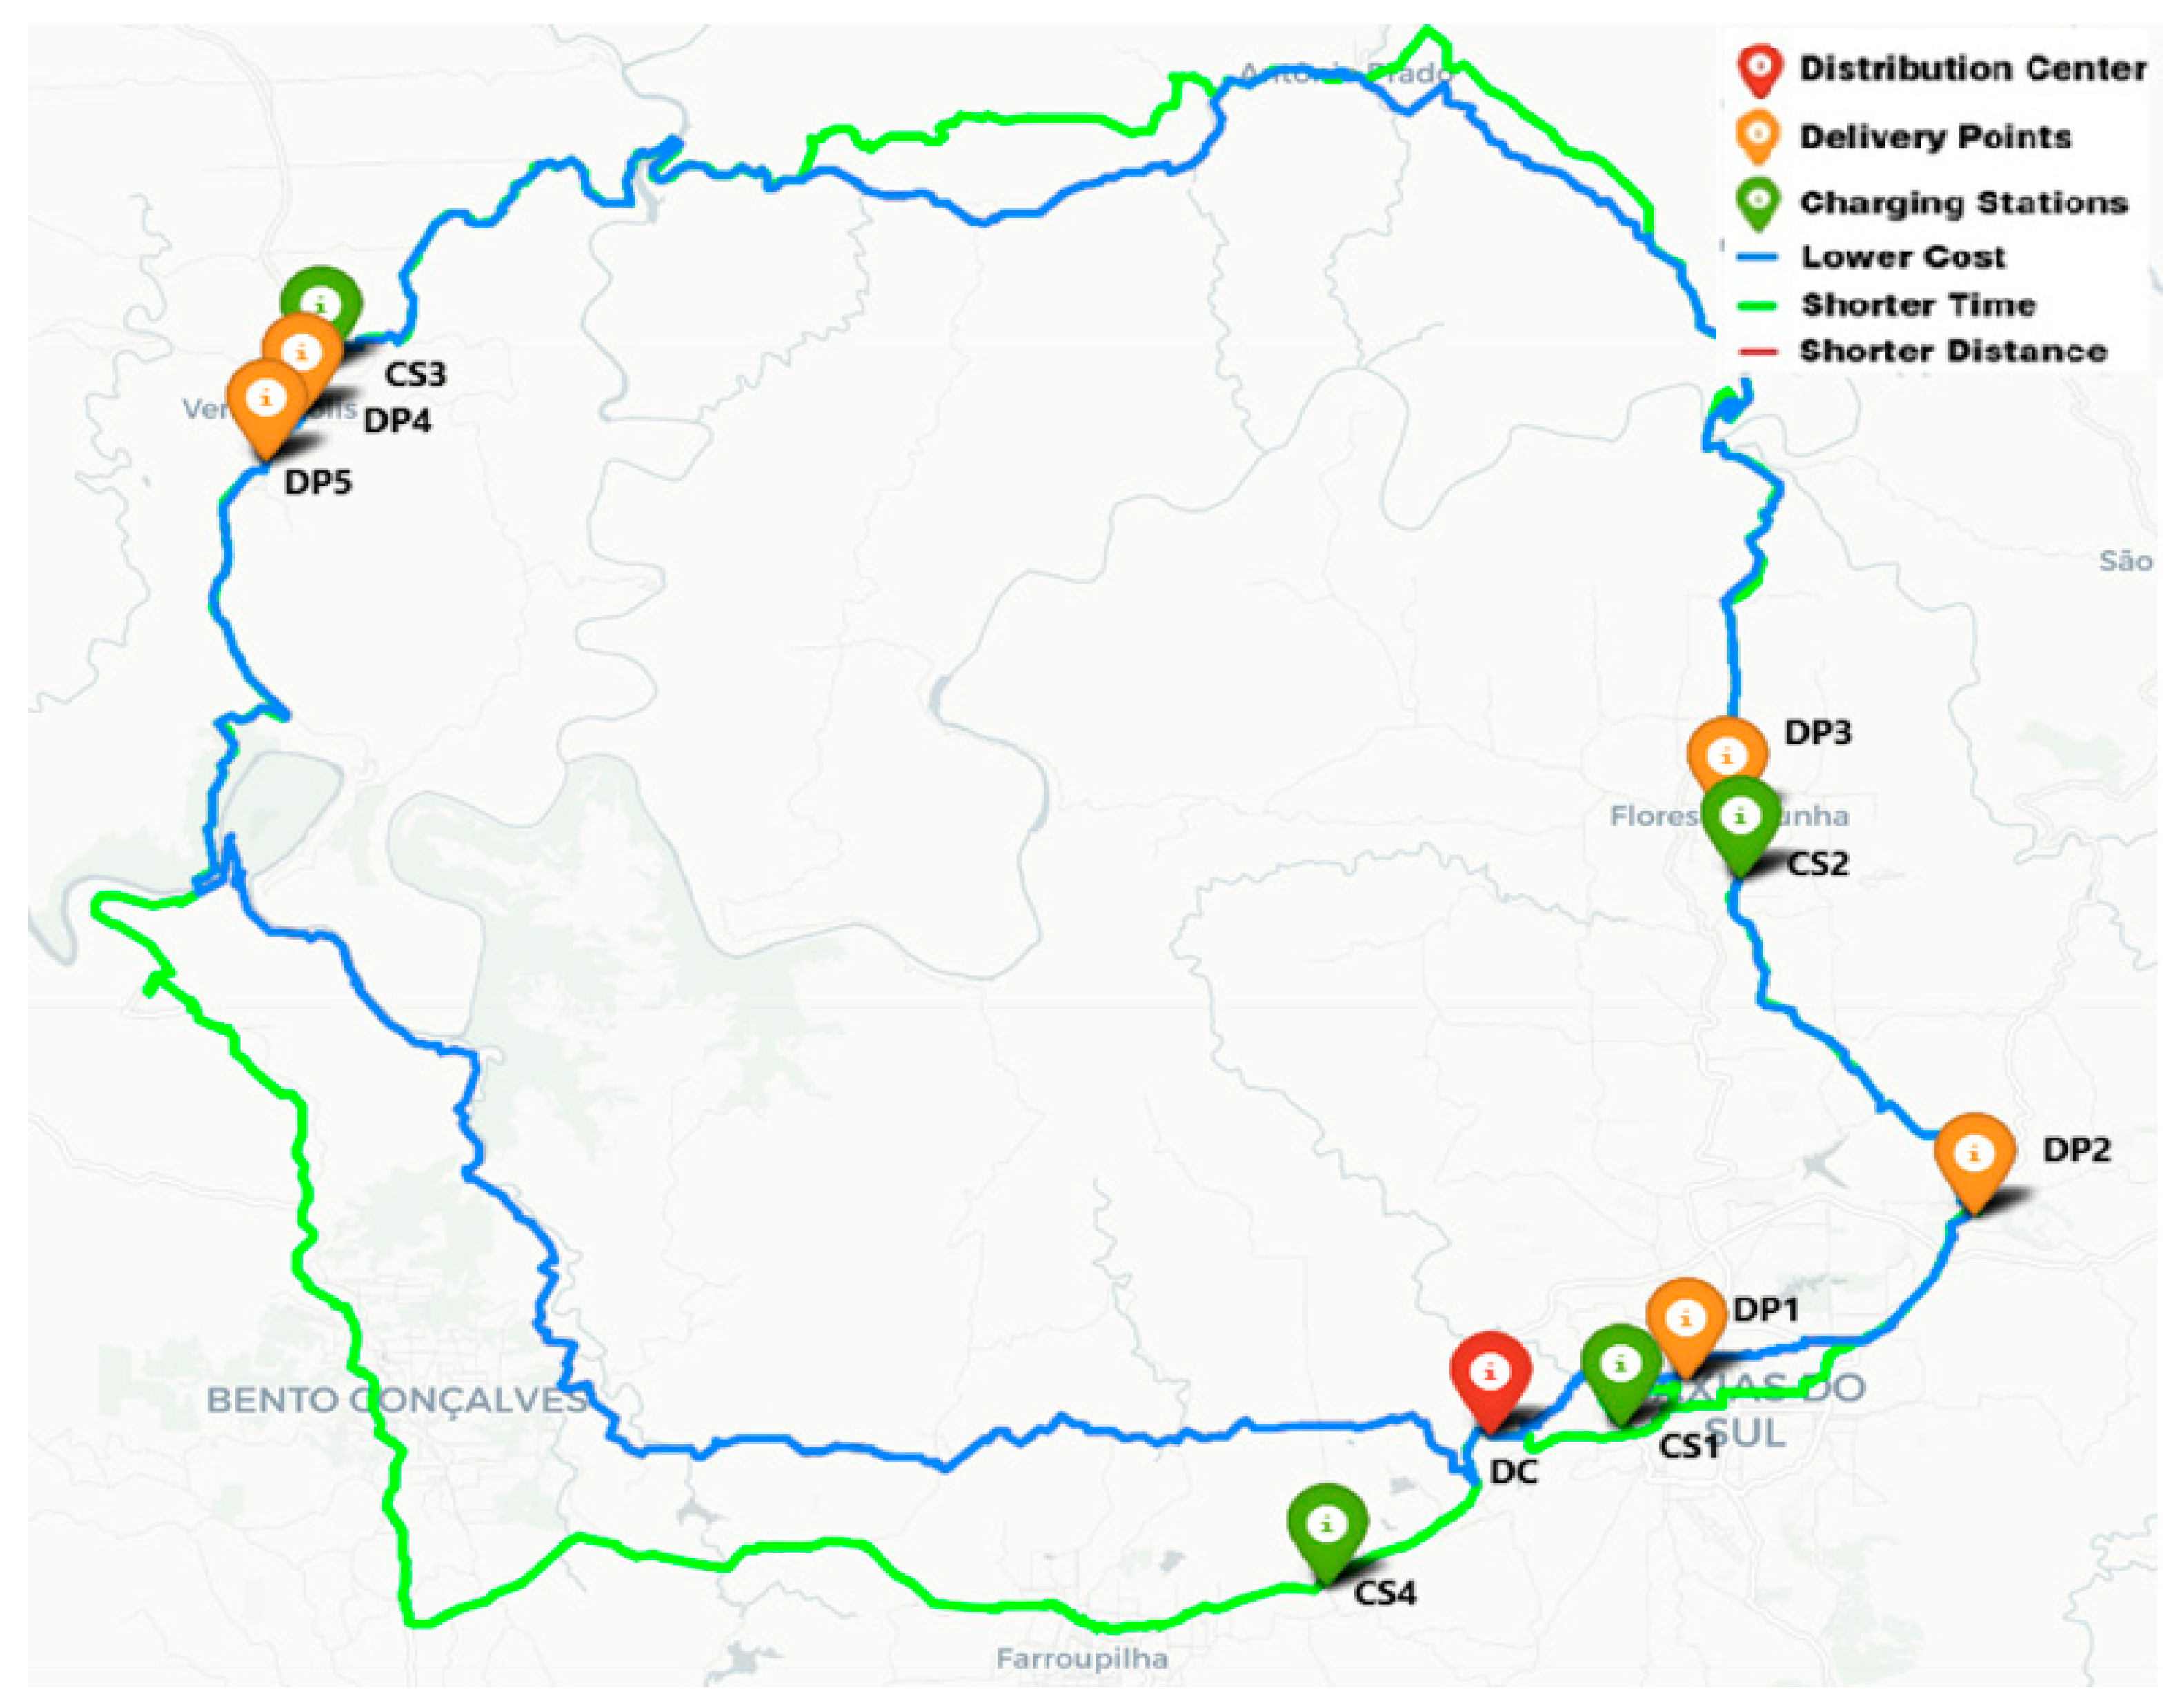
In
Figure 8, the three best planned routes are illustrated.
4.2. Route Optimization with One Recharging Stop
Route optimization with one charging stop occurred when the route exceeded the vehicle’s autonomy. Consequently, the system identified the need to add a charging stop.
To identify the distribution center, delivery points, and charging stations, the following geographical coordinates were introduced:
Distribution center: −29.8776, −51.1493;
Delivery point 1: −29.911030, −51.181805;
Delivery point 2: −29.874853, −51.285102;
Delivery point 3: −29.696292, −51.475213;
Delivery point 4: −29.688171, −51.457491;
Delivery point 5: −29.675677, −51.455143;
Charging station 1: −29.911385, −51.184589;
Charging station 2: −30.0320, −51.2318;
Charging station 3: −29.6262, −51.3106;
Charging station 4: −29.828565, −51.321769.
The input data are presented below:
Recharge tariffs per kilometer (R$/km): distribution center, R$0.60; charging station 1, R$2.50; charging station 2, R$2.50; charging station 3, R$2.50; and charging station 4, R$2.50;
Autonomy: 100 km;
Average vehicle speed on roads: speed of 35 km/h in streets, 50 km/h in avenues, and 60 km/h on highways;
Customer service time: 10 min per delivery point;
Nonlinear battery charge rate (0–20%, 20–80%, 80–100%): 0–20%—2 min for each 1% of the battery; 20–80%—0.5 min for each 1% of the battery; and 80–100%—1.5 min for each 1% of the battery.
Table 4 presents the results for delivery routing. The scenario yielded two alternatives for charging station stops, resulting in three routes for each alternative, comprising routes with the lowest cost, shortest time, and shortest distance.
Table 5 highlights the best results obtained for the shortest time, lowest cost, and shortest distance. The summary of the best options allows the company to choose the one that best meets its objectives.
For this case study, the recharge fee value was considered the same for all charging stations, with the aim of evaluating the route behavior.
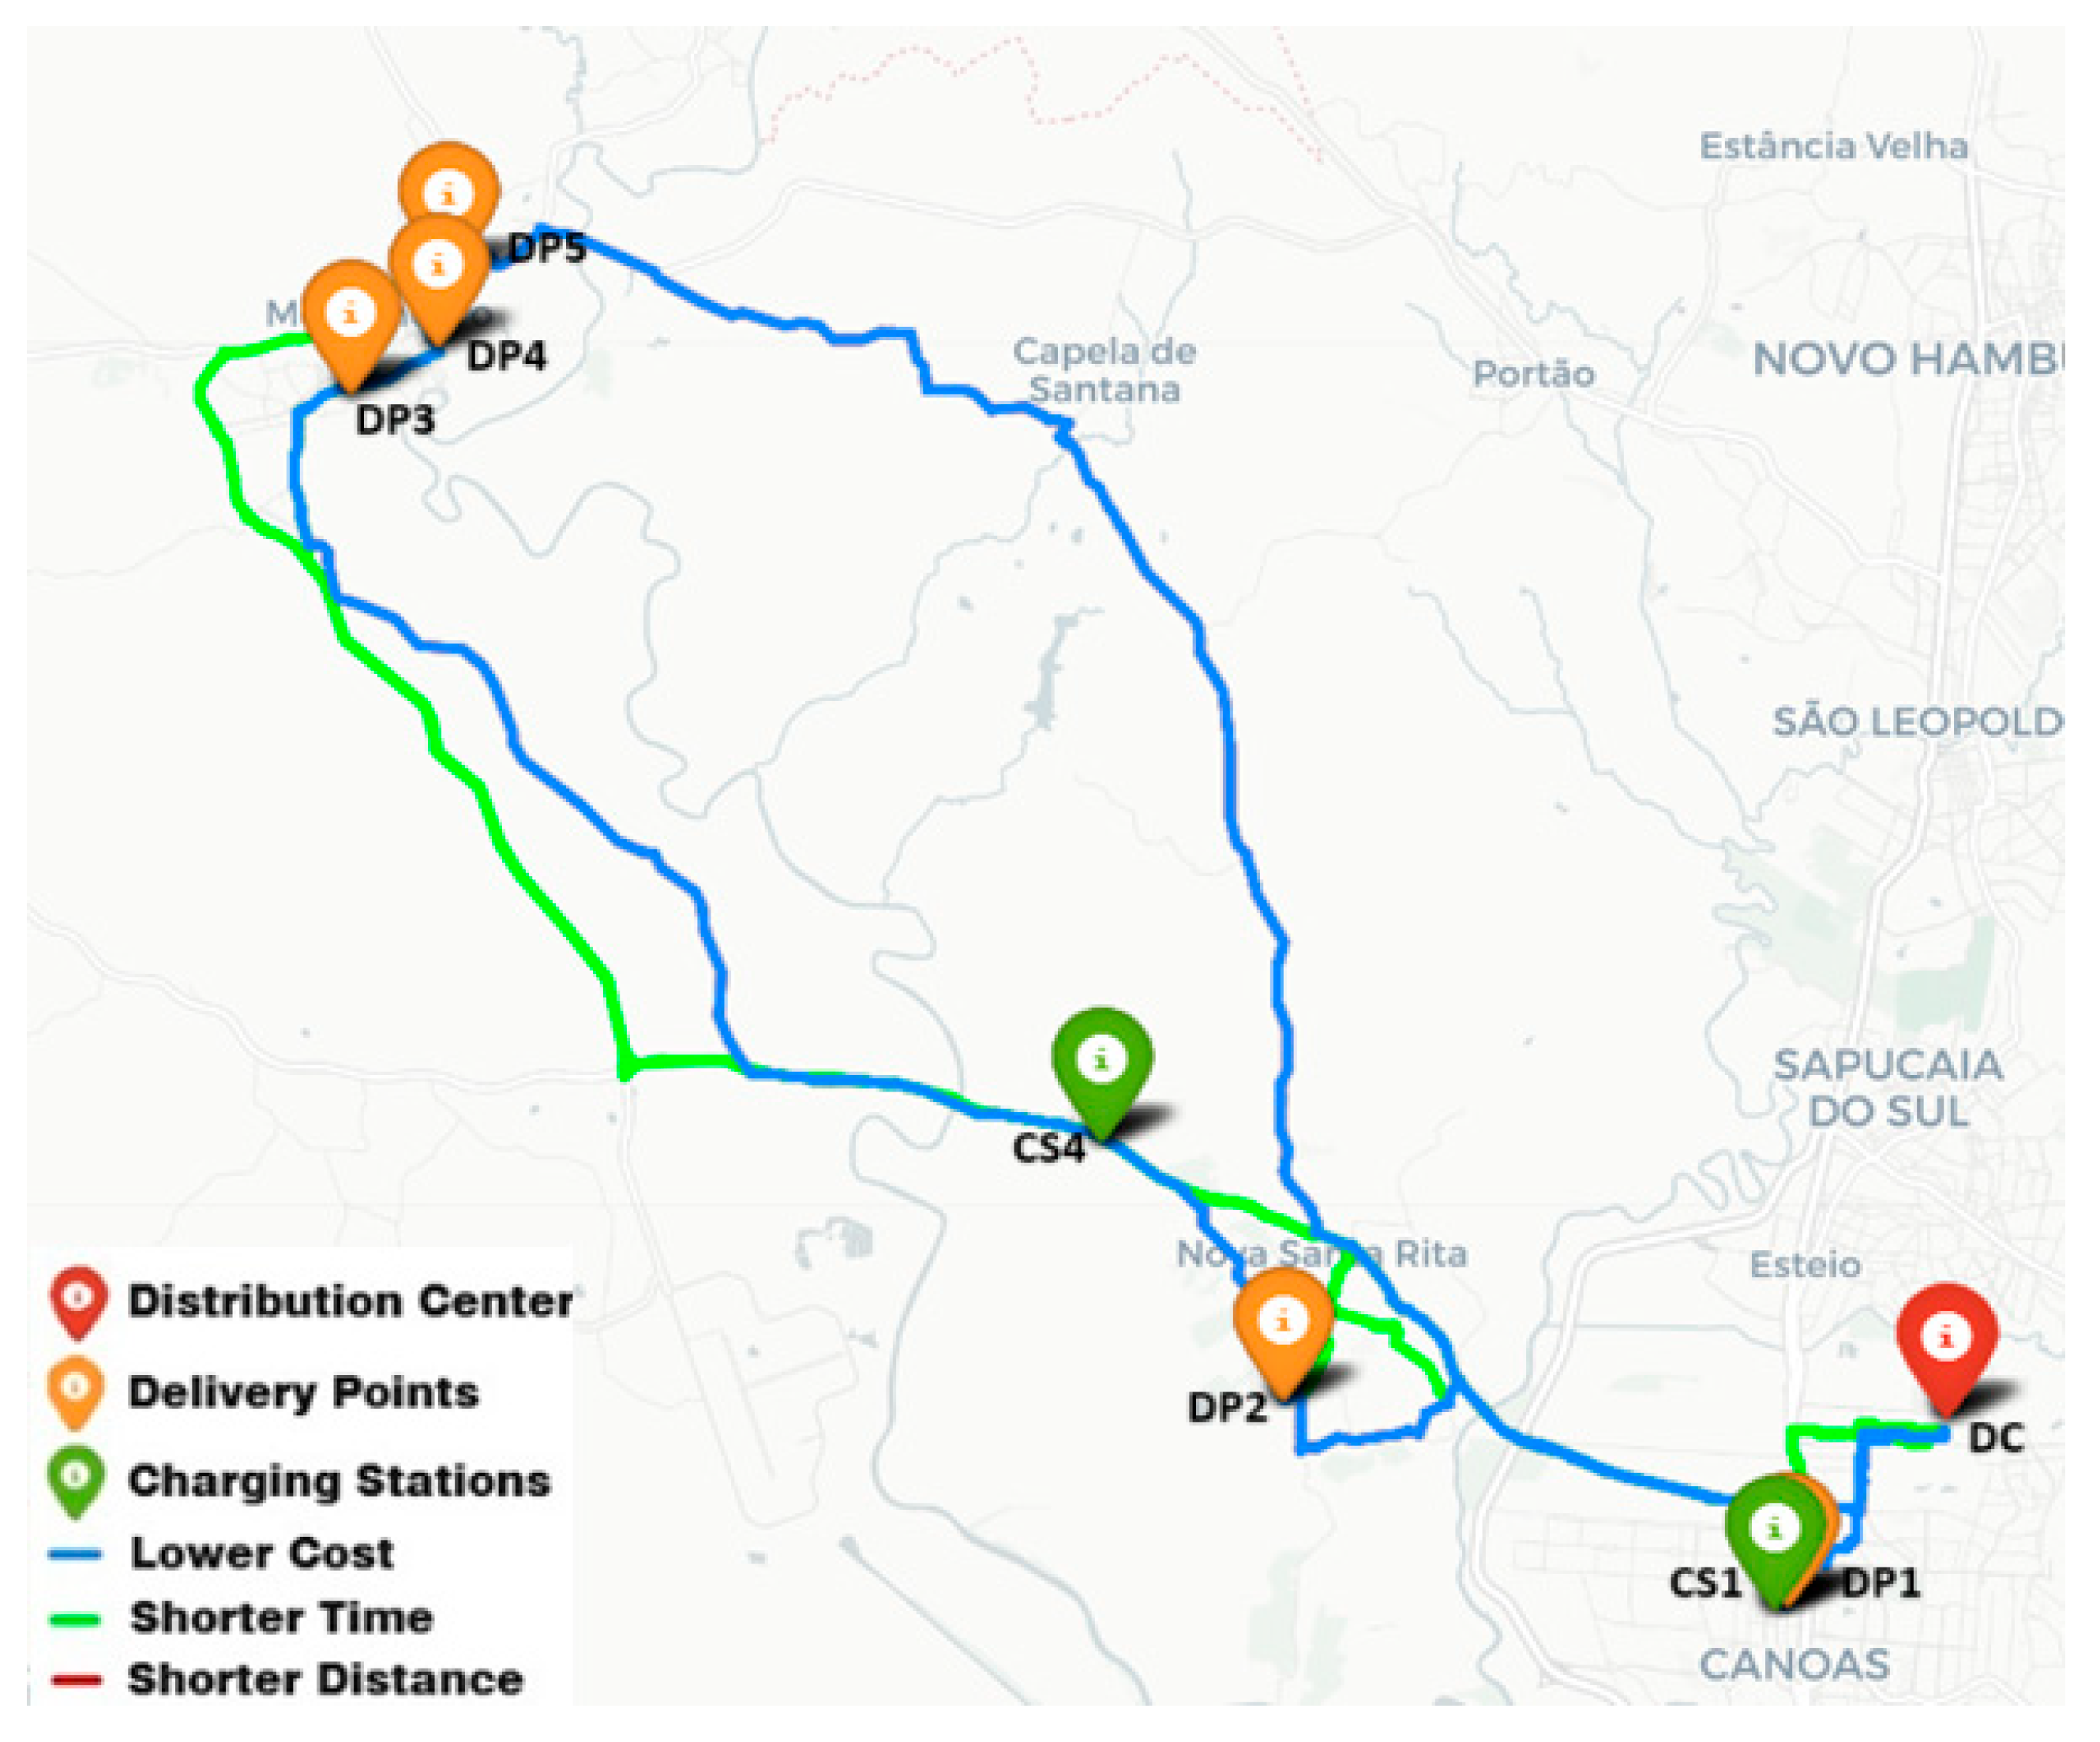
Figure 9 illustrates the most optimized routes. The best charging option was at station 4, justified by its favorable location. Additionally, the colors of the points and routes identified on the map used the same previous criteria.
Figure 10 illustrates the details of each optimized route, the order in which goods are delivered to customers, and when to stop to recharge.
4.3. Optimization of Routes Without Recharging
Route optimization without recharging stops occurred when the planned route met the vehicle autonomy. In other words, the system identified no need for an additional recharging stop. These simulations also considered the fixed input data.
To find the distribution center, delivery points, and charging stations, the following geographical coordinates were used:
Distribution center: −29.8776, −51.1493;
Delivery point 1: −29.911030, −51.181805;
Delivery point 2: −29.874853, −51.285102;
Delivery point 3: −29.696292, −51.475213;
Delivery point 4: −29.688171, −51.457491;
Delivery point 5: −29.675677, −51.455143;
Charging station 1: −29.911385, −51.184589;
Charging station 2: −30.0320, −51.2318;
Charging station 3: −29.6262, −51.3106;
Charging station 4: −29.828565, −51.321769.
The input data are presented below:
Recharge tariffs per kilometer: distribution center—R$0.60; charging station 1—R$2.00; charging station 2—R$1.70; charging station 3—R$1.85; and charging station 4—R$2.50;
Autonomy: 150 km;
Average vehicle speed on roads: speed of 35 km/h in streets, 50 km/h in avenues, and 60 km/h on highways;
Customer service time: 10 min per delivery point;
Nonlinear battery charge rate (0–20%, 20–80%, 80–100%): 0–20%—2 min for each 1% of the battery; 20–80%—0.5 min for each 1% of the battery; and 80–100%—1.5 min for each 1% of the battery.
In
Table 6, the results obtained from the optimized routes for the minimum time, minimum cost, and minimum distance are highlighted. The compilation of alternatives provides the company with the decision-making process that best suits its needs.
The simulation did not consider recharging stops because the routes met the vehicle’s autonomy, as shown in
Figure 11. It is observed that the shortest distance route and the lowest cost route overlapped. Also, the colors of the points and paths identified on the map used the same previous criteria.
It is worth noting that the resulting routes in this case study are similar to those shown in
Figure 8, as the same geographic coordinates were used, with only the vehicle’s autonomy and recharge rates being changed.
4.4. Summary of the Main Data
In each case study presented above, a variation in the geographic coordinates of the locations of charging stations, customers, and distribution centers was performed. Additionally, the number of customers served in the simulations was adjusted. To evaluate the behavior of the algorithm, different values for vehicle autonomy and recharge tariffs were used, as described in
Table 7. The input data variations led to differences in the number of recharging stops as well as in the routes for distance, time, and cost, as detailed earlier.
For Case Study 1, different recharge tariffs were considered, requiring the program to evaluate charging stations with the lowest costs while also factoring in their proximity to the route. As a result, the program optimized the selection process, ensuring that charging occurred at two strategically located stations.
For Case Study 2, the number of deliveries was reduced while maintaining the same recharge tariffs. Consequently, the program prioritized the charging stations closest to the route, optimizing efficiency.
For Case Study 3, the same recharge tariffs were maintained, but a 100 km range was applied, and the geographic coordinates were adjusted. However, since the customers were located closer together, the program required only one stop for recharging. Finally, Case Study 4 achieved sufficient autonomy, allowing the program to generate a delivery route without requiring any stops for recharging.
5. Discussion
Logistics service providers need to meet the demands of goods deliveries and, at the same time, comply with pollutant emissions regulations [
38]. Therefore, the application of EVs is an alternative for reducing pollutant emissions. However, the application of EVs in last-mile delivery needs to evaluate the vehicles’ autonomy, recharging time, and the position of the charging station.
Generally, a company that owns EVs has some charging points at the distribution center, which are used to recharge the vehicles during idle periods [
39]. However, some routes are too long for the vehicles to have enough range to complete the trips in transit without needing an additional recharge. Therefore, charging stations installed in public spaces provide a suitable option for EVs that need to recharge during the workday.
The routing for routes with combustion-powered vehicles does not consider the time needed to refuel during the journey since gas stations are easily accessible and quick to use. However, additional recharging for EVs can have a significant impact on the total travel time due to the long charging duration and, therefore, should be considered when planning the route of an EV.
Electric vehicle charging stops at fast-charging stations are intended to support light-duty electric truck and heavy-duty electric truck technology; that is, they enable truck models that can carry a larger amount of cargo to travel to regions further away from the facilities.
To meet the challenges of variants for routing EVs in distribution fleets, optimization methods include dynamic scenarios since vehicles have lower load capacities and limited range. In addition, they present challenges regarding the need for additional charging infrastructure and time-window restrictions for charging.
MaaS is a mobility service that aims to integrate transportation technologies, allowing data integration to generate valuable insights. It allows the vehicle charging cycle to be adapted to customer needs and energy system conditions, including different tariff charging options. Smart charging aims to mitigate peak demand caused by EVs, reduce simultaneity, and flatten the charging curve to integrate variations in electricity supply [
40]. This encourages customers to charge their EVs during off-peak hours by applying differentiated tariffs during the day since the greater the price differential between peak and off-peak hours is, the more effective the rate performance.
Recent studies, such as [
23], have explored dynamic wireless charging for EVs based on Dijkstra’s algorithm; however, this study only seeks the shortest path and does not consider total cost variables. Similarly, Ref. [
24] analyzed a dynamic wireless power transfer (DWPT) deployment model for last-mile freight transportation. Unlike [
23,
24], our model considers variable tariffs at charging stations, which affect the total cost of the route. Furthermore, our study is specifically designed to address challenges in countries such as Brazil, where the lack of charging infrastructure and high costs of adaptation are significant barriers to EV adoption.
Other studies, such as [
25], evaluated a system for connected electric vehicles (CEVs), focusing on ride sharing and dynamic network scheduling (V2G); however, this study considers dynamic wireless charging and does not consider the stopping time for recharging at charging stations, an issue addressed in the current study. Ref. [
22] proposed a least-cost routing strategy for EV charging, using Dijkstra’s algorithm to communicate with charging stations to exchange data such as electricity cost and energy demand; however, in this case, the results of routes with the shortest path were not considered. Ref. [
16] examined electromobility in the delivery market. This study selected an EV and made adaptations to the routes through a route simulation program to ensure that all orders could be fulfilled; however, this study did not consider charging during the journey or the possibilities of routes with the shortest time and the lowest cost.
Thus, the insights generated through the previous studies and the integration of technologies can be linked to the improved method developed in this article, as they are valuable input data taken into consideration during the simulation of the programmed route.
The simulations allowed the addition of recharging stops along the established routes to be evaluated, mainly when the path exceeded the vehicle capacity. For instance, the first simulation required two additional stops, and the second needed only one recharging stop.
The program may overlap some routes when identical results are obtained, and in some cases, the fastest route may not always result in the shortest distance due to road speeds. In short, the program uses static traffic conditions, considering the mileage of highways, streets, and avenues as input data, and making it possible to identify the average speeds in each section.
Goods delivery points may produce numerous scenarios with variations in traveled distance, influencing route time and total costs. In addition, the system considers different recharge tariffs at charging stations and seeks the lowest-cost recharge to complete the route while meeting the limit of battery autonomy in terms of the location of the charging station. Therefore, the proposal enables effective and economical management, providing competitive advantages in the market and maximizing the company’s profitability.
The system that integrates charging time windows and identifies the current percentage of the battery and how much it needs to recharge before reaching the next charging point offers important benefits for logistics management. This proposal prioritizes recharging that takes the shortest recharge time, respecting each stage of the battery recharge cycle, which results in greater operational efficiency and reduced downtime. In other words, the algorithm identifies the current battery percentage and how much it needs to recharge until it reaches the next charging point. Based on this, the recharge time at the charging station is checked. It is worth noting that the algorithm prioritizes recharging that takes the shortest charging time. In other words, it can be filled from 80% to 100% at charging station 1 to ensure that charging station 2 does not recharge from 0% to 20%, as it has a longer recharge time.
The premises of the study were defined based on the time limit of the daily work journey and the mileage covered in urban areas. Two stops at charging stations were planned to respect this limit and achieve sufficient autonomy to comply with the last-mile theory. Thus, the study can be solved using the brute force approach, which allows the optimal solution to the problem to be obtained. Moreover, the study can serve as a basis for verifying the accuracy of other methodologies, as it results in an optimal solution.
According to [
41], the traveling salesman problem is classified as an NP-hard problem, providing factorial complexity in relation to the number of vertices, making it computationally challenging for large-scale instances. Thus, there is a limitation for graphs with many vertices generally applied to intermediate mile routes due to the long distances and the larger number of customers to be served. In this situation, the application of heuristics is recommended due to the limitations of the brute-force algorithm. Although the complexity can be reduced, there is no guarantee of obtaining the best possible solutions, resulting in approximate solutions and limiting optimality guarantees.
For this study, it was decided to use the electric truck as a reference. However, this methodology can be applied to other vehicle models used in the transportation of goods, such as vans and cars. Consequently, it is only necessary to adjust the input data to reflect the characteristics of the vehicles used.
The study developed is relevant to driving the transition to electric mobility in road freight transport by presenting a methodology to minimize distance, costs, and time and by mainly evaluating the impact of the cost and time of recharging on future routes. The ultimate intention is to ensure that future electric truck use is viable, with support tools for deciding on efficient, fast, and more economical logistics.
6. Conclusions
This paper proposes a methodology to support last-mile logistics operations considering battery-powered electric trucks. The methodology combined Dijkstra’s algorithm with a mathematical formulation considering the variables related to the logistical problem of electric vehicles (recharging time and autonomy) in a Python environment.
The results of the studied case validated the model, as it considered several scenarios of operation under different recharging conditions. The developed simulations presented three possible route cases: two recharging stops, one recharging stop, and no recharging. Moreover, the study compared routes with the shortest distance, shortest time, and the lowest costs for delivering goods in urban areas. Both parameters give drivers or decision-making companies the flexibility to choose the option that best meets their delivery goals.
The algorithm successfully generated routes in the evaluated simulations, as they required fewer points for analysis. Furthermore, the integration of mobility as a customer service sought to provide users with the ability to plan mobility in an easy and practical way. Thus, the proposed model validated the implementation of electric trucks in distribution logistics, contributing to sustainability in the transportation sector.
MaaS is a mobility service that aims to redesign the future of urban mobility by integrating transportation technologies and allowing data integration to generate valuable insights. Future research should expand the current model and integrate it into a real-time energy tariff management system and include features for scheduling recharges.
Additionally, as electric vehicle technology evolves and user behaviors change, functional requirements will undergo dynamic adjustments. Therefore, it is essential to evaluate the accuracy of the results and make adaptations to ensure that optimization remains forward looking and adaptable to user needs.


 ,
, 

