Article

The Impact of Environmental Information Disclosure on Corporate Sustainability: The Mediating Role of Profitability

1
School of Law and Public Administration, Nanjing University of Information Science and Technology, Nanjing 211544, China
2
School of Management Science and Engineering, Nanjing University of Information Science and Technology, Nanjing 211544, China
3
College of Electronic and Optical Engineering & College of Flexible Electronics (Future Technology), Nanjing University of Posts and Telecommunications, Nanjing 211544, China
*
Author to whom correspondence should be addressed.
Sustainability 2025, 17(10), 4603; https://doi.org/10.3390/su17104603
Submission received: 25 April 2025 / Revised: 13 May 2025 / Accepted: 14 May 2025 / Published: 17 May 2025

Abstract

:
The Chinese government places significant emphasis on high-quality, sustainable economic development, with the value of environmental information becoming increasingly prominent. Corporate stakeholders are paying greater attention to environmental disclosures. This study analyzes data from Chinese A-share listed companies in Shanghai and Shenzhen from 2008 to 2023, exploring the relationships and influence mechanisms among environmental information disclosure, profitability, and corporate sustainable development through multiple regression models. The results indicate that environmental information disclosure promotes corporate sustainable development (with an effect coefficient of 1.441, p < 0.01), while also enhancing profitability (with an effect coefficient of 0.009, p < 0.01). Moreover, profitability serves as a mediator in the relationship between environmental information disclosure and corporate sustainable development (with an effect coefficient of 1.089, p < 0.01). These findings remain robust after a series of tests. Heterogeneity studies further reveal that the positive impact of environmental disclosure on corporate sustainability performance is more pronounced among non-state-owned firms and firms with high leverage ratios. Overall, the research findings help encourage enterprises to prioritize environmental impact, practice sustainable operations, and enhance profitability, long-term competitiveness, and market adaptability.

1. Introduction

Environmental information disclosure (EID) in China began in 2008 with the implementation of the Measures for EID (for Trial Implementation). This initiative required government departments to disclose environmental quality data and information on pollution source supervision, while also expanding the scope of disclosure to include enterprises. This laid the groundwork for the development of more comprehensive EID systems in the country. In the same year, the China Securities Regulatory Commission mandated listed companies to submit environmental impact assessment reports. Since then, China’s EID system has gradually evolved into a more structured and standardized framework. In 2024, the Chinese government further emphasized the need to deepen the reform of the EID system, viewing it as a critical step in modernizing the ecological and environmental governance system and enhancing governance capacity [1].
EID in accordance with the law has become a crucial means for enterprises to convey their environmental awareness and responsibility to both the government and the public. By expanding the channels through which the public can access information on environmental pollution, it also encourages greater public participation in environmental governance efforts [2,3]. The legal disclosure of environmental information serves as an effective tool to reduce information asymmetry between enterprises and the public. It plays a crucial role in controlling emissions from polluting enterprises and driving green transformation, which is vital for improving environmental quality and promoting sustainable economic development. EID, also known as environmental information openness, is the process by which a government or an enterprise discloses information related to its environmental impact and performance to the outside world which is monitored by social organizations and the public [4]. The disclosure covers a wide range of information on the enterprise’s environmental policies, pollutant emissions, resource utilization, and environmental protection measures in the course of production and operation. Internationally, enterprises in many developed countries have long taken EID as a key part of their corporate social responsibility. For example, some enterprises in the European Union have demonstrated their efforts in energy saving and emission reduction and ecological protection through detailed environmental reports. This has enhanced their market competitiveness and social acceptance, and realized a benign interaction between economic growth and environmental protection [5]. Compared with Europe and the United States, where EID is more mature, there is still a big gap in the completeness and depth of EID by enterprises in some developing countries [6]. In these countries, the progress of EID is slow in some enterprises due to factors such as capital, technology, and awareness. However, along with the increasing global attention to sustainable development and the increasingly strict environmental regulations in various countries, enterprises are facing more pressure on EID and sustainable development challenges [7]. Based on this, an in-depth study of the relationship and influence mechanism between corporate EID, profitability, and corporate sustainable development is of great practical significance for promoting corporate sustainable development and realizing the coordination of social economy and environment.
Although the importance of EID has been widely recognized in both theory and practice [8], significant deficiencies remain in existing research within the context of emerging markets. The current literature primarily focuses on developed countries, examining the direct impact of EID on firm performance, while there is little research on the mechanisms through which EID influences corporate sustainability via profitability as a mediating factor. Particularly in emerging markets like China, there is a lack of longitudinal studies based on large-scale samples to systematically test the dynamic relationships among EID, profitability, and sustainability. Moreover, existing studies rarely address the impact of firm heterogeneity (e.g., industry, size, and ownership structure) on the effectiveness of EID, which limits the applicability of theoretical models. Given that China, as the world’s largest emerging market, has seen rapid development in its EID system, providing a unique context for research, exploring these relationships in depth is of great significance for promoting global sustainable development.
This study is organized as follows: after the literature review, the hypotheses are formulated based on stakeholder theory and signaling theory. Subsequently, sample selection, data sources, variable definitions, and model construction are elaborated. Then, the model regression results are analyzed, and the endogeneity, robustness, and heterogeneity tests are performed on the models applied in the study. Finally, the research conclusions are summarized and policy recommendations are made.

2. Literature Review and Research Hypothesis

2.1. Environmental Information Disclosure and Corporate Profitability

The disclosure of environmental information in accordance with the law is an important corporate environmental management system and a fundamental element of the ecological civilization system [9]. As of January 2025, the United Nations has established 17 Sustainable Development Goals (SDGs), including 6 goals related to the environment [10]. Along with the international emphasis on sustainable development, the EID of enterprises, as the main participants in the realization of the goal, has become an important basis for measuring their compliance with international sustainable development standards. Against this backdrop, the European Union has enacted the Corporate Sustainability Reporting Directive, which has been gradually implemented since 2023. It requires over 50,000 companies to disclose detailed environmental, social, and governance information, including climate-related risks and emission reduction targets, to enhance corporate transparency and promote the achievement of the Sustainable Development Goals [11]. Similarly, the climate disclosure rules passed by the U.S. Securities and Exchange Commission in 2024 require publicly listed companies to disclose greenhouse gas emissions, climate risks, and their impacts on business, aiming to enhance investors’ understanding of corporate environmental performance [12]. These international regulations not only strengthen the standardized requirements for EID but also promote the implementation of green investment and sustainable development strategies by facilitating information symmetry between companies and stakeholders, providing institutional support for global environmental governance.
At present, research on EID has attracted extensive attention from scholars. On the one hand, research has centered on corporate subjects, mainly focusing on the relationship between EID and corporate governance [13,14], financing constraints [15,16], corporate innovation [17,18], etc. On the other hand, there are also related studies focusing on the aspects of EID affecting environmental governance [19,20], policy making [21,22], and international policies [23]. In addition, there exist scholars who delve into the nature and specific measures of EID [24] and drivers of EID [25,26,27]. In the above literature, most of the studies are based on the information asymmetry theory. For example, EID can alleviate the financial constraints of enterprises and reduce information asymmetry by improving the credibility and transparency of enterprises, thus reducing the cost of financing [28]. Some studies have also been conducted on stakeholder theory, which is a theory of organizational management and business ethics that considers multiple groups affected by business entities such as employees, suppliers, local communities, creditors, etc. [29]. Using a study of Portuguese banks as an example, Branco examines the public visibility proxy variable for social responsibility disclosure [30]. Drawing on stakeholder theory, the study finds that banks with higher public visibility are more likely to enhance their image and reputation by disclosing their social responsibility activities to the public. Based on the above analysis, existing studies provide important perspectives and evidence regarding the relationship between environmental information disclosure and corporate profitability. As an important window reflecting the fulfillment of corporate environmental responsibility, EID aims to enhance corporate transparency, promote positive interaction between enterprises and stakeholders, and facilitate the implementation of corporate sustainable development strategies. Research shows that positive EID can attract more environmentally conscious investors, expand corporate financing channels, and reduce financing costs [31,32]. Similarly, in consumer markets, there is a growing demand for the products and services of environmentally friendly enterprises. Effective EID can translate into increased market share, thereby enhancing corporate profitability. Furthermore, EID may promote internal management optimization within firms, such as identifying and improving high-pollution, low-efficiency production processes, thereby reducing operational costs and further enhancing profitability [33]. However, some studies also indicate that EID may entail additional compliance costs and management burdens, particularly for small- and medium-sized enterprises with limited resources, which could negatively impact profitability in the short term [34].
In view of the above analysis, the following hypotheses were formulated for this study:
Hypothesis 1.
Firms can enhance corporate profitability through EID.

2.2. Environmental Information Disclosure and Corporate Sustainability

Currently, the literature on sustainable development primarily focuses on qualitative research, with limited studies examining the impact of EID and the mechanisms through which it influences corporate sustainability. However, existing literature offers valuable insights and serves as a foundation for exploring the impact of EID on corporate sustainable development. Li et al. found through empirical research shows that environmental regulation and financial development in China’s Yangtze River Delta region influence green total factor productivity [35]. Specifically, there is an inverted U-shaped relationship between environmental regulation and green total factor productivity, indicating that excessively stringent environmental regulations can hinder the growth of green total factor productivity. Meanwhile, Plumlee et al. found that high-quality EID is positively related to firm value, which means that EID can enhance the market value of the firm [7]. At the cash flow level, high-quality EID can improve a company’s external image by showcasing its proactive approach to environmental responsibility. This, in turn, helps attract more investors, leading to increased income and cash flow. Additionally, by transparently sharing environmental data, the company can highlight its strengths in environmental protection, gaining a competitive edge within its industry. This competitive advantage can translate into a larger market share and, consequently, higher cash flows. Regarding the cost of equity, high-quality EID reduces information asymmetry between investors and the company, enabling more accurate assessments of environmental performance and future risks. This transparency lowers investor uncertainty, thereby reducing the company’s cost of equity. Enhanced profitability, driven by increased cash flows and market share, provides the company with sufficient funds to expand production, update technology, and develop new products. This strengthens market competitiveness and lays a solid foundation for sustainable development, ensuring the company’s long-term operation and growth. In addition, EID serves as a vital component of corporate social responsibility, offering a mechanism for companies to convey their environmental performance to stakeholders. According to signaling theory, timely and transparent EID can mitigate information asymmetry, thereby enhancing corporate reputation and trust among investors and consumers. This improved perception can lead to increased profitability, which, in turn, provides the financial resources necessary for sustainable development initiatives. By adopting robust EID practices, companies not only fulfill their environmental obligations but also position themselves competitively in the market, fostering long-term growth and resilience. In view of the above analysis, the following hypotheses were formulated for this study:
Hypothesis 2.
EID helps to enhance the sustainability of enterprises.
Hypothesis 3.
EID can promote corporate sustainability by enhancing profitability.
Figure 1 illustrates the mechanisms through which the EID (E&P) impacts the sustainable growth rate (SGR) in this study.

3. Study Design

3.1. Sample Selection and Data Sources

In light of the regulation of EID in China, this study selects data from A-share listed companies in Shanghai and Shenzhen for the period 2008–2023, with a total of 52,033 observations. The data are sourced from the China Stock Market & Accounting Research Database (CSMAR), which is a research-oriented resource developed from authoritative databases like CRSP, COMPUSTAT, TAQ, and THOMSON, tailored to fit China’s specific national conditions. The CSMAR includes a wide range of fields, such as the stock market, company research, fund market, bond market, derivatives market, economic research, and industry research, and it supports single-label queries, cross-table queries, and data integration queries. The team analyzes and processes the data with Stata 18, applying the following filters to the sample data:
(1)
The sample of listed companies labeled as ST, S*ST, PT and ST* by the SEC is excluded;
(2)
Excluding the financial sector;
(3)
Excluding extreme values of attributes and applying Winsorization to continuous variables;
(4)
Excluding missing values for the dependent variable sustainable growth rate (SGR) and the explanatory variable EID.
The final sample observations obtained were 42,009.

3.2. Variable Definition and Description

3.2.1. Dependent Variable

The dependent variable is the enterprise’s sustainable development. Based on data from CSMAR, the study uses the SGR as a continuous quantitative indicator to assess the level of sustainable development, presented in the database as a pre-calculated final result. A higher SGR value indicates greater potential for sales and profit growth without the need for additional capital, reflecting a stronger capacity for sustainable development. The formula is as follows: (Net Profit/Total Owner’s Equity at Year-End) * [1 − Pre-Tax Dividends per Share/(Net Profit for the Current Period/Paid-in Capital at Year-End)]/(1 − Numerator).

3.2.2. Independent Variable

The independent variable is EID, and the study uses the dummy variable E&P to measure whether environmental information is disclosed in the firm’s social responsibility report with a value of 1 for disclosure and 0 otherwise.

3.2.3. Mediating Variable

The mediating variable is profitability, measured by Return on Assets (ROA), which represents the profitability of the enterprise during the reporting period. ROA is calculated as net income divided by total assets.

3.2.4. Other Control Variables

Referring to the existing literature, the study mainly selects the following control variables: (1) Fixed Asset Ratio, which is the ratio of net fixed assets to total assets of an enterprise, is used to measure whether the enterprise has idle funds. Enterprises with a higher proportion of net fixed assets are more inclined to invest funds in the updating of environmental monitoring equipment and the collection and organization of environmental data, thus improving the quality of EID. (2) Total Asset Growth Rate refers to the enterprise’s total asset growth this year and the ratio of total assets at the beginning of the year. Higher total asset growth indicates that the enterprise’s business scale expansion is faster. The growth rate of total assets reflects the development ability of the enterprise. Enterprises with a high growth rate of total assets have a fast expansion rate of operation scale and abundant resources, and are more capable of carrying out environmental management and information disclosure. (3) The proportion of independent directors, which refers to the share of independent directors in the total number of board members, reflects the independence of the board of directors and the governance structure. Enterprises with a higher proportion of independent directors have a better governance structure and are better able to supervise their environmental behavior and information disclosure. (4) Capital Preservation and Appreciation Rate is the ratio of an enterprise’s ending owner’s equity to its beginning owner’s equity. The capital preservation and appreciation ratio reflect the operational efficiency and safety of the enterprise. Enterprises with a high capital appreciation ratio have a fast growth in ownership interest and a good financial position, which makes it easier for them to obtain external financing. Such enterprises will pay more attention to EID to maintain a good reputation and market image to demonstrate their ability to sustainable development. (5) Total Asset Turnover Ratio, which is the closing balance between operating income and total assets of an enterprise in a specific period, reflects the efficiency of the utilization of the enterprise’s assets. High total asset turnover is associated with high profitability, which provides more resources and support for enterprises in EID. (6) Leverage ratio, which is the ratio of total liabilities to total assets, reflects the level of liabilities and financial risk of the enterprise, and enterprises with higher debt-to-asset ratios are exposed to higher financial risk and possess lower solvency and financial flexibility. These variables are consistent with those identified in the related studies. Table 1 demonstrates the definition of the main variables in the research analysis.

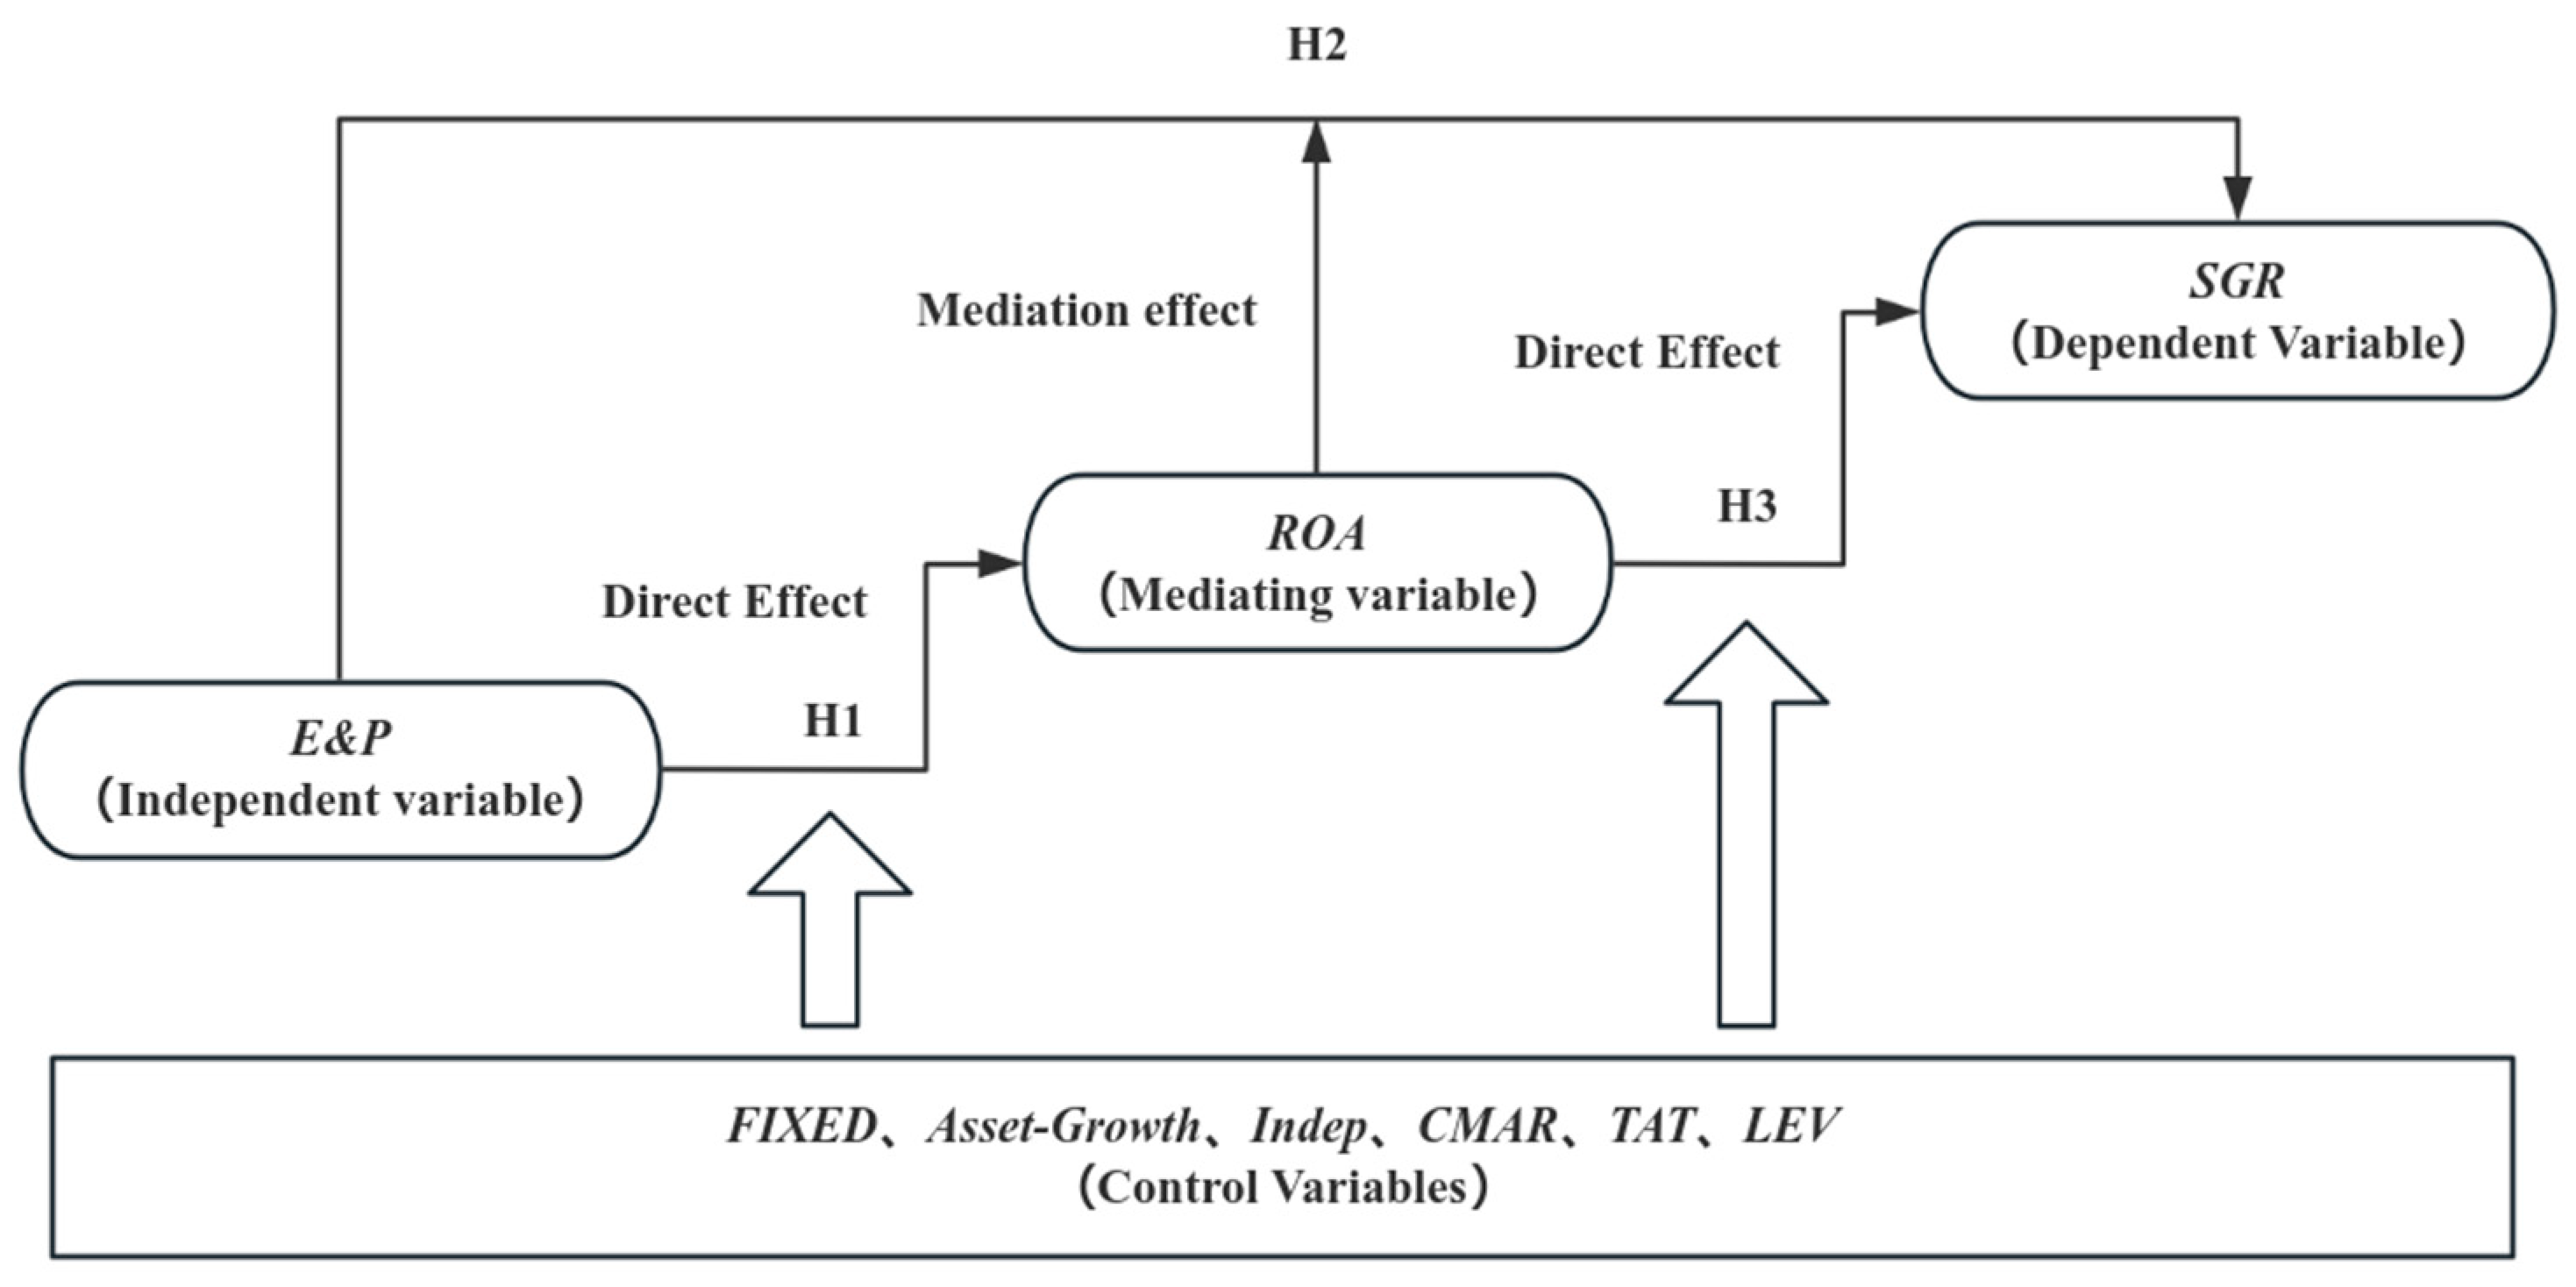
3.2.5. Model Construction

To test Hypothesis 1, Model 1 is constructed to verify whether EID has a positive and significant impact on the profitability of enterprises in this paper:
R O A i t = β 0 + β 1 × E   &   P it + β i × C o n t r o l s i t + γ t + φ i + ε i t
In order to test Hypotheses 2, Model 2 is constructed to verify whether EID has an impact on the sustainable development rate of the enterprise in this paper:
S G R i t = β 0 + β 1 × E   &   P it + β i × C o n t r o l s i t + γ t + φ i + ε i t
In order to test Hypotheses 3, Model 3 is constructed to verify whether EID indirectly affects the sustainable development rate of the enterprise by influencing its profitability in this paper:
S G R i t = β 0 + β 1 × R O A it + β 2 × E   &   P it + β i × C o n t r o l s i t + γ t + φ i + ε i t
SGR stands for corporate sustainability; E&P is a dummy variable representing whether firms disclose environmental information or not; ROA stands for corporate profitability. i denotes individual, t denotes year, γ t is the year fixed effect, φ i is the firm fixed effect, and ε i t is a random error term.
Firstly, based on Model 2, we analyze the impact of the independent variable E&P and the control variables on the dependent variable SGR under the fixed effects of year and firm. Based on the establishment of Hypothesis 2, and combining Models 1 and 3, we further conducted a mediating effect analysis to examine whether ROA plays a mediating role in the relationship between environmental information disclosure and corporate sustainable development. In addition, to ensure the scientific nature of the regression models and the mediating effect analysis, this study sequentially conducted endogeneity tests, mediating effect tests, robustness tests, and heterogeneity tests to ensure the accuracy and reliability of the analytical results.

4. Empirical Results and Analysis

4.1. Descriptive Statistics

Descriptive statistics of the variables of the study are shown in Table 2. Among them, the mean value of SGR percentage is 3.347 and the standard deviation is 11.397; the high mean and large volatility indicate that firms vary widely in their ability to grow sustainably without adding additional capital. The mean value of E&P is 0.284, which indicates that an average of 28.4% of firms have disclosed EID. The low mean value of E&P indicates that most of the firms do not disclose EID adequately, which could affect the image of corporate social responsibility and investor confidence. Meanwhile, its standard deviation is 0.451, which shows that there is a big difference between enterprises in EID. However, as can be seen from the EID trend graph in Figure 2, although the number of firms disclosing EID is still lower than those not disclosing, the growth trend in the number of disclosing firms is more significant, indicating that an increasing number of companies are inclined to disclose environmental information to enhance their corporate social responsibility image and investor confidence. Additionally, the low mean value of ROA suggests that the overall profitability of enterprises is average and varies greatly, which may be related to industry characteristics, market environment, and other factors. In addition to the explanatory variables, dependent variables, and mediating variables, the current study also includes several control variables to explain other factors that may exist, and the introduction of control variables is conducive to more accurately assessing the impact of EID on the sustainability ability of enterprises and to improving the internal validity of this study, which is crucial for the robustness of the subsequent analysis to ensure that the results of this study are accurate.

4.2. Correlation Test

The study used Pearson’s test to test the correlation of the variables, and the results are shown in Table 3. The correlation coefficient between E&P and SGR is 0.089, which is significant at the 1% level (denoted ***). This suggests a positive correlation between EID and sustainable development, meaning that better performance in EID is associated with stronger sustainable development capabilities. The correlation coefficient between E&P and ROA is 0.071 and significant at 1% level of significance (denoted ***), indicating a positive relationship between EID and profitability, which preliminarily tests hypothesis 1. The correlation coefficient between ROA and SGR is 0.821, significant at the 1% level (denoted ***), indicating a very strong positive relationship between profitability and sustainability. This suggests that the higher the profitability of a firm, the stronger its sustainable development potential, offering initial validation for Hypothesis 2. In other words, higher profitability contributes to the stability and sustainable development of the enterprise.

4.3. Multicollinearity Analysis

To prevent high correlations between the influencing variables and avoid model estimation bias, as well as to enhance the stability and explanatory power of the model, the study conducted a multicollinearity test on both the explanatory and control variables. The results are presented in Table 4. This table shows the variance inflation factor for each variable, along with its inverse (1/VIF), which is used to detect multicollinearity in multiple regression analysis. VIF stands for variance inflation factor. It can be proven that VIF = (1 − R2)−1, where R2 is the coefficient of determination between the independent variable X and the remaining independent variables. Therefore, when the independent variable X has a higher degree of correlation with the other independent variables (i.e., R2 → 1), the corresponding VIF becomes larger. When the VIF exceeds the critical threshold of 10, this strongly suggests detrimental multicollinearity that may require remediation.
Multicollinearity occurs when there is a high correlation between the influential variables, which can compromise the stability of the regression model and the accuracy of the estimated coefficients. Typically, a VIF value greater than 10 or 5 indicates a serious multicollinearity issue. However, the VIF values in Table 4 are all well below these thresholds, suggesting that there is minimal multicollinearity between the explanatory and control variables. This supports the reasonableness of the variable selection.

4.4. Fixed Effects Model Test

Model (2) and Model (1) use panel data analysis to control for unobservable time-invariant heterogeneity among individuals. To ensure the appropriateness of models, Hausman’s test and model fit test (F-test) were used, and the results are shown in Table 5.
The F-test value for Model 2 is 3.45, with a p-value of 0, indicating that, at common significance levels (e.g., 0.05 or 0.01), the individual fixed effects are significant, suggesting the presence of differences within groups. In addition, the Hausman’s test results for Model 2 (Chi2(7) = 2539.43, Prob > Chi2 = 0.0000) further support the superiority of the fixed effects model over the random effects model, due to the significant correlation between individual effects and the explanatory variables. Similarly, the F-test value for Model 1 is 3.81, with a p-value of 0, indicating that, at common significance levels (e.g., 0.05 or 0.01), the individual fixed effects are also significant in Model 1, suggesting the presence of differences within groups. Furthermore, Hausman’s test results for Model 1 (Chi2(7) = 623.68, Prob > Chi2 = 0.0000) further support the superiority of the fixed effects model over the random effects model in this case as well, due to the significant correlation between individual effects and the explanatory variables.
Overall, the consistency in the test results across both Models 1 and 2 reinforces the appropriateness of using the fixed effects model for analysis. The fixed effects model better accounts for individual heterogeneity and provides more consistent estimation results. To alleviate the bias caused by omitted variables and to more accurately reflect the explanatory power of the core variables, this paper selects the multi-dimensional panel fixed effect estimation with dual fixation of individual companies and time. This method can improve the accuracy of parameter estimation.

4.5. Benchmark Regression Results Analysis

Table 6 presents four linear regression models: Column (1) is a model that does not account for individual or year fixed effects and excludes control variables; Column (2) is a model that does not account for individual or year fixed effects but includes control variables; Column (3) is a model that accounts for individual and year fixed effects but excludes control variables; and Column (4) is a model that accounts for both individual and year fixed effects and includes control variables.
Firstly, the results show a significant positive effect of EID (E&P) on corporate sustainable growth rate (SGR) across all models. In Model 1, which lacks both control variables and fixed effects, the coefficient of E&P is 2.238 (p < 0.01), indicating that an increase in EID significantly enhances corporate sustainable growth. When control variables are added in Model 2, the positive impact of E&P on SGR intensifies, with the coefficient rising to 3.106 (p < 0.01). This suggests that, after controlling for other factors, the effect of EID on sustainable growth becomes more pronounced. In Models 3 and 4, which account for individual and year fixed effects, the positive relationship between E&P and SGR remains robust, with coefficients of 1.412 (p < 0.01) and 1.441 (p < 0.01), respectively. These findings confirm that EID is a key driver of corporate sustainability, and its impact remains consistent across different model specifications.
In addition, from Model (1) to Model (4), the fit of the model gradually improves, with the R-squared value increasing from 0.008 (Model 1) to 0.395 (Model 4). This indicates that the introduction of fixed effects and control variables significantly enhances the model’s explanatory power for the data. The inclusion of control variables effectively reduces omitted variable bias and measurement error, making the model more robust. Among the control variables, the impact of leverage ratio (LEV) and fixed asset ratio (FIXED) on SGR is particularly prominent. LEV has a significant negative effect on SGR in Models (2) and (4) (coefficients −12.524 and −25.875, respectively, p < 0.01). Similarly, FIXED has a significant negative effect on SGR (coefficients −1.814 and −10.006, respectively, p < 0.01), suggesting that excessive debt levels and high fixed asset holdings may constrain sustainable development by amplifying financial stress and reducing asset liquidity.
In summary, EID (E&P) has a significant positive impact on a company’s sustainable growth rate (SGR), and this impact remains robust after introducing fixed effects and control variables. The improvement in model fit further validates the importance of fixed effects and control variables in reducing bias and enhancing the explanatory power of the model. Furthermore, leverage ratio (LEV) and fixed asset ratio (FIXED), as key control variables, have significant negative impacts on a company’s sustainable development capabilities. This provides a more comprehensive perspective for understanding the driving and constraining factors of corporate sustainable development.

4.6. Mediation Effect Analysis

Table 7 presents the results of the mediation effect test based on a multi-dimensional fixed-effects model. The study employs the stepwise regression approach to examine the indirect impact of EID (E&P) on sustainable growth rate (SGR) through profitability (ROA). In Column (1), with ROA as the dependent variable, the coefficient of E&P on SGR is 1.441, and it is statistically significant at the 1% level (t = 7.50), indicating that the issuance of corporate social responsibility reports significantly enhances sustainable growth rate. In Column (2), with SGR as the dependent variable, E&P has a significant positive impact on SGR (coefficient = 0.241, p < 0.05), suggesting that corporate social responsibility reports partially mediate the relationship by improving corporate profitability (ROA). Among the control variables, LEV and FIXED have significant negative effects on SGR, while Indep, TAT, and ROA have significant positive effects. In Column (3), after including the mediator variable ROA, the coefficient of E&P on SGR decreases to 0.352 but is still significant at the 1% level (t = 2.95), while the coefficient of ROA is as high as 122.331 (t = 243.04). This demonstrates that ROA plays a significant mediating role in the relationship between E&P and SGR. Following the testing procedure outlined, the mediation effect (indirect effect) is calculated as 0.009 × 122.331 ≈ 1.101, accounting for 76.4% of the total effect (1.441). This further confirms the partial mediation effect of profitability.
In this model, ROA acts as a mediating variable, linking E&P to SGR. The results from both Models (1) and (2) show that E&P significantly boosts ROA, which in turn positively impacts SGR. This suggests that E&P enhances corporate sustainability through improved ROA, providing evidence for a mediating effect and thereby supporting Hypotheses 2 and 3. While the direct effect of E&P on SGR remains significant in Model (2), the introduction of ROA as a mediating variable implies that part, or all, of this effect may be mediated by ROA. This mediating effect highlights that by engaging in EID, companies can improve their financial performance, which in turn fosters their long-term growth and sustainability. The partial mediating effect of ROA indicates that E&P can influence SGR through two distinct pathways: first, through direct paths such as by enhancing corporate reputation and strengthening social responsibility—which directly elevates SGR; second, through the indirect path, where improved corporate profitability and financial performance affect SGR. Notably, based on the coefficient magnitudes, the indirect effect constitutes the dominant influence.
Furthermore, the control variables corroborate this mechanism: the significantly positive coefficient of the TAT and the significantly negative coefficient of the LEV demonstrate higher ROA, thereby boosting sustainable growth SGR, while excessive debt undermines both ROA and SGR.

4.7. Endogeneity Test

The study uses the lagged period E&P_lag1 of the explanatory variable E&P (i.e., whether or not EID is disclosed in the social responsibility report) as an instrumental variable and uses the instrumental variable method to test the endogeneity of the model, and the results are shown in Table 8. The results in the first column show that the coefficient of instrumental variable E&P_lag1 on explanatory variable E&P is significant, which is consistent with the initial results and proves that the instrumental variable is valid. And through the unidentifiable test and weak instrumental variable experiment, it proves that the instrumental variables have explanatory power and the model has no obvious endogeneity problem.

4.8. Robustness Test

The data for studying EID mainly come from the social responsibility reports issued by enterprises, but the environmental information is also disclosed in the environmental reports of enterprises, so this paper replaces the original explanatory variable E&P with E&P-2, which represents the environmental information disclosure in the environmental report, as an explanatory variable, to test the robustness of the model. In order to ensure the robustness of the model, linear regression models were analyzed for different sources of E&P data under different conditions of the control variables LEV, Indep, and TAT, respectively, and the results are shown in the regression results (1) and (2) in Table 9. In addition, in order to further verify the robustness of the model, this paper also uses ROE to replace the mediator variable ROA in the regression analysis, and the results are shown in regression results (3) and (4).
From regression results (1) and (2), it can be seen that both E&P and E&P-2 have a significant effect on SGR. In regression result (1), the coefficient of E&P is 1.441 and significant at the 1% level, indicating that environmental information disclosure in CSR reports has a significant positive effect on sustainable growth rate; while in regression result (2), the coefficient of E&P-2 is 1.763, which is also significant at the 1% level, indicating that the positive effect of EID in environmental reports on sustainable growth rate is stronger. This indicates that different sources of EID data can significantly affect the sustainable growth rate of firms, and the disclosure information in the environmental report has a greater impact, but the difference between the two is not significant, and the model has good robustness under different E&P sources.
In regression results (3) and (4), the study uses ROE to replace the mediating variable ROA for robustness test. From the results, the coefficient of ROE is 27.334, and it is significant at the 1% level, indicating that ROE has a significant positive effect on SGR. Meanwhile, the model’s goodness-of-fit (R2) remains high after replacing the mediating variables, which are 0.768 and 0.744, respectively, indicating that the model still explains the changes in sustainable growth rate well after replacing ROA with ROE, which further validates the robustness of the model.

4.9. Mediation Effect Test

The mediation effect test aims to assess whether E&P affects firms’ sustainability (SGR) by influencing firms’ profitability (ROA) and thus firms’ sustainability. In order to verify the robustness of the mediated effect model, the Sobel test and Bootstrap test are conducted on the mediated effect model of this paper, and the results are shown in Table 10.
After controlling for the mediating variable of ROA, the coefficient of the direct effect of E&P on SGR is 0.352, and it is significant at the 1% level of significance (labeled ***). This indicates that even after considering the effect of profitability, EID still has a significant positive effect on corporate sustainability. Meanwhile, the coefficient of EID indirectly affecting firms’ sustainability ability through improving firms’ profitability is 1.089 and significant at the 1% level of significance (labeled ***). This indicates that EID can contribute to the sustainable development of enterprises by improving their profitability. Hypothesis 3 is tested. To assess the relative importance of profitability as a mediator, we compare the magnitudes of the direct and indirect effects. The total effect of EID on SGR, calculated as the sum of the direct and indirect effects, is 1.441 (0.352 + 1.089). The indirect effect accounts for approximately 75.6% of the total effect (1.089/1.441), while the direct effect contributes 24.4% (0.352/1.441). These results indicate that the indirect pathway through profitability dominates the relationship between EID and SGR, underscoring the critical role of profitability as a mediator. This finding aligns with signaling theory, which suggests that high-quality EID signals operational efficiency and financial performance to stakeholders, thereby enhancing profitability and, subsequently, sustainable development. The substantial indirect effect highlights that EID primarily promotes SGR by improving financial outcomes, while the significant but smaller direct effect suggests that additional mechanisms (e.g., enhanced reputation or stakeholder trust) may also contribute to sustainability.
According to Sobel’s test, Goodman1 test and Goodman2 test results show that they are all significant, proving that the mediating effect test is passed. The confidence intervals calculated by Bootstrap through the self-help method for both the indirect effect and the direct effect do not contain zeros, which further supports the significance of the mediating effect and the direct effect and proves that the mediating variables selected in the article are appropriate and robust.
In summary, the results of the mediation effect test indicate that EID not only directly affects the sustainability of enterprises (testing Hypothesis 1), but also indirectly contributes to the sustainability of enterprises by improving their profitability (testing Hypothesis 3). This indirect effect accounts for a considerable proportion of the total effect, further confirming the important role of EID on the sustainable development of enterprises.

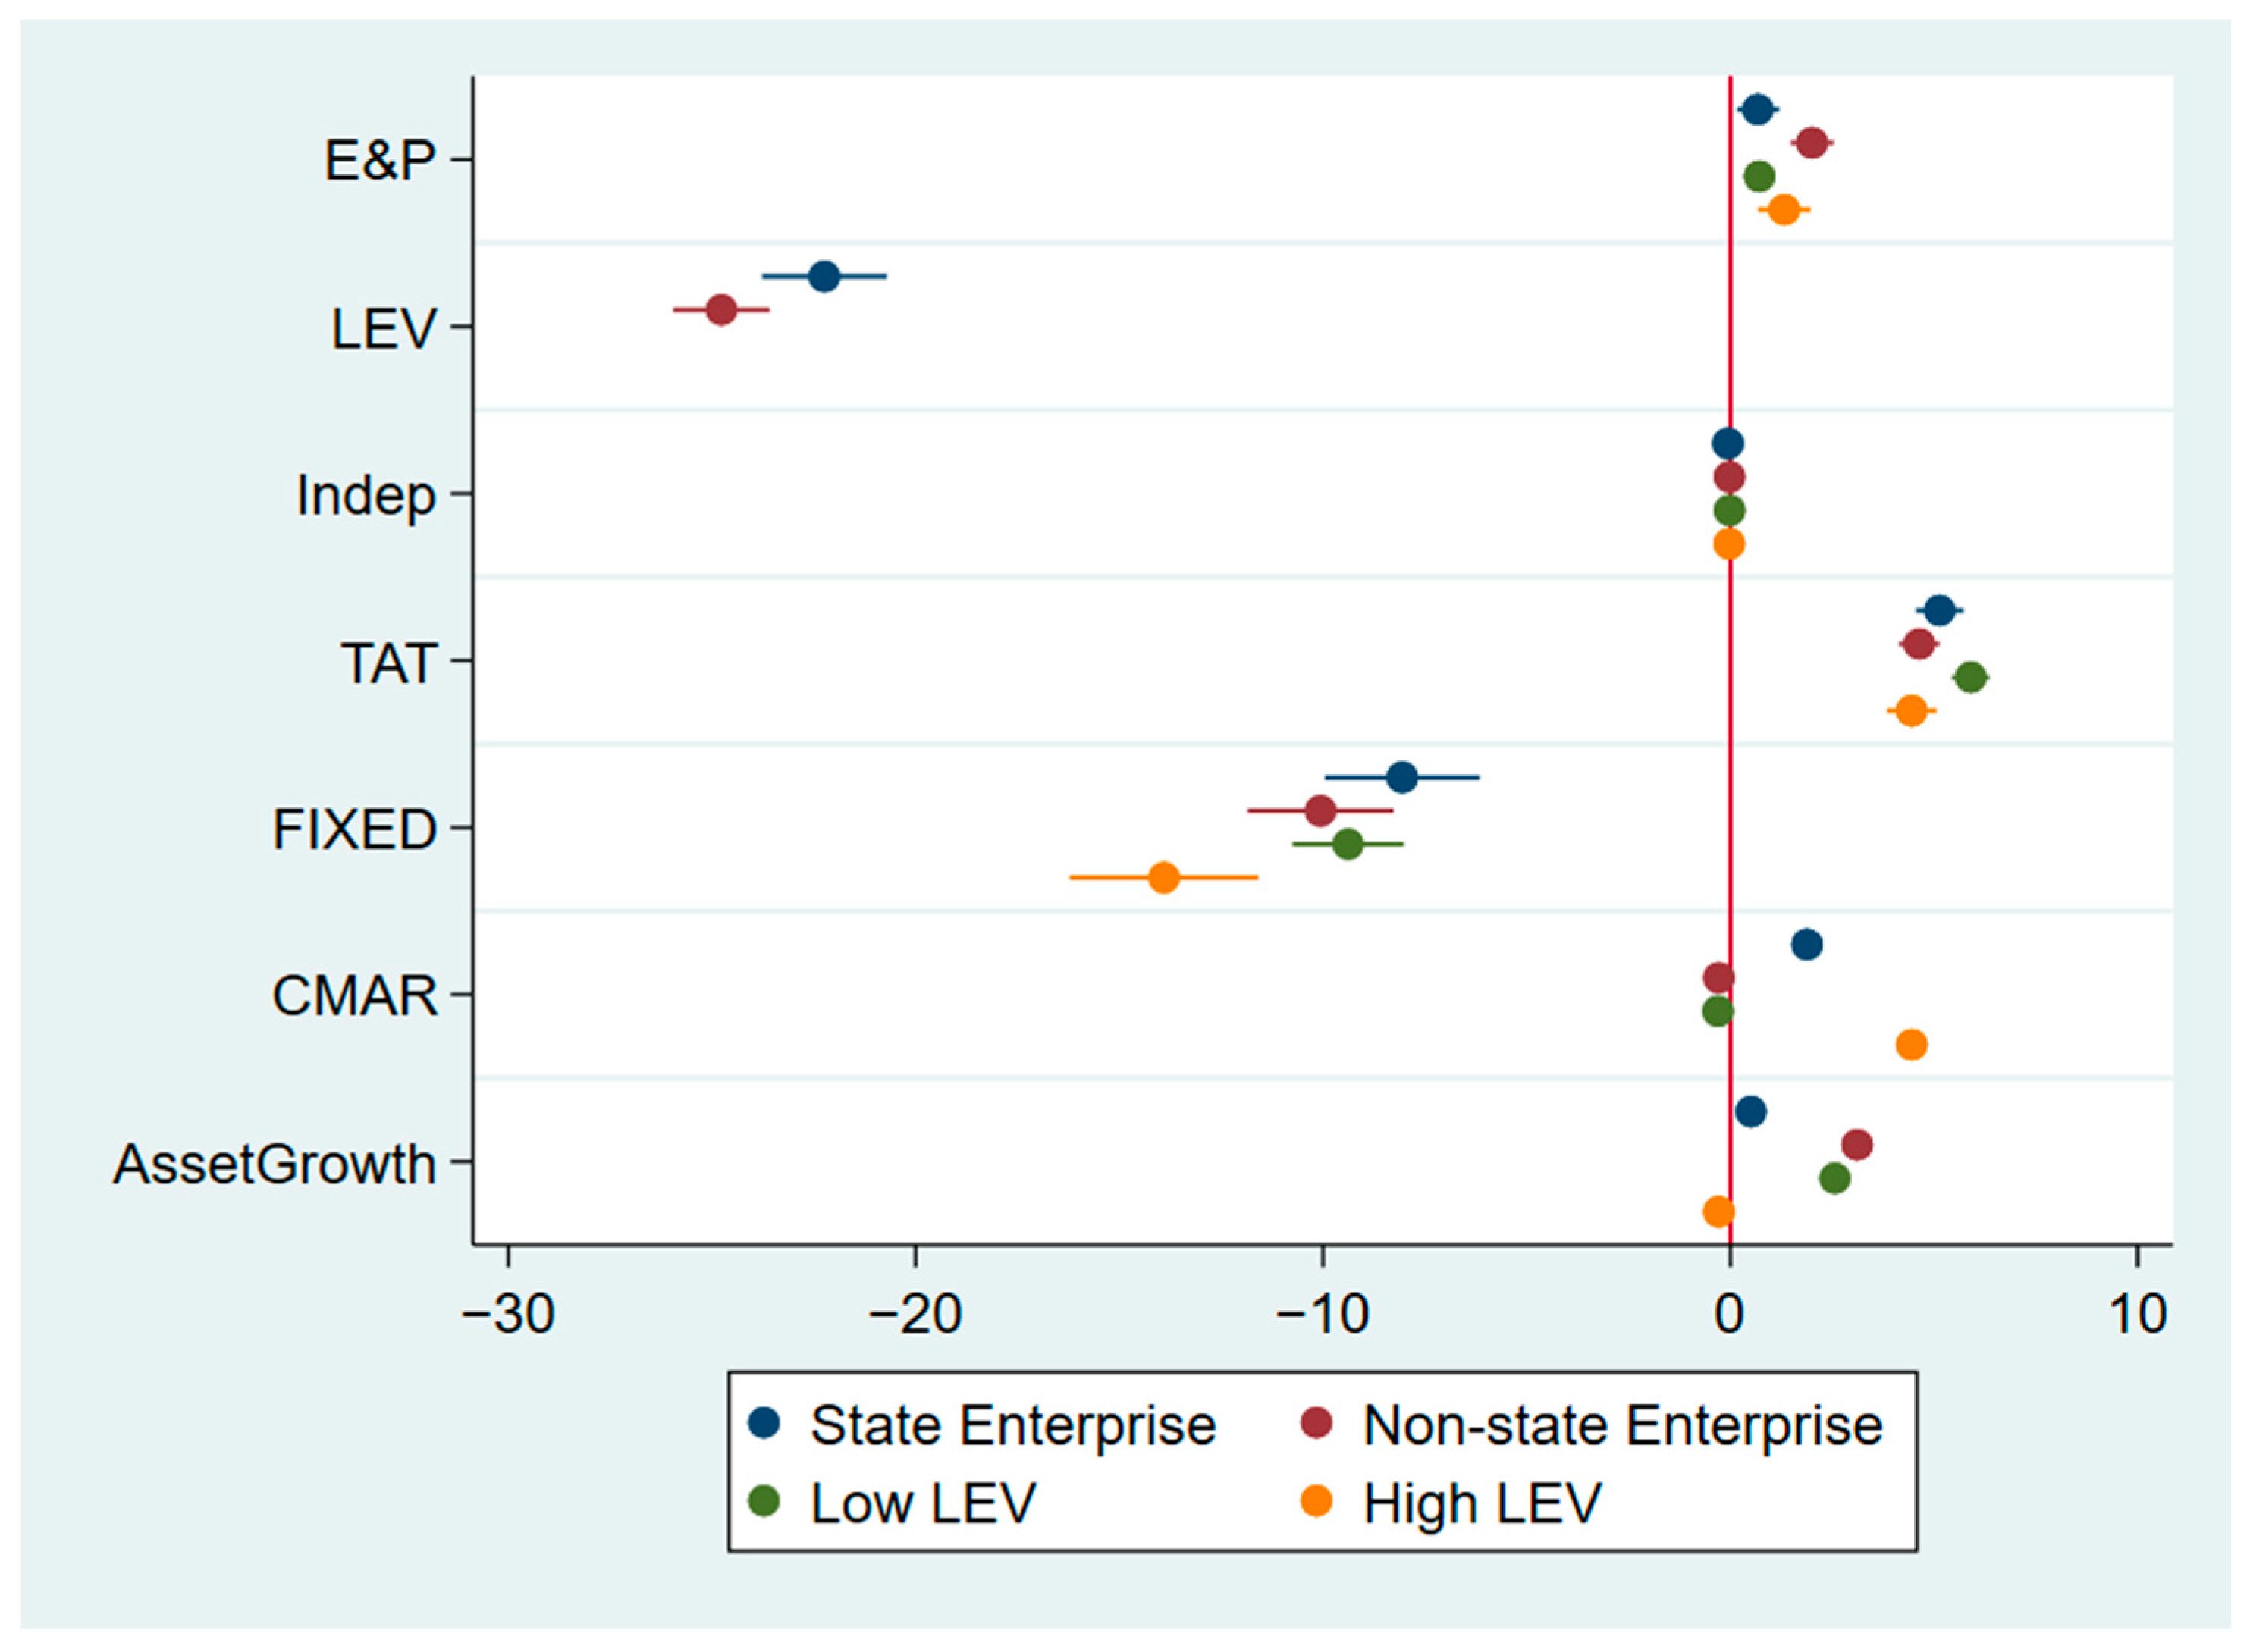
4.10. Heterogeneity Test

4.10.1. Heterogeneity Test Based on Leverage Ratio

In the linear regression results of Model (4) in Table 6, the coefficient of the LEV is −25.875, and it is significant at the 1% level, indicating that the leverage ratio has a significant negative effect on the SGR of the firm. This indicates that at higher debt levels, the sustainable growth capacity of firms is significantly limited. In order to deeply investigate the effect of EID on the sustainable growth capacity of enterprises under different debt levels, the study further conducted heterogeneity analysis to examine the mechanism of EID on the sustainable growth capacity of enterprises under low and high leverage ratio scenarios, respectively, and the results are shown in Table 11.
Table 11 demonstrates whether there is a significant difference in the effect of E&P on SGR at different levels of LEV. This paper divides enterprises into two groups by the median method, where those with an LEV higher than the median are classified as High LEV, and those with an LEV lower than the median are classified as Low LEV. The results show that the effect of E&P on SGR remains consistent under both low and high leverage ratio conditions, and there is no significant change in the model fit and correlation. That is, in the low leverage ratio scenario, the coefficient of E&P is 0.716, and it is significant at the 1% level; in the high leverage ratio scenario, the coefficient of E&P is 1.328, also significant at the 1% level. It indicates that EID has a significant positive effect on firms’ sustainable growth rate, and this effect is consistent across debt levels. In addition, the correlations of other control variables (e.g., percentage of independent directors, total asset turnover, etc.) do not change significantly across different contexts, which further suggests that the positive effect of EID on sustainable growth rate is highly robust.
To summarize, the quality of EID has a general promoting effect on the sustainable development of enterprises, no matter what debt level they are in. High-quality EID can enhance the social image of enterprises and strengthen investor confidence, thus bringing more resource support and broader development space for enterprises. At the same time, it also provides an important reference for policymakers; that is, by promoting enterprises to strengthen EID, they can promote sustainable development under different financial conditions.

4.10.2. Heterogeneity Test Based on the Nature of Property Rights

The nature of property rights can influence strategic decisions regarding organizational objectives, management, and corporate governance. Therefore, the impact of EID on corporate sustainability may vary according to the type of ownership. To investigate this, the sample was divided into state-owned and non-state-owned firms, and regression analyses were conducted.
As shown in Table 12, EID has a significant positive impact on corporate sustainability in both state-owned and non-state-owned enterprises, but the impact is greater in non-state-owned enterprises. Its internal influence mechanism can be explained from the following two perspectives.
Based on market signaling and competitive pressure mechanisms, the ability of non-SOEs to survive in a market-oriented environment is highly dependent on brand reputation and consumer trust. EID can be used as a “green signal” to convey information to the market about the fulfillment of corporate environmental responsibility and enhance consumer preference (i.e., the green premium effect). In contrast, SOEs are less dependent on market signals, as they can mitigate environmental costs through policy loans and government subsidies.
Based on the stakeholder interaction mechanism, non-SOEs (especially listed companies) need to attract investors, and EID can reduce the cost of capital (e.g., green bond issuance premium). On the other hand, SOEs are government-led, with the government and regulators as their main stakeholders, and EIDs mostly serve policy assessment (e.g., the “double carbon” target), with weaker interaction with market stakeholders.
Based on the mechanisms of governance and incentive structures, the lower response of SOEs can be attributed to their unique governance and incentive characteristics. In terms of governance structure, SOEs are typically controlled by the government, and their decision-making processes tend to serve national policy objectives (such as energy conservation and emission reduction) rather than directly responding to market competition pressures. This contrasts with non-SOEs, which have a more market-oriented governance structure, with independent directors and shareholder supervision prompting them to enhance market competitiveness through EID. In terms of incentive structure, the performance assessment of SOE management is often linked to policy objectives (such as the completion rate of environmental protection targets) rather than being directly associated with profitability or market performance. In comparison, the management of non-SOEs is often motivated by equity incentives or bonuses tied to profitability and stock prices, encouraging them to more actively enhance corporate image and financial performance through EID. Therefore, the market-oriented response of SOEs to EID is relatively weak, and their disclosure behavior is more driven by external policies rather than being actively promoted by internal governance and incentive mechanisms.
To more effectively illustrate the heterogeneity analysis results, we employ a forest plot to visualize the impact of EID on SGR across different enterprise types and leverage levels, as shown in Figure 3. The vertical axis of the figure lists variable names, while the horizontal axis represents the 95% confidence interval range. Blue dots indicate SOEs, red dots represent non-SOEs, green dots denote low-leverage enterprises, and yellow dots signify high-leverage enterprises. A confidence interval line positioned to the right of the zero-value red line indicates a significant positive effect on SGR, while a position to the left suggests a significant negative effect. The figure demonstrates that EID (measured by E&P) has a significant positive impact on SGR across all scenarios, with notably stronger effects in non-SOEs and high-leverage enterprises. This suggests that EID more substantially enhances the sustainable development of these enterprises by improving market trust and investor confidence. These findings are consistent with the analyses in Table 11 and Table 12, confirming both the universality and heterogeneity of EID’s positive effect. Additionally, other variables, such as TAT, show confidence intervals consistently positioned to the right of the red line, indicating a significant positive effect on SGR across all groups. Conversely, LEV exhibits confidence intervals to the left of the red line, reflecting a significant negative impact on SGR in both SOEs and non-SOEs, aligning with the table results. These consistent effect directions across different enterprise types and leverage levels underscore the model’s robustness. In conclusion, EID’s role in promoting sustainable development remains consistent regardless of ownership type or leverage level, offering valuable insights for policymakers to promote EID as a means to support enterprises’ sustainable development.

5. Results and Discussion

This study uses data from the CSMAR of Chinese A-share listed companies in Shanghai and Shenzhen from 2008 to 2023 to conduct an empirical analysis. The aim of the study is to examine the impact of EID on the sustainable development capabilities of enterprises and to explore the mechanisms underlying this effect. The results indicate that EID promotes the sustainable development of enterprises and also enhances their profitability. Moreover, profitability plays a mediating role in the relationship between EID and sustainable development, further amplifying the positive impact of EID on corporate sustainability. First, EID can promote corporate sustainable development, which is similar to Rabaya, A.J. et al.’s study, which focuses on the moderating effect of the adoption of the investor relations framework on the relationship between environmental, social, and governance disclosure and firms’ competitive advantage [36]. This suggests the importance of EID in enhancing firms’ competitiveness. The present study builds on this hypothesis by providing more precise data indicators for analysis. Specifically, it focuses on whether or not environmental information is disclosed in the firm’s social responsibility report, which makes the data more focused, clearer, and more representative. Second, EID improves firms’ profitability, which is in line with the findings of Ahmad, N. et al. that firms’ profitability was improved under a nationwide environmental information disclosure program, suggesting that EID has a positive impact on firms’ financial performance [37]. Building upon these conclusions, this paper further explores the impact of EID on corporate sustainable development capabilities by incorporating profitability as a mediating variable. Profitability plays a mediating role in the process through which EID promotes corporate sustainable development. Theoretically, this research offers new interpretations of the relationship between EID, profitability, and corporate sustainability, thereby extending and deepening the existing theoretical framework. Additionally, the study focuses on the long-term impact of EID on corporate sustainable development, rather than just the short-term effects. This provides fresh insights into understanding the long-term drivers of sustainability, highlighting the unique contribution of this paper.

6. Conclusions and Recommendations

6.1. Conclusions

This study examines the impact of EID on corporate sustainable development and the mediating role of profitability in this relationship. Firstly, by disclosing environmental information, enterprises can enhance their profitability. In the capital market, EID serves as a positive signal to investors, indicating that the company possesses strong environmental management capabilities and development potential. This attracts more investor interest and increases their willingness to invest, bringing additional financial support. This, in turn, facilitates the launch of new projects and business ventures, boosting profitability. Additionally, transparent and open EID can strengthen market confidence, improve the company’s reputation and brand value, and enhance its overall market competitiveness.
Moreover, high corporate profitability contributes to enhanced stability and sustainable development capabilities. According to stakeholder theory, higher profitability generates substantial returns for shareholders, satisfying their interests and boosting their confidence in the company. This strengthens shareholder relations and provides a solid financial foundation for long-term development. Additionally, profitable enterprises can offer more competitive compensation packages and better career development opportunities, helping to attract and retain a stable, high-quality talent pool. This supports continuous innovation and development, further enhancing corporate stability and sustainability. From the perspective of signaling theory, high profitability signals to the market that the company is in a strong operational condition and has promising growth prospects. This attracts investors and partners, improving the company’s market position and helping it become a leader or significant player in its industry. As a result, the company is better equipped to withstand market competition, mitigate risks, and maintain stability during industry changes and market fluctuations, ultimately achieving sustainable development.
Furthermore, corporate EID can drive sustainable development by enhancing profitability. EID signals that the company prioritizes sustainable development, which attracts investor and market attention, thereby boosting profitability. As profitability increases, it further signals to the market that the company has strong sustainable development capabilities, drawing more resources and support. This creates a positive feedback loop where EID, profitability, and sustainable development reinforce each other, collectively driving the company toward long-term sustainability.
The above conclusions are primarily based on empirical data from Chinese enterprises, reflecting the role of EID within the context of China’s capital market and policy environment. In China, EID is significantly influenced by government policies, the dominance of state-owned enterprises, and rapidly growing public environmental awareness. However, the applicability of these findings in other countries and regions may vary due to differences in economic, cultural, and regulatory environments. For instance, in European countries, EID is often subject to stringent legal and regulatory frameworks, potentially driven more by compliance than by market signaling. In developing countries, such as those in Southeast Asia or Africa, EID may be more influenced by pressures from international investors or multinational corporations rather than local market dynamics or policy incentives. Additionally, cultural factors (e.g., public awareness of sustainability) and the maturity of capital markets can further shape the effectiveness of EID.

6.2. Recommendations

This paper explores the impact of EID on corporate sustainability and its underlying mechanisms, contributing to existing research and offering new insights into the long-term drivers of corporate sustainability. Based on the findings, the following recommendations are proposed:
Firstly, at the corporate level, companies should focus on enhancing their EID system by establishing dedicated departments or roles responsible for collecting, organizing, and disclosing environmental information. It is crucial to develop detailed EID plans that outline the content, frequency, and methods of disclosure, ensuring the accuracy, completeness, and timeliness of the information. Additionally, companies should strengthen environmental management and governance practices, using EID as an opportunity to improve environmental management strategies. Companies should increase investments in environmental protection, adopt advanced technologies and equipment, reduce pollutant emissions, and enhance resource utilization efficiency. These efforts will help improve corporate environmental performance and provide a solid foundation for long-term sustainability. Also, to align profitability with sustainability, companies should leverage the reputation and market recognition gained through EID to optimize their product mix, develop green products, expand into green markets, and increase the added value of their products. This will not only enhance profitability but also further support sustainability initiatives. Companies should allocate a portion of the increased profitability toward funding sustainability strategies, creating a positive feedback loop that benefits both profitability and sustainability.
Furthermore, at the level of governments and social regulatory bodies, there is a need to improve EID regulations and standards. This can be achieved by formulating unified and clear regulations that standardize corporate disclosure practices, minimizing discrepancies and uncertainties in disclosure across enterprises. Governments should also strengthen the oversight of corporate EID efforts, imposing penalties on companies that fail to disclose required information or provide false data, in accordance with the law. Additionally, providing policy support and incentives is crucial. Governments can offer tax incentives, financial subsidies, and green credit to companies that actively engage in EID and demonstrate strong environmental performance. This reduces environmental protection costs, improves profitability, and encourages companies to pursue sustainable development strategies. Furthermore, policymakers should focus on guiding corporate sustainability by integrating sustainability principles into corporate strategies and daily operations, fostering a balanced approach to economic, environmental, and social development.

6.3. Limitations and Future Research

The study discusses how EID promotes the sustainable development ability of enterprises by improving their profitability. However, the theoretical explanation of the mediating effect of profitability is not deep enough, and it lacks the excavation of the deep intrinsic connection between EID and corporate sustainable development, such as not fully considering the influence of non-economic factors such as social opinion and industry norms on corporate decision-making. Additionally, a key limitation lies in the geographic scope of the data, which is primarily drawn from Chinese enterprises. This may not fully capture the variations in economic, cultural, and regulatory environments across other countries and regions, potentially affecting the effectiveness of EID and its mechanisms for promoting sustainability. The above issues need to be addressed in our subsequent research. Meanwhile, future research can further explore the applicability and effects of EID in different countries and regions.

Author Contributions

Conceptualization, X.W. and J.J.; data curation, X.W., Q.Y. and H.D.; formal analysis, X.W. and J.J.; investigation, X.W. and W.L.; methodology, X.W.; project administration, J.J.; resources, X.W. and J.J.; supervision, J.J.; validation, X.W., W.L. and J.J.; visualization, X.W. and J.J.; writing—original draft, X.W., W.L. and Q.Y.; writing—review and editing, X.W., J.J., W.L., Q.Y., H.D. and H.C. All authors have read and agreed to the published version of the manuscript.

Funding

This research received no external funding.

Institutional Review Board Statement

Not applicable.

Informed Consent Statement

Not applicable.

Data Availability Statement

The datasets generated and/or analyzed during the current study are available in the CSMAR repository, and can be obtained at (https://data.csmar.com, accessed on 13 May 2025).

Conflicts of Interest

The authors declare no competing interests.

Abbreviations

The following abbreviations are used in this manuscript:
EIDenvironmental information disclosure
CSMARChina Stock Market & Accounting Research Database
ROAReturn on Assets
SGRsustainable growth rate

References

  1. Xinhua News Agency. How to Understand the Reform of Deepening the Legal Disclosure System of Environmental Information. October 2024. Available online: https://www.gov.cn/zhengce/202410/content_6983907.htm (accessed on 4 April 2025).
  2. Evans, M.F.; Gilpatric, S.M.; Liu, L. Regulation with direct benefits of information disclosure and imperfect monitoring. J. Environ. Econ. Manag. 2009, 57, 284–292. [Google Scholar] [CrossRef]
  3. Zeng, S.X.; Xu, X.D.; Yin, H.T.; Tam, C.M. Factors that drive Chinese listed companies in voluntary disclosure of environmental information. J. Bus. Ethics 2012, 109, 309–321. [Google Scholar] [CrossRef]
  4. Guangzhou Regional Low Carbon Economy Research Base. Policy Overview Issue 8: Environmental Information Disclosure. 2 August 2021. Available online: https://lcerc.jnu.edu.cn/2021/0802/c32143a640239/page.htm (accessed on 4 April 2025).
  5. Ding, J.; Lu, Z.; Yu, C.-H. Environmental information disclosure and firms’ green innovation: Evidence from China. Int. Rev. Econ. Financ. 2022, 81, 147–159. [Google Scholar] [CrossRef]
  6. Sumiani, Y.; Haslinda, Y.; Lehman, G. Environmental reporting in a developing country: A case study on status and implementation in Malaysia. J. Clean. Prod. 2007, 15, 895–901. [Google Scholar] [CrossRef]
  7. Plumlee, M.; Brown, D.; Hayes, R.M.; Marshall, R.S. Voluntary environmental disclosure quality and firm value: Further evidence. J. Account. Public Policy 2015, 34, 336–361. [Google Scholar] [CrossRef]
  8. Chen, Y.; Chen, L. Does pollution information disclosure affect corporate employment? Evidence from China. Sustainability 2025, 17, 875. [Google Scholar] [CrossRef]
  9. People’s Daily Online. Read the Third Plenary Session of the Central Committee of the Communist Party of China (CPC) ④: Knowledge Behind 8 Sets of ‘Green Buzzwords’. 3 August 2024. Available online: http://finance.people.com.cn/n1/2024/0803/c1004-40291755.html (accessed on 4 April 2025).
  10. The United Nations. Sustainable Development Goals: 17 Goals to Transform the World. Available online: https://www.un.org/zh/70001/page/180631 (accessed on 4 April 2025).
  11. European Commission. Implementing and Delegated Acts—CSRD. Available online: https://finance.ec.europa.eu/regulation-and-supervision/financial-services-legislation/implementing-and-delegated-acts/corporate-sustainability-reporting-directive_en (accessed on 4 May 2025).
  12. Balsanek, K.; Anagnosti, E.; Cloud, W.; Baker, J.; Gumabon-Greaver, S. SEC Climate Disclosure Rules: Four Potential Paths Under President Trump. DLA Piper. 2024. Available online: https://www.dlapiper.com/en-us/insights/publications/2025/02/sec-climate-disclosure-rules-four-potential-paths-under-president-trump (accessed on 4 May 2025).
  13. Ezhilarasi, G.; Kabra, K.C. The impact of corporate governance attributes on environmental disclosures: Evidence from India. Indian J. Corp. Gov. 2017, 10, 24–43. [Google Scholar] [CrossRef]
  14. Ruchita, V.; Dhanraj, S.; Hayatullah, J. Impact of corporate governance on environmental information disclosure: Evidence from India. Orissa J. Commer. 2021, 42, 16–28. [Google Scholar] [CrossRef]
  15. Zhou, Y.; Shi, Z.; Lei, F.; Sun, W.; Zhang, J. Effect of Environmental information disclosure on the financing efficiency of enterprises—Evidence from China’s listed energy companies. Sustainability 2022, 14, 16699. [Google Scholar] [CrossRef]
  16. Zhu, C.; Li, N.; Ma, J. Environmental backgrounds of CEOs and corporate environmental management information disclosure: The mediating effects of financing constraints and media attention. Corp. Soc. Responsib. Environ. Manag. 2023, 30, 2885–2905. [Google Scholar] [CrossRef]
  17. Zhao, X.; Zhu, R.; Li, Q.; Hu, J. Unleashing the impact of environmental information disclosure on corporate green innovation: The role of audit quality and media attention. Environ. Dev. 2024, 52, 101078. [Google Scholar] [CrossRef]
  18. Luo, Y.; Xiong, G.; Mardani, A. Environmental information disclosure and corporate innovation: The “Inverted U-shaped” regulating effect of media attention. J. Bus. Res. 2022, 146, 453–463. [Google Scholar] [CrossRef]
  19. Meng, X.; Tang, M.; Kong, F.; Li, S. The effect of environmental information disclosure on green total factor productivity: Evidence from quasi-natural experiments on cities in China. Sustainability 2022, 14, 13079. [Google Scholar] [CrossRef]
  20. Wang, Y. Impact of environmental information disclosure on environmental regulation intensity: Evidence from 113 cities in China. Sci. Rep. 2024, 14, 25357. [Google Scholar] [CrossRef] [PubMed]
  21. Hsu, A.; de Sherbinin, A.; Shi, H. Seeking truth from facts: The challenge of environmental indicator development in China. Environ. Dev. 2012, 3, 39–51. [Google Scholar] [CrossRef]
  22. Mol, A.P.J. Environmental governance in the information age: The emergence of informational governance. Environ. Plan. C Gov. Policy 2006, 24, 497–514. [Google Scholar] [CrossRef]
  23. Radej, B.; Zakotnik, I. Environment as a factor of national competitiveness in manufacturing. In Technological Choices for Sustainability; Sikdar, S.K., Glavič, P., Jain, R., Eds.; Springer: Berlin/Heidelberg, Germany, 2004; pp. 283–298. [Google Scholar] [CrossRef]
  24. Mol, A.P.J.; He, G.; Zhang, L. Information disclosure in environmental risk management: Developments in China. J. Curr. Chin. Aff. 2011, 40, 163–192. [Google Scholar] [CrossRef]
  25. Solikhah, B.; Maulina, U. Factors influencing environment disclosure quality and the moderating role of corporate governance. Cogent Bus. Manag. 2021, 8, 1876543. [Google Scholar] [CrossRef]
  26. Chen, X.; Li, X.; Huang, X. The impact of corporate characteristics and external pressure on environmental information disclosure: A model using environmental management as a mediator. Environ. Sci. Pollut. Res. 2022, 29, 12797–12809. [Google Scholar] [CrossRef]
  27. Liu, X.; Anbumozhi, V. Determinant factors of corporate environmental information disclosure: An empirical study of Chinese listed companies. J. Clean. Prod. 2009, 17, 593–600. [Google Scholar] [CrossRef]
  28. Li, X.; Wang, R.; Wang, M.; Xu, S.; Li, L. The relationship between environmental information disclosure and financing constraints: Evidence from heavily polluted listed companies in China. In Proceedings of the International Conference on Decision Science & Management (ICDSM ‘24), Association for Computing Machinery, Hong Kong, China, 26–28 April 2024; pp. 37–46. [Google Scholar] [CrossRef]
  29. Freeman, R.E. Strategic Management: A Stakeholder Approach; Pitman: Boston, MA, USA, 1984. [Google Scholar]
  30. Branco, M.C.; Rodrigues, L.L. Social responsibility disclosure: A study of proxies for the public visibility of Portuguese banks. Br. Account. Rev. 2008, 40, 161–181. [Google Scholar] [CrossRef]
  31. Hu, S.; Zhang, C.; Ji, Y.; Zhang, C. Does environmental information disclosure tone affect corporate green innovation in China? Based on the institutional perspective. Environ. Dev. Sustain. 2024, 26, 12239–12282. [Google Scholar] [CrossRef]
  32. Shen, S.; Xie, J.; Fujii, H.; Keeley, A.R.; Managi, S. Does environmental materiality matter to corporate financial performance: Evidence from 34 countries. Corp. Soc. Responsib. Environ. Manag. 2024, 32, 2390–2411. [Google Scholar] [CrossRef]
  33. Malik, F.; Wang, F.; Li, J.; Naseem, M.A. Impact of environmental disclosure on firm performance: The mediating role of green innovation. Rev. Contab. 2023, 26, 14–26. [Google Scholar] [CrossRef]
  34. Wang, D.; Li, X.; Tian, S.; He, L.; Xu, Y.; Wang, X. Quantifying the dynamics between environmental information disclosure and firms’ financial performance using functional data analysis. Sustain. Prod. Consum. 2021, 28, 192–205. [Google Scholar] [CrossRef]
  35. Li, J.; Tang, D.; Tenkorang, A.P.; Shi, Z. Research on environmental regulation and green total factor productivity in Yangtze River Delta: From the perspective of financial development. Int. J. Environ. Res. Public Health 2021, 18, 12453. [Google Scholar] [CrossRef]
  36. Rabaya, A.J.; Saleh, N.M. The moderating effect of IR framework adoption on the relationship between environmental, social, and governance (ESG) disclosure and a firm’s competitive advantage. Environ. Dev. Sustain. 2022, 24, 2037–2055. [Google Scholar] [CrossRef]
  37. Ahmad, N.; Li, H.-Z.; Tian, X.-L. Increased firm profitability under a nationwide environmental information disclosure program? Evidence from China. J. Clean. Prod. 2019, 230, 1176–1187. [Google Scholar] [CrossRef]
Figure 1. Mechanisms for the impact of E&P on SGR.
Sustainability 17 04603 g001
Figure 2. Trend of companies disclosing vs. not disclosing environmental information.
Sustainability 17 04603 g002
Figure 3. Heterogeneity test results on SGR by enterprise type and leverage levels.
Sustainability 17 04603 g003
Table 1. Definitions and measures of key variables.
Variable TypeVariable NameNotationDescription of Definitions
Dependent VariableThe sustainable development of the enterpriseSGRLarger values represent the greater potential for growth in sales and profits that the firm can realize without adding additional capital, and the greater its sustainability. Values are taken as percentages.
Independent variableEnvironmental information disclosureE&PDisclosed environmental information takes the value of 1, otherwise it is 0; the data are obtained from the social responsibility reports of listed companies.
Mediating variableProfitabilityROAThe profitability of the announced enterprises during the reporting period.
Control variablesFixed Asset RatioFIXEDNet fixed assets/total assets.
Total Asset Growth RateAsset-Growth(Closing value of total assets for the period—Opening value of total assets for the period)/(Opening value of total assets for the period).
The proportion of independent directorsIndepNumber of independent directors/total number of directors.
Capital Preservation and Appreciation RateCMARClosing value of the period/(Total owner’s equity) Opening value of the period.
Total Asset Turnover RatioTATClosing balance of operating income/total assets;
Leverage RatioLEVTotal liabilities/total assets.
Table 2. Descriptive statistics.
VarNameObsMeanSDMinMedianMax
SGR42,0093.34711.397−88.64.3931
E&P42,0090.2840.451001
ROA42,0090.0300.076−2.120.03360.418
LEV42,0090.4280.2050.00710.4220.994
Indep42,00937.6725.608036.480
TAT42,0090.6110.513−0.05830.50712.1
FIXED42,0090.2100.16100.1770.971
CMAR42,0091.1412.1290.1141.06366
Asset-Growth42,0090.1440.581−0.9070.078345.5
Table 3. Correlation calibration.
SGRE&PROALEVIndepTATFIXEDCMARAssetGrowth
SGR1
E&P0.089 ***1
ROA0.821 ***0.071 ***1
LEV−0.186 ***0.145 ***−0.292 ***1
Indep−0.026 ***0.005−0.033 ***−0.012 **1
TAT0.104 ***0.027 ***0.079 ***0.141 ***−0.027 ***1
FIXED−0.045 ***0.061 ***−0.025 ***0.078 ***−0.049 ***0.008 *1
CMAR0.056 ***−0.0070.045 ***−0.028 ***−0.007−0.012 **−0.026 ***1
Asset-Growth0.131 ***−0.024 ***0.116 ***0.019 ***−0.005−0.028 ***−0.077 ***0.563 ***1
Note: (1) *, **, and *** mean statistical significance at the 10%, 5%, and 1% level, respectively. * p < 0.1, ** p < 0.05, *** p < 0.01; (2) t statistics in parentheses.
Table 4. Variance inflation factor statistics.
VIF1/VIF
Asset-Growth1.2720.786
CMAR1.2150.823
LEV1.1990.834
ROA1.1680.856
E&P1.0450.957
TAT1.0450.957
FIXED1.0320.969
Indep1.0050.995
Mean VIF1.1220.000
Table 5. Fixed effects model test.
ModelsTest Typep-ValueTest Statistic
Model 2F-test03.45
Hausman test02539.43
Model 1F-test03.81
Hausman test0623.68
Table 6. SGR regressions with E&P under varying control variables and fixed effects.
(1)(2)(3)(4)
SGRSGRSGRSGR
E&P2.238 ***3.106 ***1.412 ***1.441 ***
(18.23)(26.06)(6.92)(7.50)
LEV −12.524 *** −25.875 ***
(−47.17) (−55.61)
Indep −0.054 *** −0.022
(−5.70) (−1.63)
TAT 3.019 *** 5.046 ***
(28.85) (25.71)
FIXED −1.814 *** −10.006 ***
(−5.45) (−14.98)
CMAR −0.217 *** −0.170 ***
(−7.17) (−6.06)
Asset-Growth 3.188 *** 2.716 ***
(28.67) (26.04)
_cons2.710 ***8.192 ***2.961 ***13.728 ***
(41.39)(20.85)(38.91)(23.91)
YearfixedNONOYesYes
FirmfixedNONOYesYes
N42,00942,00941,56041,560
R20.0080.0880.3180.395
Note: (1) *** mean statistical significance at the 1% level, respectively. *** p < 0.01; (2) t statistics in parentheses.
Table 7. Model regression results.
(1)(2)(3)
SGRROASGR
E&P1.441 ***0.009 ***0.352 ***
(7.50)(7.22)(2.95)
LEV−25.875 ***−0.169 ***−5.162 ***
(−55.61)(−56.73)(−17.16)
Indep−0.022−0.000 ***0.014 *
(−1.63)(−3.44)(1.72)
TAT5.046 ***0.023 ***2.240 ***
(25.71)(18.22)(18.32)
FIXED−10.006 ***−0.057 ***−2.994 ***
(−14.98)(−13.37)(−7.21)
CMAR−0.170 ***−0.001 ***−0.012
(−6.06)(−7.18)(−0.69)
Asset-Growth2.716 ***0.018 ***0.542 ***
(26.04)(26.56)(8.31)
ROA 122.331 ***
(243.04)
YearfixedYesYesYes
FirmfixedYesYesYes
N41,56041,56041,560
R20.3950.4390.768
Note: (1) t statistics in parentheses; (2) *** 1%, * 10%, * p < 0.1, *** p < 0.01.
Table 8. Endogeneity test.
(1)(2)
FirstSecond
E&P_lag10.485 ***
(103.23)
E&P 0.072
(0.15)
LEV −25.8720 ***
(−23.51)
Indep −0.0213
(−1.13)
TAT 5.0370 ***
(5.93)
FIXED −10.0740 ***
(−8.03)
CMAR −0.1698
(−1.22)
Asset-Growth 2.7093 ***
(4.31)
_cons 8.201 ***
(18.38)
N41,56041,560
Kleibergen–Paap rk LM statistic795.28 ***
(Kleibergen–Paap rk Wald F statistic):2885.200
R20.2240.154
Note: (1) t statistics in parentheses; (2) *** 1%, *** p < 0.01.
Table 9. Robustness test.
Variant(1)
SGR
(2)
SGR
(3)
SGR
(4)
SGR
E&P1.441 *** 0.352 ***0.594 ***
(7.50) (2.95)(4.75)
E&P-2 1.763 ***
(6.50)
ROA 122.331 ***
(243.04)
ROE 27.334 ***
(224.08)
Constant13.728 ***14.042 ***0.4863.838 ***
(23.91)(24.56)(1.35)(10.20)
N41,56041,56041,56041,560
R20.3950.3950.7680.744
Note: t statistics in parentheses, *** p < 0.01.
Table 10. Mediation effect test.
(1)(2)
ROASGR
E&P0.009 ***0.352 ***
(7.22)(2.95)
LEV−0.169 ***−5.162 ***
(−56.73)(−17.16)
Indep−0.000 ***0.014 *
(−3.44)(1.72)
TAT0.023 ***2.240 ***
(18.22)(18.32)
FIXED−0.057 ***−2.994 ***
(−13.37)(−7.21)
CMAR−0.001 ***−0.012
(−7.18)(−0.69)
Asset-Growth0.018 ***0.542 ***
(26.56)(8.31)
ROA 122.331 ***
(243.04)
Sobel test1.089 *** (z = 7.215)
Goodman-1 test1.089 *** (z = 7.214)
Goodman-2 test1.089 *** (z = 7.215)
Indirect effect coefficient1.089 *** (z = 7.214)
Direct effect coefficient0.352 *** (z = 2.953)
Total effect coefficient1.440 *** (z = 7.493)
Proportion of intermediary effects3.091
Bootstrap(ind_eff)2.483 ***
[2.307724, 2.659053]
Bootstrap(dir_eff)0.627 ***
[0.4856511, 0.7839608]
YearfixedYesYes
FirmfixedYesYes
N41,56041,560
R20.4390.768
Note: t statistics in parentheses, * p < 0.1, *** p < 0.01.
Table 11. Heterogeneity test (leverage ratio).
VariantHeterogeneity Test for Leverage Ratio
Low LEVHigh LEV
SGRSGR
E&P0.716 ***1.328 ***
(3.69)(4.03)
Indep−0.014−0.023
(−1.04)(−1.01)
TAT5.906 ***4.455 ***
(24.88)(14.20)
FIXED−9.378 ***−13.901 ***
(−13.43)(−11.76)
CMAR−0.301 ***4.457 ***
(−12.58)(26.33)
Asset-Growth2.569 ***−0.280
(19.49)(−1.55)
YearfixedYesYes
FirmfixedYesYes
N20,29620,591
R20.4710.425
Note: (1) *** mean statistical significance at the 1% level, respectively; (2) t statistics in parentheses.
Table 12. Heterogeneity test (the nature of property rights).
(1) State Enterprise(2) Non-State Enterprise
SGRSGR
E&P0.681 **2.009 ***
(2.56)(7.44)
LEV−22.238 ***−24.766 ***
(−28.42)(−40.92)
Indep−0.055 ***−0.016
(−2.91)(−0.87)
TAT5.140 ***4.644 ***
(17.21)(18.10)
FIXED−8.052 ***−10.058 ***
(−8.30)(−10.99)
CMAR1.884 ***−0.279 ***
(13.36)(−9.27)
Asset-Growth0.511 ***3.116 ***
(2.82)(24.14)
YearfixedYesYes
FirmfixedYesYes
N14,79926,701
R20.4350.416
Note: (1) **, and *** mean statistical significance at the 5%, and 1% level, respectively; (2) t statistics in parentheses.
Disclaimer/Publisher’s Note: The statements, opinions and data contained in all publications are solely those of the individual author(s) and contributor(s) and not of MDPI and/or the editor(s). MDPI and/or the editor(s) disclaim responsibility for any injury to people or property resulting from any ideas, methods, instructions or products referred to in the content.

