1. Introduction
Urban bus and metro systems, as the primary modes of transportation for city residents, are tasked with meeting the daily travel needs of a large population [
1]. However, their operation inevitably encounters disruptions from external environmental factors and disaster events, which pose significant challenges to their stable functioning. In recent years, the frequency of severe rainstorms and flood disasters in urban areas has increased, leading to interruptions in transportation networks, impeded rescue operations, and significant disaster-related losses. For instance, in July 2021, Zhengzhou, Henan Province, China, experienced an unprecedented rainstorm that caused the complete shutdown of the metro network and a significant shift in passenger flow to the surface bus system. This incident represented the first test of the bus system’s capacity to handle the metro passenger load, illustrating the functional interplay between metro and bus systems as a form of multi-layered transportation network [
2]. Against this backdrop, it is both necessary and urgent to accurately assess and effectively enhance the resilience of urban transportation systems.
The term “resilience” originates from the Latin word “resiliere”, meaning the ability of an object to return to its original state after being subjected to external forces, describing its rebound or spring-back characteristics [
3]. Since Holling [
4] defined resilience in the context of ecosystems, the concept has gradually been introduced into various disciplines, including economics, social sciences, supply chain management, and systems engineering. The study of resilience in transportation systems has gained prominence since Murray-Tuite [
5] first introduced the concept into this field. Research today widely acknowledges the “4R” theoretical framework of resilience proposed by Bruneau et al. [
6], which posits that resilience is a composite concept consisting of the following four core attributes: robustness, redundancy, resourcefulness, and rapidity. This framework has been broadly adopted and applied in subsequent resilience research.
Building on this theoretical foundation, an increasing number of studies in recent years have focused on the resilience of urban public transit networks under disruptive conditions [
7,
8]. Traditional research has primarily concentrated on single-mode systems, such as urban rail transit networks or bus transit networks, and it typically evaluates resilience using static topological metrics or basic robustness tests [
9,
10,
11,
12,
13]. Some studies have taken a broader view by incorporating service-related factors such as accessibility, frequency, cost, and delay to better understand system-level dynamics under daily operational contexts. Macioszek et al. [
14], for example, used a logit model to examine how these factors, together with sociodemographic attributes, influence public transport usage patterns. However, such approaches often still fall short of capturing the complex coupling dynamics that arise in multi-modal public transit networks, especially during large-scale disruptions.
To address these limitations, Wang et al. [
15] proposed a resilience assessment framework for multi-modal public transit networks (MPTNs) that incorporates both passenger demand and infrastructure supply. Their model applies a cascading failure mechanism to simulate intermodal load redistribution, revealing that system resilience is highly sensitive to node-level characteristics such as degree and betweenness centrality. Moreover, they found that beyond a certain threshold, increasing node capacity yields diminishing improvements in overall resilience. Zhang et al. [
16] extended this line of research by developing a cascading reliability model for interdependent transit networks, emphasizing the importance of embedded modal interactions and cross-layer failure load redistribution control. Xu et al. [
17] introduced a multilayer interdependent model using an expanded L-space method to simulate mode-switching behaviors and modal coupling robustness. Their findings highlight the significant role of topological complexity and intermodal walking or cycling distances in shaping network vulnerability during cascading failures.
While these studies have significantly advanced the field, most existing research is still based on simulations and tends to focus on general types of network failures such as overload or targeted attacks. In comparison, real-world disaster situations such as urban flooding, which often involve risks that are spatially concentrated and specific to certain types of infrastructure, have received relatively limited attention. In addition, only a few models have considered how failure spreads between metro and bus systems, especially in mixed networks where the breakdown of one mode may force the other to take on additional passenger demand.
In response, this study proposes a resilience assessment framework tailored to bus–metro hybrid networks under urban flood conditions. The main contributions are as follows:
1. A node-level flood risk quantification method is proposed by integrating meteorological, topographic, and socio-transportation data to construct a vulnerability index for identifying high-risk nodes.
2. A cascading failure model is developed for coupled bus–metro systems to simulate the redistribution of passenger flow across modes following metro station failures during flood events and to assess the resulting failure propagation and recovery dynamics.
3. An empirical resilience evaluation is conducted using real-world data from Zhengzhou’s bus–metro network, combining topological and functional efficiency metrics to analyze system performance under different load capacity parameters and recovery strategies (random, degree-based, and betweenness-based).
This study provides both theoretical and practical contributions for enhancing the resilience of urban public transit systems under extreme flood scenarios and offers decision-making support for urban planners and emergency management authorities in designing more effective response and recovery strategies.
2. Materials and Methods
2.1. Quantification of Flood Disaster Risk for Nodes in Urban Bus–Metro Hybrid Networks
Based on the regional natural disaster system theory, this study quantified flood risk for nodes in urban bus–metro hybrid networks through the dimensions of disaster-inducing factors, hazard-prone environments, and disaster-bearing bodies. Flood risk is represented by a risk index, with higher indices indicating a greater likelihood of node failure and a more significant impact of such failure on the network. Considering factors such as climate change, topography, and the surrounding environment, five indicators were selected to establish the flood risk quantification index system (
Table 1).
The flood risk indicators were derived from multiple sources as follows: annual rainfall from the China Meteorological Administration [
23], elevation from NASA’s NASADEM dataset [
24], NDVI from MODIS vegetation products [
25], and population density from the LandScan Global Dataset [
26]. Node degree was calculated based on the constructed bus–metro network.
The quantification method is as follows: First, data normalization is performed. The data are normalized in a positive direction, shown in Equation (1), expressed as follows:
where
is the data to be processed,
is the minimum value in the data,
is the maximum value in the data, and
is the data after positive normalization.
The inverse normalization of the data is performed as shown in Equation (2) expressed as follows:
where
is the data to be processed,
is the minimum value in the data,
is the maximum value in the data, and
is the data after inverse normalization.
To quantify flood risk at the node level, this study adopts the entropy weight method due to its objectivity and data-driven nature. The entropy method assigns indicator weights based on the degree of data dispersion, which reduces the influence of subjective bias and ensures consistency when comparing nodes across large-scale urban networks. Compared with multi-criteria decision-making approaches such as AHP or fuzzy weighting, the entropy method offers greater transparency and computational efficiency, especially when the indicator system is grounded in well-defined quantitative data.
Given that disaster-related indicators such as exceptionally high rainfall and unusually dense population may result in extreme values that distort entropy-based weighting, a data preprocessing step was implemented to reduce the impact of outliers. Before normalization, all indicators were examined using the Z-score method [
27]. Values with Z-scores exceeding 3 were identified as potential outliers and were replaced with either the maximum or minimum valid value within the acceptable data range, depending on the direction of deviation. This preprocessing ensures that the entropy weighting method captures overall risk trends without being unduly influenced by a small number of extreme observations.
Next, the entropy method is used to calculate the flood risk index. The weight
of the j-th indicator for the i-th node is computed as shown in Equation (3), expressed as follows:
where
is the standardized value of the j-th indicator for node
i.
The entropy value for the j-th indicator is calculated as shown in Equation (4), expressed as follows:
where
m is the total number of nodes in the urban bus–metro hybrid network.
The weight
of the j-th indicator is calculated as shown in Equation (5), expressed as follows:
The flood risk index
for the i-th node is calculated as shown in Equation (6), expressed as follows:
This method assesses the vulnerability and disaster risk of urban transportation systems during flood events by calculating the flood risk index for each node. The resulting quantification supports urban planners and emergency management agencies in identifying potential impacts of flood disasters, while also informing the development of targeted response strategies and early warning measures.
2.2. Construction of Urban Bus–Metro Composite Transportation Network Model
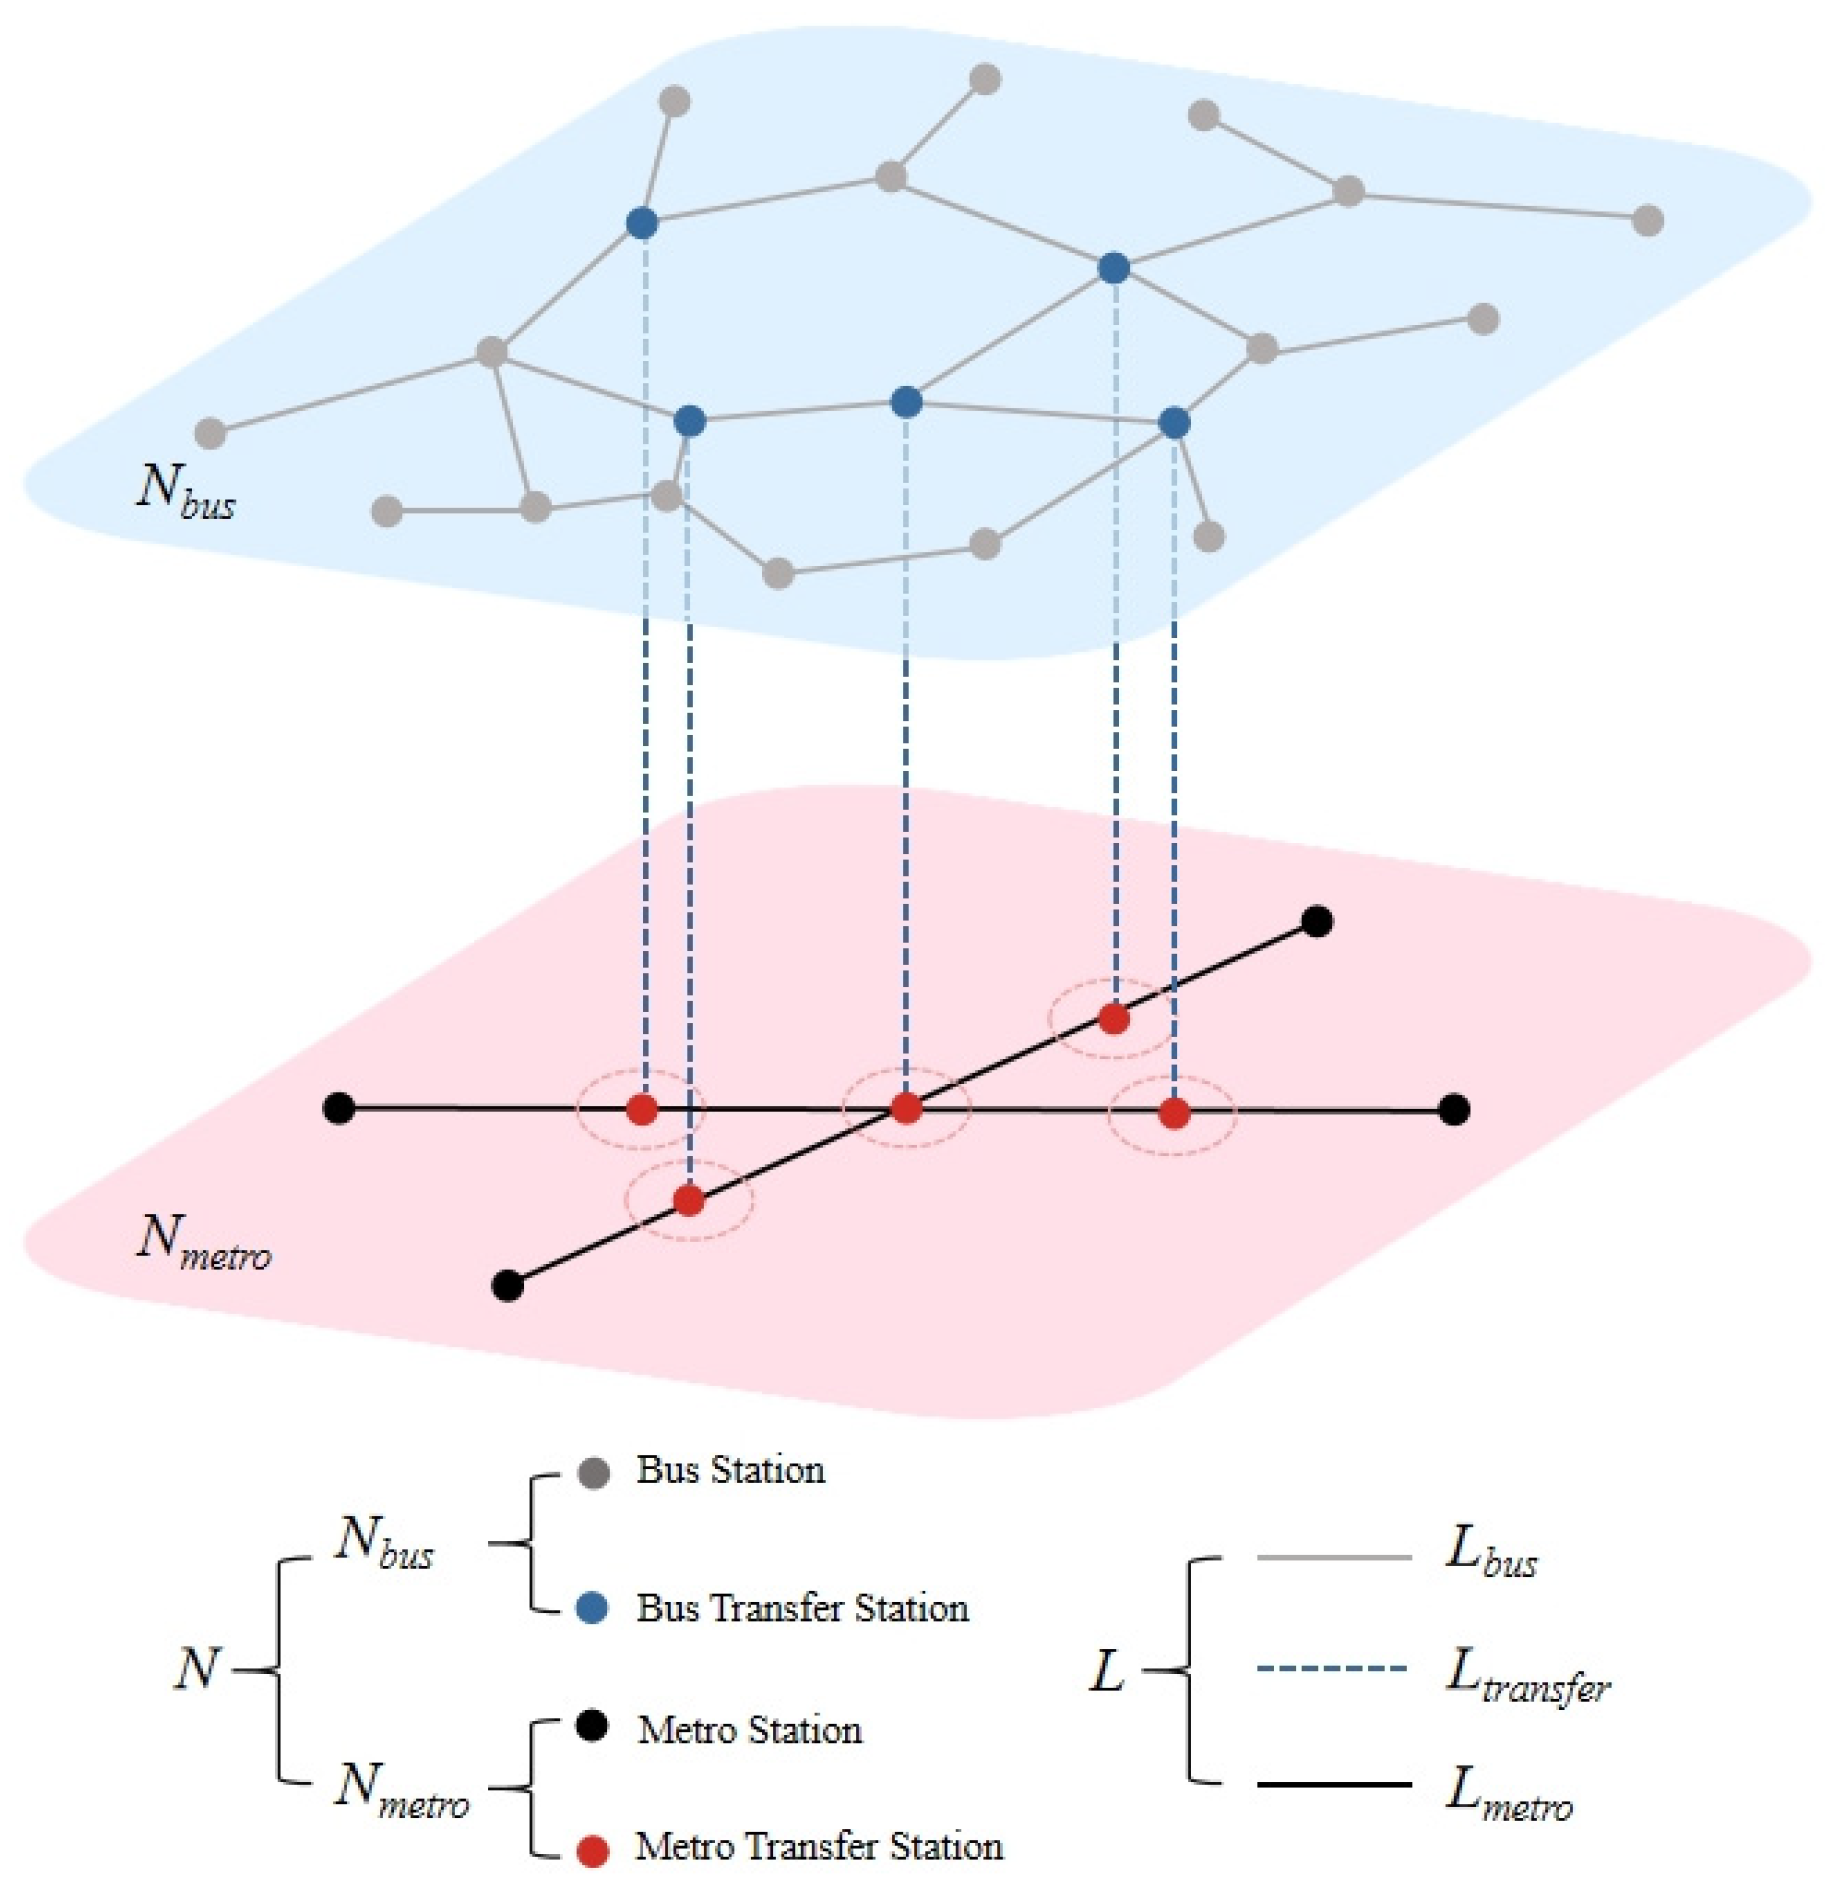
Based on the Space L modeling method, an urban bus–metro composite transportation network is constructed by abstracting bus stops and metro stations as nodes in the network and bus routes and metro lines as edges in the network. If a bus stop is within a 500 m radius of a metro station, a transfer link is established between these stops to achieve network coupling. Given that the differences between the up and down directions of metro lines and bus routes are insignificant, an undirected urban bus–metro composite transportation network model is constructed (
Figure 1).
2.3. Cascading Failure Model for Urban Bus–Metro Hybrid Networks
The cascading failure phenomenon is characterized from the following three aspects: initial node load, node capacity, and load redistribution strategy [
28]. Initially, each node in the network is assigned specific load and capacity values. The load represents the amount of tasks a node handles during transportation, reflecting its operational burden within the network system; capacity represents the maximum load a node can handle, indicating its upper limit of tolerance. When the network system is subjected to external environmental attacks, some nodes may fail or become overloaded, preventing them from maintaining normal operation. Once these critical components fail, their originally assigned load must be redistributed according to specific strategies among other nodes in the network. If these receiving nodes have their load levels exceed their capacity limits, they may also fail due to overload. This newly occurring failure will trigger another round of load redistribution, potentially leading to additional node failures. Based on the above, and considering the scenario of subway disruptions due to flood disasters with traffic shifting to the bus system, a cascading failure model for the urban bus–metro hybrid network under flood disaster conditions is established, as shown in the following equation.
The initial load is represented by Equation (7), expressed as follows:
where
ρ and
τ are parameters representing the initial load intensity for node
i.
The node capacity is represented by Equation (8), expressed as follows:
where
is the capacity of node
i,
denotes the initial load of node
i, and
α and
β are the two load capacity sensitivity parameters. More specifically,
β controls the linear redundancy level applied uniformly across all nodes, while
α adjusts the non-linear reinforcement intensity, enabling additional protection for high-load or critical nodes.
The load redistribution method by Equations (9)–(11), expressed as follows:
where
is the initial load of node
i,
denotes the load of node i after load redistribution,
is the load transferred to node
i from a failed node,
is the load redistribution coefficient,
is the degree of node i in the initial network, and
is the set of neighboring bus nodes of the failed node
j.
γ is the load redistribution adjustment parameter.
In this model, once metro nodes are disrupted due to flooding, passenger flow is assumed to be transferred only to nearby bus nodes. Given the complexity of passenger redistribution under emergency conditions, the interaction between displaced riders and bus routes is critical [
29]. This assumption reflects real-world emergency conditions, where metro systems often suspend operations during severe flood events due to safety risks, rendering intra-metro transfers infeasible. As a result, the surface bus network becomes the primary mode for absorbing displaced demand. This modeling choice is consistent with actual situations such as the 2021 Zhengzhou flood, during which metro services were fully suspended due to extreme weather conditions.
The inter-network node failure transmission method is represented by Equation (12), expressed as follows:
2.4. Resilience Evaluation Method for Urban Bus–Metro Hybrid Networks
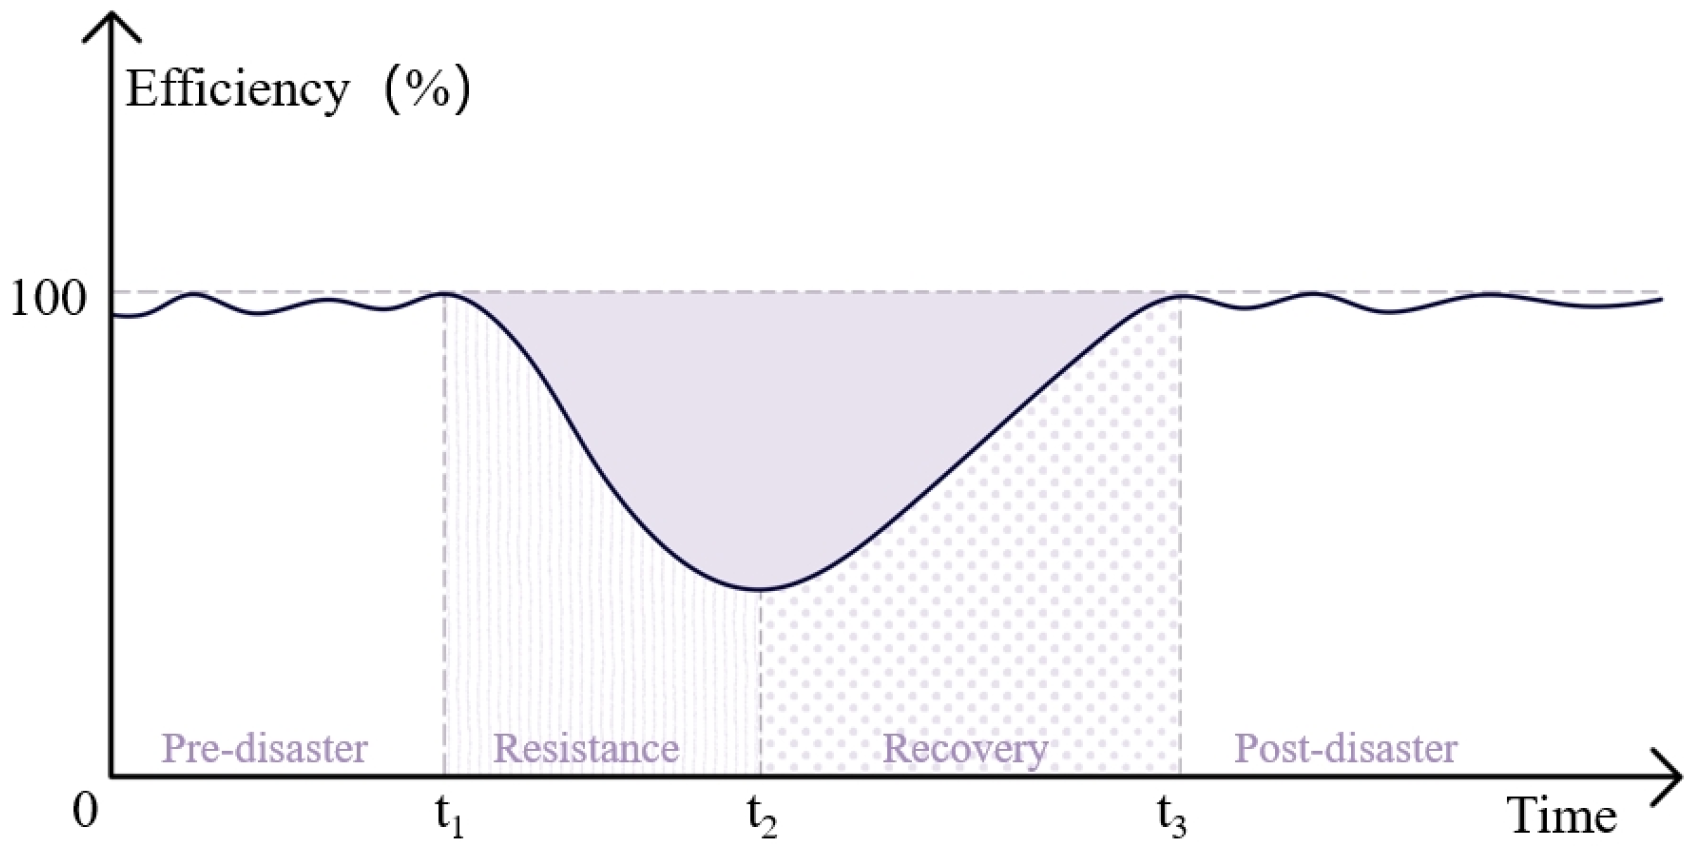
This study proposes a resilience evaluation method for urban bus–metro hybrid networks under flood disasters, based on the system performance curve [
30]. Resilience is quantified as the ratio of the area enclosed by the system performance curve under flood conditions and the coordinate axes to the area enclosed by the system performance curve under normal conditions and the coordinate axes (
Figure 2).
This approach is used to analyze the resilience performance of the transportation network during flood disasters as shown in Equation (13).
where
R represents system resilience, t
0 is the time when the system enters the resilience phase, t is the time when the system reaches the post-disaster stabilization phase,
denotes the area enclosed by the system performance curve under flood conditions and the coordinate axes, and
represents the area enclosed by the system performance curve under normal conditions and the coordinate axes. The resilience loss of the urban bus–metro hybrid network under flood disaster is defined as
, which corresponds to the area of the colored region in the figure, representing the reduction in system efficiency during the flood disaster
The relative size of the giant connected component and global efficiency are selected as the resilience metrics for the urban bus–metro hybrid network.
(1) Relative Size of the Giant Connected Component
The relative size of the giant connected component in a network is defined as the ratio of the size of the largest connected component to the total number of nodes remaining after deleting a certain proportion of nodes from the initial network [
31,
32], as shown in Equation (14).
where
G is the relative size of the largest connected component,
denotes the number of nodes in the largest connected sub-network after disruption, and
N is the total number of nodes in the original network before the disaster. The relative size of the largest connected component reflects the overall connectivity of the network. After a flood disaster, this connectivity is often severely impacted, with node and link failures potentially fragmenting the network into multiple isolated sub-networks. This metric evaluates resilience by measuring the maximum number of interconnected nodes, thereby capturing the network’s ability to remain connected under disaster conditions.
Accordingly, the topological resilience is defined as , and the topological resilience loss is defined as .
(2) Global Efficiency
Global efficiency is a metric that measures the overall ability of a network to perform efficiently, particularly in terms of its transport functions [
33,
34]. In this context,
,
represents the efficiency between nodes, and
represents the distance between nodes. Higher global efficiency indicates faster and more effective information dissemination within the network. In transportation networks, higher global efficiency implies better transportation efficiency. Conversely, lower global efficiency signifies more challenging information propagation, which in turn means reduced transportation efficiency in the network, as shown in Equation (15).
Global efficiency reflects the transportation service efficiency of the network. After a flood disaster, the transportation service efficiency of the network often declines to varying degrees, affecting residents’ mobility and the transportation of goods. Global efficiency quantifies resilience by calculating the sum of the reciprocals of the shortest paths between all pairs of nodes in the network, thereby assessing the network’s performance in terms of transportation efficiency.
Based on this, the functional resilience is defined as , and the functional resilience loss is defined as .
Together, these two component metrics form the basis for the integrated resilience assessment of the network under flood disaster conditions. The integration of the two metrics for resilience assessment is formulated in Equation (16).
The resilience loss of the urban bus–metro hybrid network under flood disaster is defined as .
2.5. Recovery Strategy Application for Urban Bus–Metro Hybrid Networks
The effectiveness of recovery strategies has been found to vary with network structure and disruption type. Shao et al. [
35] found that in the Qingdao metro network, betweenness-based recovery was most effective under random and degree-based attacks, while degree-based strategies performed better under closeness- and betweenness-targeted attacks. Chen et al. [
36] showed that in a multi-modal intercity transit network, degree centrality was more effective for structural recovery, whereas betweenness centrality favored functional performance. Sun et al. [
37] found that in a multimodal network subject to cascading failures, betweenness-based recovery outperformed both degree-based and random strategies. Based on these studies, this work applies three commonly used strategies, namely random recovery, degree-based recovery, and betweenness-based recovery, to a flood-induced failure scenario in a bus–metro hybrid network to evaluate their relative performance.
(1) In the random recovery strategy, failed nodes are restored in an arbitrary order, serving as a baseline for comparison.
(2) The degree-based recovery strategy gives priority to nodes with higher degrees, under the assumption that highly connected nodes play a crucial role in maintaining local connectivity.
The degree
ki of node
i is defined in Equation (17) as the number of its directly connected neighbors as follows:
where
is the adjacency matrix element indicating whether nodes
i and
j are connected.
(3) The betweenness-based recovery strategy prioritizes nodes with higher betweenness centrality, which reflects the extent to which a node serves as a bridge in the shortest paths between other node pairs.
The betweenness centrality
BCi of node
i is calculated in Equation (18) as follows:
where
is the total number of shortest paths from node s to node t, and
is the number of those paths that pass through node i.
These three strategies represent typical and widely used recovery methods and will be used for comparative analysis in the following sections.
2.6. Case Study
A case study was conducted using the public transportation system of Zhengzhou, Henan Province, China, as an example. By establishing a bus–metro hybrid network model for Zhengzhou and integrating the previously proposed flood risk simulation, cascading failure model, and resilience evaluation methods, this study analyzed the resilience performance of Zhengzhou’s bus–metro hybrid network under flood disasters. The findings aimed to provide scientific evidence for the planning, design, and operation of urban public transportation systems. As of February 2024, the urban public transportation network of Zhengzhou, located in Henan Province, China, consists of a total of 10 operational metro lines encompassing 248 metro stations. In addition, the city maintains an extensive bus transit system comprising 474 routes and 4650 bus stations. The network characteristics were analyzed (
Table 2).
From the table, it is evident that the network’s average node degree is 3.3942, indicating that each node was connected to approximately three other nodes on average. This suggests a moderate level of connectivity, with neither high density nor high sparsity. The clustering coefficient is 0.0851, reflecting a low probability of nodes forming small clusters within the network. This indicates weak local connectivity, with relatively few direct connections between nodes. These structural indicators describe the fundamental topological characteristics of the network, which may influence its resilience but do not directly determine it. The relative size of the giant connected component is 0.9542, signifying that the transportation network is highly connected, with most nodes reachable from one another and only a minor fraction being isolated or forming smaller independent subgraphs. The average shortest path length is 9.2731, indicating that the network is large in scale, with relatively long distances between nodes, often requiring traversal through several intermediate nodes to reach a destination. The global efficiency is 0.1138, demonstrating a relatively low overall transmission efficiency within the network.
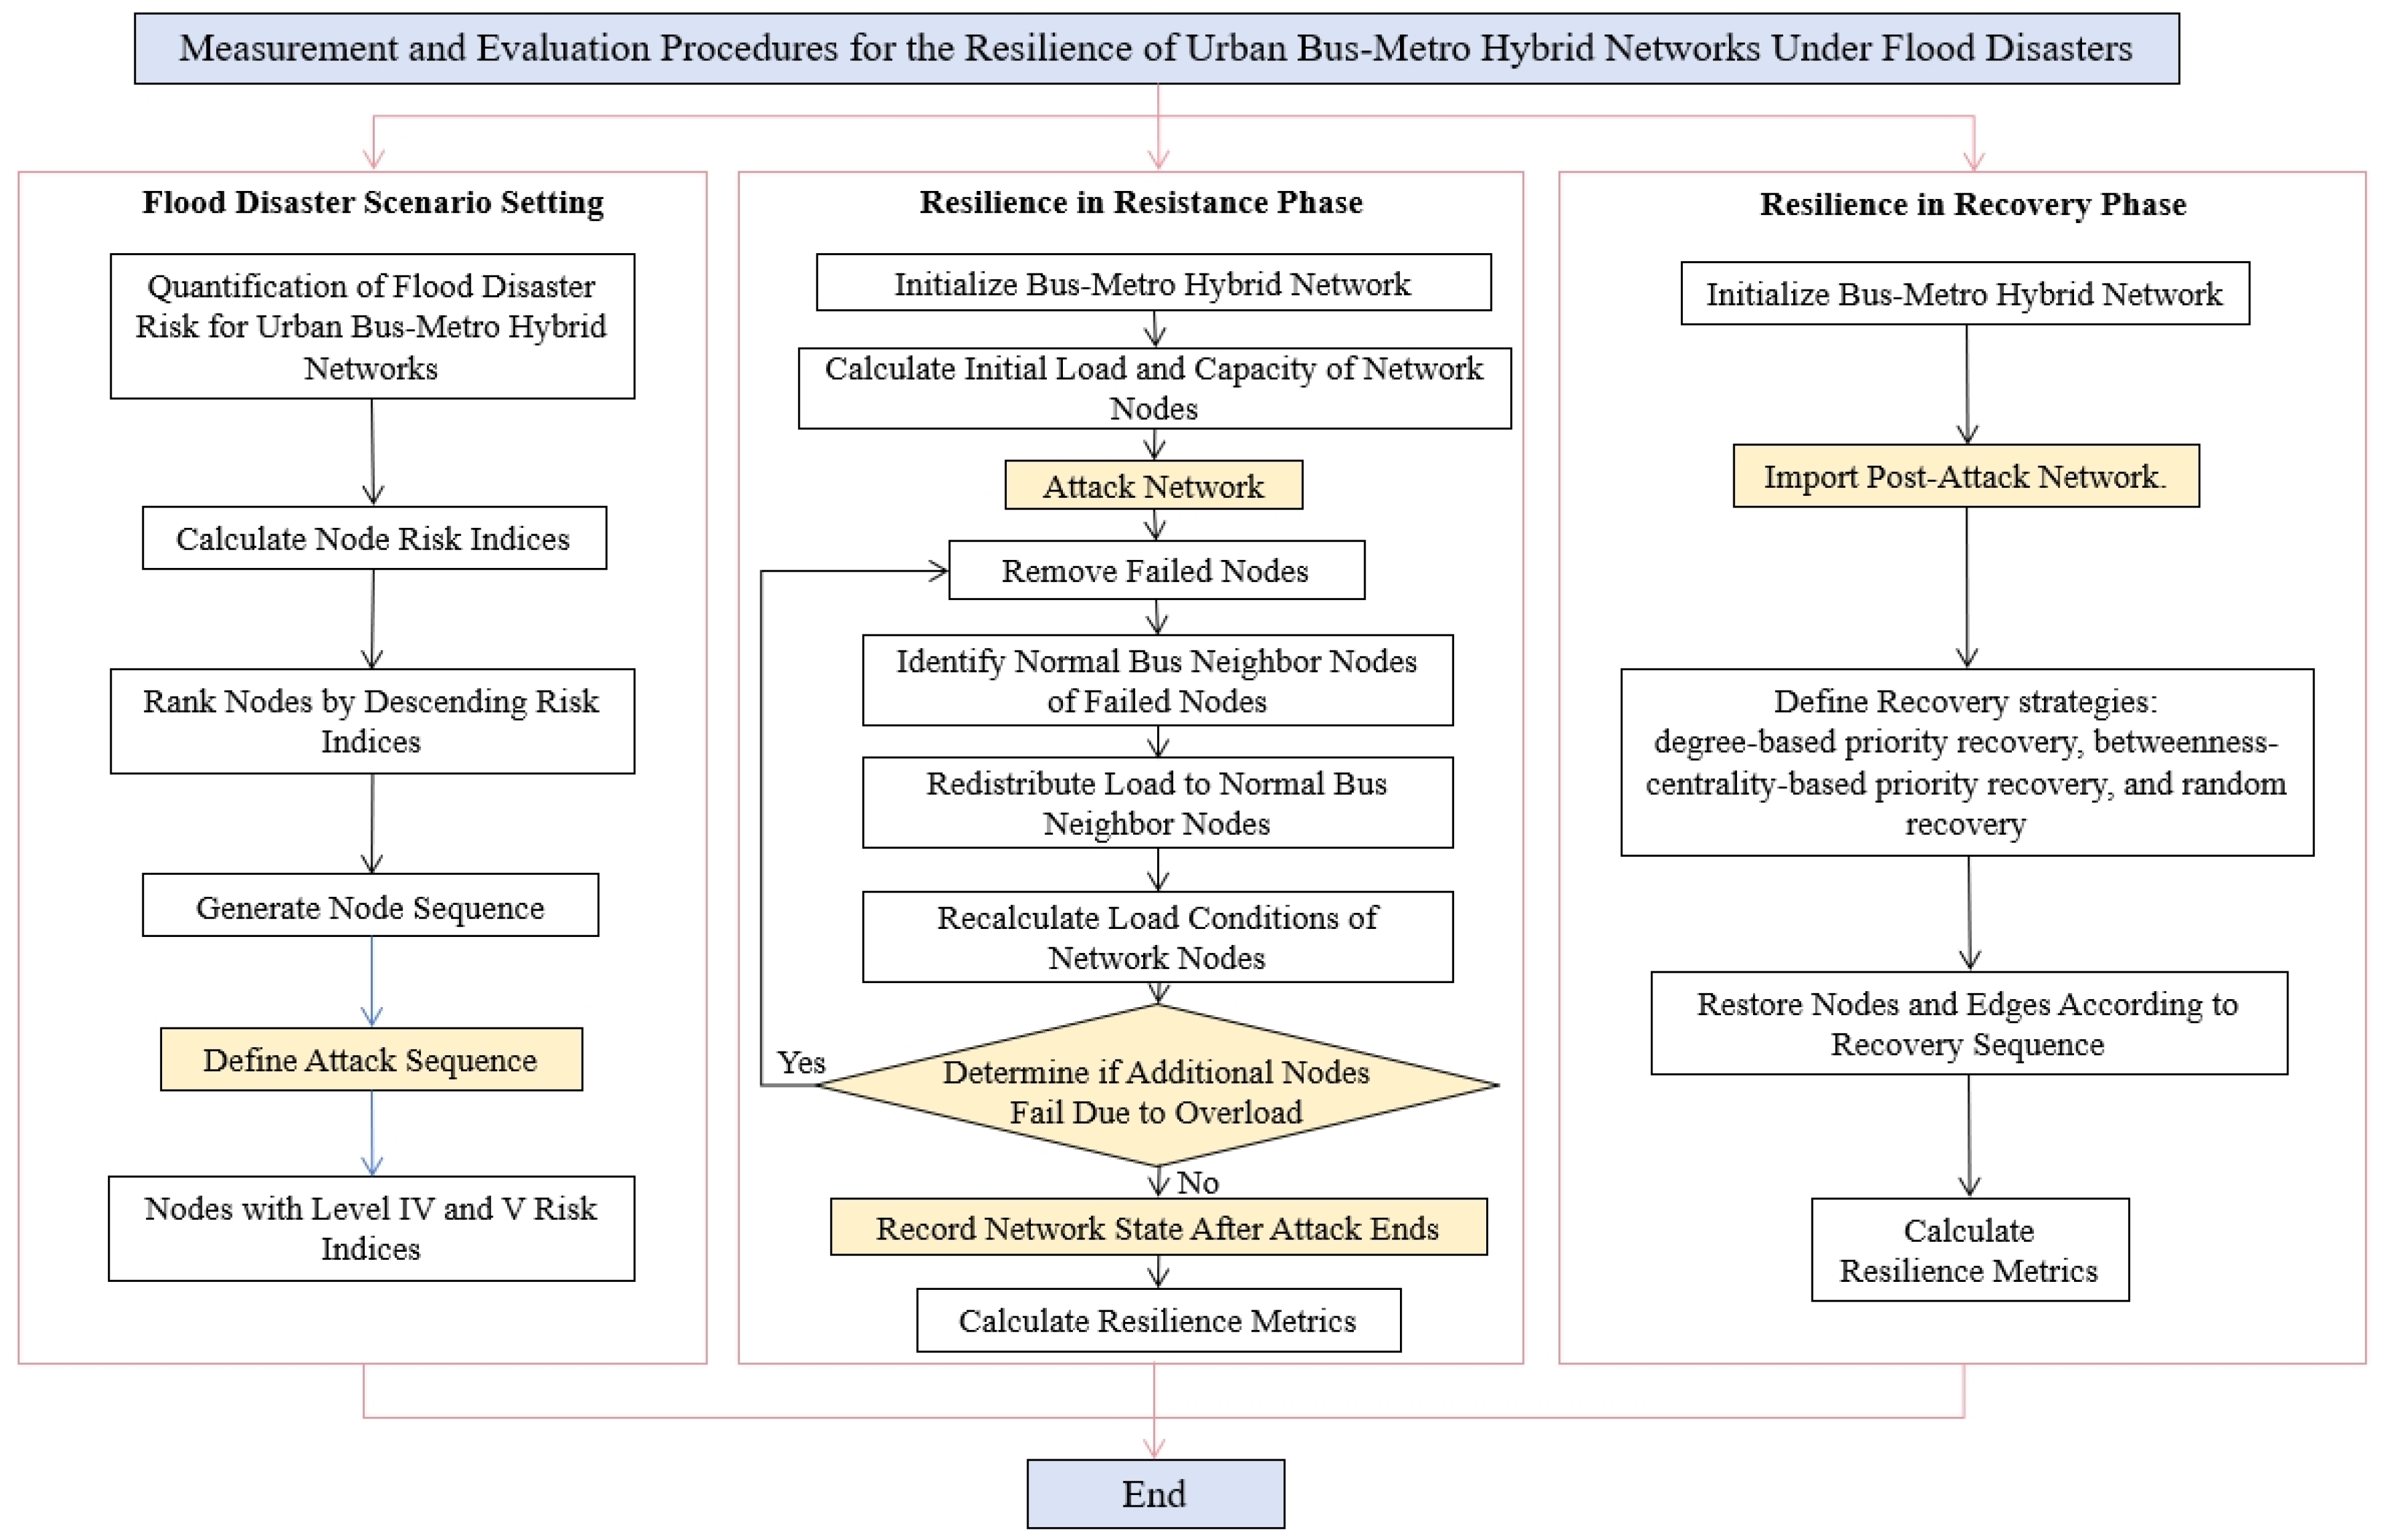
In accordance with the research methodology described earlier (
Figure 3), the analysis was conducted based on the bus–metro hybrid network in Zhengzhou, China.
The flood risk index for each node was computed and categorized, and the results were statistically analyzed (
Table 3).
Based on the flood risk index statistics for nodes in Zhengzhou’s bus–metro hybrid network, nodes classified as Levels V and IV were sequentially removed from the network to simulate the impact of flood disasters on the network in Zhengzhou, China.
3. Results
3.1. Resilience Analysis During the Resistance Phase
During the resistance phase, the bus–metro hybrid network in Zhengzhou, China, was affected not only by the direct impacts of flood disasters but also by indirect damage caused by cascading failures due to passenger flow transfers, which pushed certain stations beyond their rated capacities. In practical scenarios, the capacity of nodes within the transportation network was inherently limited. By analyzing the effects of varying load capacity parameters on the network’s resilience during the resistance phase, optimal load capacity configurations were identified, facilitating the development of more effective disaster response strategies and resilience enhancement measures.
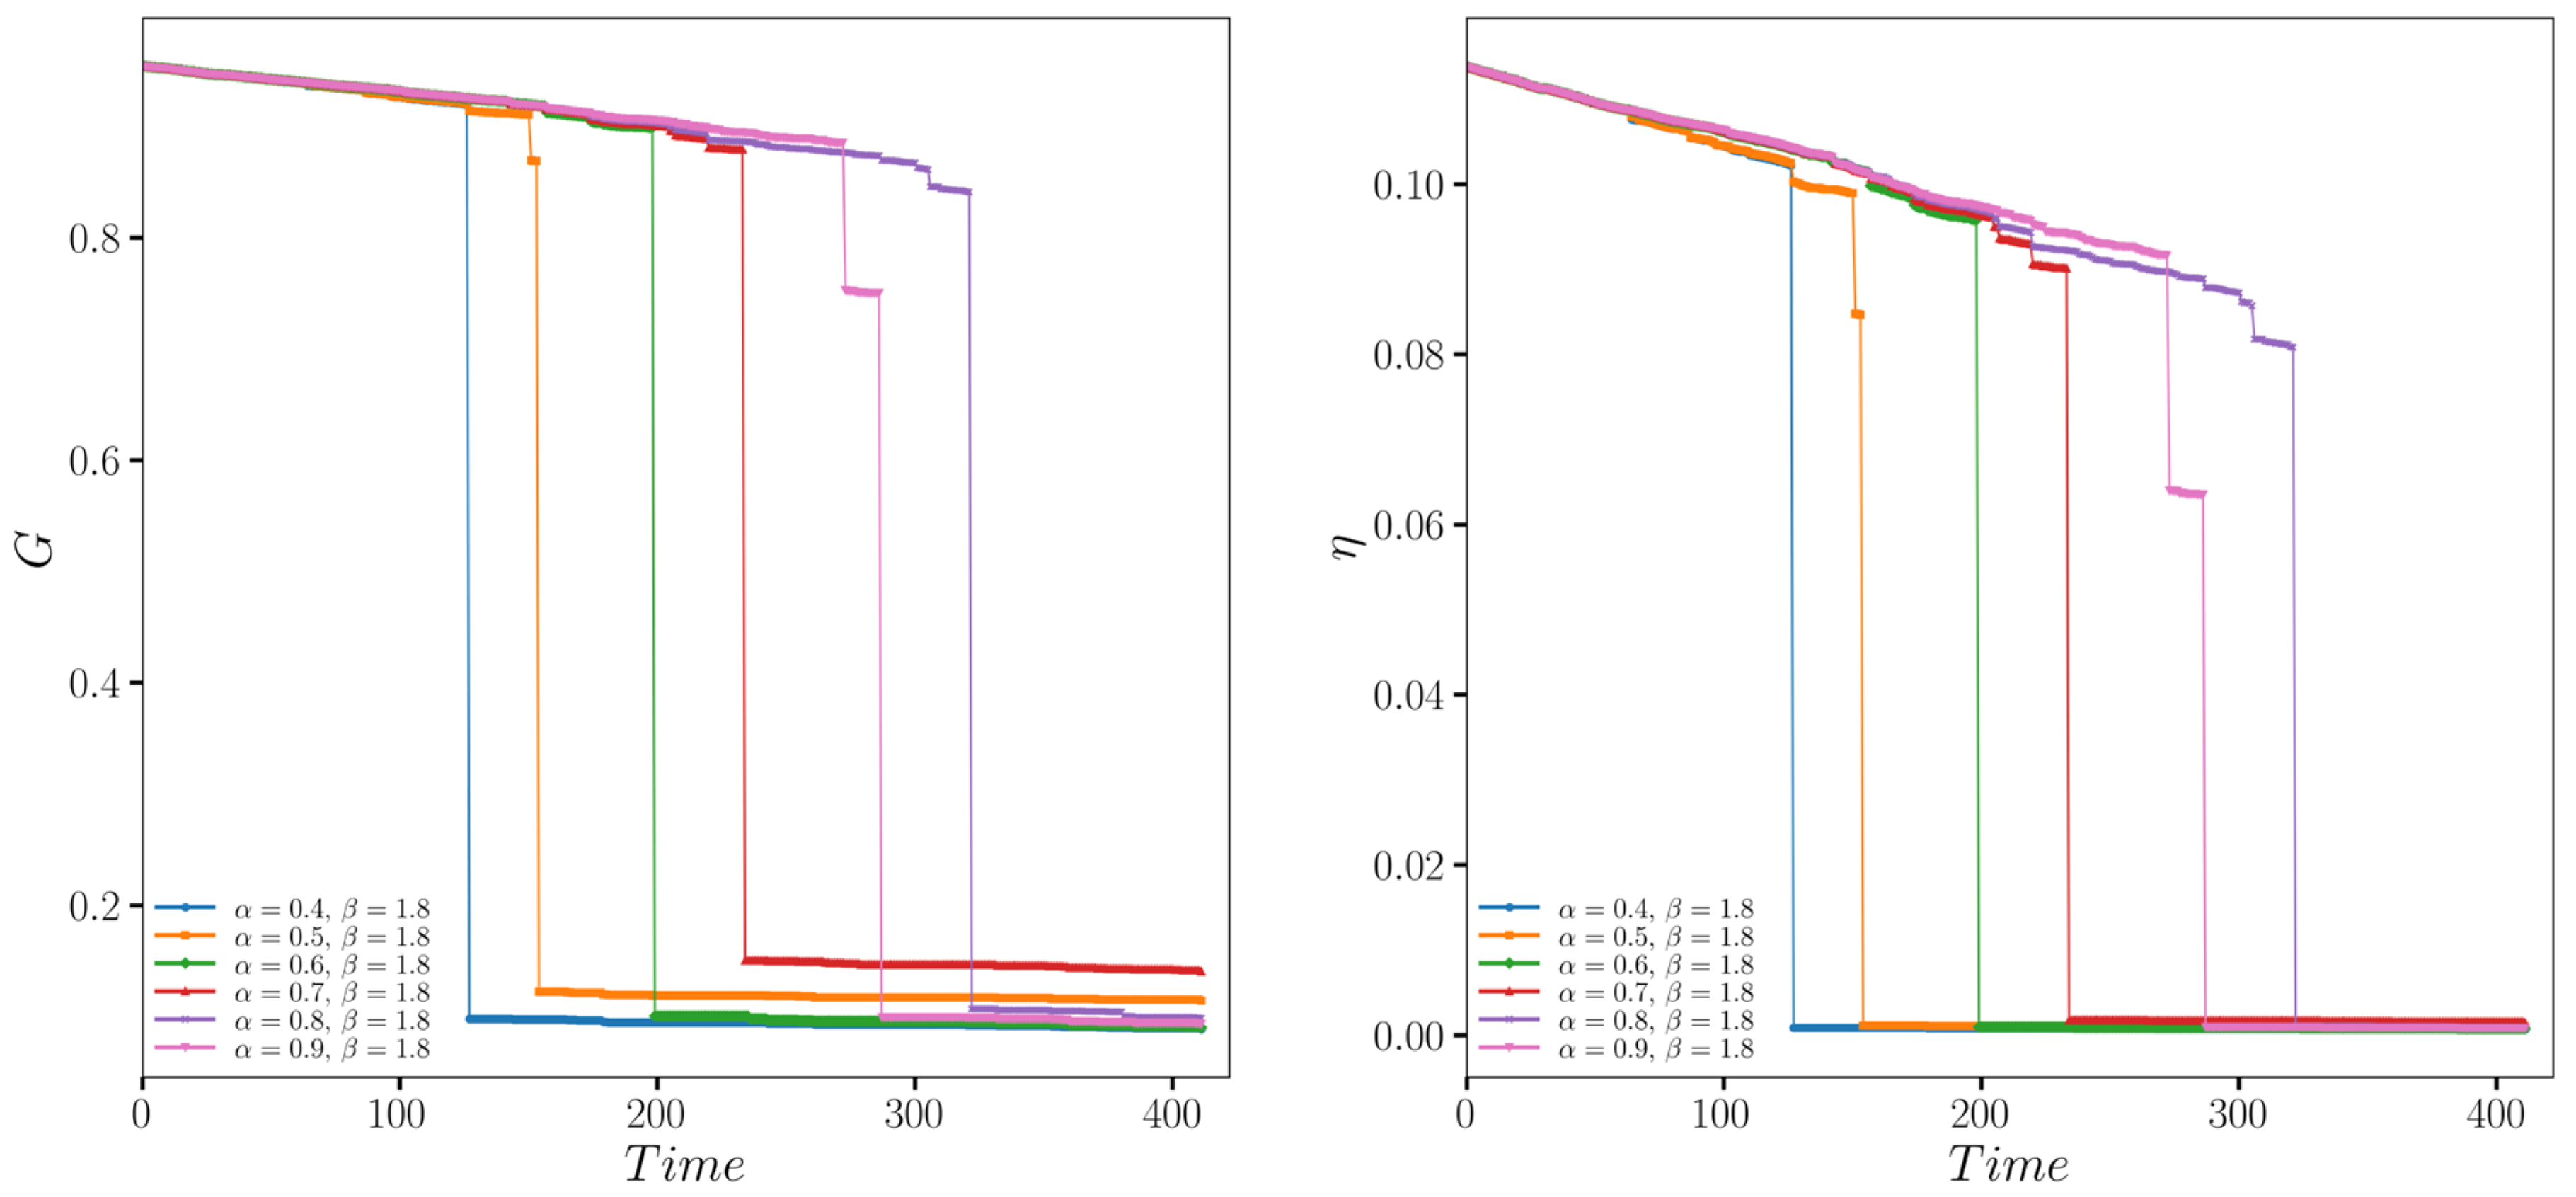
Initially, with the load capacity parameter
β set to 1.8, the influence of different values of the load capacity parameter
α on the resilience of the bus–metro hybrid network in Zhengzhou was examined (
Figure 4).
In the simulation, time is represented by discrete steps, with each step corresponding to the sequential removal of one node based on the predefined flood risk levels. This process captures the cumulative effects of node failures and their impact on network resilience over the disruption timeline.
Initially, with the linear load capacity parameter
β set to 1.8, the influence of varying the non-linear parameter
α on the resilience of Zhengzhou’s bus–metro hybrid network was analyzed (
Figure 4). As defined in Equation (8),
β controls the linear amplification of node capacity relative to its initial load, while
α adjusts the degree of non-linear scaling. These two parameters reflect different infrastructure redundancy configurations in practice, with further implications discussed in
Section 4.1.
From the figure, it becomes evident that both the size of the giant connected component and the global efficiency of the bus–metro hybrid network in Zhengzhou, China, initially declined gradually over time. This decline was subsequently followed by a sudden drop at a critical point, leading to a rapid collapse to a lower level. This pattern suggested that during flooding, the network’s connectivity deteriorates progressively and then abruptly loses a significant portion of its connections at a critical threshold, resulting in a swift collapse. Similarly, the network’s transportation efficiency decreased gradually, with a substantial loss in transport effectiveness occurring at a specific critical point, ultimately leading to overall network paralysis. The load capacity parameter
α significantly influenced both the location of this critical point and the rate of decline. By adjusting parameter
α, both the structural and functional resilience of the network could be enhanced, thereby improving the system’s disaster resistance capability during the resistance phase. Further conclusions were drawn from the statistical results of the resilience values during the resistance phase of the bus–metro hybrid network in Zhengzhou, China (
Table 4).
An analysis of the preceding tables indicates that network resilience was at its optimal level when α = 0.8. Adjusting the α value either above or below this point tended to reduce network resilience.
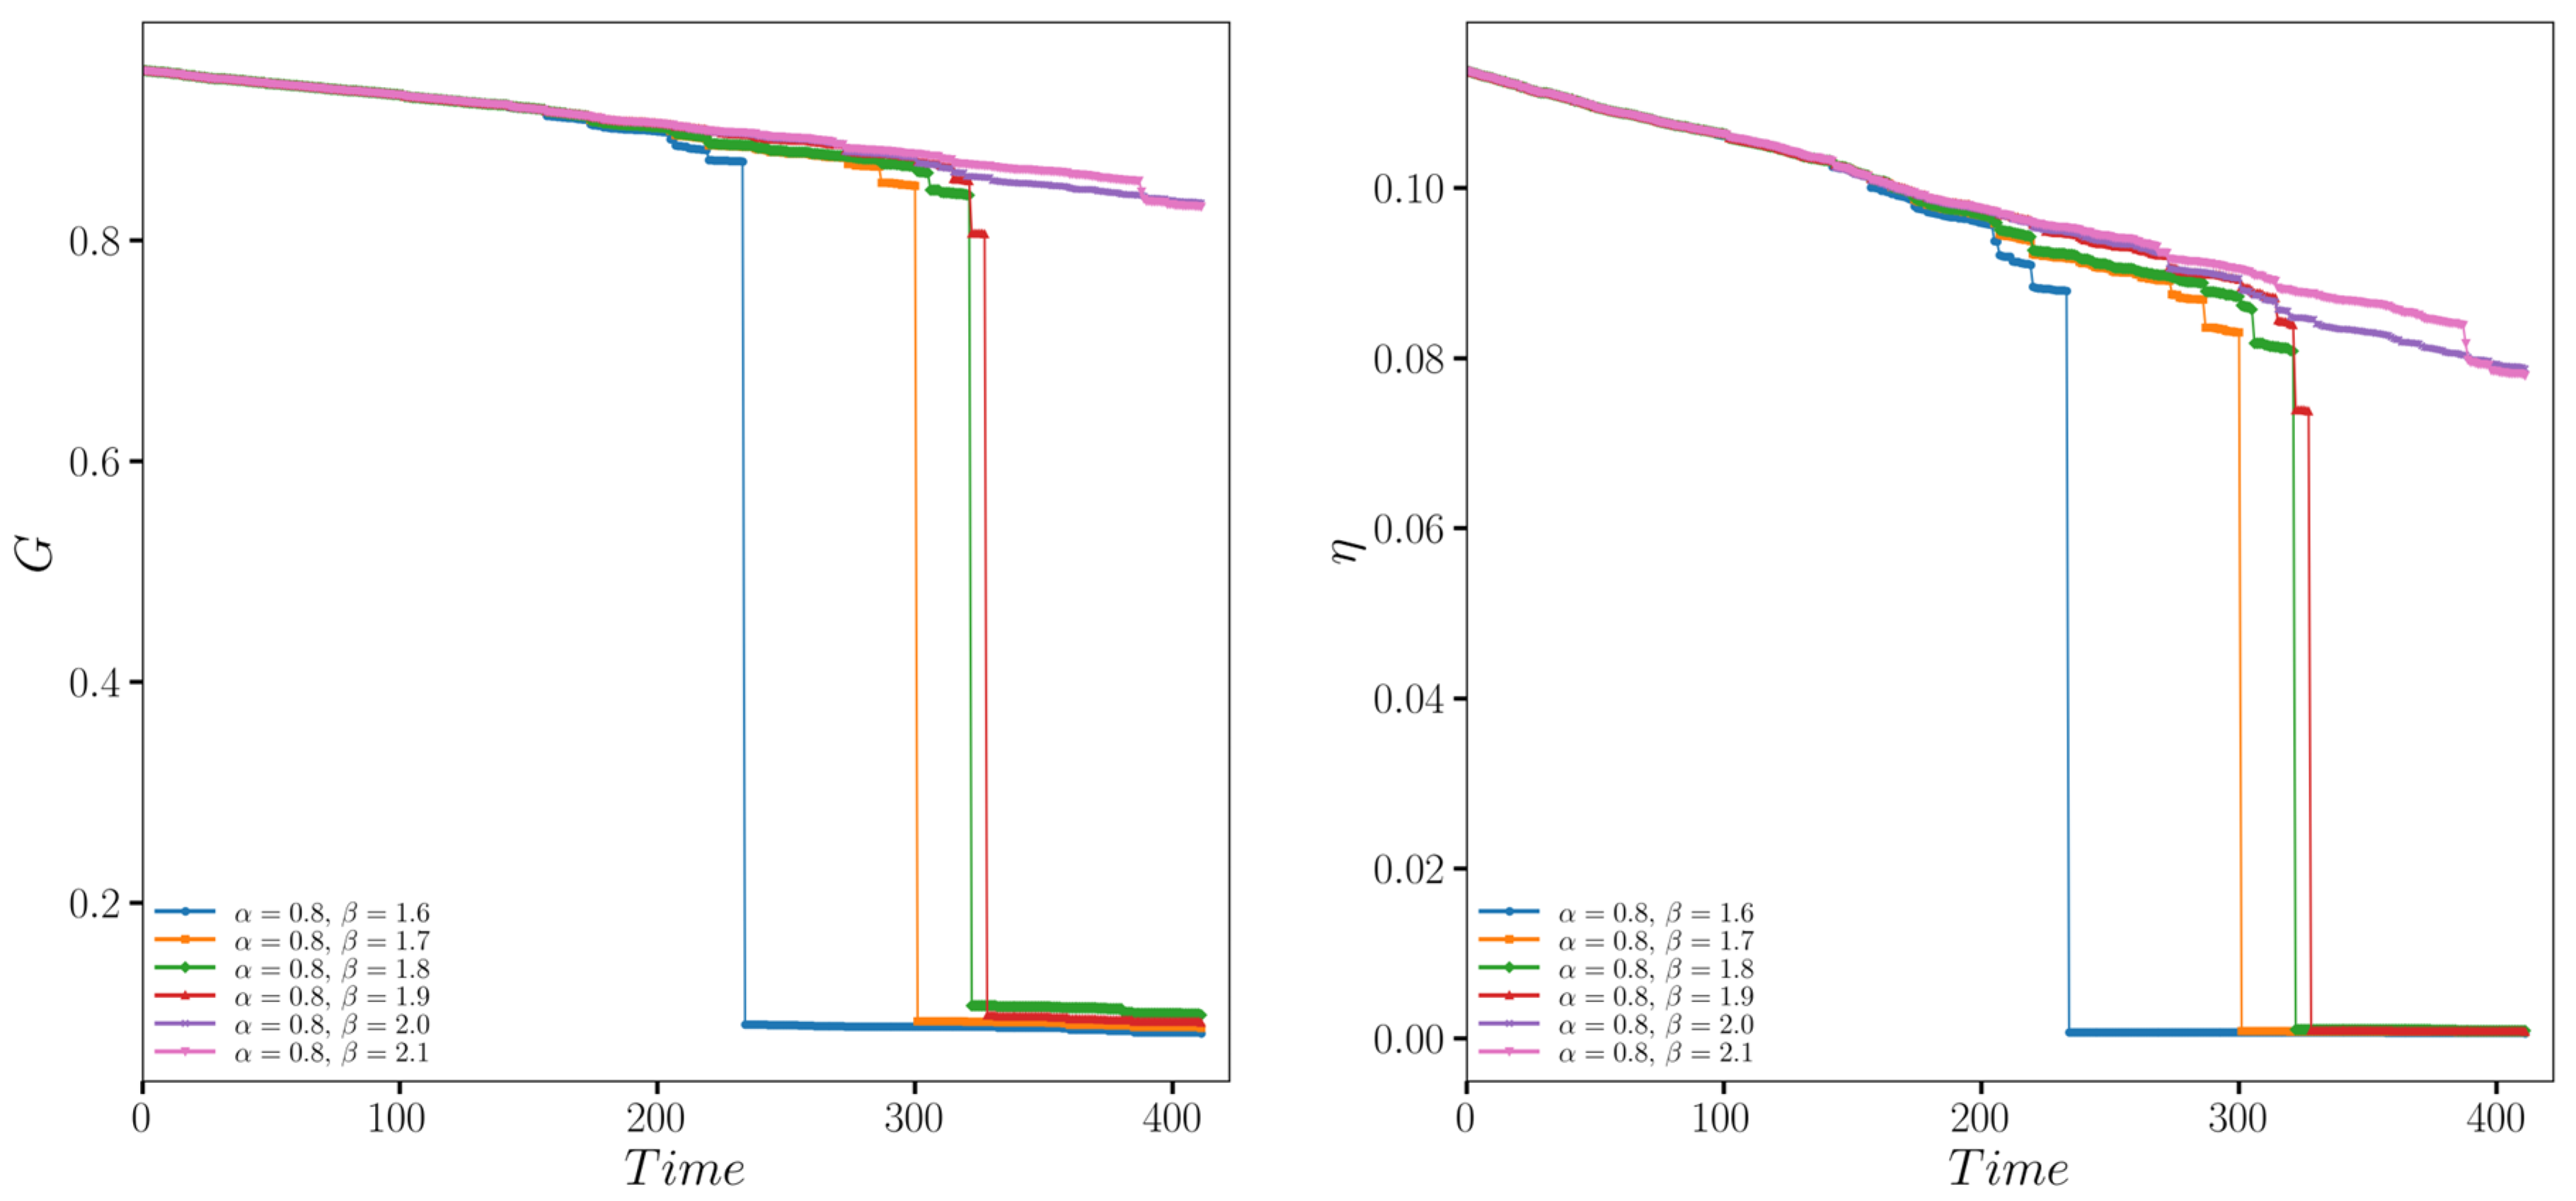
Subsequently, the load capacity parameter
α was fixed at 0.8 to determine the optimal value of the load capacity parameter
β. The effect of parameter
β on the resilience of the bus–metro hybrid network in Zhengzhou, China, was analyzed (
Figure 5).
As illustrated in the figure, when the
β value was less than 2.0, both the size of the giant connected component and the global efficiency of Zhengzhou’s bus–metro hybrid network in Henan Province gradually declined over time, followed by a sudden collapse to a lower level at a specific point. Conversely, when the
β value was 2.0 or greater, the network resilience decreased gradually without any abrupt transitions. This behavior indicated that the load capacity parameter
β significantly influenced both the timing and rate of resilience decline. By optimizing the load capacity parameter configuration, it was possible to mitigate sudden drops in resilience and prevent network collapse, thereby enhancing resilience during the system’s resistance phase. Further conclusions were drawn from the statistical analysis of the specific resilience values during this phase (
Table 5).
From the data presented in the tables, it was concluded that when β = 2.0, both the size of the giant connected component and the global efficiency of the network were optimized. Increasing β to 2.1 yielded minimal additional improvement in network resilience. Therefore, considering cost-effectiveness, α = 0.8 and β = 2.0 represented the relatively optimal capacity parameters for this network.
3.2. Resilience Analysis During the Recovery Phase
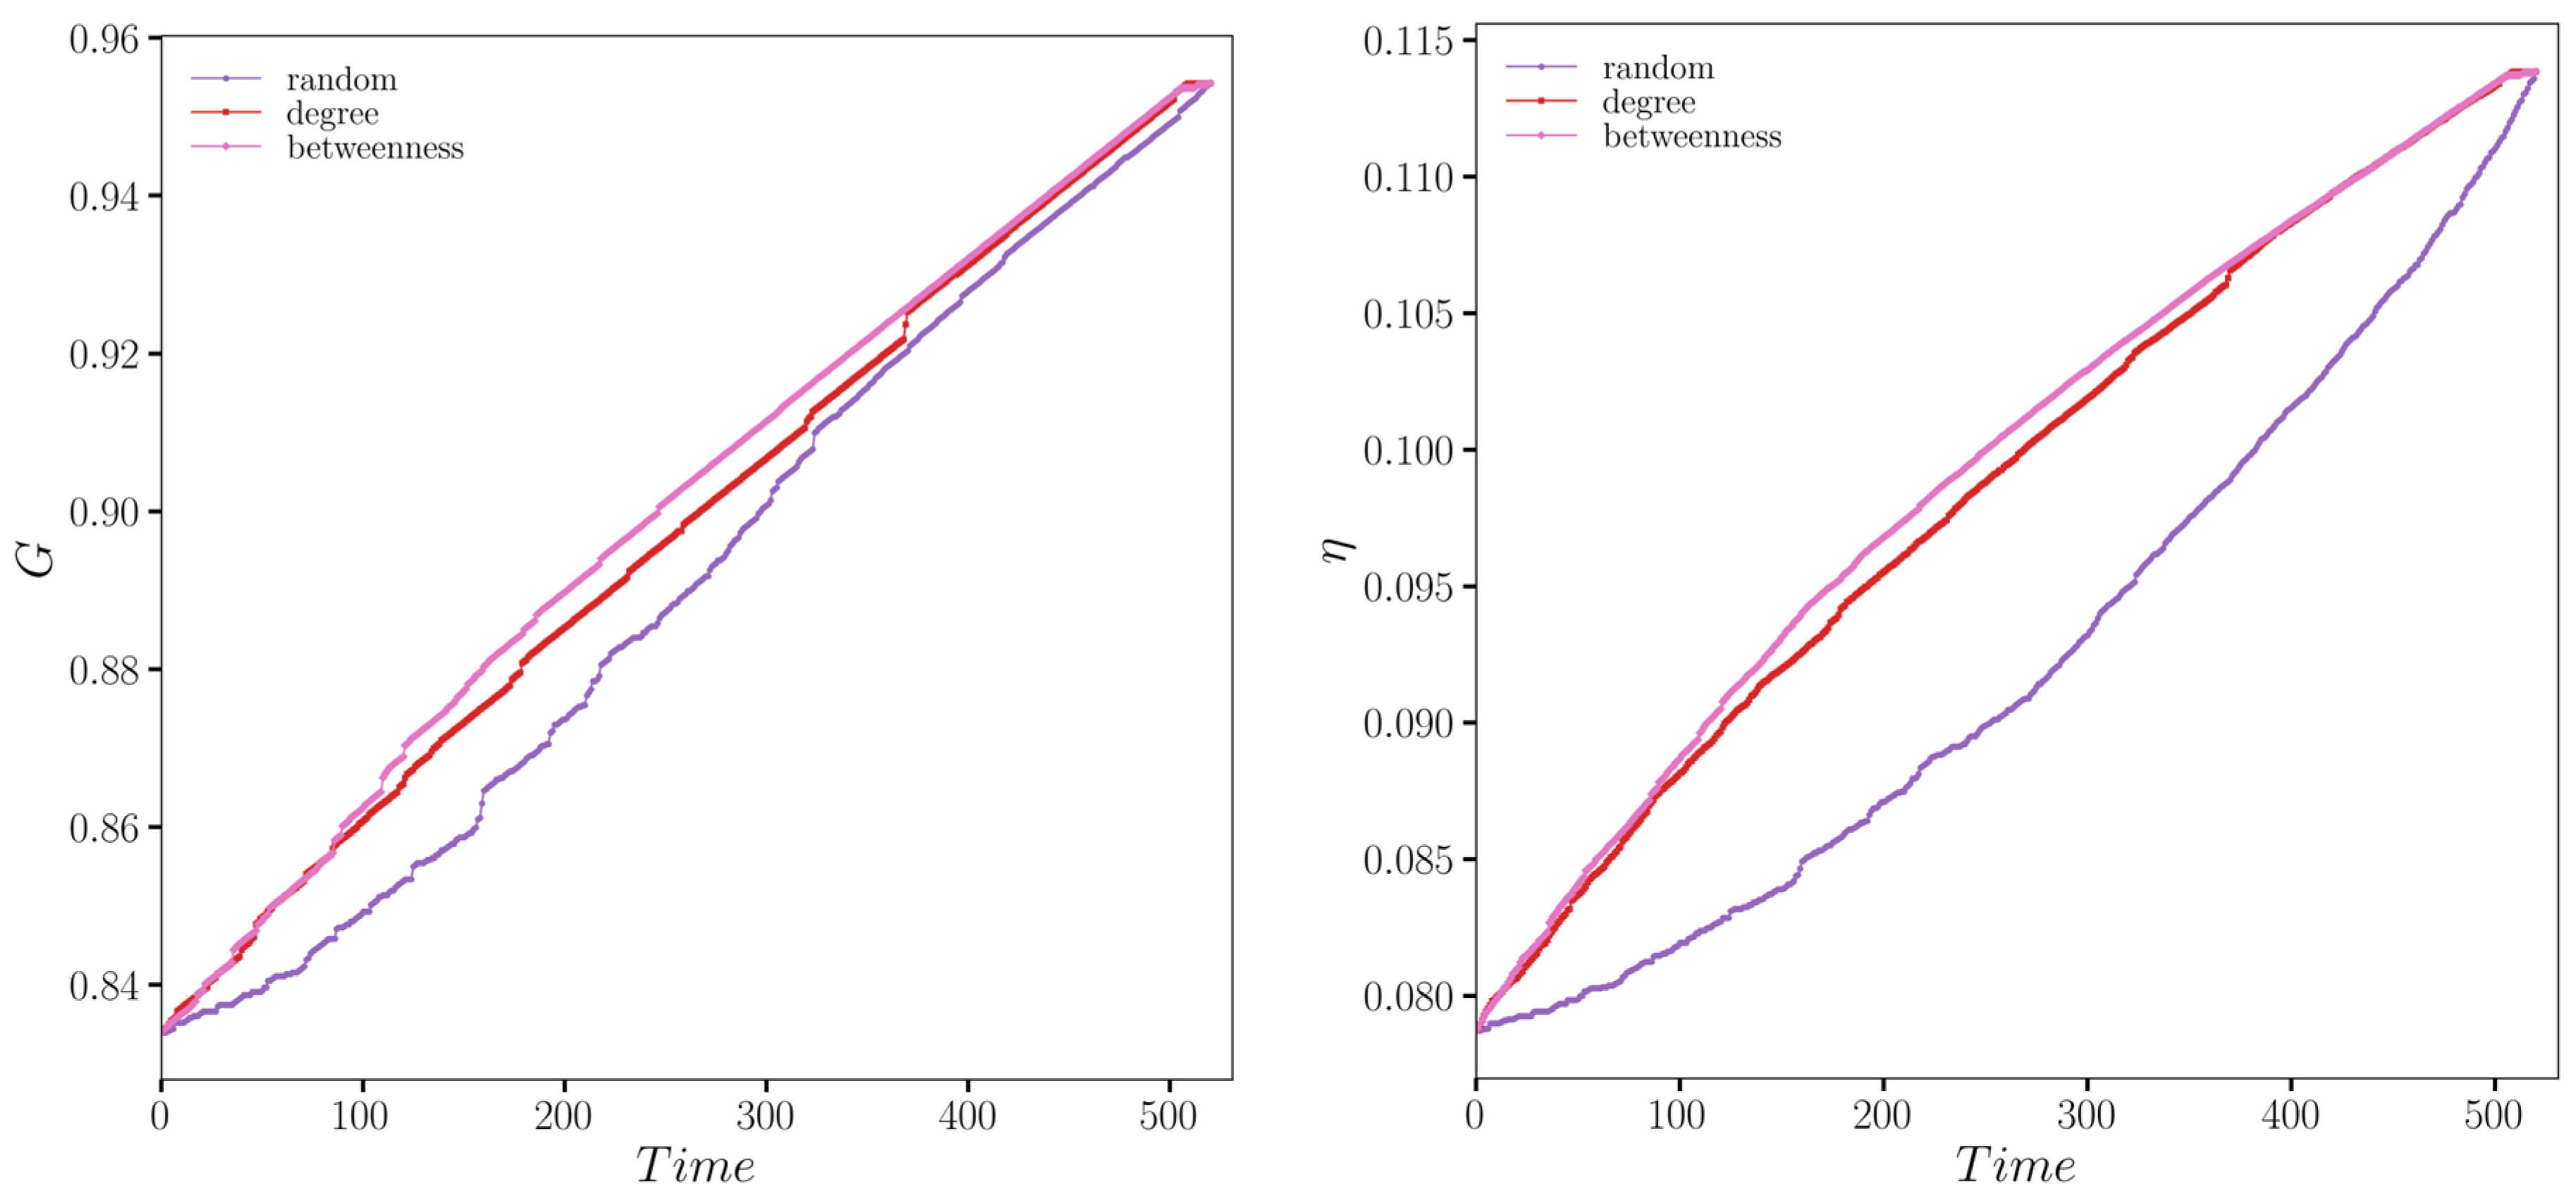
This study focused on rapidly restoring network connectivity and transportation service levels as the primary repair objectives. Under the conditions of
α = 0.8 and
β = 2.0, three recovery strategies were evaluated as follows: degree-based priority recovery, betweenness centrality-based priority recovery, and random recovery. The resilience performance of the bus–metro hybrid network in Zhengzhou, China, was assessed through these strategies (
Figure 6).
The figure illustrates that under all three recovery strategies, network resilience recovered at a relatively uniform rate, without exhibiting any sudden increases in resilience. More detailed conclusions could be drawn from the specific resilience values of the Zhengzhou bus–metro hybrid network under these three recovery strategies (
Table 6).
Based on the data presented in the table, it was concluded that among the recovery strategies considered, the betweenness centrality-based recovery strategy exhibited the highest resilience value, followed by the degree-based recovery strategy. Both of these strategies outperformed the random recovery strategy. This indicated that prioritizing nodes with higher betweenness centrality was more effective in enhancing network resilience during disaster recovery.
3.3. Resilience Analysis During the Entire Disaster Phase
The resilience of the bus–metro hybrid network in Zhengzhou, China, was quantified by the ratio of the area under the system performance curve during flood events to the area under the system performance curve under normal conditions. The resilience performance of the network, under the load capacity parameters
α = 0.8 and
β = 2.0, using the betweenness centrality-based recovery strategy, was visualized (
Figure 7). This approach provided a clearer understanding of how the network’s resilience evolved under flood conditions.
The figure illustrates that the resilience curves for the system resistance phase and the system recovery phase of the Bus–Metro Hybrid Network in Zhengzhou, China, were approximately symmetric. This symmetry suggested that the network’s capacity to withstand flooding impacts was generally consistent with its ability to restore system performance during the recovery phase. The specific resilience values of the bus–metro hybrid network in Zhengzhou, China, throughout the entire disaster phase provided a basis for more accurate conclusions (
Table 7).
Analysis indicated that, under the specified conditions, the bus–metro hybrid network in Zhengzhou, China, exhibited strong resilience during the mitigation phase. It demonstrated a robust capacity to respond to and manage the impacts of disasters, effectively reducing resultant damage. During the recovery phase, the network maintained high resilience, characterized by efficient emergency response and resource allocation that facilitated the effective restoration of the transportation system’s functionality, thereby minimizing the overall impact of the disaster. Throughout the entire disaster phase, the system’s resilience remained consistently strong.
4. Discussion
The resilience of urban bus–metro hybrid transportation networks under extreme weather scenarios, particularly flooding events, is critically important for maintaining urban functionality and ensuring public safety. This study has contributed to the field through detailed modeling and analysis, presenting several insights worth further consideration.
4.1. Impacts of Load Capacity Parameters on Network Resilience
The analysis shows that network resilience is sensitive to the combined setting of the capacity parameters α and β, which control how node capacities increase in relation to their initial loads. In this context, β controls the linear redundancy level applied uniformly across all nodes, while α adjusts the non-linear reinforcement intensity at high-load nodes. Simulation results indicate that the combination of α = 0.8 and β = 2.0 provides the highest resilience performance under the tested conditions. This setting achieves a balance between system-wide redundancy and the focused protection of critical nodes. Deviations from this combination resulted in either reduced resilience or unnecessary redundancy costs. In particular, excessively high values may lead to the overprovisioning of capacity at non-critical nodes, while lower values may underprotect high-demand areas. From a practical perspective, this suggests that resilience is influenced not only by the total capacity invested in the system but also by how it is allocated. The parameter β can be interpreted as reflecting uniform infrastructure design standards, while α represents the extent to which critical nodes are prioritized. The proper coordination of these two aspects can improve robustness while avoiding inefficient resource allocation.
4.2. Recovery Strategy Effectiveness
This study evaluates the effectiveness of the following three recovery strategies: random recovery, degree-based recovery, and betweenness centrality-based recovery. In the simulated flood scenario affecting the Zhengzhou bus–metro hybrid network, the betweenness-based strategy consistently achieved the best performance in restoring both structural connectivity and transportation efficiency. This highlights the role of high-betweenness nodes in bridging disconnected subregions and supporting overall system recovery.
However, prior studies have reported mixed findings depending on network structure and disruption scenarios. Shao et al. [
35] found that in the Qingdao metro network, betweenness-based recovery was most effective under random and degree-based attacks, while degree-based strategies performed better under closeness- and betweenness-targeted attacks. Similarly, Chen et al. [
36] showed that in a multimodal intercity transit network, degree centrality more effectively restored structural resilience, whereas betweenness centrality was more advantageous for functional performance.
In contrast to these context-specific findings, our results are consistent with those of Sun et al. [
37], who demonstrated that in multimodal networks facing cascading failures, betweenness-based recovery outperforms both degree-based and random strategies. This consistency suggests that prioritizing high-betweenness nodes can significantly enhance recovery outcomes in systems with complex interdependencies. These findings emphasize that the effectiveness of recovery strategies is closely linked to network topology, modal interconnectivity, and the nature of disruptions. In the context of flood-induced disruptions in integrated urban transit systems, betweenness-based recovery exhibits strong advantages across both structural and functional dimensions. This may be attributed to the high degree of intermodal dependency and the spatial concentration of transfer hubs, where betweenness-central nodes are not only crucial for connecting different network components but also play a key role in enabling large-scale rerouting during disruption.
4.3. Limitations and Future Directions
Despite offering valuable insights, this study has several limitations. First, it adopts a static representation of passenger behavior during floods, whereas actual responses are often shaped by shifting risk perceptions and situational awareness. Future research could incorporate dynamic behavioral models that reflect such adaptive decision-making processes. In addition, the current framework treats all public transit nodes as homogeneous, overlooking potential variations in passenger demand sensitivity and contextual factors. Integrating empirical findings on how macro-level determinants influence ridership patterns across transit stations [
38] may help develop more nuanced and realistic simulations of passenger redistribution under disruption.
Secondly, while Zhengzhou provided a practical case study with detailed empirical data, additional research across multiple cities would strengthen generalizability. Comparative analyses would help discern universal patterns versus location-specific resilience traits, enhancing transferability of these findings.
Finally, this model addresses only a singular disaster type—flooding. Considering compound events or multi-hazard scenarios could provide more robust resilience assessments and realistic disaster preparedness strategies. Additionally, integrating economic and environmental dimensions would further enrich resilience evaluations, aligning closely with sustainability goals.
5. Conclusions
This study conducted a comprehensive resilience assessment of an urban bus–metro hybrid transportation network under flooding conditions, using Zhengzhou, China, as a case study. Several conclusions emerge from the analysis, outlined as follows:
(1) Sensitivity of resilience to capacity parameters: The optimal node load capacity parameter settings were identified as α = 0.8 and β = 2.0, which yielded the highest levels of network robustness and operational performance. This parameterization introduces a non-linear redundancy mechanism that enhances the capacity of high-load or critical transfer stations more significantly than others. By combining system-wide redundancy with differentiated reinforcement, the network demonstrated improved resilience in the face of flood-induced disruptions. The resilience outcomes confirm that the appropriate tuning of α and β not only improves structural robustness but also enhances transportation efficiency across disaster phases.
(2) Efficiency of recovery strategies: The comparative analysis of recovery strategies indicates that, under flood-induced disruptions, the betweenness centrality-based recovery approach achieved the highest performance in terms of topological connectivity and transportation efficiency. Nodes with high betweenness centrality are often located at critical positions that connect different subregions of the network, and they may play an important role in restoring fragmented network structures and maintaining passenger flow. These findings suggest that, in integrated urban transit systems affected by flood-related disruptions, recovery strategies prioritizing betweenness centrality may be more effective than those based on node degree or random selection.
(3) Comprehensive resilience performance: Throughout the flood disaster lifecycle, the Zhengzhou bus–metro hybrid network demonstrated strong resilience. The system effectively resisted initial shocks and maintained high efficiency in the recovery phase, highlighting its robust design and effective emergency management strategies. The relative symmetry observed in the resistance and recovery curves suggests that the system’s capacity to withstand disruptions is broadly consistent with its ability to recover.
This study provides theoretical insights and practical recommendations for urban planners, infrastructure designers, and emergency response authorities, emphasizing the critical role of integrated transportation network resilience planning. Future efforts should continue to refine modeling approaches by incorporating dynamic human behaviors, addressing multiple hazard scenarios, and expanding analyses across diverse geographic contexts.
