Article

Optimal Rainwater Harvesting System for a Commercial Building: A Case Study Focusing on Water and Energy Efficiency

1
ECT—School of Science and Technology, University of Trás-os-Montes and Alto Douro UTAD, Quinta de Prados, 5000−801 Vila Real, Portugal
2
Power and Energy Systems Centre (CPES-INESC-TEC), UTAD’s Pole, 5000−801 Vila Real, Portugal
3
Chemistry Centre (CQ-VR), University of Trás-os-Montes and Alto Douro UTAD, Quinta de Prados, 5000−801 Vila Real, Portugal
4
CIMAR—Interdisciplinary Centre of Marine and Environmental Research, University of Porto, 4450-208 Matosinhos, Portugal
*
Author to whom correspondence should be addressed.
Sustainability 2025, 17(10), 4584; https://doi.org/10.3390/su17104584
Submission received: 3 March 2025 / Revised: 16 April 2025 / Accepted: 9 May 2025 / Published: 16 May 2025

Abstract

:
Water stress is a significant issue in many countries, including Portugal, which has seen a 20% reduction in water availability over the last 20 years, with a further 10–25% reduction expected by the end of the century. To address potable water consumption, this study aims to identify the optimal rainwater harvesting (RWH) system for a commercial building under various non-potable water use scenarios. This research involved qualitative and quantitative methods, utilizing the Rippl method for storage reservoir sizing and ETA 0701 version 11 guidelines. Various scenarios of non-potable water use were considered, including their budgets and economic feasibility. The best scenario was determined through cash flow analysis, considering the initial investment (RWH construction), income (water bill savings), and expenses (energy costs from hydraulic pumps), and evaluating the net present value (NPV), payback period (PB), and internal rate of return (IRR). The energy savings obtained were calculated by sizing a hybrid system with an RWH system and a photovoltaic (PV) system to supply the energy needs of each of the proposed scenarios and the water pump, making the system independent of the electricity grid. The results show that the best scenario resulted in energy savings of 92.11% for a 7-month period of regularization. These results also demonstrate the possibility for reducing potable water consumption in non-essential situations supported by renewable energy systems, thus helping to mitigate water stress while simultaneously reducing dependence on the grid.

1. Introduction

The amount of water on planet Earth has remained practically unaffected since it came into existence around 3.8 billion years ago. This is due to the hydrological cycle, a closed process that involves the evaporation, condensation, and precipitation of water, continually recycling it in nature. However, the rhythm of this cycle does not match with modern society, which often neglects the need for long-term strategic planning for sustainable water management [1].
In recent decades, with the help of satellites, it has been revealed that many underground water reservoirs are swiftly being washed-out. The importance of water to the global economy is analogous to that of oil and big data, which drive today’s economy. Although the planet is mainly sheltered by water, more than 97% of it is salty. Only a small portion, around 3%, is fresh water, and most of that is frozen in polar ice caps and glaciers. This leaves less than 1% of water available to sustain human and ecological needs [1].
For the United Nations (UN), a territory that extracts 25% or more of its renewable freshwater resources is considered to be water-stressed. Globally, in 2018, only 18.4% of renewable freshwater resources were withdrawn. However, some regions are already facing severe difficulties. North Africa, for example, is at critical levels of water stress, while Central and South Asia are also facing high levels of pressure on their water resources. In contrast, 31% of the global population lives in areas that do not suffer from water stress [2].
Prognoses by the World Resources Institute indicate that the problem of water stress will become more prevalent by 2040. The Economist Intelligence Unit stresses that accelerated urbanization, population growth, climate change, and economic development are causing cumulative pressure on water systems. It is estimated that 44 countries will face “extremely high” or “high” levels of water stress by 2040. Portugal is one of these countries and is expected to use between 40% and 80% of its water reserves, well above the 25% that defines water shortage [2].
Urbanization and population growth significantly increase the demand for water. Expanding cities require more water for domestic, industrial, and agricultural consumption. This increase in demand can overload existing infrastructures, leading to high water stress. Climate change contributes to variability in rainfall patterns, resulting in more frequent and intense periods of drought and extreme rainfall events. These changes directly impact the availability and quality of water, exacerbating the problem of water stress. Economic development, especially in emerging countries, increases the demand for water for industrial and agricultural processes. The expansion of economic activities without efficient management of water resources can lead to unsustainable water use [2].
Portugal is currently in a situation of water stress, ranging from high to extreme scarcity. This scene was revealed by the first study carried out by the Portuguese Environment Agency (APA) on available water, consumption, and water losses. According to this study, the scenarios for the future are deeply perturbing, especially the forecast for 2100, which projects a 49% reduction in the volume of river water in the Algarve region and a 29% decrease in rainfall [3].
The APA study highlights that over the last 20 years, water availability in Portugal has fallen by approximately 20%. The projection until the end of the century points to a further decrease of between 10% and 25%. These data indicate a continuous and alarming trend of decreasing water resources, aggravated by various factors, including climate change, increased water demand, and inadequate management practices [3].
The conclusion that water availability has been steadily decreasing over the last two decades, with a worsening trend, underlines the urgency of adopting effective and sustainable water management measures. Thus, it is imperative to invest in efficient water use technologies, improve storage and distribution infrastructures, and implement strict conservation policies.
To mitigate the effects of water stress, it is crucial to implement a series of measures. Efficient water management can be achieved through the adoption of more efficient irrigation technologies, such as drip irrigation, and the implementation of water recycling systems in the industrial and urban sectors. Improving and expanding water storage infrastructure is essential, as is establishing policies that encourage the efficient use and conservation of water. International cooperation is vital for the sustainable management of transboundary water resources, as exemplified by the Albufeira Convention between Portugal and Spain [1].
The water stress situation in Portugal and around the world requires a comprehensive and coordinated approach. The integration of sustainable practices, investments in infrastructure, and international cooperation is essential to meet future challenges. Adopting efficient water resource management and promoting responsible water use are crucial steps to ensure a resilient and sustainable future.
Rainwater harvesting systems represent one of the alternatives for water sources in terms of non-potable uses. It involves collecting rainwater that falls on a collection surface, usually the roof of a building. This water is then sent to a storage facility for later use at the desired consumption points. This method not only reduces the demand for drinking water supplied by public systems but also reduces the pressure on water resources, especially in periods of drought or scarcity [4].
The reuse of rainwater offers significant advantages over the reuse of domestic wastewater or greywater, mainly due to its lower load of polluting compounds and the greater volume available. Rainwater contains fewer organic compounds, solid matter, nutrients, and pathogenic microorganisms, which makes its treatment simpler and more efficient [5].
Previous research works on RWH systems, highlighting key findings, methodologies, and implications, were focused on its design and efficiency [6], water quality [7], economic analysis [8,9,10], impact on water supply [11], and policy and community engagement [12], as the effectiveness of RWH systems often hinges on supportive policies and community involvement. Research has explored how regulations, incentives, and public awareness campaigns can enhance RWH adoption. The environmental benefits of RWH, including reduced surface runoff, lower erosion rates, and improved groundwater recharge, were also studied.
Rainwater harvesting for non-potable uses can be implemented in different types of facilities, including residential, commercial, and industrial. Rainwater can be used for various non-potable purposes, such as watering gardens, washing cars, flushing toilets, and cleaning outdoor areas [4].
In addition to reducing potable water consumption, rainwater harvesting contributes to sustainable water management, mitigating the impacts of urban flooding by reducing the volume of surface runoff during heavy rainfall events. This additional benefit is particularly relevant in densely populated urban areas, where drainage infrastructure can be overloaded [4].
In terms of energy efficiency, rainwater harvesting reduces the need for energy-intensive water supply systems. According to de Sá Silva et al. and Chiu et al. [13,14], rainwater harvesting systems can reduce electricity consumption and greenhouse gas emissions, with potential savings of 138.6 kWh per family per year, and contribute to a 21.6% reduction in household water consumption.
Collecting and storing rainwater helps decrease reliance on municipal water treatment plants, which require significant energy for pumping, filtration, and distribution [15]. By harvesting rainwater locally, energy consumption is minimized up to 78%, and the overall environmental impact of the water supply is reduced [16]. Additionally, rainwater harvesting systems have shown the potential to decrease the effects on water treatment plants by up to 23%, potable water distribution by up to 19%, and wastewater treatment plants by up to 11.3% [17].
Combining rainwater harvesting systems with photovoltaic (PV) technology is a powerful strategy to enhance energy efficiency in water consumption, with potential for self-sufficiency. The integration of PV panels with rainwater harvesting allows for the use of solar energy to power pumps and filtration systems, which are essential for collecting, storing, and distributing rainwater [18]. In fact, Southern European countries, including Portugal, have excellent climate conditions for solar energy production due to high levels of solar radiation and suitable temperatures [19]. The authors proposed a floating photovoltaic (FSPV) system that uses water bodies for installation, conserving valuable land, which is particularly important in regions with limited land availability or high land costs.
PV-powered rainwater harvesting systems make the entire water management process more energy-efficient, as they leverage free and abundant solar energy to operate essential components [20]. This synergy not only ensures a sustainable, off-grid solution for water supply but also decreases operational costs and reliance on non-renewable energy sources, contributing to a more resilient and eco-friendly infrastructure [21].
Implementing rainwater harvesting systems involves installing gutters and pipes to collect rainwater, as well as suitable storage tanks. These systems can be complemented by filters and other devices to guarantee the quality of the water for the intended uses. Raising consumer awareness of the importance of water conservation and promoting sustainable behavior are also essential components for the success of these measures [4].
The rainwater treatment process generally involves several stages. Initially, a filter is installed to retain solid matter, positioned upstream or at the entrance to the storage cistern. This filter serves to remove debris such as leaves, dust, and other materials that may be present in the water collected from the roofs. The storage cistern can be single- or multi-compartment. Multi-compartment cisterns are particularly effective, as they allow solid and organic matter to decant in the first chamber, improving the quality of the stored water [5].
After storage, a disinfection system is placed at the outlet of the cistern to ensure that the water is suitable for its intended uses. This system can include methods such as chlorination, ultraviolet radiation (UV), or ozonation, depending on the specific needs and the desired water quality [5].
In addition to these steps, it is essential to monitor and adjust the pH of the rainwater. The pH of the water must be kept between 6.5 and 8.5 to prevent the corrosion of pipes and ensure the effectiveness of disinfection. If the pH is outside this range, it can be corrected using a basic solution such as sodium hydroxide, as recommended by the National Association for Quality in Building Installations [22].
The advantages of reusing rainwater are multiple. Firstly, the lower pollutant load simplifies treatment and reduces operating costs compared to the reuse of wastewater or graywater, which requires more complex treatment processes to remove more persistent contaminants in higher concentrations. In addition, the greater availability of rainwater, especially in regions with high rainfall, provides a sustainable and abundant source of non-potable water for various uses, such as irrigation, washing vehicles, flushing toilets, and cleaning outdoor areas [22].
The aim of this study is to define the best configuration for a rainwater harvesting (RWH) system in a commercial building, using different scenarios for non-potable uses, in order to obtain a storage volume and the respective study of economic viability of the best scenarios. The energy savings obtained from rainwater harvesting were also calculated, accounting for the water and energy required by the pump to collect, store, and distribute the water into the building. A PV system was sized to satisfy its energy needs, making it independent of the grid. The object of this study is Nosso Shopping, a commercial building located in the city of Vila Real in Portugal.

2. Case Study

2.1. Characterization of the Commercial Building

Nosso Shopping (Figure 1a) is located in the city of Vila Real, in the northern region of Portugal. It opened in October 2004 and has 94 stores spread over three floors, with 30,000 m2 of gross lettable area and covered parking with around 1000 spaces. It is the most popular shopping and leisure destination for residents of the region, with over 6 million visitors a year [23,24]. Figure 1b shows a schematic of the proposed RWH system and the PV installation on the building. The PV panels convert solar energy into electric energy, which is later used to feed the RWH system, powering the pump and filtration systems. The water collected on the roof flows down, through a pipe system, into a water tank located on the underground level of the building. The water is then transferred to the building to be used in toilet flushing and the cleaning of floors.
Data concerning the coverage area, the parking area, and the daily number of people were estimated based on previous data and measured. Thus, the following values were estimated: coverage area: 24,283.00 m2; parking area: 1000 spaces × 30 m2/space = 30,000.00 m2; daily number of people: 6000,000/365 days = 16,438 visitors/day.

2.2. Climate Data of Vila Real Region

2.2.1. Precipitation

Based on the historical rainfall series for Vila Real (Scheme 1), it is possible to obtain the average rainfall for each month and thus calculate the required reservoir volumes.
Scheme 1. Rainfall history for Vila Real from 2010 to 2022 [27].
Sustainability 17 04584 sch001

2.2.2. Solar Radiation Intensity

Scheme 2 shows the monthly solar radiation intensity history for Vila Real, between 2010 and 2020, and the average solar radiation intensity of the last 10 years.

2.2.3. Average Air Temperature

Scheme 3 shows the monthly average of the exterior air temperature history for Vila Real, between 2010 and 2020, and also the average temperature of the last 10 years.

2.3. Calculation of Monthly Consumption

The monthly consumption of non-potable uses was divided into two different uses: the monthly consumption of toilet flushing and the monthly consumption of pavement washing (parking area). Equation (1) was applied to calculate the monthly toilet flushing consumption, where CMA is the monthly toilet flushing consumption (m3/month); F is the estimated percentage of people using the toilet (%); Cu is the unitary consumption of the toilet flush (L/ocup.day); d is the number of days in the month; and pop refers to the population attending the shopping center in a day.
CMA = F × C u × D × p o p 1000
The monthly pavement washing consumption is determined using Equation (2), where CMP is the monthly pavement washing consumption (m3/month); A is the parking area (m2); Cu is the unitary consumption of the pavement washing (L/day/m2); and NL is the number of washes monthly provided.
CMP = A × C u × N L 1000
Unitary consumption is based on the ANQUIP Technical Specification—ETA 0701. For the use of toilet flushing in service buildings, a flow rate of 12 L/(person.day) was used and for pavement washing, a flow rate of 5 L/m2 was used. For the F value, it was assumed that 25% of people use the toilet, while for the NL value, it was defined that the parking lot would be washed at least four times a month.
As a result, Equations (3) and (4) represent the following monthly consumption figures:
C M A = 0.25 × 12 × 30 × 16,438 1000 = 1479.45   m 3 / m o n t h
C M P = 30,000 × 5 × 4 1000 = 600.00   m 3 / m o n t h

2.4. Scenarios Characterization

In order to define the best solution, seven different scenarios were considered (Table 1) using the Rippl method. In this study, two types of regularization were used for each scenario: total annual (12 months) and 7 months (the 7 months with the highest rainfall). With this methodology, a regularization volume was calculated that was capable of covering a whole year’s consumption (annual regularization) and another that was able to cover the months when the collected rainwater is higher (7-month regularization). The 7-month approach was considered because the annual regularization is very high, so in this case, the water collected in the months with higher rainfall is being stored to be used as a reservoir for the other months.
Scheme 2. Solar radiation intensity history for Vila Real from 2010 to 2020 [28].
Sustainability 17 04584 sch002
Scheme 3. Temperature history for Vila Real from 2010 to 2020 [28].
Sustainability 17 04584 sch003
The Rippl method makes it possible to size rainwater reservoirs only when there is a positive difference between the volume and the demand for rainwater, that is, at some point in the analyzed period, the demand exceeds the volume [29]. However, when there are no positive differences, meaning that demand does not exceed the volume of water available, it is possible to use the smallest negative value in the module.

3. Results and Discussion

Although seven scenarios were studied, only three viable ones will be presented, which are scenarios 2, 3, and 7. The rest of the scenarios had too long payback periods, which reveal their unviability.
Table 2, Table 3 and Table 4 show the results of the scenarios for annual regularization and seven-month regularization, respectively. The results presented in those tables were obtained to define the volume of the reservoir using the Rippl method as described in [8].
Table 5 shows the results of the annual and seven-month regularizations in scenarios 2, 3, and 7, respectively. It can be seen that the best solution is a seven-month regularization. Therefore, an economic feasibility study will be carried out for the seven-month regularization in scenarios 2, 3, and 7 to identify which scenario will be the best solution to be implemented.
The energy savings occur when harvested rainwater is used instead of water from a utility source that requires energy for pumping, filtration, and transportation. The monthly energy saved by rainwater harvesting is given by Equation (5), where Energy (kWh) is the amount of energy saved; W is the volume of water collected by RWH (m3); and SEC is the specific energy consumption of 0.57 kWh/m3, according to [30].
Energy (kWh) = W × SEC
Equation (6) calculates the monthly energy, in kWh, used by the pump, where P is the rated power of the pump (kW), and H is the number of operating hours of the pump during a month. The energy used by the pump, E p u m p , was calculated considering the pump’s specifications presented in Table 14.
Epump (kWh) = P × H
The monthly energy savings is obtained by the difference between the energy saved by RWH, the energy saved by the pump, and the monthly water consumption of the building. Equation (7) calculated the Energy Savings (kWh), where Energy and E p u m p were obtained by Equations (5) and (6), respectively, and CM is the monthly water consumption (kWh), depending on the scenario considered. The value of CM, in kWh, is obtained by multiplying the volume of water consumption (m3) by the value of SEC.
Energy Savings (kWh) = EnergyEpumpCM
When the value of the monthly energy savings is negative, the energy obtained from rainwater harvesting is not sufficient to fulfill the building’s water needs, and the missing energy has to be bought from the electrical grid. To allow the independence from the grid, a PV system was designed to ensure that the missing energy needs were met. The PV system will be connected to the RWH system of the building, and it will be installed on the roof. The PV system will be responsible for powering the pump responsible for moving the collected rainwater. The energy generated by the PV will also be used to treat and distribute the rainwater collected into the building.
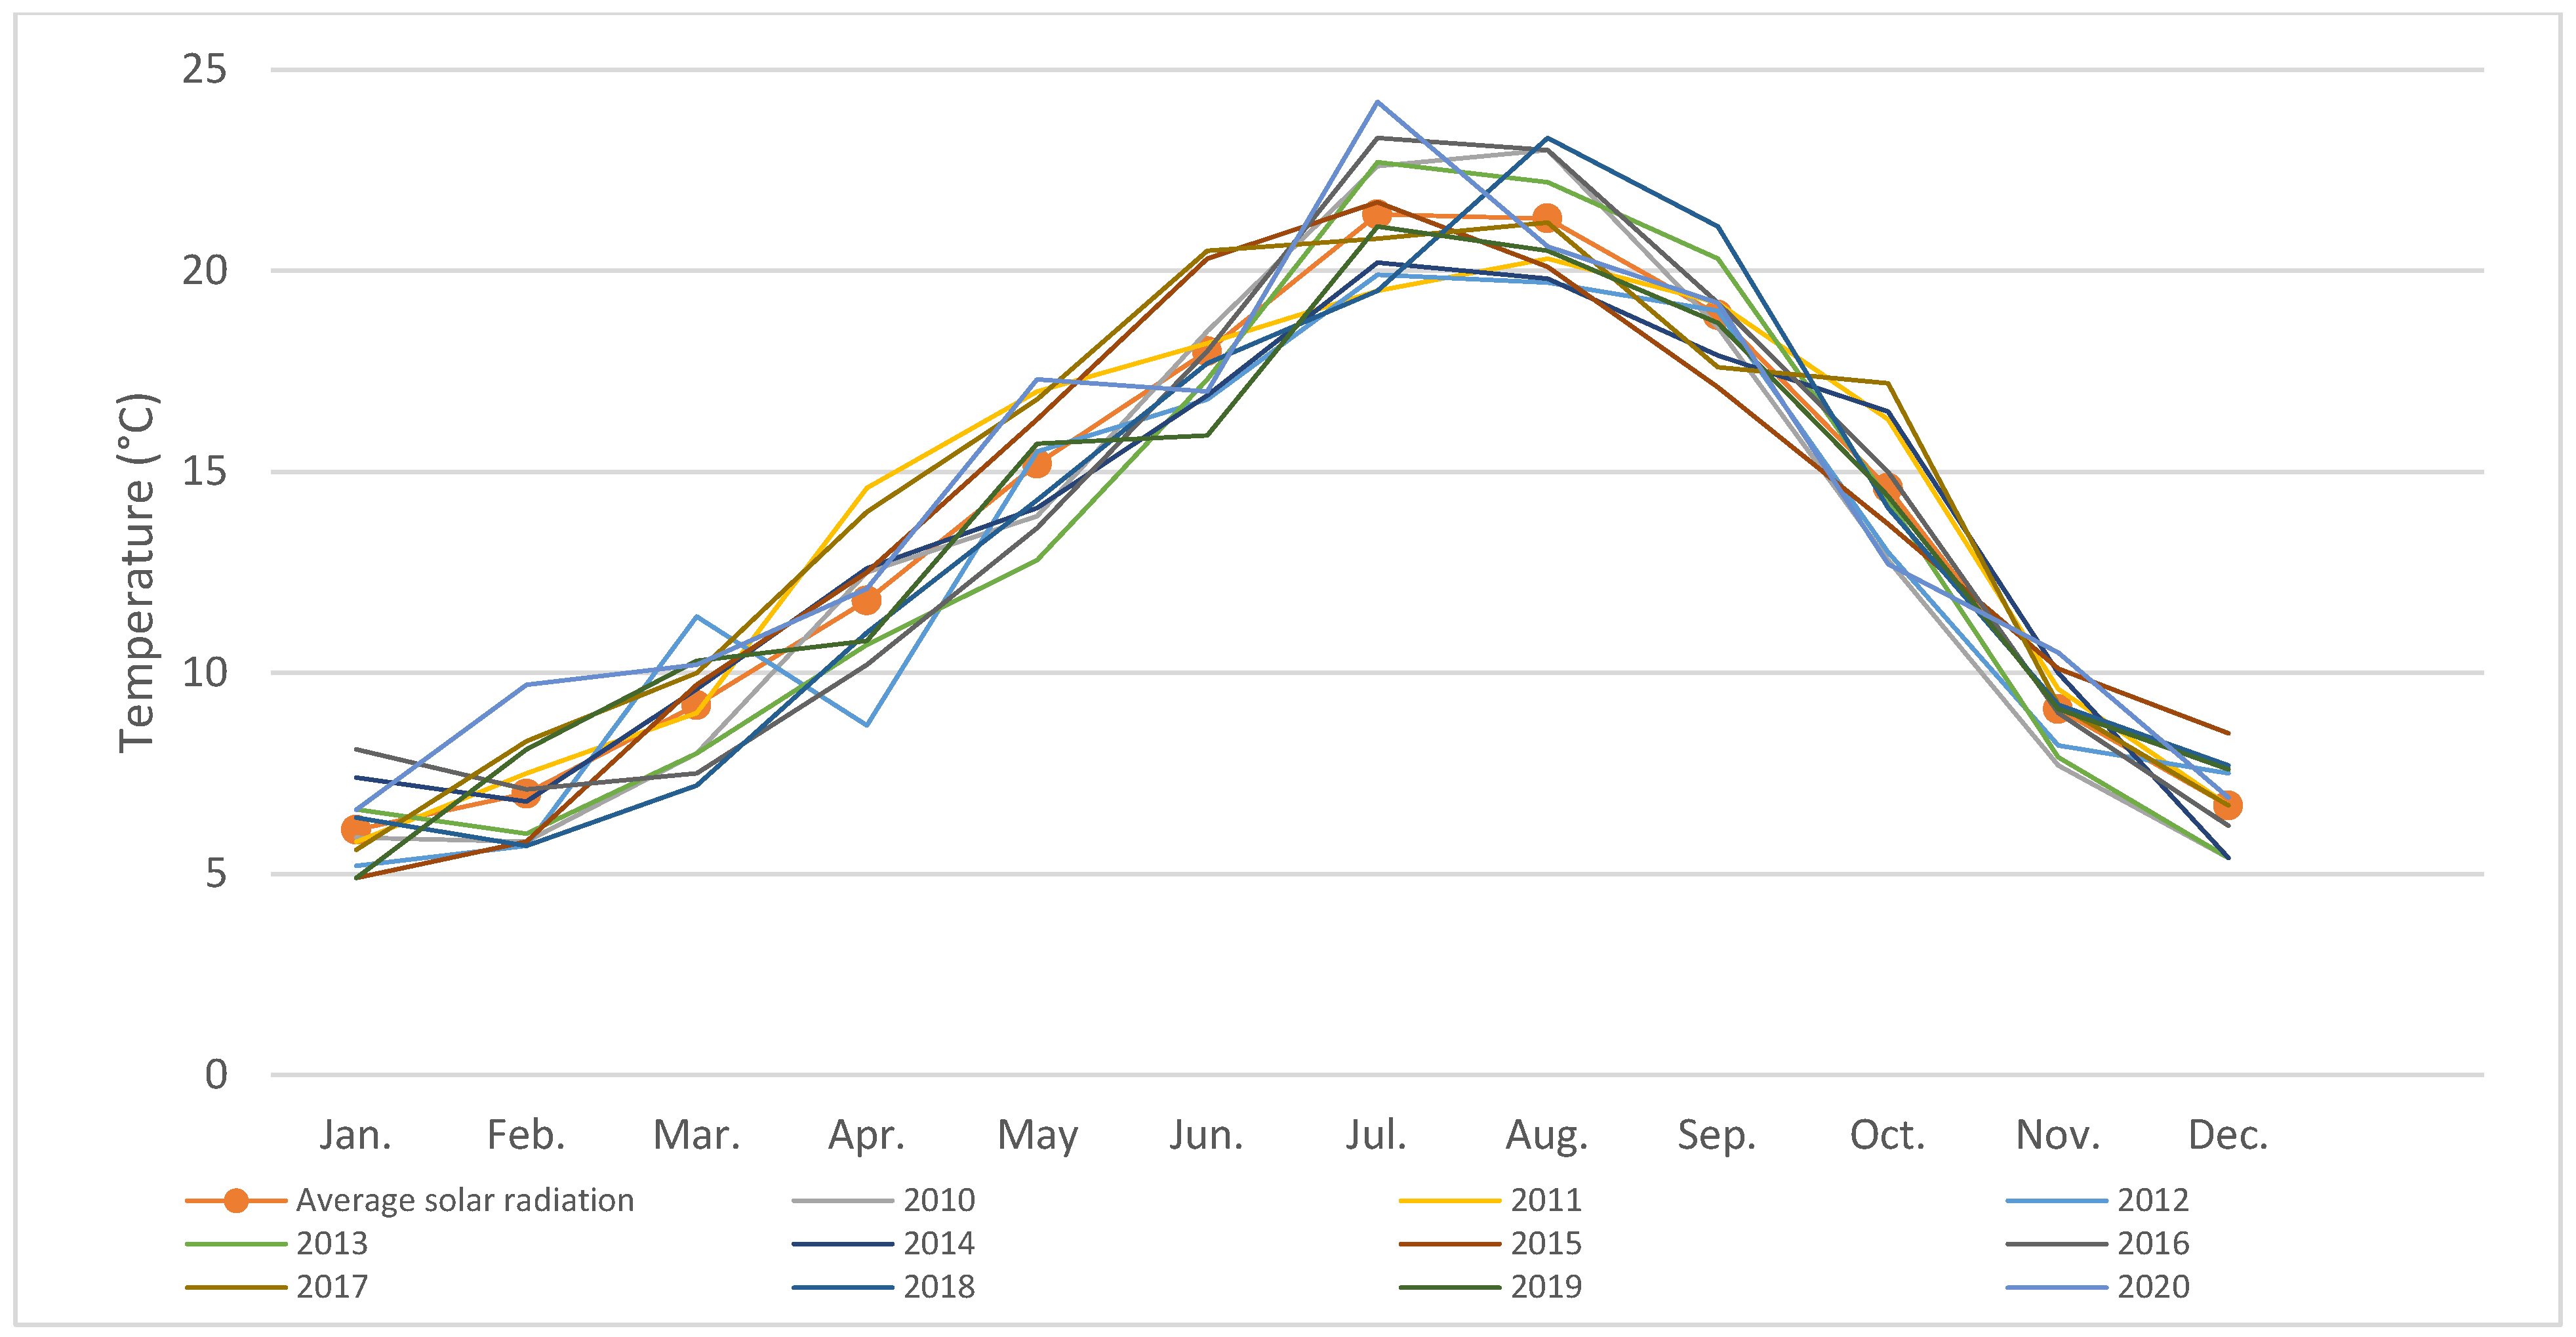
The PV system was sized for each scenario, considering the worst month of the year (the month with the least volume of water collected). The mathematical formulation used to size the PV was from [31] and the temperature and radiation data were extracted from PVGIS [28]. The PV module considered was the JA Solar JAM66S30 panel, for a maximum reference power of 505 W [32]. The PV capacity (kW) is calculated by Equation (8), where Energy needs is the monthly energy shortage (kWh), and h is the average number of daylight hours in Vila Real [33].
PV   capacity   ( kW ) = E n e r g y   n e e d s h
Equation (9) calculates the number of PV panels that are necessary, in each scenario, considering the PV capacity necessary to fulfill the energy needs shortage, and the referenced maximum power that each PV module produces, P (kW).
PV   panels = P V   c a p a c i t y P
Table 6 shows the number of PV panels that were sized for each scenario, regarding annual and seven-month regularization, respectively. For annual regularization, the months with the least precipitation volume are July and August. The PV capacity was calculated based on the necessary energy in July, regarding the energy consumption of each scenario. The same approach was applied to the scenarios in the seven-month regularization, but the month with the least precipitation volume was April.
Table 7, Table 8 and Table 9 show the results of the scenarios that were studied in the previous subsection.
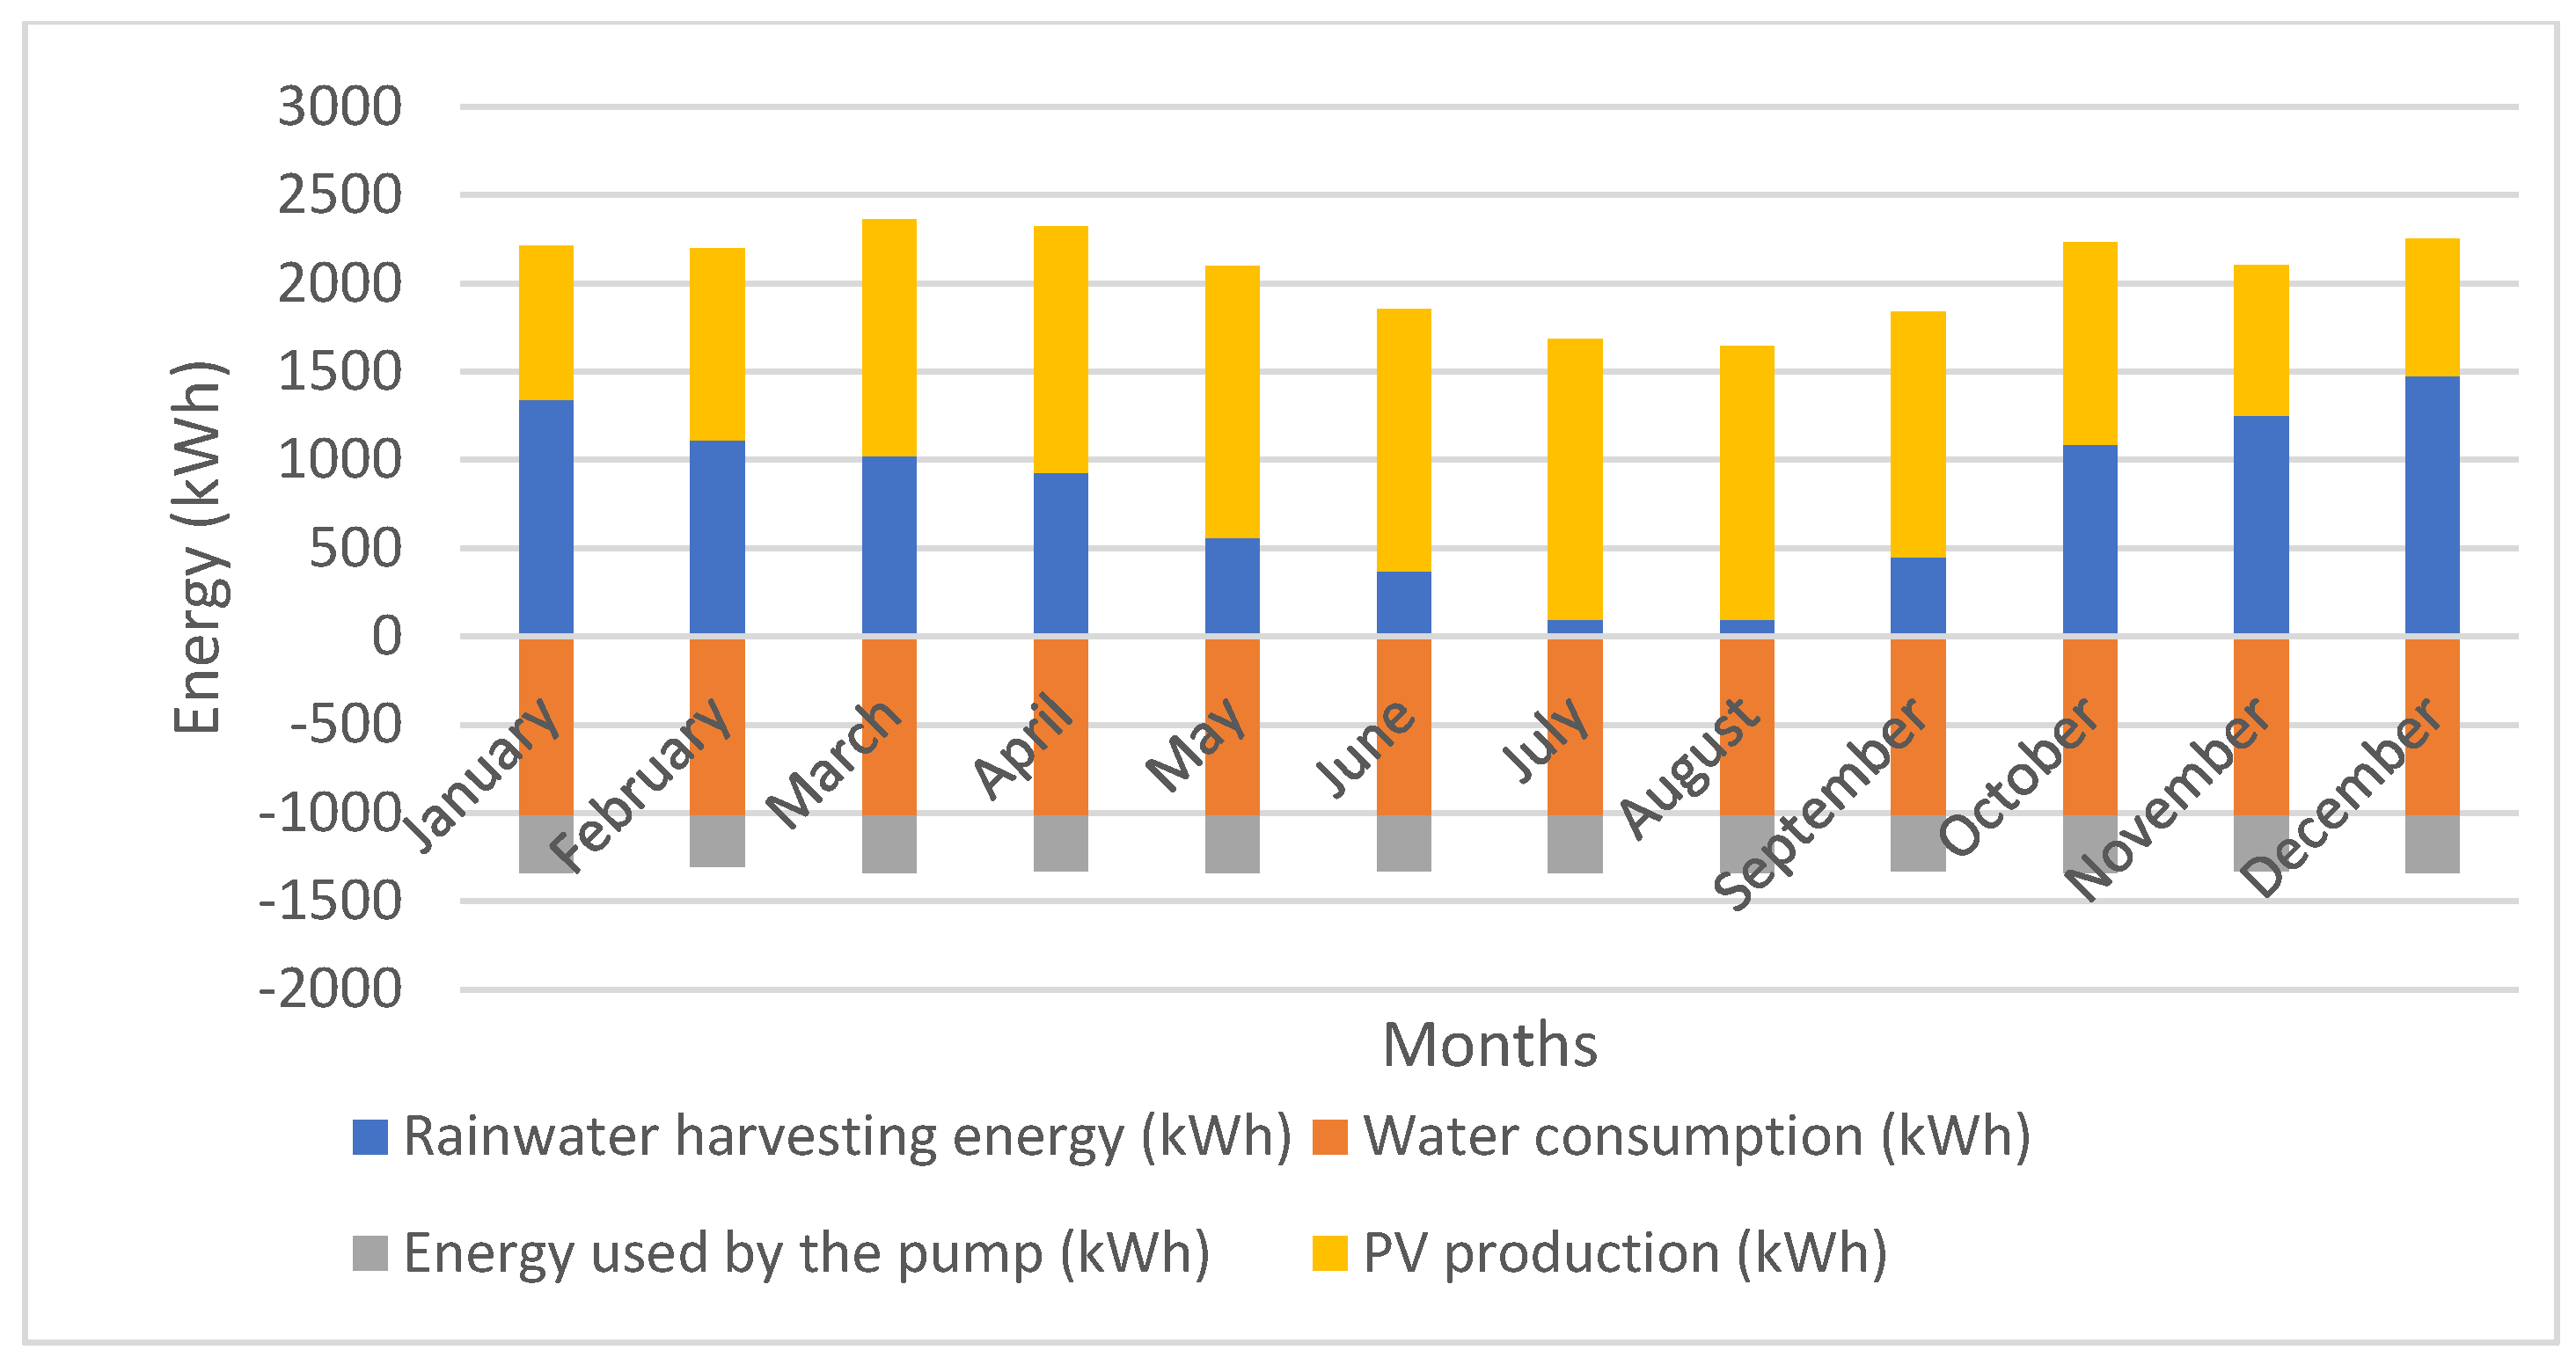
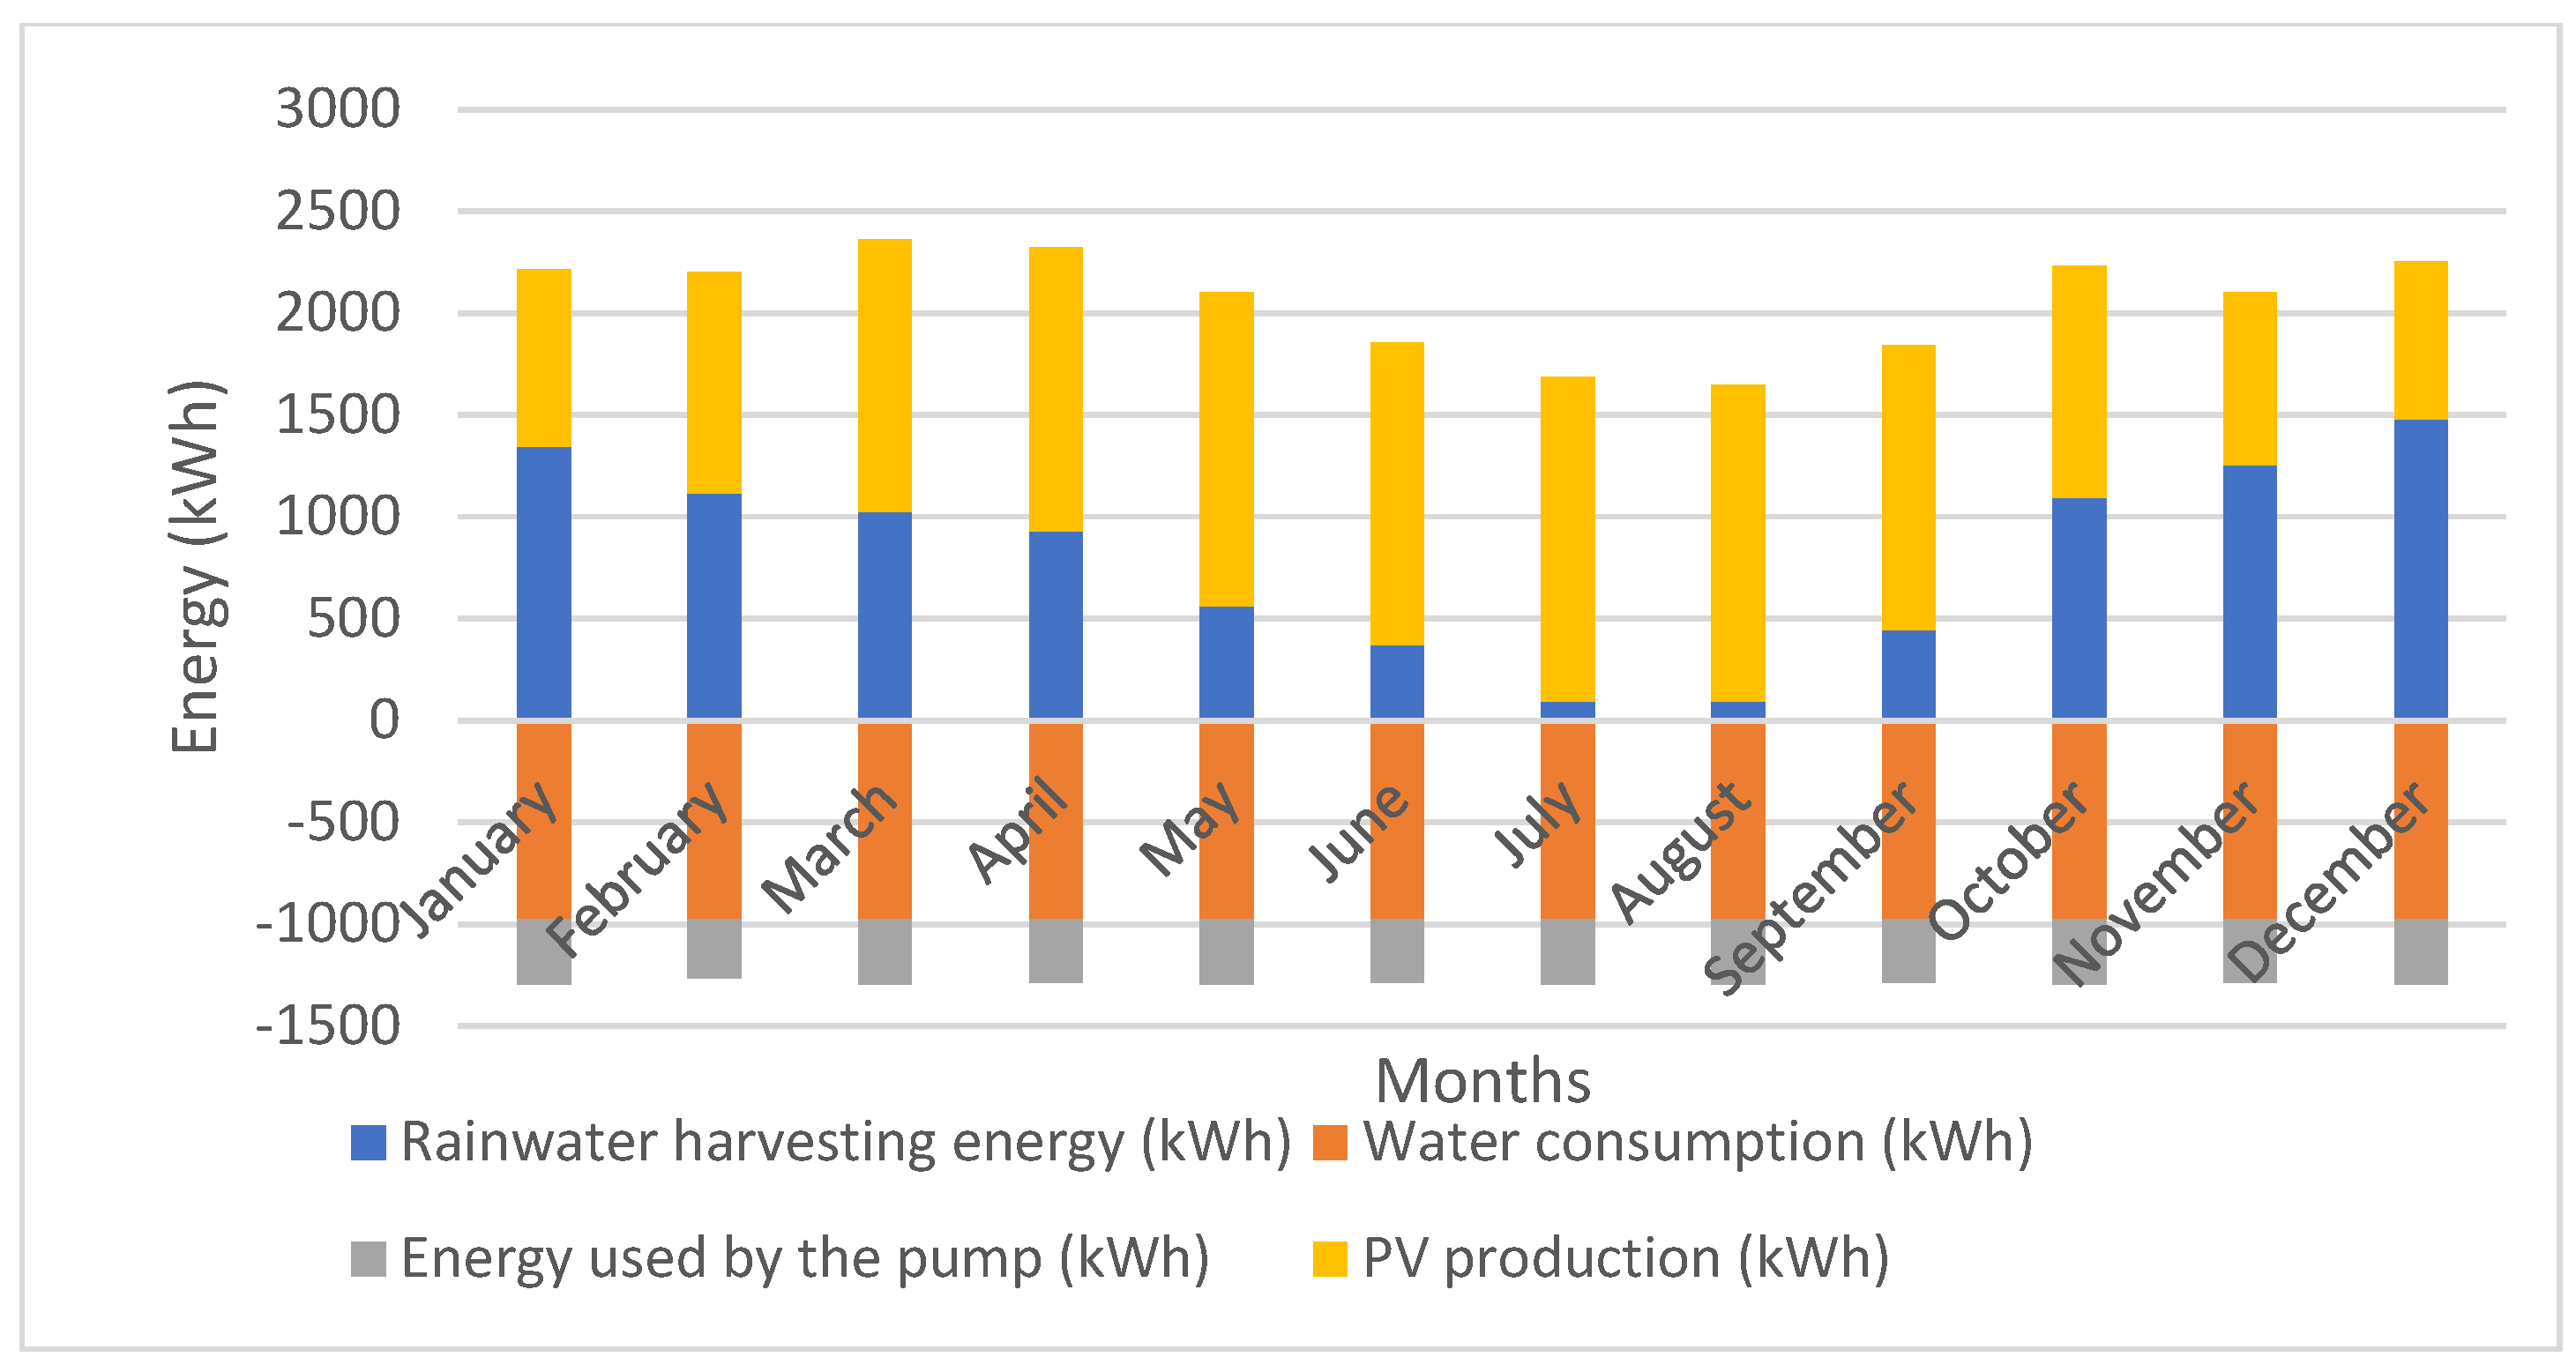
Scheme 4, Scheme 5, Scheme 6, Scheme 7, Scheme 8 and Scheme 9 show the monthly energy balance for scenarios 2, 3, and 7 for the annual and seven-month regularizations. The energy balance is the difference between the amount of energy that is generated by rainwater harvesting and by the PV modules, and the water use consumption and the energy used by the pump.
Table 10 and Table 11 show the comparison between the consumption of the building with and without rainwater harvesting, and the percentage of energy savings for annual and seven-month regularizations in scenarios 2, 3, and 7, respectively.

3.1. Incomes

In order to verify the annual savings from the proposed solutions, they were checked with ADIN (Águas do Interior Norte) [34], the company responsible for water supply in Vila Real, including the tariff for the year 2024, as shown in Table 12. For the study in question, the second-tier non-domestic tariff was used, that is, 2.1709 EUR/m3, and, with this, the savings generated for the scenarios studied were calculated (Table 13), considering a VAT of 6%.

3.2. Expenses

In order to check the energy costs generated by the pump, a pump on the market that would meet the scenarios studied was found, meaning a pump that was suitable for rainwater harvesting and met the flow and head parameters. The flow rates for the scenarios were calculated based on monthly consumption, which means that scenario 2 has a consumption of 1479.45 m3/month or 3.29 m3/h. Scenario 3 has a consumption of 1779.45 m3/month or 3.95 m3/h. Scenario 7 has a consumption of 1709.59 m3/month or 3.80 m3/h, considering that the mall is open 15 h a day. A height of at least 20 m was also considered. The pump that best suited the scenarios in question was the Grundfos SCALA1 System 3–45 [35]. Some of the pump’s specifications are shown in Table 14.
Table 14. Pump’s specifications [35].
Pump Data
DescriptionValue
Product nameSCALA1 System 3–45—Grundfos
Price (EUR)2069.00
Rated flow (m3/h)3.59
Rated head (m)25.00
Maximum head (m)44.00
Start pressure (bar)2.20
Pumped liquidwater
Liquid temperature range0 to 45 °C
Selected liquid temperature20 °C
Density (Kg/m3)998.20
Power input (kW)0.90
Rated power (kW)0.58
Main frequency (Hz)50.00
Rated voltage (V)1 × 230
Rated current (A)3.85
In order to define the energy consumption generated by the pump in economic terms, it was assumed that the pump would work 18 h/day for a total of 212 days a year (sum of the days in the seven months of regularization) to define the annual consumption of the pump in kWh, by multiplying the daily hours of operation of the pump, the days of operation per year and the nominal power (kW). As there are several energy supply companies in Portugal and each has its own tariff, an average tariff price (EUR/kWh) was estimated so that the energy costs generated by the pump could be calculated. Table 15 shows these calculations, considering a VAT of 6%.

3.3. Investment

3.3.1. RWH System

To check the economic viability of each scenario, a budget estimate was made for the RWH system, as shown in Table 16, Table 17 and Table 18. The prices were obtained using CYPE’s price generator.

3.3.2. PV System

To check the economic viability of each scenario, a budget estimate was made for the proposed PV system, as shown in Table 19, Table 20 and Table 21. The prices were extracted from the work developed in [18].

3.4. Economic Viability

Based on the budget estimated for the works, the cash flow was calculated for the scenarios studied, with the aim of determining the NPV (net present value) and the payback period, considering 10 years of cash flow and an interest rate of 7% p.a. The IRR (internal rate of return) was also checked, the rate that brings the NPV to a null value, in order to see whether it is worth taking the investment risk [8].
Table 22 and Table 23 summarize the results of the three scenarios studied to verify the best solution among them, for the RWH and PV systems, respectively.

4. Conclusions

The results show that the scenarios studied for seven-month regularization are viable, with the water savings (“income”), energy costs of the pump (“expense”), budget estimates (“investment”), net present value (“NPV”), payback period, and internal rate of return (“IRR”) being very close, and it is up to the investor to define the best course of action.
The proposed RWH system was also capable of minimizing the energy consumption regarding the pumping, filtration, and transportation of potable water, and the combination with a PV system allowed the building to be independent from the grid for water use. The results show that energy efficiency was higher for 7-month regularization, as was the case for water savings. In order to make the RWH system independent from the grid, a PV system was added, leading to energy savings higher than 80%. The economic analysis developed for the PV system demonstrated that it is an economically viable solution to integrate into an RWH system.
From an economic point of view, scenario 7 shows the best results, with the lowest budget estimate, the highest NPV, the shortest payback period, and the highest IRR. It is important to mention that other sustainable factors were not considered, which would have made the scenarios studied more viable. For the PV system, the economic analysis also showed that scenario 7 had the best return because it also has the highest NPV and IRR values, and the fastest payback period, as observed for the RWH system.
This work proved to be effective in economic, practical, and sustainable terms, showing that it is possible to design more effective systems that can reduce the consumption of potable water in situations that do not require it, enabling the consumption of non-potable water for this purpose. Furthermore, the obtained results also demonstrate the possibility of reducing potable water consumption in non-essential situations supported by renewable energy systems, thus helping to mitigate water stress and, simultaneously, contributing to reducing energy dependence on the grid. This study shows that the combination of a RWH system and PV panels improves the sustainability of rainwater harvesting. The novelty of this work was the analysis of both resources, whereas previous studies have only analyzed them individually, contributing not only to more sustainable and efficient resource management but also to the study of the water–energy nexus.
For future work, the design will be implemented in different structures to improve measures and the robustness of the systems.

Author Contributions

Conceptualization, A.B.-S. and C.M.; Methodology, D.A., R.T., J.B. and C.M.; Validation, J.B., A.B.-S. and C.M.; Formal analysis, D.A., R.T. and J.B.; Investigation, R.T. and C.M.; Data curation, D.A. and R.T.; Writing—original draft, D.A. and R.T.; Writing—review & editing, R.T., J.B., A.B.-S. and C.M.; Visualization, A.B.-S. and C.M.; Supervision, J.B., A.B.-S. and C.M. All authors have read and agreed to the published version of the manuscript.

Funding

This research received no external funding.

Institutional Review Board Statement

Not applicable.

Informed Consent Statement

Not applicable.

Data Availability Statement

The original contributions presented in this study are included in the article. Further inquiries can be directed to the corresponding author.

Conflicts of Interest

The authors declare no conflict of interest.

Abbreviations

The following abbreviations are used in this manuscript:
IRRInternal rate of return
NPVNet present value
PVPhotovoltaic
RWHRainwater harvesting

References

  1. Marta Lima: “Portugal em Stress Hídrico”|UCP. Available online: https://www.ucp.pt/pt-pt/press/marta-lima-portugal-em-stress-hidrico (accessed on 5 June 2024).
  2. Portugal Entre os Países com Maior Stresse Hídrico em 2040. Available online: https://files.impala.pt/especiais/portugal-entre-os-paises-com-maior-stresse-hidrico-em-2040/ (accessed on 5 June 2024).
  3. Marques, I. Primeiro estudo da APA revela que Portugal está numa situação de “stress hídrico”. Gerador. 2022. Available online: https://gerador.eu/primeiro-estudo-da-apa-revela-que-portugal-esta-numa-situacao-de-stress-hidrico/ (accessed on 5 June 2024).
  4. Sousa, S.B.D. Aproveitamento da Água da Chuva para Fins não Potáveis em Zonas Urbanas: Estudo Exploratório no Pólo II da Universidade de Coimbra. Master’s Thesis, Universidade de Coimbra, Coimbra, Portugal, 2015. [Google Scholar]
  5. Kionga, S.M. Avaliação do Potencial de Aproveitamento de Águas Pluviais na Residência Sénior Senhora do Carmo (Covilhã). Master’s Thesis, Universidade da Beira Interior, Covilhã, Portugal, 2022. [Google Scholar]
  6. Freni, G.; Liuzzo, L. Effectiveness of Rainwater Harvesting Systems for Flood Reduction in Residential Urban Areas. Water 2019, 11, 1389. [Google Scholar] [CrossRef]
  7. Meera, V.; Ahammed, M.M. Water Quality of Rooftop Rainwater Harvesting Systems: A Review. J. Water Supply Res. Technol.-Aqua 2006, 55, 257–268. [Google Scholar] [CrossRef]
  8. Matos, C.; Santos, C.; Pereira, S.; Bentes, I.; Imteaz, M. Rainwater Storage Tank Sizing: Case Study of a Commercial Building. Int. J. Sustain. Built Environ. 2013, 2, 109–118. [Google Scholar] [CrossRef]
  9. Concha Larrauri, P.; Campos Gutierrez, J.P.; Lall, U.; Ennenbach, M. A City Wide Assessment of the Financial Benefits of Rainwater Harvesting in Mexico City. J. Am. Water Resour. Assoc. 2020, 56, 247–269. [Google Scholar] [CrossRef]
  10. Wartalska, K.; Grzegorzek, M.; Bełcik, M.; Wdowikowski, M.; Kolanek, A.; Niemierka, E.; Jadwiszczak, P.; Kaźmierczak, B. The Potential of RainWater Harvesting Systems in Europe—Current State of Art and Future Perspectives. Water Resour. Manag. 2024, 38, 4657–4683. [Google Scholar] [CrossRef]
  11. Raimondi, A.; Quinn, R.; Abhijith, G.R.; Becciu, G.; Ostfeld, A. Rainwater Harvesting and Treatment: State of the Art and Perspectives. Water 2023, 15, 1518. [Google Scholar] [CrossRef]
  12. How to Encourage Rainwater Harvesting Community Participation. 2024. Available online: https://rainharvestpro.com/industry-involvement/encourage-community-participation-in-rainwater-harvesting/ (accessed on 14 April 2025).
  13. de Sá Silva, A.C.R.; Bimbato, A.M.; Balestieri, J.A.P.; Vilanova, M.R.N. Exploring Environmental, Economic and Social Aspects of Rainwater Harvesting Systems: A Review. Sustain. Cities Soc. 2022, 76, 103475. [Google Scholar] [CrossRef]
  14. Chiu, Y.; Liaw, C.; Tsai, Y. Harvesting Rainwater, an Innovative Approach to Easing Urban Water-Energy Dilemma. In Proceedings of the 14th International Conference on Rainwater Catchment Systems, Kuala Lumpur, Malaysia, 3–6 August 2009. [Google Scholar]
  15. Ghimire, S.R.; Barkdoll, B.D. Incorporating Environmental Impact in Decision Making for Municipal Drinking Water Distribution Systems through Eco-Efficiency Analysis. In World Environmental and Water Resources Congress 2007: Restoring Our Natural Habitat; American Society of Civil Engineers: Reston, VA, USA, 2012; pp. 1–10. [Google Scholar] [CrossRef]
  16. Ghimire, S.R.; Johnston, J.M.; Ingwersen, W.W.; Hawkins, T.R. Life Cycle Assessment of Domestic and Agricultural Rainwater Harvesting Systems. Environ. Sci. Technol. 2014, 48, 4069–4077. [Google Scholar] [CrossRef] [PubMed]
  17. Teston, A.; Ghisi, E.; Vaz, I.C.M.; Scolaro, T.P.; Severis, R.M. Modular Life Cycle Assessment Approach: Environmental Impact of Rainwater Harvesting Systems in Urban Water Systems. Sci. Total Environ. 2024, 908, 168281. [Google Scholar] [CrossRef] [PubMed]
  18. Baptista, J.; Vargas, P.; Ferreira, J. A Techno-Economic Analysis of Floating Photovoltaic Systems, for Southern-European Countries. REEPQJ 2023, 1, 1–7. [Google Scholar] [CrossRef]
  19. Chekired, F.; Richa, A.; Touil, S.; Bingwa, B. Energy Yield Evaluation of a Rainwater Harvesting System Using a Novel Agrophotovoltaics Design. Desalination Water Treat. 2022, 255, 27–33. [Google Scholar] [CrossRef]
  20. Zimoch, I.; Bartkiewicz, E.; Machnik-Slomka, J.; Klosok-Bazan, I.; Rak, A.; Rusek, S. Sustainable Water Supply Systems Management for Energy Efficiency: A Case Study. Energies 2021, 14, 5101. [Google Scholar] [CrossRef]
  21. Kourtis, I.M.; Kotsifakis, K.G.; Feloni, E.G.; Baltas, E.A. Sustainable Water Resources Management in Small Greek Islands under Changing Climate. Water 2019, 11, 1694. [Google Scholar] [CrossRef]
  22. Associação Nacional para a Qualidade nas Instalações Prediais (ANQIP). Especificação Técnica ANQIP—ETA 0701. In Sistemas de Aproveitamento de Águas Pluviais Em Edifícios (SAAP); ANQIP: Aveiro, Portugal, 2007. [Google Scholar]
  23. Nosso Shopping, Vila Real, 5000–5703—CBRE Industrial. Available online: https://www.cbre.pt/imoveis/comercio/details/PT-AdminUI-67/nosso-shopping-vila-real-vila-real-5000-703?view=isLetting%2CisSale (accessed on 6 June 2024).
  24. Tourist Info Nosso Shopping. Available online: https://nossoshopping.pt/sobre-o-centro-comercial-nosso-shopping/ (accessed on 6 June 2024).
  25. Nosso Shopping—APCC—Associação Portuguesa de Centros Comerciais. Available online: https://www.apcc.pt/centros/nosso-shopping/49 (accessed on 5 June 2024).
  26. Centro Comercial Nosso Shopping. Available online: https://mapcarta.com/pt/W109923233 (accessed on 19 November 2024).
  27. Portal Do INE. Available online: https://www.ine.pt/xportal/xmain?xpid=INE&xpgid=ine_publicacoes&PUBLICACOESpub_boui=437178558&PUBLICACOESmodo=2 (accessed on 3 January 2025).
  28. JRC Photovoltaic Geographical Information System (PVGIS)—European Commission. Available online: https://re.jrc.ec.europa.eu/pvg_tools/en/ (accessed on 4 November 2024).
  29. Corrêa, L.N.; Bezerra, A.E.; Furlani, C.E.A. Métodos de Dimensionamento e Simulação para Reservatórios de Água Pluvial. Available online: https://editorarealize.com.br/artigo/visualizar/39058 (accessed on 14 April 2025).
  30. Santos, E.; Albuquerque, A.; Lisboa, I.; Murray, P.; Ermis, H. Economic Assessment of Energy Consumption in Wastewater Treatment Plants: Applicability of Alternative Nature-Based Technologies in Portugal. Water 2022, 14, 2042. [Google Scholar] [CrossRef]
  31. Teixeira, R.; Cerveira, A.; Baptista, J. Optimized Management of Renewable Energy Sources in Smart Grids in a VPP Context. In Proceedings of the 2021 International Conference on Electrical, Computer and Energy Technologies (ICECET), Cape Town, South Africa, 9–10 December 2021; pp. 1–6. [Google Scholar]
  32. JA SOLAR JAM66S30 MR 500W SILVER F. MC4 1500V -30MM—Idealsat. 2023. Available online: https://www.jasolar.com/uploadfile/2021/0706/20210706053211158.pdf (accessed on 14 April 2025).
  33. Clima, Condições Meteorológicas e Temperatura Média por mês de Vila Real (Portugal)—Weather Spark. Available online: https://pt.weatherspark.com/y/32888/Clima-caracter%C3%ADstico-em-Vila-Real-Portugal-durante-o-ano (accessed on 7 November 2024).
  34. AdIN—Águas do Interior Norte. Tarifário para o ano. 2024. Available online: https://adin.pt/tarifario/ (accessed on 4 November 2024).
  35. SCALA1 System. Available online: https://product-selection.grundfos.com/pt/products/scala1-system (accessed on 7 June 2024).
Figure 1. (a) Nosso Shopping located in Vila Real, Portugal [25,26]. (b) Schematic design of the RWH and PV systems installation.
Sustainability 17 04584 g001
Scheme 4. Scenario 2: Annual regularization.
Sustainability 17 04584 sch004
Scheme 5. Scenario 2: Seven-month regularization.
Sustainability 17 04584 sch005
Scheme 6. Scenario 3: Annual regularization.
Sustainability 17 04584 sch006
Scheme 7. Scenario 3: Seven-month regularization.
Sustainability 17 04584 sch007
Scheme 8. Scenario 7: Annual regularization.
Sustainability 17 04584 sch008
Scheme 9. Scenario 7: Seven-month regularization.
Sustainability 17 04584 sch009
Table 1. Scenarios studied for non-potable uses.
ScenariosNon-Potable Uses
1100% Toilet flushing100% Pavement washing
2100% Toilet flushing-
3100% Toilet flushing50% Pavement washing
450% Toilet flushing100% Pavement washing
550% Toilet flushing50% Pavement washing
6-100% Pavement washing
775% Toilet flushing100% Pavement washing
Table 2. Scenario 2: Annual and seven-month regularizations.
Scenario 2—Annual and Seven-Month Regularizations (100% Toilet Flushing)
MonthAverage Monthly Precipitation (mm)Monthly Consumption (m3)Area (m2)Monthly Precipitation Volume (m3)Annual RegularizationSeven-Month Regularization
(3)–(5) (m3)Column (6) Cumulative Difference (m3)(3)–(5) (m3)Column (6) Cumulative Difference (m3)
(1)(2)(3)(4)(5)(6)(7)(6)(7)
January121.361479.4524,283.002357.62−878.17 −878.17
February100.621479.4524,283.001954.59−475.14 −475.14
March92.591479.4524,283.001798.74−319.28 −319.28
April83.971479.4524,283.001631.22−151.77 −151.77151.77
May50.641479.4524,283.00983.72495.73495.73
June33.521479.4524,283.00651.08828.371324.10
July8.731479.4524,283.00169.611309.842633.94
August8.731479.4524,283.00169.611309.843943.79
September40.341479.4524,283.00783.63695.824639.61
October98.541479.4524,283.001914.25−434.804204.81−434.80
November112.981479.4524,283.002194.88−715.433489.38−715.43
December133.491479.4524,283.002593.27−1113.822375.56−1113.82
Table 3. Scenario 3: Annual and seven-month regularizations.
Scenario 3—Annual and Seven-Month Regularizations (100% Toilet Flushing; 50% Pavement Washing)
MonthAverage Monthly Precipitation (mm)Monthly Consumption (m3)Area (m2)Monthly Precipitation Volume (m3)Annual RegularizationSeven-Month Regularization
(3)–(5) (m3)Column (6) Cumulative Difference (m3)(3)–(5) (m3)Column (6) Cumulative Difference (m3)
(1)(2)(3)(4)(5)(6)(7)(6)(7)
January121.361779.4524,283.002357.62−578.17 −578.17
February100.621779.4524,283.001954.59−175.14 −175.14
March92.591779.4524,283.001798.74−19.28 −19.28
April83.971779.4524,283.001631.22148.23148.23148.23148.23
May50.641779.4524,283.00983.72795.73943.96
June33.521779.4524,283.00651.081128.372072.33
July8.731779.4524,283.00169.611609.843682.17
August8.731779.4524,283.00169.611609.845292.02
September40.341779.4524,283.00783.63995.826287.84
October98.541779.4524,283.001914.25−134.806153.04−134.8013.44
November112.981779.4524,283.002194.88−415.435737.61−415.43−402.00
December133.491779.4524,283.002593.27−813.824923.79−813.82−1215.82
Table 4. Scenario 7: Annual and seven-month regularizations.
Scenario 7—Annual and Seven-Month Regularizations (75% Toilet Flushing; 100% Pavement Washing)
MonthAverage Monthly Precipitation (mm)Monthly Consumption (m3)Area (m2)Monthly Precipitation Volume (m3)Annual RegularizationSeven-Month Regularization
(3)–(5) (m3)Column (6) Cumulative Difference (m3)(3)–(5) (m3)Column (6) Cumulative Difference (m3)
(1)(2)(3)(4)(5)(6)(7)(6)(7)
January121.361709.5924,283.002357.62−648.03 −648.03
February100.621709.5924,283.001954.59−245.01 −245.01
March92.591709.5924,283.001798.74−89.15 −89.15
April83.971709.5924,283.001631.2278.3778.3778.3778.37
May50.641709.5924,283.00983.72725.87804.24
June33.521709.5924,283.00651.081058.511862.74
July8.731709.5924,283.00169.611539.983402.72
August8.731709.5924,283.00169.611539.984942.70
September40.341709.5924,283.00783.63925.965868.66
October98.541709.5924,283.001914.25−204.665664.00−204.66−126.29
November112.981709.5924,283.002194.88−485.305178.71−485.30−611.58
December133.491709.5924,283.002593.27−883.694295.02−883.69−1495.27
Table 5. Annual and seven-month regularizations results.
Annual RegularizationSeven-Month Regularization
Scenarios237237
Reservoir volume (m3)4639.616287.845868.66151.77148.2378.37
Annual precipitation volume (m3)17,202.2317,202.2317,202.2314,444.5714,444.5714,444.57
Annual consumption (m3)17,753.4221,353.4220,515.0710,356.1612,456.1611,967.12
Water saving (%)96.90%80.56%83.85%139.48%115.96%120.70%
Table 6. Number of PV panels for annual and seven-month regularizations.
Annual RegularizationSeven-Month Regularization
Scenarios237237
PV capacity (kW)2.833.283.170.621.100.98
Daylight hours12.212.2 12.2 12.212.212.2
PV panels677232
Table 7. Scenario 2: Annual and seven-month regularizations.
Scenario 2—Annual and Seven-Month Regularizations (100% Toilet Flushing)
MonthMonthly Precipitation Volume (m3)Monthly Consumption (kWh)Monthly Energy Saved by RWH (kWh)Monthly Energy Used by the Pump (kWh)Monthly Energy Savings (kWh)Annual RegularizationSeven-Month Regularization
Monthly PV Production (kWh)Monthly PV Production (kWh)
January2357.62843.291343.84323.64176.91746.11248.70
February1954.59843.291114.12292.32−21.49931.63310.54
March1798.74843.291025.28323.64−141.651145.72381.91
April1631.22843.29929.80313.20−226.691193.51397.84
May983.72843.29560.72323.64−606.211319.52
June651.08843.29371.12313.20−785.371271.04
July169.61843.2996.68323.64−1070.251362.08
August169.61843.2996.68323.64−1070.251329.16
September783.63843.29446.67313.20−709.821195.99
October1914.25843.291091.12323.64−75.81979.84326.61
November2194.88843.291251.08313.2094.59730.95243.65
December2593.27843.291478.14323.64311.21664.69221.56
Table 8. Scenario 3: Annual and seven-month regularizations.
Scenario 3—Annual and Seven-Month Regularizations (100% Toilet Flushing + 50% Pavement Washing)
MonthMonthly Precipitation Volume (m3)Monthly Consumption (kWh)Monthly Energy Saved by RWH (kWh)Monthly Energy Used by the Pump (kWh)Monthly Energy Savings (kWh)Annual RegularizationSeven-Month Regularization
Monthly PV Production (kWh)Monthly PV Production (kWh)
January2357.621014.291343.84323.645.91870.46373.05
February1954.591014.291114.12292.32−192.491086.91465.82
March1798.741014.291025.28323.64−312.651336.67572.86
April1631.221014.29929.80313.20−397.691392.43596.76
May983.721014.29560.72323.64−777.211539.44
June651.081014.29371.12313.20−956.371482.88
July169.611014.2996.68323.64−1241.251589.09
August169.611014.2996.68323.64−1241.251550.68
September783.631014.29446.67313.20−880.821395.32
October1914.251014.291091.12323.64−246.811143.15373.05
November2194.881014.291251.08313.20−76.41852.77465.82
December2593.271014.291478.14323.64140.21775.47572.86
Table 9. Scenario 7: Annual and seven-month regularizations.
Scenario 3—Annual and Seven-Month Regularizations (100% Toilet Flushing + 50% Pavement Washing)
MonthMonthly Precipitation Volume (m3)Monthly Consumption (kWh)Monthly Energy Saved by RWH (kWh)Monthly Energy Used by the Pump (kWh)Monthly Energy Savings (kWh)Annual RegularizationSeven-Month Regularization
Monthly PV Production (kWh)Monthly PV Production (kWh)
January2357.62974.461343.84323.6445.74870.46248.70
February1954.59974.461114.12292.32−152.661086.91310.54
March1798.74974.461025.28323.64−272.821336.67381.91
April1631.22974.46929.80313.20−357.861392.43397.84
May983.72974.46560.72323.64−737.381539.44
June651.08974.46371.12313.20−916.501482.88
July169.61974.4696.68323.64−1201.421589.09
August169.61974.4696.68323.64−1201.421550.68
September783.63974.46446.67313.20−840.991395.32
October1914.25974.461091.12323.64−206.981143.15326.61
November2194.88974.461251.08313.20−36.58852.77243.65
December2593.27974.461478.14323.64180.04775.47221.56
Table 10. Annual regularization results.
Annual Regularization
Scenarios237
Annual consumption without RWH (kWh)10,119.4412,171.4411,693.58
Annual consumption with RWH (kWh)4707.406322.865924.64
Energy savings (%)53.48%48.05%49.33%
Table 11. Seven-month regularization results.
Seven-Month Regularization
Scenarios237
Seven-month consumption without RWH (kWh)5903.017100.016821.25
Seven-month consumption with RWH (kWh)465.581149.581026.93
Energy savings (%)92.11%83.81%84.95%
Table 12. Tariff 2024 [34].
Domestic
1st tieruntil 5000 LEUR 0.67
2nd tier>5000 to 15,000 LEUR 0.94
3rd tier>15,000 to 25,000 LEUR 2.17
4th tier> 25,000 LEUR 3.26
Non-domestic
1st tieruntil 50,000 LEUR 1.29
2nd tier>50,000 LEUR 2.17
Table 13. Annual savings for scenarios 2, 3, and 7—seven-month regularization.
Seven-Month Regularization
Scenarios237
Seven-month consumption (m3)10,356.16 12,456.16 11,967.12
ADIN 2024 [34] 2nd Tier non-domestic tariff (EUR/m3)EUR 2.17
Amount saved (EUR)22,482.2027,041.0925,979.43
Amount saved with VAT (EUR)23,831.1328,663.5527,538.19
Table 15. Annual pump consumption.
Annual Pump Consumption
DescriptionValue
Operating hours per day18.00
Days of operation per year212
Pump consumption per year (kwh)2213.28
Average tariff price (EUR/Kwh)EUR 0.20
Annual energy expenditure on the pump (EUR)442.66
Annual energy expenditure on the pump with VAT (EUR)469.22
Table 16. Budget estimate for scenario 2—seven-month regularization.
Scenario 2—Seven-Month Regularization (100% Toilet Flushing)
ItemDesignationUnitQuantityUnitary Price (EUR)Total Price (EUR)
1Excavation by mechanical meansm3160.006.261001.60
240,000 L underground reservoir (purchase and installation)un411,044.9244,179.68
4Cartridge filter consisting of head, bowl, and filter screen cartridge, 3/4” thread, 3.5 m3/h flow rate.un4142.97571.88
5Circular PVC guttering with titanium oxide, development 250 mm (purchase and installation)m943.0014.6213,786.66
6Pipe (Ø50 mm) (purchase and installation)m1000.0049.4349,430.00
7Pump SCALA1 System 3–45—Grundfosun22069.004138.00
TOTALEUR 113,107.82
Table 17. Budget estimate for scenario 3—seven-month regularization.
Scenario 3—Seven-Month Regularization (100% Toilet Flushing; 50% Pavement Washing)
ItemDesignationUnitQuantityUnitary Price (EUR)Total Price (EUR)
1Excavation by mechanical meansm3150.006.26939.00
275,000 L underground reservoir (purchase and installation)un220,575.1341,150.26
4Cartridge filter consisting of head, bowl, and filter screen cartridge, 3/4” thread, 3.5 m3/h flow rate.un2142.97285.94
5Circular PVC guttering with titanium oxide, development 250 mm (purchase and installation)m943.0014.6213,786.66
6Pipe (Ø50 mm) (purchase and installation)m1000.0049.4349,430.00
7Pump SCALA1 System 3–45—Grundfosun22069.004138.00
TOTALEUR 109,729.86
Table 18. Budget estimate for scenario 7—seven-month regularization.
Scenario 7—Seven-Month Regularization (75% Toilet Flushing; 100% Pavement Washing)
ItemDesignationUnitQuantityUnitary Price (EUR)Total Price (EUR)
1Excavation by mechanical meansm380.006.26500.80
240,000 L underground reservoir (purchase and installation)un211,044.9222,089.84
4Cartridge filter consisting of head, bowl, and filter screen cartridge, 3/4” thread, 3.5 m3/h flow rate.un2142.97285.94
5Circular PVC guttering with titanium oxide, development 250 mm (purchase and installation)m943.0014.6213,786.66
6Pipe (Ø50 mm) (purchase and installation)m1000.0049.4349,430.00
7Pump SCALA1 System 3–45—Grundfosun22069.004138.00
TOTALEUR 90,231.24
Table 19. Budget estimate for scenario 2—seven-month regularization.
Scenario 2—Seven-Month Regularization (100% Toilet Flushing)
DesignationUnitary Price (EUR/kWp)Total Price (EUR)
PV panels274.38548.76
Inverters182.92365.84
Electrical equipment/devices91.46571.88
Installation and labor137.19274.38
Transport18.2936.58
TOTALEUR 1797.44
Table 20. Budget estimate for scenario 3—seven-month regularization.
Scenario 3—Seven-Month Regularization (100% Toilet Flushing; 50% Pavement Washing)
DesignationUnitary Price (EUR/kWp)Total Price (EUR)
PV panels274.38823.14
Inverters182.92548.76
Electrical equipment/devices91.46274.38
Installation and labor137.19411.57
Transport18.2954.87
TOTALEUR 2112.72
Table 21. Budget estimate for scenario 7—seven-month regularization.
Scenario 7—Seven-Month Regularization (75% Toilet Flushing; 100% Pavement Washing)
DesignationUnitary Price (EUR/kWp)Total Price (EUR)
PV panels274.38548.76
Inverters182.92365.84
Electrical equipment/devices91.46571.88
Installation and labor137.19274.38
Transport18.2936.58
TOTALEUR 1797.44
Table 22. Summary of the results in scenarios 2, 3, and 7—seven-month regularization (RWH system).
Scenarios—Seven-Month Regularization237
100% Toilet Flushing100% Toilet Flushing;
50% Pavement Washing
75% Toilet Flushing;
100% Pavement Washing
Reservoir volume (m3)151.77 148.23 78.37
Annual water savings (%)139.48%115.96%120.70%
Income (EUR)23,831.1328,663.5527,538.19
Expenses (EUR)469.22469.22469.22
Construction budget (EUR)113,107.82109,729.8690,231.24
NPV (i = 7%; 10 years) (EUR)50,976.4988,295.3799,889.94
Payback period6 years, 1 month, and 14 days4 years, 8 months, and 15 days3 years, 11 months, and 5 days
IRR (%)15.95%22.25%27.32%
Table 23. Summary of the results in scenarios 2, 3, and 7—seven-month regularization (PV system).
Scenarios—Seven-Month Regularization237
100% Toilet Flushing100% Toilet Flushing;
50% Pavement Washing
75% Toilet Flushing;
100% Pavement Washing
Annual energy production (kWh)12,870.2415,015.2815,015.28
Annual energy savings (%)92.11%83.81%84.95%
O&M costs1.5% of initial costs1.5% of initial costs1.5% of initial costs
Yearly inflation rate2%2%2%
Energy price in the first year (EUR/MWh)47.6747.6747.67
Initial investment costs (EUR)1797.442112.721797.44
NPV (i = 7%; 10 years) (EUR)2737.562519.643530.91
Payback period3.03 years4.69 years2.58 years
IRR (%)33%19%39%
Disclaimer/Publisher’s Note: The statements, opinions and data contained in all publications are solely those of the individual author(s) and contributor(s) and not of MDPI and/or the editor(s). MDPI and/or the editor(s) disclaim responsibility for any injury to people or property resulting from any ideas, methods, instructions or products referred to in the content.

