Article

Effect of Community Place Qualities on Place Value in a Destination

by
Kathleen L. Andereck
* and
Christine A. Vogt
School of Community Resources and Development, Arizona State University, 411 N. Central Ave., Ste. 550, Phoenix, AZ 85004, USA
*
Author to whom correspondence should be addressed.
Sustainability 2025, 17(10), 4582; https://doi.org/10.3390/su17104582
Submission received: 15 April 2025 / Revised: 12 May 2025 / Accepted: 14 May 2025 / Published: 16 May 2025
(This article belongs to the Section Tourism, Culture, and Heritage)

Abstract

:
Design is one of the newer concepts emerging in tourism research. This study provides an empirical examination of the way tourism-related community place qualities influence residents’ place value. Using a mail survey of residents in a community tourism planning process for sustainability, data were collected on perceptions regarding place qualities (community design features) and evaluations of place value (quality of life). The Place Value Framework was applied to guide the measurement of concepts and analysis. Data were collected using a mail survey of community residents from the tax assessor’s database of those who owned a house, with a final sample of 376. Data were analyzed using principal component factor analysis and MANOVA. The results support a relationship between residents’ perceptions about place qualities in their community and evaluation(s) of place value. The Tourism Place Value Framework has the potential to be applied in other research contexts. Investments in new or modified place qualities can be considered by researchers and communities to influence positive, neutral, or negative resident evaluations of place value.

1. Introduction

One of the newer concepts in tourism and community sustainability is that of design. As part of this emerging area of interest, communities where tourism is a dominant economic sector have come into focus. A recent example is a curated collection of papers starting in volume 82 of Annals of Tourism Research focusing on tourism design and analytics [1]. Fesenmaier and Xiang [2] note that design is a way of thinking and suggest that “design thinking is a basic process driving innovation and new ways for supporting the creation of customer value” (p. 4). Fesenmaier and Xiang [2] and Tussyadiah [3] offer that the goal of design can be the creation of any number of tangible items or human efforts, including physical objects, processes, systems, technology, and human creations. Good design can result in improvement of people’s daily lives through the quality of life (QOL) in their communities [4]. Likewise, tourism as a commercial activity in a community can enhance or detract from community QOL and sustainability [5]. There is an intersection between tourism and design: design influences the effective functioning of tourism in a community and the way it impacts residents, and it plays a role in creating value for the tourism experience. There is also an intersection between design and sustainability and its role in creating tourism experiences [6].
Sustainability has come to the forefront of community tourism planning efforts as destinations worldwide struggle with the impacts of tourism. Many communities are experiencing exceeded social and physical carrying capacities or overtourism with the resultant discontent and political action among residents [7]. Overtourism can negatively influence QOL in a destination. It has been defined as “the impact of tourism on a destination, or parts thereof, that excessively influences perceived quality of life of citizens and/or quality of visitors’ experiences in a negative way” [8].Overtourism is viewed as an accumulation of different impacts and perceptions resulting from encounters between tourists and residents and is associated with negative impacts such as too much traffic and noise, crowding, lack of affordable housing, and public safety issues [7,9]. As resident QOL is negatively impacted by tourism, communities are incorporating sustainability thinking and initiatives into planning efforts [10,11].
Though sustainability has been a ubiquitous theme in the tourism literature for many years, limited work has reported research results from a comprehensive sustainable tourism planning and design effort. The research reported in this paper emerged from a stakeholder involvement process that was incorporated into a sustainable tourism plan in a community experiencing challenges with overtourism. Koens et al. [12] conclude that much tourism design work focuses on improving experiences at the individual level or at the strategic level, both of which miss the complexity of destination development with its many stakeholders. They suggest the need for coordinated and structured stakeholder involvement to facilitate sustainable solutions, especially in well-developed destinations. Likewise, Guo et al. [13] conclude that diverse stakeholders must be involved in policy development based on a review of the tourism policy literature.
In this study, research in a community with a dominant tourism industry was conducted to test a newly proposed conceptual framework drawing from the literature rooted in tourism studies and urban planning. Relationships that are critical to understanding community design, which is subsumed in the concept of place qualities (PQs) and their relationship to place value (PV), which is also conceptualized as QOL in research, were investigated. Given the current understanding of concepts and relationships in community design and QOL [1], this study highlights a community engaged in a sustainable tourism planning process to strategize how to manage sustainability, overtourism, and residents’ PV evaluations. Informing a sustainability plan co-created by community stakeholders, primary data on PQs and PV were collected. The purpose of this paper is to empirically examine the relationship between tourism-related PQs and residents’ evaluation of PV as a means to contribute to tourism place value theory advancement, operationalize sustainability at the community scale, and address emerging destination issues such as overtourism. This study addresses research gaps in the current literature. It considers the way in which place qualities influence the place value perceived by residents in a tourism destination as a means to address community sustainability issues, a research area that has received modest attention. The research leverages a planning model [14]. that was inductively created from the existing literature and applies an adaptation in a tourism and sustainability planning context with stakeholder involvement. Moreover, this research empirically tests the Tourism Place Value Framework [4]. using quantitative data, a first effort in the literature.

2. Literature Review

2.1. Design in Tourism

A recent trend in tourism planning, which at its inception focused on infrastructure development, is the incorporation of design. Contemporary tourism research considers design to encompass the design of experiences as well as places [15]. While there is a growing body of research regarding experience design [15], research focused on destination design remains sparse. Tussyadiah [3] suggests that design thinking is a creative process that leads to the design of an artifact that can include a tangible entity such as an attraction, a process such as a marketing plan, a system such as software, laws, or human activities. Xiang et al. [13] suggest that design thinking supports the creation of customer value. Schuttari et al. [10] highlight that destination design involves the “active, creative, participatory and concurrent design of places, services, and experiences for both tourists and hosting communities, and for sustainability purposes” (p. 2).
Place design includes tangible and intangible destination characteristics, but much of the limited tourism design research considers the tourist experience. Design thinking, however, encompasses the design of a place as well as an experience while considering the community’s values. It is initiated by discovery, then proposing solutions, and finally evaluating and re-designing, ranging from small to large-scale places [13,16]. Zhang et al. [16] suggest physical design can be categorized as functional design, including utilitarian elements to meet tourists’ needs, or aesthetic design that tends to encompass visual elements. Tourism design can improve the quality of life for residents and tourists and improve destination sustainability [1,4,17]. Most research regarding place design in tourism is conceptual (e.g., [12,18]), though it provides a good overview of tourism experience processes. Schuttari et al. [10] report one of the few examples of research taking a collaborative approach to address the tangible place design issue of traffic congestion by implementing a design intervention in the form of a traffic management system that had overall positive outcomes.
An aspect of tourism design that is largely missing from the literature is the manner in which the built environment design influences tourism experiences from the perspective of community residents. Kim and Fesenmaier [19] propose a framework of tourism experience creation that includes four levels: a sensory or unconscious level, a conscious level where participants are aware of their experience of a place, a cognitive and emotional level where participants actively respond to the place, and an action level that results in memories and learning. The process certainly occurs for residents as well as tourists as they go about their lives in their communities.

2.2. Quality of Life and Tourism

The importance of QOL for community residents and tourism’s effects has emerged as a primary research theme in tourism [5,20,21,22,23]. Uysal and Sirgy, along with colleagues, conducted several studies of tourism and QOL (e.g., [24,25]). Their approach, based on bottom-up spillover theory, finds support for the relationship between residents’ perceptions of tourism and how that affects specific life domain satisfaction and subsequently overall life satisfaction [24]. In a comprehensive review of tourism and the QOL literature, Uysal et al. [25] conclude that (1) the impacts of tourism play a major role in resident QOL both positively and negatively; (2) residents perceive differential impacts of tourism with those who benefit the most viewing it in a more positive light; and (3) residents’ perceptions and attitudes toward tourism and the corresponding QOL levels tend to decrease along with the destination’s development stage.
Based on a QOL measurement method designed by Brown et al. [26] and used for a variety of research purposes, including public planning [27], Andereck and Nyaupane [20] developed a tourism and QOL index specific to tourism-related community impacts. They tested the relationship between QOL and support for tourism development, along with other explanatory variables. Findings indicate some QOL domains are predictors of ‘perceived benefit from tourism’ along with some demographic variables, especially employment in tourism. Four variables predict support for tourism: personal benefit from tourism, the QOL domain of economic strength, employment in tourism, and contact with tourists, mediated by personal benefit. Jordan et al. [28] extended this research using the same measures, finding differing QOL impact perceptions based on the type of tourism. Using slightly modified measures, Liang and Hui [29] report a relationship between QOL domains and support for tourism. They discovered a divergence between residents who view their community as a place to work and therefore support tourism for economic and employment opportunities, and those who view their community as a place to live with more concern about aspects such as the environment and sense of belonging, and therefore were more sensitive to tourism’s impacts. Similarly, Yu et al. [23] report that the perception residents have of tourism impacts affects the QOL in a community, which in turn impacts support for tourism. More recently, Eslami et al. [30] demonstrate support for the relationship between satisfaction with life domains and satisfaction with QOL, which in turn predicts support for sustainable tourism development.
Many other studies investigated the relationship between tourism and QOL, introducing different ways of measurement or new variables [31,32,33,34,35,36,37] as well as traditional measures of the three pillars of sustainability: economic, socio-cultural and environmental impact perceptions and how they affect QOL [25,38]. The conclusion from studies of tourism and QOL is that tourism influences QOL of residents positively and negatively, and that can affect resident support for tourism. A set of contextual factors, community attributes, and resident characteristics influence the nature of relationships among constructs. Part of what can affect those relationships is community design; however, limited research has empirically investigated the relationships between residents’ ratings of community design characteristics and QOL indicators.

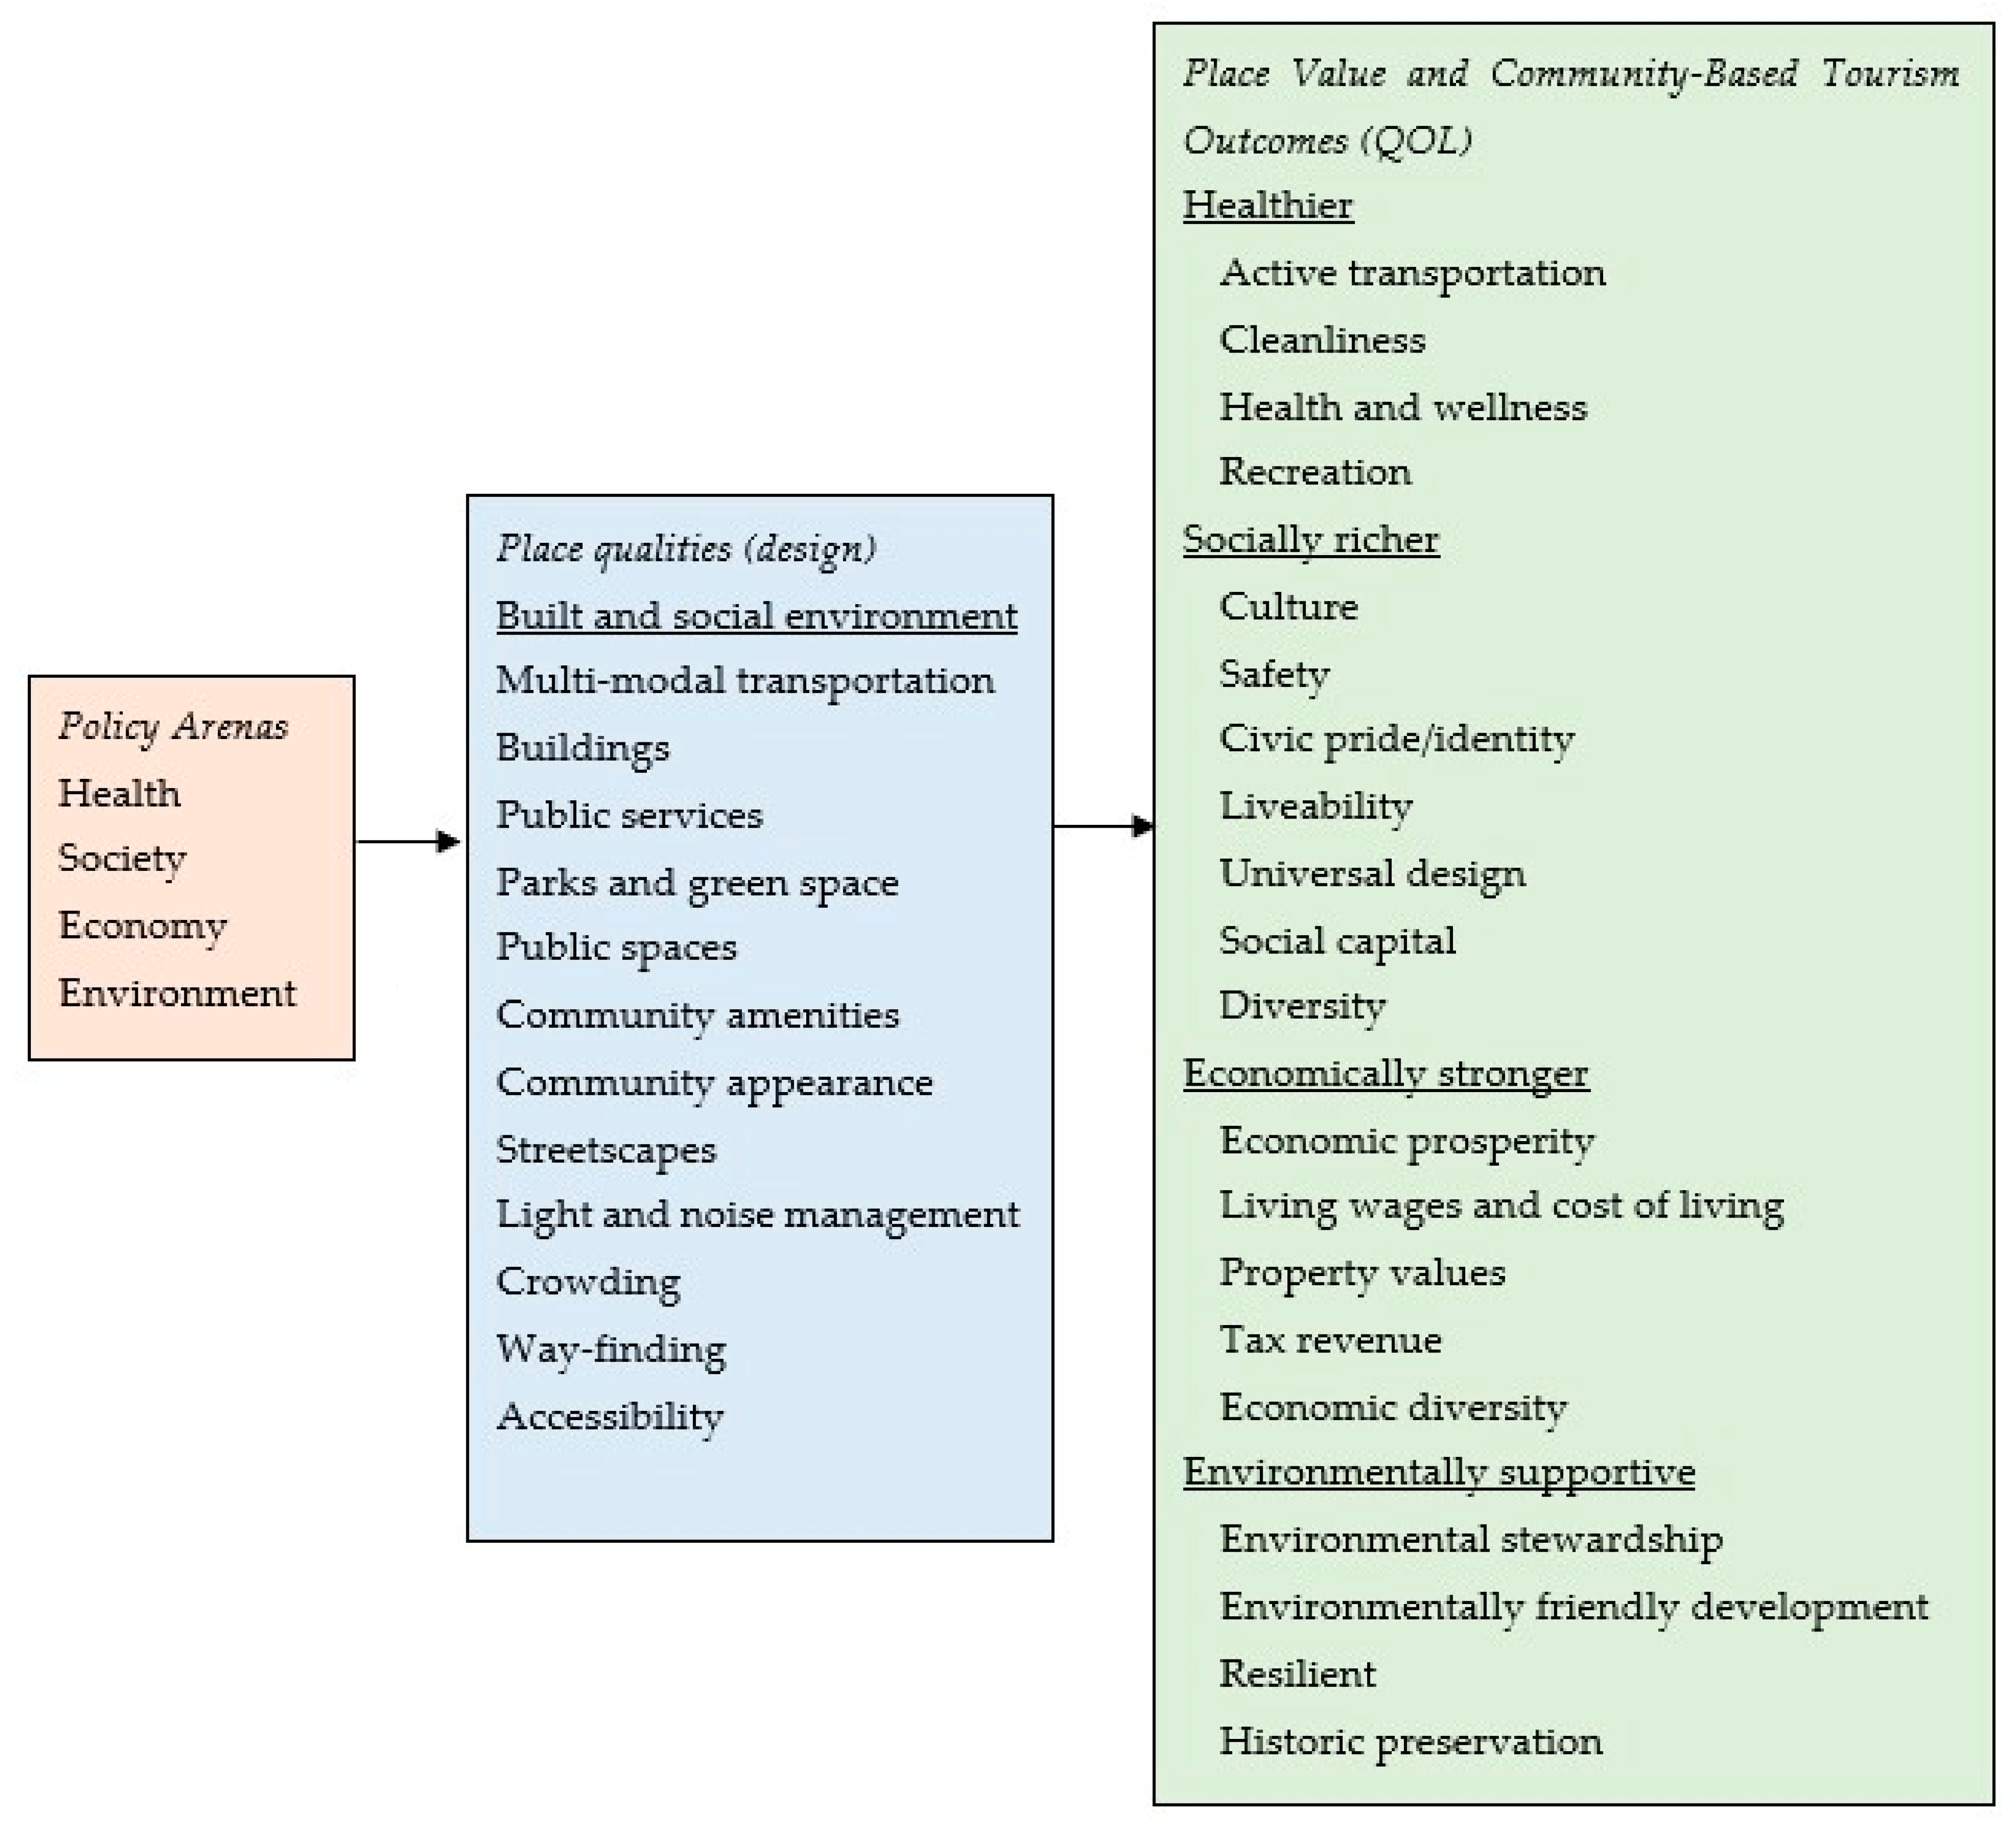
2.3. Design, QOL, Place Qualities, and Place Value

Uysal et al. [5] identify the intersection of design and QOL as an emerging topic. They acknowledge that designing for QOL focuses on designing a destination and destination products for enhanced PQs (design) that add PV (QOL) to a destination, thereby acknowledging the role of the place in affecting QOL. Vogt et al.’s [4] Tourism Place Value Framework, based on the work of Carmona [14], considers the role of PQs (design) in creating PV (QOL outcomes). As discussed by He and Li [39], PQs inform and define PV.
In the urban planning and community development literature (e.g., [14,39,40,41,42]), PQs refer to the physical, social, and environmental attributes that contribute to the overall experience and functionality of a place leading to healthier, economically stronger, environmentally resilient, and socially richer communities. PQs have been defined as “the physical characteristics of a community, the way it is planned, designed, developed and maintained that affect the quality of life of people living and working in it and those visiting it both now and in the future” ([43] Burton, 2014: 5312). Carmona [14] (2019, p. 3) conceptualizes PQ as encompassing concepts including livability, urban environmental quality, and urban design that incorporate ideas about quality of the community environment. Similarity, Lak et al. [42] develop 70 criteria for conceptualizing PQ as sense of place (e.g., heritage values and conservation, aesthetic values), safety and security (e.g., urban safety), and aspects of sustainability (e.g., green space, waste management, public transportation, parking planning, accessibility, noise reduction, environmental protection). Erol and Ciravoğlu [41] focus on social dimensions as a means to further develop indicators of PQ, given the heavy focus on physical qualities at the expense of social and psychological dimensions in academic research. Following a review of relevant research, they develop indicators with the themes of experience, identity, and belonging, and the sub-categories of urban spaces that arouse desire to experience (e.g., safe, clean, aesthetically pleasing, green, controlled noise, low pollution, accessible, diverse transport, walkability, parking, diverse amenities), create meaning with identity (e.g., diverse, protection of heritage), and promote a sense of belonging (e.g., protection of the space). Along with the limited research considering social dimensions of place, Delpino-Chamy and Pérez Albert [44] point out the dearth of research regarding perceptions of the built environment, with research heavily relying on objective indicators to measure PQ. They emphasize the importance of studying the relationship between features of the built environment and human perception of those features.
High PQs enhance PV. PV refers to the socio-cultural, economic, health, and environmental worth of a place to the people who live, work, and visit there [14], in other words, quality of life. It considers how people perceive, experience, and interact with a place beyond its physical infrastructure. A well-designed community with high PV enhances people’s experiences, attracts visitors, and supports a strong economy. Substantial evidence indicates positive economic, social, health, and environmental outcomes are linked with the design of the external built environment. PQs such as recreation opportunities, green space, traffic, walkability, and others affect QOL, which can also be characterized as PV. In fact, Lak et al. [42] conceptualize PQ outcomes as QOL, as do Erol and Ciravoğlu [41], who observe that PQs lie at the intersection of the built environment and life quality. Diverse forms of PV reflect how places are shaped. PQs have a substantial impact on people’s lives and are a critical part of well-being [40]. Guided by the Place Value Framework, Navickas et al. [45] confirm that the way places are designed enhances QOL. They note that evidence demonstrates that design influences PV, including, among other things, lower crime rates, stronger civic pride, greater inclusiveness, less waste and pollution, and ecological diversity.
In an early study, Carmona et al. [46] found a clear link between design and economic, social, and environmental value using an analytical framework to guide a case study with value indicators derived from research. Based on Carmona’s Place Value Framework that was developed later, He and Li [39] developed a set of 22 indicators to measure PQs and PV and tested them in an urban neighborhood renewal context broadly categorized as residential property and value (e.g., property values), public facilities (e.g., recreation facilities, noise, cleanliness), environmental quality and value (e.g., green space, walkability, parking), mobility and transportation (e.g., public transit), public security (e.g., crime), and social cohesion (e.g., sense of belonging). Data were collected qualitatively and reported as levels of importance and satisfaction with the indicators. They affirm that the Place Value Theory was supported and aligns well with their study and its focus, which went beyond the physical environment. They conclude that higher quality places offer greater value via their influence on policy.

2.4. Purpose, Proposition, and Hypothesis

Based on the literature that considers PQs (design) and PV(QOL), the purpose of this paper is to empirically test the relationships between these concepts in a tourism context. Carmona’s [14] Place Value Framework provides a well-supported theoretical underpinning for the relationship between PQs and PV that has been supported by other researchers [45]. The Place Value Framework is predicated on the assertion that the places we inhabit impact our lives both positively and negatively, and our well-being is, at least in part, determined by our experience of place. The framework suggests that policy goals emerge from four primary policy arenas of concern to most governments (health, society, economy, and environment) and are mediated by PQs embodied in the built environment. A high-quality place can be considered “one which returns the greatest value to its users with regard to meeting and sustaining them in healthy, socially rich, and economically productive lifestyles that touch lightly on the environment” [14:4]. In the quest to meet policy goals, value can be added or deducted from place by the built environment which collectively results in PV. A pragmatic way of viewing PV is the extent to which different qualities of the built environment impact public policy goals. Inherent in this view of PV is the idea that benefits resulting from interventions that influence the built environment flow to community stakeholders. Thus, PV can be defined as “the diverse forms of value generated as a consequence of how places are shaped” [40:584]. A reciprocal relationship exists in that adding PV increases desirable qualities of the built environment. Thus, there is a “virtuous loop,” whereby PQs deliver PV and PV defines PQs. PV results in health, social, economic, and environmental outcomes [40:24].
Building on Carmona’s Place Value Framework, a tourism-specific Place Value Framework is proposed that links PQs (design of the built environment) to PV (QOL) (Figure 1). The Tourism Place Value Framework focuses on PQs that are often influenced by tourism and the PV (or QOL) outcomes they generate. To address the previously identified research gaps, as well as Erol and Ciravoğlu’s [41] and Delpino-Chamy and Pérez Albert’s [44] assertions that social dimensions of place and perceptions of the built environment are underrepresented in community research, the Tourism Place Value Framework was empirically tested.
One proposition to suggest general theoretical concepts and a supporting hypothesis to test relationships is based on the Tourism Place Value Framework:
P1. 
Tourism-related place qualities (design) contribute to or detract from the place value (QOL) experienced by community residents.
H1. 
There is a relationship between residents’ perceptions about place qualities (design features) in their community and evaluation(s) of place value (QOL).

3. Methods

The study site in the USA is an attractive destination among tourists. Like many popular destinations, the community is experiencing overtourism and the resulting negative QOL impacts and resident discontent. The rural community, with a population of about 9700 [47], hosts more than 3.2 million visits a year [48], exceeding several objective indicators for many destinations widely recognized as being in an overtourism situation [49]. Advancing sustainable tourism approaches implies that stakeholders, particularly residents, have a voice in the design and management of a community [22]. In a large stakeholder study, primary quantitative data were collected via customized surveys of residents, tourists, and business owners/managers, each appropriate for the relevant population, to measure support for community sustainability. This paper is delimited in scope to the resident survey on perceptions regarding PQs and PV indicators to test the Tourism Place Value Framework. Residents experience the implications of PQs on a day-to-day basis, so they are most able to have well-formed opinions. The research approach was primarily quantitative, so the magnitude and direction of support for various community policies and plans could be widely considered. There was a need for community municipal departments to create metrics to be employed in future years to monitor changes in residents’ perceptions and sustainability outcomes. A large quantity of qualitative comments shared on the questionnaires support many of the quantitative findings.

3.1. Sampling and Data Collection

The population of residents was limited to those within the city’s limits to reduce possible differences in city services and exposure to tourism flows relative to unincorporated areas. The best list for the population of residents was the county tax assessor’s database, inclusive of all homeowners. A limitation of this study is that those who rent housing were not surveyed, and not all homes in the community were owner-occupied (e.g., short-term rentals); however, 73 percent of residents live in their own homes [47]. Liang and Hui [29] found that homeowners may be less positive than renters. A questionnaire specifically soliciting input for the community’s sustainable tourism plan was sent using a mail survey [50] with a mailing of a survey packet, a reminder postcard about a week later, and a second survey packet in another two weeks. A systematic random sample of 1000 residents yielded 376 returned questionnaires for a response rate of 38 percent, which is a strong response rate for current survey research. For a population of about 10,000, this represents a +/− four percent margin of error at the 95 percent confidence interval. Table 1 provides an overview of respondents’ demographic characteristics. The sample can generally be described as primarily older, well educated, and affluent, and fairly representative of the community. Methods were reviewed and approved by the university’s Internal Review Board.

3.2. Measurement and Analysis

Strategies to maximize the reliability and validity of measurement scales were used. Response style bias and common method bias were controlled through questionnaire design and by including both positive and negative indicators [51,52], heterogeneous item sets, and methodological and psychological separation of measures [51]. Recent studies suggest the number of answer categories is not a factor in response style bias and that, though response styles can result in bias, that bias is small with limited effect on results [52]. Residents were asked a series of questions specifically framed as focusing on tourism, quality of life, and sustainability. Community partners were heavily engaged with questionnaire development to ensure relevance to residents and meet their needs for community planning.
Measures of PQs of particular relevance to the community were operationalized as community design features consistent with studies in urban planning and tourism that employed similar indicators [14,20,41,42]. Respondents were asked to rate their perception of the current state of 13 community design features that are influenced by tourism on five-point scales from ‘too little’ to ‘too much’ (TLTM scale). The TLTM rating scale allows respondents to evaluate various characteristics or behaviors on a continuum from ‘too little’ to ‘too much,’ with an option for ‘the right amount’ at the midpoint [53]. The scale is an innovative method designed to measure a curvilinear rather than a linear relationship [54]. Related to the principle of too-much-of-a-good-thing in management, the measure acknowledges that phenomena are contextual and even antecedents that are often considered beneficial may reach a point at which their relationship to desired outcomes becomes nonlinear and negative [55]. It acknowledges that high and low levels of an outcome can be detrimental and that there is an optimal point in between. The TLTM scale emphasizes the importance of context in evaluating outcomes. It prompts raters to consider whether an outcome is appropriate given the specific situation, acknowledging that outcomes can vary depending on contextual factors. The scale provides a psychological measurement tool that captures the nexus between outcomes and contextual appropriateness [54]. The scale can be used to assess community aspects such as amenities or social services, allowing respondents to distinguish between optimal and excessive or deficient levels of community characteristics, or in this study, place qualities. By framing survey questions to evaluate community aspects such as amenities or social services, respondents can indicate whether they perceive these elements as insufficient (‘too little’), adequate (‘the right amount’), or excessive (‘too much’).
For part of the analysis, the five-point PQ measures were collapsed into a trichotomous measure of ‘too little’, ‘about right’, and ‘too much’ due to low responses in some of the answer categories [56] (Table 2). A small number of responses in answer categories can compromise the validity of analysis, leading to several concerns, including violation of assumptions and unreliable estimates of the group mean [57]. Comparing categories can be appropriately carried out in some cases when the categories are conceptually and empirically similar, as they are in this case, measuring either an excessive or insufficient condition for the element being measured [58]. Collapsing categories is usually preferable to analyzing data with few responses in extreme categories and results in more accurate estimation of parameters [56].
PV and community-based tourism outcomes, operationalized as resident quality of life, were measured with 23 indicators [20]. Andereck and Nyaupane’s [20] tourism and QOL index emerged from tourism impacts and attitudes research and is derived from measures of importance and satisfaction with tourism impact indicators. They note that indicators should take account of both the importance and satisfaction of QOL (PV) domains because it is only possible to interpret domain satisfaction within the context of the importance of the domain; thus, the measure reflects both satisfaction and the extent to which an individual values the domain. The two measures are then used to create a weighting structure. This specific method of measuring QOL, using importance and satisfaction with indicators and deriving an index, was conceived by Renwick and Brown [59] and further developed by Massam [27] in urban planning studies. The index results in a ratio level measure designed to accentuate indicators that are most important (highest values) relative to satisfaction. A score of 20 denotes the indicator has the highest importance and highest satisfaction; a score of 1 denotes the indicator has the highest importance but lowest satisfaction.
On five-point scales, respondents evaluated how important each indicator was to them personally, and then how satisfied they were with each indicator. Indices were computed for each item following Andereck and Nyaupane’s (2011) [20] method, with an overall composite score ranging from 20 to 1. Using these kinds of indicators and measurement methods has a long history in QOL research and has been found to be reliable and valid over time, thereby providing important information about how respondents evaluate their lives [22,25,60]. The measures and resulting index were validated by Andereck and Nyaupane (2011) [20] and used entirely or in modified forms since they were developed in studies that found the measures to be reliable and valid and published in top-ranked journals (e.g., [29,30,31,32,33,61,62,63]). See Figure 2 for a summary of the study variables and hypothesis.
Descriptive statistics were estimated for these sets of indicators. To test the relationship between PQs and PV, the indices were factor analyzed using principal component analysis (PCA) with varimax rotation to provide a smaller number of multi-item constructs consistent with previous research. PCA is used to reduce the dimensionality of a dataset by identifying patterns in the data, revealing a smaller number of uncorrelated variables. The primary purpose of PCA is to summarize and simplify data, transforming original variables into a smaller set of new variables that retain most of the original data’s variability. It helps to uncover the underlying structure of data, especially when variables are correlated. PCA is most appropriately applied to data when there are patterns in the relationships among variables, preferably based on theory or prior research [64]. Further, the trichotomous measure of PQ was used. A series of MANOVA tests were then performed using PQs as independent variables (IVs) and PV as dependent variables (DVs) based on the Tourism Place Value Framework. The main purpose of MANOVA is to assess whether groups defined by the IV(s) differ across a combination of dependent variables. It does this by analyzing the variance–covariance structure of the data, taking into account the relationships among DVs and controlling for Type I error. MANOVA is useful when there are more than two related DVs, IVs are categorical, DVs may be correlated, and to identify pattern effects across multiple outcomes [57], which are all conditions that match the measurement and data structure. Pillai’s Trace (V) was the model statistic to test for significance in the overall MANOVA model, controlling for potential intercorrelations of the dependent variables, while univariate statistics were provided for each dependent variable. Post hoc tests were conducted to determine specific mean differences in PV domains for each design feature.

4. Findings

The data provide an empirical lens into a tourism destination experiencing overtourism and applying community planning and design principles and sustainability principles as potential solutions. Table 2 presents a perception measure of PQs for the study context. A score of 3 is interpreted as a preferred position or status quo. Scores other than 3 suggest residents desire change in PQs. Using a mean score, many items are close to 3 or an ‘about right’ evaluation. Traffic, tourist volumes, and noise are evaluated as ‘too much,’ and public transportation, walkability, public restrooms, roads, and parking are evaluated as ‘too little.’ While there are features that need more change than others, overall, this evaluation of community PQs is mostly positive.
The importance of most PV indicators is highly rated (Table 3). The most important items are environmental indicators, city services, and city cleanliness. Ratings of satisfaction on these PV indicators are generally positive. Residents indicate fairly high levels of importance but low levels of satisfaction on several measures of crowding in various places in the community. Diversity and economic aspects of PV are all considered important, and residents lean toward satisfaction with all but diverse employment and the economy. The PV index provides a more nuanced interpretation. At the highest point of the index values are public services and public safety, and the lowest values of the index are related to crowding, due primarily to tourists. The composition of the economy (heavy reliance on tourism) and the affordability of goods and services and real estate are next in order of lower-performing PV indicators.
Factor analysis of PV indicators resulted in four dimensions (Table 3). Community environment consists of 11 items related to the nature of the community environment (alpha = 0.89, mean = 13.2). Factor two, community crowding, is comprised of four crowding items (alpha = 0.83, mean = 6.2). Community diversity consists of three items related to diverse characteristics of the community (alpha = 0.60, mean = 10.2). The alpha value for this factor is somewhat lower than preferred, though still acceptable given the small number of indicators and the items being conceptually related [65]. Community economy is comprised of five items related to the sources of city revenue and prices (alpha = 0.68, mean = 10.1).
The results of the MANOVA analyses with significant differences are presented in Table 4. Lower scores indicate a greater distance between importance and satisfaction with the indicator. The results support the hypothesis that there is a relationship between residents’ perceptions about place qualities and evaluation of place value in their community. Overall, crowding is perceived as a problem in the community. Respondents who report that the current number of tourists visiting the community is ‘too much’ report lower PV scores related to crowding and diversity than those who perceive the number of tourists is ‘too little’ or ‘about right’. Similarly, the crowding PV domain is impacted by the amount of traffic, with a lower score for those who feel there is ‘too much’ and a higher score for those who feel the amount of traffic is ‘about right.’ It should be noted, however, that almost all respondents reported too much traffic (90%), so results may be influenced by this strong judgment about traffic.
Noise is another PQ that influences PV. Again, crowding emerges as a primary PV issue, and for this variable, so does environment and economy. Similarly, the built environment affects crowding and the environment. The last PQ that tends to affect residents’ crowding-related PV is public transportation, but in the opposite direction, with those who feel there is too much public transportation having a lower PV score (though this is only 5% of respondents).
Two other PQs have a significant relationship with PV indicators. The variety of attractions in the community impacts diversity; respondents who feel the variety of attractions is about right tend to have higher PV scores (i.e., there is less disparity between importance and satisfaction ratings). Community walkability affects PV. Respondents who indicate it is too little have lower PV scores for environment and diversity than those who report that it is about right or too much. Finally, perceptions regarding the amount of several PQs exhibit no influence with respect to respondents’ PV scores on night lighting, restaurants, direction signs, trails, disability access, parking, roads, and public restrooms.

5. Discussion

The community that served as the research context for this study needed to better understand tourism dynamics in sustainable community planning and administration and foresee solutions to an overtourism situation based on the community’s values [1]. Recent research has begun to consider the role of design in tourism experiences and community sustainability planning for residents [1,4]. Currently, there is limited empirical evidence examining how design and sustainability function in the tourism system at a community scale. Design has the potential to influence those who live in communities and community sustainability [10], thus, resident-focused research is needed. This study illuminates the importance of PQs as an element that influences PV for residents by testing the theoretical relationship between residents’ perceptions regarding PQs (community design) and evaluation of PV (QOL) within the context of a stakeholder-engaged community sustainable tourism planning process. The results provide support for the hypothesis that there is a relationship between perceptions about PQs and PV. It is clear from the results that many of the PQs in the community influence residents’ PV, thus supporting the proposition that PQs contribute to or detract from PV. Evidence suggests that the Tourism Place Value Framework holds promise as a research framework for ongoing research.
Communities, such as the one studied, with a substantial tourism sector, can experience sustainability challenges. Crowding and congestion are major issues for residents [5,9,32,62]. One notable finding in this study is the emergence of community crowding as its own PV construct. The PQs usually associated with congestion are all related to low community crowding PV evaluations. In particular, tourism-related traffic emerges as a primary concern among residents, as others have found. Traffic as a primary impact is noted by Sánchez-Banyón, [9], Jordan et al. [32], and Mihalic and Kuscer [38] in overtourism contexts. Other design aspects of the community influence the PV crowding domain. The sheer number of tourists on the streets and trails has a deleterious effect on PV. Trailhead parking is often at capacity, and the central district is packed with people. Noise is related to overtourism and has a detrimental effect on residents. In addition to traffic noise, the community experiences helicopter scenic overflights and off-highway vehicle (OHV) noise on streets and trails. The built environment is a relevant design feature influencing crowding (PV). There is a perception among residents that there are too many lodging facilities, and this finding is likely a function of that concern to some extent. Interestingly, the view among residents that new commercial lodging is continually being added, which emerges in open-ended comments on the questionnaires, is perceptual; the major increase has been in short-term rentals, which gives an impression of many more hotel rooms and a new tourism segment that lives in neighborhoods among full-time residents.
One of the relationships between PQs and crowding PV seems counterintuitive, and that is the link with public transportation. Usually, public transportation is viewed as a means to reduce traffic congestion; however, in this study, residents reporting ‘too much’ public transportation also evaluated crowding PV worse than those who view it as ‘about right’ or ‘too little.’ Perhaps these residents feel that tourists are able to access more places with public transportation, thereby increasing congestion. There can also be problems with some public transport temporarily blocking traffic, such as buses stopping for passengers. Alternatively, there is the possibility that this is an attitude problem; Americans are notoriously car-oriented, and public transportation use is low, especially among the affluent.
There are three PQs that differentially affect the community environment PV domain. Community environment PV encompasses aspects of the community that are very important to residents. Noise and the built environment have a negative relationship to the environment, and walkability has a positive relationship. Interestingly, while crowding emerges as a negative influence on PV, it is the community environment with its positive effect on PV that is most important to residents. They live in this rural community and endure the crowding because of the desirable physical and social environment. Other researchers noted the importance of the community’s environment to residents’ PV [23,30,62].
Another PV domain affected by PQs is that of community diversity. While the quality of employment and diverse economy measures seem like they might have fallen into the community economy construct, this result likely emerges separately as a reflection of residents’ opinions that the community is overly dependent on tourism. It is probable that some residents feel the role of tourism as the primary economic sector in the community results in many of the community’s cultural activities being more tourist-oriented than resident-oriented and less authentic than they could be. Open-ended comments on the questionnaires suggest both may be correct. There is an interesting relationship between the variety of attractions and PV; those who rate the variety of attractions as ‘about right’ report higher diversity PV than others. Perhaps residents feel ‘too much’ draws in more tourists, or the attractions have little appeal for residents, while ‘too little’ limits options for residents. Some of this dichotomy was evident in comments on the questionnaires, with some noting that community amenities tend to be tourist-oriented and others acknowledging that tourism positively influences amenities. The availability of amenities for residents as a result of tourism is often one of the findings of resident studies [23,30,62] and this provides somewhat contradictory evidence for this common result. Conversely, diversity PV is enhanced by walkability, most likely due to its effect on the overall atmosphere of the community and the ability to access resources easily while avoiding traffic and parking constraints.
Only one PQ, noise, is related to the community economy. This may be an indirect reflection of residents’ concerns with overtourism and overdependence on tourism, which in this community is in part associated with noisy tourist activities (OHVs and overflights). The economy construct does not emerge particularly strongly as a PV issue in contrast to other studies [20,30,62]. This is a community with a large segment of high socio-economic status residents and many retirees, but a large tourism sector, so it is the influence that tourism has on the overall atmosphere or ethos of the community (community environment) that tends to be a bigger PV concern than the economy. Another characteristic of the community likely contributing to these findings is that many people who are tourism-dependent, employees in tourism, cannot afford to live in the community and live in neighboring areas, so they are not included in the sample as residents.
It is important to review the nonsignificant relationships; those PQs that do not differentially influence PV. Several of these features are likely not as relevant to residents as to tourists, so they are not a factor in resident PV evaluations: directional signs, parking lots, disability access, and public restrooms. Trails and restaurants do not impact PV evaluations. There are numerous restaurants and trails in or near the community, and residents generally think the number is about right. Roads were expected to emerge related to the crowding construct, but residents may be ambivalent about roads. Though more roads may reduce traffic congestion, they also have an environmental impact and may result in even more traffic with the increased capacity. There may also be concerns about roads encroaching on neighborhoods. While tourism is often associated with a high level of light pollution, lighting at night is not related to PV evaluations. Though on average residents think there is somewhat too much night lighting, the community has managed this PQ and carries the International Dark Sky Community designation.

5.1. Implications for Designing Tourism Places

It is obvious that some community PQs, such as roads and traffic flow, need to be re-designed, walkability enhanced, and the number of tourists managed or reduced in the community if resident PV is a priority. The number of hotels should stay at the status quo, and short-term rentals regulated and preferably reduced to lessen negative PV impacts. These findings have implications beyond this one community when destinations are facing overtourism conditions. Overtourism is quite clearly connected to crowding [7,9], which must be managed to provide positive PV for residents and community sustainability. Management actions to address sustainability solutions, such as controlling or reducing traffic and the number of visitors overall, are critical. This can include street re-design, shuttle systems, better parking options, bicycle lanes and parking, and/or less destination marketing. Though public transportation does not seem to be favorably viewed by residents, some types may help reduce traffic and should be considered. Walkability can be enhanced by pedestrian-friendly design. Many actions enhance sustainability and are important for destinations seeking to improve sustainability as well as reduce crowding and congestion. Noise is quite clearly one of the most impactful design features that must be mitigated to improve PV, both in this community and in others [9,29]. While the community highlighted in this study has some unique noise issues, such as scenic overflights and OHV traffic, others may have other types of noise concerns. Studies of tourism and QOL have generally not included noise as an issue, but it should be included when investigating QOL and PV to determine its impact on residents.
Community leaders should pay particular attention to PQs that maintain environmental and social quality while decreasing crowding and noise and increasing walkability and alternative transportation, as this is the most important PV domain to residents. Design decisions that negatively affect the community’s environment are likely to be met with a hostile response, while those that improve it will be viewed favorably and enhance PV and sustainability. Community environment in many tourism destinations is very important to residents [20,29,61]. Residents often live in destination communities for the same reason tourists visit: the attractive physical and social environment.
Early indications suggest that the community has taken study recommendations seriously. A community transportation plan has been developed with traffic-easing measures put into place. A fly friendly agreement with helicopter companies is active to reduce noise. Dark Sky-compliant lighting is required for new development, and Leave No Trace principles are actively promoted. A variety of conservation programs are operating, such as zero waste events and water bottle fill stations. These actions demonstrate the ecological validity of findings.
From a policy perspective, residents are not supportive of any increases in tourism and would prefer decreases. It is the PQs relevant to overtourism that come to the forefront as problematic for city leaders: having too much of any of these features is associated with lower evaluations of PV. Many destinations with overtourism issues will probably find similar results.

5.2. Implications for Theory Development

The conceptual place value model developed by Carmona [14], which was modified by Vogt et al. [4], proposes that PQs (design) contribute to or detract from PV and community-based tourism outcomes (QOL) experienced by residents. This study supports the Tourism Place Value Framework as a first attempt to empirically demonstrate the relationship between PQs and PV as perceived by residents in a tourism destination. There is strong theoretical support for this proposition in the planning literature [14,39,40,41,42,44,45], but added empirical research specific to tourism outcomes is needed to further test and enhance the framework where sustainability planning and management is being considered or implemented. Using PQ (community design features) research measures from urban planning and tourism and PV (QOL) measures from tourism, the findings here advance evidence that links PQ and PV outcomes together in a tourism destination. Investments in new or modified PQs can be considered by communities to evaluate the positive, neutral, or negative influence on residents’ PV. Continuing empirical research in this area will deductively support a robust theory to explain the current and central theme of sustainability trade-offs that tourism elicits in communities for residents and/or tourists.

6. Conclusions

One of the most significant aspects of this research is the use of its findings in an actual planning and implementation process. This paper provides insights for potential smart destination sustainability solutions to many of the PQs and conditions that are becoming a concern to not only this community but also others. As demonstrated with residents’ views of PQs and evaluations of PV, this approach allowed citizens and community leaders to reflect on strengths and opportunities to create a more livable, sustainable community with a robust tourism economy. The creation of a sustainable tourism destination plan can have significant consequences for the health of people and ecosystems, preservation of social structures, overall standard of living for residents, and a business climate for emerging services and products that support tourism and the broader community.
This study has limitations to consider. It is preliminary in nature and though it provides evidence of causal relationships, those relationships cannot be assumed without additional empirical testing and theoretical refinements. It was conducted in one community experiencing overtourism, which is a concern in some communities, but not others. The context of this planning project undoubtedly affected the results; the prominence of resident concerns about crowding-related PQs and their effect on PV may not occur in communities without overtourism. The research was conducted in conjunction with community leaders, so their ideas for questionnaire items and sampling were taken into consideration. Field-based community research is often not ideal from a theoretical and methodological standpoint, as is evident from the sample, which included only homeowners. This work provides valuable information for the community and was used to support the tourism plan and its implementation; along with the other community and tourist input processes, it can serve as a model for other communities. Moreover, the empirical results can be a foundation for future work investigating the influence of place qualities on community-based tourism place value outcomes.

Author Contributions

Conceptualization, K.L.A. and C.A.V.; methods, K.L.A. and C.A.V.; validation, K.L.A. and C.A.V.; formal analysis—K.L.A.; investigation, K.L.A. and C.A.V.; data curation, K.L.A. and C.A.V.; writing—original draft preparation, K.L.A.; writing—reviewing and editing, C.A.V.; visualization K.L.A.; supervision, K.L.A. and C.A.V.; project administration, C.A.V.; funding acquisition, K.L.A. and C.A.V. All authors have read and agreed to the published version of the manuscript.

Funding

This research was funded by the Sedona Arizona Chamber of Commerce. No funding was provided for publication costs.

Institutional Review Board Statement

This study was conducted according to the guidelines of the Declaration of Helsinki and approved by the Institutional Review Board of Arizona State University (protocol code STUDY00007485; 20 December 2017).

Informed Consent Statement

Informed consent was obtained from all subjects involved in this study.

Data Availability Statement

The dataset presented in this article is not readily available because it is partly owned by the funding organization. Requests to access the dataset should be directed to the primary author.

Conflicts of Interest

The authors declare that this study receivedfundingfrom Sedona Chamber of Commerce. The funder was not involved in the study design, collection, analysis, interpretation of data, the writing of this article or the decision to submit it for publication.

References

  1. Xiang, Z.; Stienmetz, J.; Fesenmaier, D.R. Smart tourism design: Launching the Annals of Tourism Research curated collection on designment tourism places. Ann. Tour. Res. 2021, 86, 103154. [Google Scholar] [CrossRef]
  2. Fesenmaier, D.R.; Xiang, Z. Introduction to tourism design and design science in tourism. In Design Science in Tourism: Foundations of Destination Management; Fesenmaier, D.R., Xiang, Z., Eds.; Springer: Vienna, Austria, 2017; pp. 3–16. [Google Scholar]
  3. Tussyadiah, I.P. Toward a theoretical foundation for experience design in tourism. J. Travel Res. 2014, 53, 543–564. [Google Scholar] [CrossRef]
  4. Vogt, C.A.; Andereck, K.L.; Pham, K. Designing for quality of life and sustainability. Ann. Tour. Res. 2020, 83, 102963. [Google Scholar] [CrossRef]
  5. Uysal, M.; Berbekova, A.; Wang, J. Quality of life: A critical examination of research progress. Tour. Manag. 2025, 107, 106070. [Google Scholar] [CrossRef]
  6. Liburd, J.; Duedahl, E.; Heape, C. Co-designing tourism for sustainable development. J. Sustain. Tour. 2022, 30, 2298–2317. [Google Scholar] [CrossRef]
  7. Pham, K.; Vogt, C.A.; Andereck, K.L. Overtourism: A Potential Outcome in Contemporary Tourism—Concepts, Indicators, and Impacts. In Sustainable Development and Resilience of Tourism: Wellbeing and Quality of Life Perspectives; Chhabra, D., Atal, N., Maheshwari, A., Eds.; Springer International Publishing: Cham, Switzerland, 2024; pp. 165–186. [Google Scholar]
  8. UNWTO. ‘Overtourism’? Understanding and Managing Urban Tourism Growth Beyond Perceptions; United Nations World Tourism Organization (UNWTO): Madrid, Spain, 2018. [Google Scholar]
  9. Sánchez-Banyón, A.; Daumann, F. European tourism sustainability and the tourismaphobia paradox: The case of the Canary Islands. Sustainability 2025, 17, 1125. [Google Scholar] [CrossRef]
  10. Schuttari, S.; Pechlaner, H.; Erschbamer, G. Destination design: A heuristic case study approach to sustainability-oriented innovation. Ann. Tour. Res. 2021, 86, 103068. [Google Scholar] [CrossRef]
  11. Volgger, M.; Cheer, J.; Pforr, C. Evidence-informed decision-making in sustainable tourism: From research to action. J. Sustain. Tour. 2025, 33, 1–15. [Google Scholar] [CrossRef]
  12. Koens, K.; Smit, B.; Melissen, F. Designing destinations for good: Using design road mapping to support pro-active destination development. Ann. Tour. Res. 2021, 89, 103233. [Google Scholar] [CrossRef]
  13. Guo, Y.; Jiang, J.; Li, S. A sustainable tourism policy research review. Sustainability 2019, 11, 3187. [Google Scholar] [CrossRef]
  14. Carmona, M. Place value: Place quality and its impact on health, social, economic and environmental outcomes. J. Urban Des. 2019, 24, 1–48. [Google Scholar] [CrossRef]
  15. Stienmetz, J.; Kim, J.J.; Xiang, Z.; Fesenmaier, D.R. Managing the structure of tourism experiences: Foundations for tourism design. J. Destin. Mark. Manag. 2021, 19, 100408. [Google Scholar] [CrossRef]
  16. Zhang, H.; Zach, F.J.; Xiang, Z. Design standardization by Airbnb multi-unit hosts: Professionalization in the sharing economy. Ann. Tour. Res. 2023, 98, 103523. [Google Scholar] [CrossRef]
  17. Uysal, M.; Berbekova, A.; Kim, H. Designing for quality of life. Ann. Tour. Res. 2020, 83, 102944. [Google Scholar] [CrossRef]
  18. Volgger, M.; Erschbamer, G.; Pechlaner, H. Destination design: New perspectives for tourism destination development. J. Destin. Mark. Manag. 2021, 19, 100561. [Google Scholar] [CrossRef]
  19. Kim, J.; Fesenmaier, D.R. Tourism experience and tourism design. In Design Science in Tourism; Fesenmaier, D.R., Xiang, Z., Eds.; Springer: Vienna, Austria, 2017; pp. 17–29. [Google Scholar]
  20. Andereck, K.L.; Nyaupane, G.P. Exploring the nature of tourism and quality of life perceptions among residents. J. Travel Res. 2011, 50, 248–260. [Google Scholar] [CrossRef]
  21. Hu, R.; Li, G.; Liu, A.; Chen, J.L. Emerging research trends on residents’ quality of life in the context of tourism development. J. Hosp. Tour. Res. 2024, 48, 131–152. [Google Scholar] [CrossRef]
  22. Uysal, M.; Sirgy, M.J. Quality-of-life indicators as performance measures. Ann. Tour. Res. 2019, 76, 291–300. [Google Scholar] [CrossRef]
  23. Yu, C.; Cole, S.T.; Chancellor, C. Resident support for tourism development in rural midwestern (USA) communities: Perceived tourism impacts and community quality of life perspective. Sustainability 2018, 10, 802. [Google Scholar] [CrossRef]
  24. Kim, K.; Uysal, M.; Sirgy, M.J. How does tourism in a community impact the quality of life of community residents? Tour. Manag. 2013, 36, 527–540. [Google Scholar] [CrossRef]
  25. Uysal, M.; Sirgy, M.J.; Woo, E.; Kim, H. Quality of life (QOL) and well-being research in tourism. Tour. Manag. 2016, 53, 244–261. [Google Scholar] [CrossRef]
  26. Brown, I.; Raphael, D.; Renwick, R. Quality of Life Profile. Item 2; Quality of Life Research Unit, Center for Health Promotion, University of Toronto: Toronto, ON, USA, 1998; pp. 78–136. [Google Scholar]
  27. Massam, B.H. Quality of life: Public planning and private living. Prog. Plan. 2002, 58, 141–227. [Google Scholar] [CrossRef]
  28. Jordan, E.J.; Vieira, J.C.; Santos, C.M.; Huang, T.Y. Do residents differentiate between the impacts of tourism, cruise tourism, and Airbnb tourism? In Methodological Advancements in Social Impacts of Tourism Research; Routledge: Oxfordshire, UK, 2023; pp. 15–33. [Google Scholar]
  29. Liang, Z.X.; Hui, T.K. Residents’ quality of life and attitudes toward tourism development in China. Tour. Manag. 2016, 57, 56–67. [Google Scholar] [CrossRef]
  30. Eslami, E.; Khalifah, Z.; Mardani, A.; Streimikiene, D.; Han, H. Community attachment, tourism impacts, quality of life and residents’ support for sustainable tourism development. J. Travel Tour. Mark. 2019, 36, 1061–1079. [Google Scholar] [CrossRef]
  31. Gautam, V. Why local residents support sustainable tourism development? J. Sustain. Tour. 2023, 31, 877–893. [Google Scholar] [CrossRef]
  32. Jordan, E.J.; Spencer, D.M.; Prayag, G. Tourism impacts, emotions and stress. Ann. Tour. Res. 2019, 75, 213–226. [Google Scholar] [CrossRef]
  33. Jordan, E.J.; Lesar, L.; Spencer, D.M. Clarifying the interrelations of residents’ perceived tourism-related stress, stressors, and impacts. J. Travel Res. 2021, 60, 208–219. [Google Scholar] [CrossRef]
  34. Jordan, E.J.; Vogt, C.A. Residents’ perceptions of stress related to cruise tourism development. Tour. Plan. Dev. 2017, 14, 527–547. [Google Scholar] [CrossRef]
  35. Mathew, P.V.; Sreejesh, S. Impact of responsible tourism on destination sustainability and quality of life of community in tourism destinations. J. Hosp. Tour. Manag. 2017, 31, 83–89. [Google Scholar] [CrossRef]
  36. Su, L.; Huang, S.; Huang, J. Effects of destinations social responsibility and tourism impacts on residents’ support for tourism and perceive quality of life. J. Hosp. Tour. Res. 2020, 42, 1039–1057. [Google Scholar] [CrossRef]
  37. Yang, E.; Kim, J.; Gibson, H.J.; Thapa, B. The impact of resilience on community variations in the relationships between tourism and quality of life. J. Destin. Mark. Manag. 2024, 33, 100928. [Google Scholar] [CrossRef]
  38. Mihalic, T.; Kuscer, K. Can overtourism be managed? Destination management factors affecting residents’ irritation and quality of life. Tour. Rev. 2022, 77, 16–34. [Google Scholar] [CrossRef]
  39. He, S.; Li, Y. Understanding impacts of neighbourhood micro-renewal through a lens of place value: A case study of Wuhan, China. Land 2024, 13, 1910. [Google Scholar] [CrossRef]
  40. Carmona, M. Public Places Urban Spaces, 3rd ed.; Routledge: New York, NY, USA, 2021. [Google Scholar]
  41. Erol, Z.Ç.; Ciravoğlu, A. The social dimensions of place and place quality indicators in urban space. Int. J. Built Environ. Sustain. 2025, 12, 111–122. [Google Scholar] [CrossRef]
  42. Lak, A.; Sharifi, A.; Khazaei, M.; Aghamolaei, R. Towards a framework for driving sustainable urban regeneration with ecosystem services. Land Use Policy 2021, 111, 105736. [Google Scholar] [CrossRef]
  43. Burton, M. Quality of Place BT. In Encyclopedia of Quality of Life and Well-Being Research; Michalos, A.C., Ed.; Springer: Dordrecht, The Netherlands, 2014; pp. 5312–5314. [Google Scholar]
  44. Delpino-Chamy, M.; Pérez Albert, Y. Assessment of citizens’ perception of the built environment throughout digital platforms: A scoping review. Urban Sci. 2022, 6, 46. [Google Scholar] [CrossRef]
  45. Navickas, V.; Skripkiūnas, T.; Tanas, J.; Trojanek, M. The influence of architecture on real estate market value: A methodological framework. J. Int. Stud. 2020, 13, 38–53. [Google Scholar] [CrossRef]
  46. Carmona, M.; Magalhães, C.D.; Edwards, M. What value urban design? Urban Des. Int. 2002, 7, 63–81. [Google Scholar] [CrossRef]
  47. United States Census Bureau. U.S. Census. Available online: https://www.census.gov (accessed on 12 February 2025).
  48. Arizona Commerce Authority. Community Profiled. Available online: https://www.azcommerce.com/a/profiles/ (accessed on 12 February 2025).
  49. Peeters, P.; Gössling, S.; Klijs, J.; Milano, C.; Novelli, M.; Dijkmans, C.; Eijgelaar, E.; Hartman, S.; Heslinga, J.; Isaac, R.; et al. Research for TRAN Committee—Overtourism: Impact and Possible Policy Responses; European Parliament, Policy Department for Structural and Cohesion Policies: Brussels, Belgium, 2018. [Google Scholar]
  50. Dillman, D.A. Mail and Internet Surveys: The Tailored Design Method, 2nd ed.; John Wiley & Sons: Hoboken, NJ, USA, 2000. [Google Scholar]
  51. Kock, F.; Berbekova, A.; Assaf, A.G. Understanding and managing the threat of common method bias: Detection, prevention and control. Tour. Manag. 2021, 86, 104330. [Google Scholar] [CrossRef]
  52. Pleininger, H. Mountain or molehill? A simulation study on the impact of response styles. Educ. Psychol. Meas. 2016, 77, 32–53. [Google Scholar] [CrossRef]
  53. Dupré, S.; Heyde, F.; Vergauwe, J.; Wille, B. Too little, just right or too much? Assessing how people evaluate their conscientiousness levels. Personal. Individ. Differ. 2022, 197, 111789. [Google Scholar] [CrossRef]
  54. Vergauwe, J.; Wille, B.; Hofmans, J.; Kaiser, R.B.; Fruyt, F.D. The too little/too much scale: A new rating format for detecting curvilinear effects. Organ. Res. Methods 2017, 20, 518–544. [Google Scholar] [CrossRef]
  55. Pierce, J.R.; Aguinis, H. The too-much-of-a-good-thing effect in management. J. Manag. 2013, 39, 313–338. [Google Scholar] [CrossRef]
  56. DiStefano, C.; Shi, D.; Morgan, G.B. Collapsing categories is often more advantageous than modeling sparse data: Investigations in the CFA framework. Struct. Equ. Model. 2021, 28, 237–249. [Google Scholar] [CrossRef]
  57. Field, A. Discovering Statistics Using IBM SPSS Statistics, 4th ed.; Sage Publications Limited: New York, NY, USA, 2013. [Google Scholar]
  58. Gelman, A. Data analysis using regression and multilevel/hierarchical models. JEM 2009, 45, 94. [Google Scholar]
  59. Renwick, R.; Brown, L. The Center for health promotion’s conceptual approach to quality of life: Being, belonging and becoming. In Quality of Life in Health Promotion and Rehabilitation; Renwick, R., Brown, L., Naggler, M., Eds.; Sage: Thousand Oaks, CA, USA, 1996; pp. 75–88. [Google Scholar]
  60. Diener, E.; Inglehart, R.; Tay, L. Theory and validity of life satisfaction scales. Soc. Indic. Res. 2013, 112, 497–527. [Google Scholar] [CrossRef]
  61. Seabra, C.; Almeida, S.; Reis, M. Quality-of-Life perception among young residents and visitors: The impact of COVID-19. Sustainability 2022, 14, 16177. [Google Scholar] [CrossRef]
  62. Suntikul, W.; Pratt, S.; Kuan, W.I.; Wong, C.I.; Chan, C.C.; Choi, W.L.; Chong, O.F. Impacts of tourism on the quality of life of local residents in Hue, Vietnam. Anatolia 2016, 27, 405–420. [Google Scholar] [CrossRef]
  63. Zhao, S.; Nyaupane, G.P.; Andereck, T.K. Exploring the differences between educational and escapist experience stagers: A multi-perspective approach. Tour. Rev. Int. 2015, 19, 105–122. [Google Scholar] [CrossRef]
  64. Tabachnick, B.G.; Fidell, L.S. Using Multivariate Statistics, 7th ed.; Pearson: London, UK, 2019. [Google Scholar]
  65. Clarke, I. Extreme response style in cross-cultural research: An empirical investigation. J. Soc. Behav. Personal. 2000, 15, 137–152. [Google Scholar]
Figure 1. Tourism Place Value Framework. Source: Adapted from Carmona [14].
Sustainability 17 04582 g001
Figure 2. Summary of study variables and hypothesis.
Sustainability 17 04582 g002
Table 1. Demographics of respondents *.
DemographicsPercentages
Gender48% male, 52% female
AgeMean: 67 years old
Education44% advanced degree, 30% college degree, 26% below college or technical school
Residency74% full-time, 26% part-time
Average: 15 years of residency
Household annual income52% over USD 100,000, 13% below USD 50,000, and
35% in between
Involvement in tourism82% not employed in tourism, 18% employed in tourism
* The residents studied were homeowners.
Table 2. Community place qualities (PQs) rated by residents.
PercentCurrent Perception
Mean a
Community FeaturesToo
Little
About Right Too Much
Amount of traffic0.50.88.218.971.54.6
Number of tourists0.081.629.423.245.04.1
Noise0.82.251.826.219.03.6
Lighting at night3.66.159.413.517.43.4
Variety of attractions3.112.570.88.94.73.0
Restaurants2.212.271.79.74.23.0
Trails1.99.777.08.33.03.0
Directional signs4.711.973.74.45.32.9
Disability access4.113.876.84.70.62.8
Built environment (buildings, parks, and transportation systems)7.825.054.49.73.12.8
Parking lots16.530.247.53.12.82.5
Roads18.023.054.52.81.72.5
Public restrooms14.431.950.62.60.62.4
Overall community walkability22.224.147.94.41.42.4
Public transportation38.330.327.32.51.72.0
a Scale: 1 = too little; 3 = about right; and 5 = too much.
Table 3. Factor analysis of resident place value (PV) measures and composite indices.
Means
QOL IndicatorsImportance aSatisfaction bComposite Index cFactor
Loading
Community Environment (variance explained = 22.2%, alpha = 0.89, omega = 0.89, scale mean = 12.7)
Attractiveness/cleanliness4.83.713.20.767
Limited litter and vandalism4.83.713.50.748
Safety/lack of crime4.84.015.00.748
Public safety (police, fire, etc.)4.74.115.20.693
Preservation of cultural/historic sites4.63.613.00.635
Conservation of natural areas4.83.411.70.634
Clean air and water4.83.512.50.603
Peace and quiet4.73.210.80.561
Authentic culture3.73.311.10.536
Quality recreation opportunities4.23.612.50.469
Community identity3.93.512.00.465
Community Crowding (variance explained = 12.7%, alpha = 0.83, omega = 0.83, scale mean = 6.2)
Crowding in other areas of town4.22.36.90.818
Crowding of roads4.61.74.20.796
Crowding in the uptown district3.82.16.20.773
Crowding of trails4.22.58.00.711
Community Diversity (variance explained = 9.5, alpha = 0.60, omega = 0.60, scale mean = 10.2)
Diversity and quality of employment3.72.89.00.737
Cultural activities for residents3.93.210.60.624
Diverse economy3.62.89.00.567
Community Economy (variance explained = 9.4%, alpha = 0.68, omega = 0.69, scale mean = 11.0)
Fair prices of goods and services4.23.010.10.722
Adequate tax revenues to support city services3.93.311.50.592
High standard of living4.23.512.50.590
Reasonable real estate costs3.53.110.20.558
Tourist spending3.13.211.10.432
a Importance scale: 1 = not at all important to 5 = extremely important. b Satisfaction scale: 1 = not at all satisfied to 5 = extremely satisfied. c Index scale: 1 = lowest QOL evaluation to 20 = highest QOL evaluation.
Table 4. Relationship between community place qualities (PQs) and place value (PV) dimensions.
Place Qualities
(Independent Variables)
Place Value
Dimensions
(Dependent
Variables)
MeansUnivariates
Too
Little
About RightToo MuchFp
Number of touristsEnvironment13.913.812.212.80.00
Crowding9.7 a8.3 a5.2 b45.30.00
Diversity11.3 a10.2 ab9.2 b5.30.01
Economy11.211.810.511.40.00
Model statistics: V = 0.23; F = 11.0; p = 0.00
Amount of trafficEnvironment14.813.712.63.20.04
Crowding7.6 a10.0 b5.9 a23.50.00
Diversity10.511.19.44.50.01
Economy11.412.410.85.20.01
Model statistics: V = 0.14; F = 6.3; p = 0.00
NoiseEnvironment15.0 a13.4 b11.7 c16.80.00
Crowding8.2 a7.3 a5.0 b24.50.00
Diversity9.1 9.99.1 3.70.03
Economy12.1 a11.3 ab10.5 b5.40.01
Model statistics: V = 0.15; F = 7.1; p = 0.00
Built environment Environment12.6 a13.1 a11.5 b4.30.03
Crowding6.2 a6.6 a4.8 b5.10.03
Diversity10.110.910.43.80.02
Economy9.19.89.02.50.01
Model statistics: V = 0.06; F = 2.4; p = 0.03
Public transportationEnvironment12.812.711.61.20.33
Crowding6.4 a6.2 a4.0 b4.40.01
Diversity9.310.010.11.90.20
Economy10.510.911.10.40.65
Model statistics: V = 0.05; F = 2.3; p = 0.02
Variety of attractionsEnvironment12.912.712.30.50.62
Crowding6.16.45.41.70.18
Diversity8.3 a9.9 bc8.9 ab7.90.00
Economy10.511.210.33.50.03
Model statistics: V = 0.07; F = 3.2; p = 0.04
Community walkabilityEnvironment12.3 a13.0 ab14.0 b4.00.02
Crowding6.06.47.31.70.18
Diversity8.9 a10.0 ab10.7 b7.60.00
Economy10.711.211.32.10.13
Model statistics: V = 0.06; F = 2.2; p = 0.02
Note: Means with the same superscript are not different at the 0.05 level.
Disclaimer/Publisher’s Note: The statements, opinions and data contained in all publications are solely those of the individual author(s) and contributor(s) and not of MDPI and/or the editor(s). MDPI and/or the editor(s) disclaim responsibility for any injury to people or property resulting from any ideas, methods, instructions or products referred to in the content.

