Article

Integrating Sustainability Indicators in Conceptual Design of Footbridges: A Decision-Support Framework for Environmental, Economic, and Structural Performance

by
Valeria Gozzi
1,2,* and
Leidy Guante Henriquez
1,3
1
DACD—Department of Environment Constructions and Design, University of Applied Sciences and Arts of Southern Switzerland (SUPSI), 6850 Mendrisio, Switzerland
2
DISEG—Department of Structural and Geotechnical Engineering, Politecnico di Torino, 10129 Turin, Italy
3
DABC—Department of Architecture, Built Environment and Construction Engineering, Politecnico di Milano, 20133 Milan, Italy
*
Author to whom correspondence should be addressed.
Sustainability 2025, 17(10), 4562; https://doi.org/10.3390/su17104562
Submission received: 24 March 2025 / Revised: 25 April 2025 / Accepted: 9 May 2025 / Published: 16 May 2025

Abstract

:
Sustainability is increasingly prioritized in infrastructure design; however, its integration into the conceptual design phase remains limited, particularly for pedestrian bridges, where structural performance plays a critical role. While existing frameworks address environmental and economic impacts in later stages, they typically fail to incorporate structural performance and sustainability holistically at the outset. To address this gap, this study introduces a quantitative decision-support framework tailored for the conceptual design of footbridges. The methodology integrates five key indicators, Global Warming Potential (GI), Total Cost (TC), Robustness (RO), Inspection (IN), and Maintenance (MA), using a Multi-Criteria Decision Making (MCDM) approach, specifically the Weighted Sum Model (WSM), supported by Pearson correlation analysis, to identify trade-offs and interdependencies among metrics. The framework is tested on two real-world case studies involving steel pedestrian bridges in different urban contexts. The results reveal a strong correlation between inspection and maintenance, suggesting that designs optimized for inspection accessibility can significantly reduce life cycle maintenance efforts and costs. Robustness appears to be largely independent from environmental impact, indicating the potential to improve structural resilience without compromising sustainability. Furthermore, cost–sustainability relationships are shown to be highly context-dependent. The practical implications of these findings are substantial: by offering a structured, data-driven tool for early-stage evaluation, the framework enables engineers, urban planners, and policymakers to make informed design choices that align with long-term sustainability goals. It offers a methodological basis for comparing design options based on quantifiable sustainability and structural metrics, contributing to evidence-based decision making in line with evolving standards for sustainable infrastructure.

1. Introduction

Sustainability has become a fundamental principle in infrastructure design, driven by growing concerns over climate change, resource depletion, and societal well-being. Among various infrastructure types, pedestrian bridges play a crucial role in promoting sustainable urban mobility by enhancing connectivity, reducing vehicular congestion, and supporting environmentally friendly transportation alternatives. Despite their significance, sustainability considerations in pedestrian bridge design are often confined to later project phases, limiting the ability to influence outcomes effectively during early design stages. As commonly defined in the literature and in technical standards (e.g., EN 16310:2013 [1]), conceptual design and preliminary design represent the initial phases of a design process; for the sake of simplicity, this study adopts both terms interchangeably. During these early design steps, key sustainability and structural performance decisions have the greatest potential to impact long-term sustainability. However, they are frequently based on qualitative assessments rather than structured, quantitative methodologies. Life Cycle Sustainability Assessment (LCSA) has emerged as a comprehensive approach to evaluating sustainability across environmental, economic, and social dimensions in the construction sector [2,3]. This methodology integrates Life Cycle Assessment (LCA) [4,5], which quantifies environmental impacts such as carbon emissions and resource consumption; Life Cycle Costing (LCC) [6], which evaluates economic feasibility; and Social Life Cycle Assessment (S-LCA) [7], which considers societal implications such as accessibility and equity. While LCA and LCC are well established in infrastructure design, S-LCA remains underdeveloped and lacks standardized assessment methodologies. This gap is particularly relevant for pedestrian bridges, where social factors such as accessibility and integration into urban networks are critical considerations [8]. The recent literature shows a growing interest in applying these methodologies to infrastructure projects, notably bridges and footbridges (Dai & Ueda [8], De Wolf et al. [9], Anastasiades et al. [10]). However, challenges remain, including the lack of robust tools for quantifying social impacts [11] and the variability of economic analyses due to incomplete data during the conceptual (or preliminary) design phase [12]. In pedestrian and cycling bridges, where structural aspects are crucial, the relationship between sustainability and structural performance remains largely unexplored. Moreover, recent updates in standards and regulations have incorporated additional criteria, including robustness, maintenance, and inspection, alongside traditional safety and functionality requirements [13]. Nevertheless, a standardized framework that systematically integrates these aspects is still lacking.
Even existing sustainability rating systems, including Envision, Greenroads, and BREEAM Infrastructure, provide general frameworks for sustainability assessment but do not explicitly incorporate structural aspects such as robustness, maintenance, and inspection within their evaluation criteria. As a result, there is currently no widely accepted framework that quantitatively integrates sustainability principles with key structural performance indicators in the conceptual design phase of pedestrian bridges.
To address this gap, this study proposes a quantitative decision-support framework specifically tailored to the conceptual design of footbridges. The framework combines selected sustainability and structural performance indicators, evaluated through a Multi-Criteria Decision Making (MCDM) approach and further analyzed using Pearson correlation to explore interdependencies. The indicators and their detailed formulations are presented in Section 3 and Section 4. The framework’s applicability is demonstrated through two case studies, suggesting how sustainability and structural considerations can be jointly assessed at an early stage, supporting more balanced, data-driven design decisions. The framework revealed three key insights: (i) inspection and maintenance were strongly correlated, emphasizing the importance of accessible design in reducing long-term resource demands; (ii) robustness and environmental impact were found to be largely independent, suggesting that resilient structural design does not inherently compromise sustainability; and (iii) the cost–sustainability relationships varied significantly between contexts, challenging the assumption that environmentally conscious design always implies higher costs. These findings align with the recent literature, which highlights the value of integrating structural and sustainability metrics from the earliest design stages. In particular, studies on resilience-based infrastructure design and life cycle optimization underscore the need for quantitative, multi-indicator frameworks that support informed decision making when project flexibility is highest.
By offering a structured, adaptable tool for evaluating sustainability in conceptual bridge design, this research contributes to bridging the gap between engineering practice and sustainability-oriented decision making in infrastructure design.

2. State of the Art: Sustainability in Footbridges

This chapter explores the evolution of sustainability methodologies in bridges and footbridges, their application in infrastructure focusing on bridges and footbridges, and the development of Sustainable Infrastructure Rating Systems (SIRSs), and identifies gaps and emerging trends. By combining insights from LCSA methodologies and rating systems, this chapter lays a foundation for addressing the environmental, economic, and social dimensions of sustainable footbridge design.

2.1. Introduction to Sustainability in Bridges and Footbridges

Sustainability considerations dominate discussions in bridge design, as the construction sector contributes significantly to global CO2 emissions. Concrete and steel, which are the primary materials in bridge construction, are among the largest contributors to these emissions [14]. Recent studies have demonstrated the benefits of alternative materials, such as ultra-high-performance concrete (UHPC) and fiber-reinforced polymers (FRP), in reducing material usage and embodied carbon [15,16]. Advances in self-healing concrete and bio-based materials are also being explored to minimize maintenance requirements and extend the life cycle of these bridges [17].
The integration of environmental and economic performance has proven effective in identifying an effective sustainability strategy. Research by Penadés-Plà et al. [18] highlights the role of MCDM methods in balancing cost and environmental impacts during the design phase. Furthermore, modular and prefabricated construction techniques are being increasingly studied for their ability to reduce construction time, labor costs, and material waste [19].
Mathern et al. [20] and Venkateswaran et al. [21] present sustainable practices in bridge design and construction. Sabatino et al. [22] presented a maintenance optimization framework for highway bridges that integrates sustainability concerns into maintenance decisions. Liljenström et al. [23] provide the state of the art of the approaches used for maintenance accounting in sustainable infrastructure assessment. Yadollahi et al. [24] extended the analysis of sustainability using Rating Systems for transportation infrastructure. Through MCDM, they identified critical life cycle factors like durability, local materials, minimal maintenance, and environmental impact reduction during construction. Milani et al. [25] demonstrated how environmental performance depends on material selection and structural configuration for small-span bridge superstructures. Furthermore, advancing resource-use optimization and Circular Economy (CE) principles, Anastasiades et al. [26] explored Design for Disassembly and Adaptability to improve construction and demolition waste management. They also proposed frameworks for assessing circularity in bridge design. Górecki and Núñez-Cacho [27] reviewed case studies to identify challenges in bridge life cycle management, including construction, operation, and decommissioning. Their findings stress the importance of integrating environmental sustainability into bridge design by addressing long-term factors like (i) the use of non-renewable resources and energy, (ii) emissions of harmful substances and greenhouse gases, and (iii) end-of-life recyclability. They highlight the need to incorporate CE principles, including reuse, recyclability, and reconditioning, to improve sustainability.
The studies mentioned above generally apply to infrastructure and, thus, can also serve footbridges; few studies entirely focus on the latter. Providing methodological solutions tailor-made for specific types of infrastructure allows for more targeted metrics matching sustainability aspects with conventional functions and the peculiarities of infrastructure. An approach and an evaluation scheme that are too generic may not provide sufficient information capable of providing support for selecting sustainable and functional design choices. For instance, Van den Broek [28] studied sustainability in pedestrian bridge design to develop a new design process in which sustainability is an integrated criterion from the early design stages; the complexities of the structural sustainability considerations have been limited to one type of infrastructure, thus leading to the development of a practical manual for designing sustainable footbridges. Tromp et al. [29] highlighted sustainability’s role in decision making by comparing life cycle CO2 emissions for steel, concrete, and fiber-reinforced polymer materials. Considerations of relevant design parameters for sustainable performance have been facilitated by focusing on footbridge typology. Instead, Anastasiades et al. [30] proposed circular parameters for footbridge design to support the implementation of CE approaches in infrastructure. They developed a tool for footbridge applications using an existing Building Circularity Indicator [31]. The tool evaluates components, systems, and assembly projects, focusing on material virginity, recyclability, and Design for Disassembly. While this evaluation primarily focuses on structural aspects, it represents an innovative approach to resource-efficient footbridge design and can provide significant support in the design of pedestrian bridges. The contextualization of discoursed pedestrian bridges helped the adaptation of CE indicators from the building to the infrastructure level. Finally, even though academia has not thoroughly studied the social dimension of this kind of structure, Grandić et al. (2024) [32] introduced the theme by addressing universal accessibility concepts in designs and showed its potential to improve not only social but also economic sustainability when effectively integrated. Considering the mobility features of pedestrian bridges, it is clear that studies focusing on infrastructure typologies can be more beneficial when comprehensively addressing sustainability.

2.2. Sustainability Methodologies

Olalekan et al. [33] highlight that, in the field of sustainability, the actual trend is to propose comprehensive analyses that consider environmental (LCA), economic (LCC), and social (S-LCA) aspects, collectively referred to as Life Cycle Sustainability Assessment (LCSA), even for infrastructure projects. Sonnemann and Valdivia [34] explain that LCSA has evolved to address complex sustainability challenges across both private and public sectors, including construction. Initially applied to buildings where energy efficiency and material sustainability were primary concerns, these methodologies are spreading in infrastructure projects. Bridges, roads, and transport systems benefit significantly from LCSA, which evaluates not only environmental and economic impacts but also social factors, such as community connections and economic viability.
Milić et al. [35] emphasize that LCSA enables a comprehensive evaluation of infrastructure by incorporating long-term durability, material sourcing, and community impacts. Their work focuses on the predesign stage and provides a critical review of methodologies applicable to bridges, starting from the LCA and extending to the broader LCSA. Their paper delves into the three sustainability pillars and demonstrates how LCA and LCC are already widely recognized for bridge assessments. While S-LCA, the most recent pillar to be included in sustainability assessments, remains in its early stages, it is increasingly recognized as essential for a comprehensive sustainability analysis and aligns with the growing demand for multidimensional assessments. However, it currently lacks a clearly defined and universally accepted framework [36]. In the absence of such a framework, several methodologies and guidelines provide valuable principles and recommendations for integrating the social dimension into sustainability evaluations. Among these, the UNEP Guidelines for Social Life Cycle Assessment of Products and Organizations [37] serve as a foundational resource, offering flexible approaches to evaluate social impacts across categories such as human rights, labor conditions, and community well-being. Additionally, resources like the ISO 26000: Guidance on Social Responsibility [38], the Handbook for Product Social Impact Assessment (PSIA) [39], and the Social Hotspots Database (SHDB) [40] offer complementary tools for assessing social sustainability. Other frameworks, such as the Nordic Council of Ministers’ guidelines [41], the Global Reporting Initiative (GRI) standards [42], and metrics developed by the Roundtable for Product Social Metrics [43], further support the integration of social aspects into life cycle assessments. Despite these efforts, the lack of standardization across these methodologies and missing data in the preliminary phase poses challenges for consistency and comparability, underscoring the need for further research and development to establish a robust and universally recognized framework.

2.3. Sustainable Infrastructure Rating Systems

The methodologies discussed in Section 2.2, such as LCA, LCC, and S-LCA, in addition to being the foundation for evaluating sustainability, have also influenced the advancements of Sustainable Rating Systems (SRS) for infrastructure, which aim to standardize sustainability assessments for infrastructure projects [44]. For this reason, in recent years, sustainability-related factors have been explicitly considered in the infrastructure life cycle, mostly planning and construction [45], and recently in decommissioning and reuse. Diverse Sustainable Rating Systems (SRS) for infrastructure are currently on the market because of the different nature of projects and their specific needs regarding screening and assessment. However, these are not widely employed because the variety of tools available makes it difficult for project owners and investors to understand which standard to rely on [46].
In this paper, seven SIRSs applicable to bridges (even footbridges) are recognized and compared. The selection of these systems depends on their clarity, usability, and evaluative structure, which must be easily accessible and consultable. The systems are as follows: Greenroads, Infrastructure Sustainability (IS), Envision, INVEST, SuRe, CEEQUAL (Powered by BREEAM), and SNBS Infrastructure [47,48,49,50,51,52,53]. Several publications compare various SIRSs [54,55]. However, the authors propose in the table an overview of each system’s characteristics, highlighting, above all, the project phases considered, number of sustainability indicators, categories, approach types, databases, and benchmarks.
The first column in the table was structured to facilitate a quantitative assessment of sustainability in the preliminary design phase, in which early decisions have the greatest impact. It prioritizes data that reveal how different SIRSs incorporate key evaluation methodologies, particularly LCA, LCC, and S-LCA. By specifying whether these approaches are mandatory, suggested, or absent and detailing the databases and benchmarks used, the table enables a direct comparison of each system’s methodological rigor and applicability. This organization clarifies the extent to which sustainability assessments rely on standardized metrics, ensuring a structured evaluation of their feasibility in early-stage design. The comparison of analyzed systems reveals both similarities and distinctions in how these frameworks approach sustainability in infrastructure projects. Despite their varied origins and specific areas of focus, all systems aim to align with global sustainability objectives, including the principles outlined in the United Nations Sustainable Development Goals (SDGs), such as SDG 11 (sustainable cities), SDG 12 (responsible consumption), and SDG 13 (climate action). Each system uses structured categories and indicators to assess projects according to environmental, social, and economic performance metrics, emphasizing sustainable development across the project life cycle. All the evaluated projects, through a life cycle perspective, cover design and construction; most of them include planning, and only a few, such as BREEAM Infrastructure and SuRe, extend this scope to include decommissioning, emphasizing a cradle-to-grave approach. The number of indicators varies significantly, with frameworks like BREEAM Infrastructure offering a detailed system, with more than 200 indicators, while others, like Greenroads and Envision, are more streamlined, using 60–64 indicators. Similarly, the type of infrastructure evaluated differs, with Greenroads focusing on roads and highways, while IS and SuRe include broader categories such as renewable energy, water systems, and urban development [56]. A key point of differentiation is the extent to which LCA, LCC, and S-LCA are incorporated. LCA is widely recognized as a tool to assess environmental impacts and is mandatory in systems like IS, SuRe, and BREEAM Infrastructure, in which it is tied to categories such as resource use and emissions reduction [57]. Greenroads and Invest also recommend LCA, particularly for credits linked to material sustainability and climate resilience, but they do not mandate it [58]. LCC is similarly required or strongly suggested to evaluate the long-term economic efficiency of projects [59]. SuRe stands out for recognizing the value of S-LCA, focusing on social impacts such as equity, community engagement, and workforce well-being, which align with their governance-driven frameworks [60].

2.4. Current Challenges and Gaps in Sustainable Footbridges Design

Despite the progress in sustainability methodologies and rating systems, their application to pedestrian and cycle bridges in preliminary design phases faces significant challenges. One major limitation is the availability of comprehensive data during the early design stages. For instance, while LCA and LCC provide robust tools for evaluating environmental and economic impacts, their effectiveness depends on detailed information about materials, construction processes, and future maintenance needs, often unavailable at the conceptual design phase. S-LCA poses an additional challenge. Unlike LCA and LCC, which have established metrics and frameworks, S-LCA lacks standardization, making it difficult to assess societal impacts such as equity, accessibility, and community well-being. This gap is particularly problematic for infrastructure projects like pedestrian bridges, directly influencing social outcomes through connectivity and inclusiveness.
Furthermore, SIRSs vary widely in scope and applicability, with no universally accepted standard. These systems incorporate different criteria depending on geographic, climatic, and regulatory contexts. For example, many frameworks include localized considerations such as water availability, biodiversity, and climate resilience, but their benchmarks are rarely transferable across regions. Additionally, the integration of CE principles, such as reuse, recyclability, and Design for Disassembly, remains limited. While some systems, like Greenroads, Envision, SuRe, and BREEAM Infrastructure, incorporate elements of circularity—such as resource reuse, waste reduction, and material sustainability—their application in the field remains variable and project-dependent, reflecting the evolving nature of integrating CE principles into infrastructure projects. This gap hinders efforts to minimize resource consumption and waste, particularly in infrastructure with long lifespans and significant end-of-life impacts.
In summary, the primary challenges include the following: (i) Data Limitations. Early-stage sustainability assessments are constrained by incomplete datasets on materials and life cycle parameters. (ii) Social Impact Measurement: The lack of standardized metrics for S-LCA limits its integration into project evaluations. (iii) Regional Disparities. Sustainability frameworks often fail to account for localized environmental and regulatory differences effectively. (iv) CE Integration. The inconsistent adoption of circularity principles reduces the potential for resource efficiency and waste minimization.
Addressing these challenges requires a coordinated effort to enhance data availability, standardize social sustainability metrics, and adapt rating systems to regional needs. Moreover, integrating CE concepts more consistently across methodologies and frameworks could significantly improve sustainability outcomes for pedestrian and cycle bridges. By aligning CE approaches with sustainability goals, a more holistic framework can be developed to support the creation of truly sustainable footbridges. To respond to these limitations and integrate the literature findings into a practical tool, the next section introduces a framework focused on measurable indicators that support sustainability-oriented decisions in the conceptual phase of footbridge design.

3. Sustainability Indicators in Footbridges Conceptual Design

The analyzed systems in Table 1 provide a comprehensive overview of approaches for assessing infrastructure sustainability. While these methods are effective for certifying projects in advanced stages or post-completion, infrastructure sustainability is primarily shaped by decisions made during the planning and early design phases. Bragança et al. [60] highlighted that early design choices significantly influence life cycle impacts and costs, a concept later extended to infrastructure projects by Gupta et al. [60]. This finding aligns with research by Shahtaheri et al. [61], which emphasizes that environmental, economic, and social aspects of infrastructure are often overlooked in early design phases, potentially compromising overall sustainability performance. To achieve sustainability goals, it is crucial to develop methods that support informed decision making during conceptual design. Among the various indicators considered in the reviewed SIRSs, only those meeting the following essential criteria were selected: (i) quantifiable in the conceptual design phase, (ii) directly comparable across projects, (iii) repeatable to ensure consistency, (iv) relevant to sustainability objectives, (v) easily integrable into decision-making processes, and (vi) intuitively understandable by stakeholders. As projects progress, sustainability indicators become more reliable due to their link to quantifiable metrics. However, in the preliminary phase, many SIRS indicators remain qualitative and subjective, despite their significant influence on overall sustainability. Ugwu et al. [62] demonstrate how key performance indicators (KPIs) tailored to infrastructure projects, including bridges, enhance sustainability assessment at early design stages. Similarly, Ashraf et al. [63] propose a framework for infrastructure sustainability assessment that integrates environmental, economic, and social aspects, reinforcing the importance of well-defined quantitative indicators in decision making. This study addresses the existing gap by identifying indicators that can be quantified and objectively assessed in the conceptual design phase. These indicators are based on mathematical calculations, validated databases, and sector benchmarks included in certification systems. While specific project details may influence indicator selection, prioritizing numerical evaluation enhances reliability. Bueno et al. [64] reviewed existing tools for transport infrastructure sustainability assessment, highlighting the necessity of the early-stage integration of life cycle methodologies such as LCA, LCC, and S-LCA. Additionally, Medland et al. [65] emphasize the evolution of sustainability assessment frameworks, demonstrating how early-stage decision making can drive long-term infrastructure performance.
Table 2 summarizes the selected quantitative indicators applicable in the conceptual design of footbridges, where “1” indicates inclusion in the rating system and “0” indicates exclusion. Each indicator is classified under one of the three LCSA pillars: environmental, economic, or social.
Table 2 shows that key indicators include Global Warming Potential (GWP) and Energy Consumption (EC) from LCA, Construction Costs (CCs) and Operational Costs (OCs) from LCC, and Sustainable Transport Use (STU) from S-LCA. The reliability of these estimates varies, with LCA being the most standardized due to its extensive databases and well-established methodologies. LCC, while valuable, is less suitable for early-stage analysis due to the frequent unavailability of detailed financial data for operational and dismantling stages [66]. Similarly, the evaluation of social sustainability through S-LCA remains underdeveloped, as challenges in defining, interpreting, and quantifying social impacts limit its applicability. Sierra et al. [67] highlighted that S-LCA often overlaps with LCC and LCA, showing, for example, that in assessing Sustainable Transport Use (STU), economic, environmental, and social dimensions are deeply interconnected. Given the current lack of standardization and comprehensive assessment frameworks, the authors note that social indicators remain less relevant in the conceptual design phase compared to environmental and economic indicators and consider STU as part of LCC and LCA. As S-LCA continues to evolve, its integration into early-stage infrastructure evaluation will require further methodological advancements.
At this stage of the present study, it is necessary to introduce some critical considerations. As highlighted in Table 2, the most widely used indicators that best meet the previously established criteria are as follows: Global Warming Potential (GWP), Energy Consumption (EC), Construction Costs (CCs), and Operational Costs (OCs). Nevertheless, to propose a method that is both straightforward to implement and capable of considering the entire life cycle of the infrastructure, from the conceptual design phase through to deconstruction and disposal, the authors propose to streamline the indicators into two.
For the environmental category, it is recommended to focus solely on the Global Warming Potential Indicator (GI) indicator. This approach avoids redundancies with Energy Consumption (EC) and ensures that the results are easier to interpret, even for stakeholders without a technical background [68]. The proposed indicator is defined, according to project phases, in Equation (1).
GI = (GPWplanning and design + GPWconstruction + GPWoperation + GPWdecommisioning)/N
where the following apply:
  • GPWi is the global potential warming according to the project phases in CO2-eq.
  • N is the duration of service life in years.
For the economic category, the analysis is extended to include costs related to planning, design, and decommissioning. To address this comprehensively, a specific indicator is introduced to represent the Total Cost (TC), as defined in Equation (2):
TC = (Cplanning and design + Cconstruction + Coperation + Cdecommisioning)/N
where the following apply:
  • Ci are the costs according to the project phases in money.
  • N is the duration of service life in years.
Specifically, it should be noted that these two indicators are defined for the preliminary design phase and aim to assist those involved in the design process in comparing different solutions based on concise economic and environmental concerns, thus promoting the integration of more of these principles into the project. This highlights their distinction from complete LCA and LCC, which require detailed data inputs and careful analysis of the processes involved, provide a comprehensive set of quantitative indicators, and could include future projections and probabilistic risk analyses [69,70].
Another consideration concerns the issue of durability, understood as the reference useful life of the analyzed and compared projects. To ensure that the indicators are effective, it is necessary to consider this variable in the indicators’ calculation, as shown in the above equations.
Figure 1 shows the potential for making sustainability-related decisions throughout an infrastructure project’s life cycle and illustrates the positioning of the framework proposed in this study. It also demonstrates how, as the design phases progress, more detailed information reduces the potential for making sustainability decisions but enables a more refined analysis, shifting the assessment from relying solely on LCA and LCC to incorporating S-LCA.

4. Structural Indicators in Footbridge Conceptual Design

Several studies highlight that structural decisions made in the preliminary and conceptual phases significantly impact project sustainability. In footbridge design, where structural choices dictate long-term performance, their effects on the project life cycle are nonlinear. The extent of this influence is proportional to the degree of uncertainty (availability of information) and inversely proportional to the cost of potential modifications [71]. Figure 2 illustrates this relationship, showing that as projects advance, the impact of structural decisions decreases, mirroring the decline in the potential for sustainable decision making (Figure 1). However, these trends do not follow a strictly linear correlation. Therefore, this chapter investigates which structural indicators could mostly interact with sustainability metrics.
While sustainability assessments traditionally prioritize environmental and economic performance through LCA and LCC, recent research underscores the necessity of incorporating structural performance metrics to ensure long-term sustainability [72,73,74]. Among these, Robustness (RO), Inspection (IN), and Maintenance (MA) emerge as key determinants, influencing resilience, resource efficiency, and life cycle costs. Robust structures are less prone to failure under extreme conditions, reducing the need for resource-intensive retrofitting and ensuring lower material demand over time. Similarly, optimized inspection and maintenance strategies enhance durability, minimize unnecessary interventions, and lower operational costs. Research has shown that robustness mitigates failure risks, reducing life cycle environmental impact Moreover, integrating systematic inspection and scheduled maintenance has been demonstrated to optimize resource efficiency and reduce long-term costs [75]. Bocchini et al. [76] further highlight that resilience-based approaches combining robustness, efficient inspection, and maintenance planning are critical for achieving sustainable infrastructure systems. RO is a fundamental property of resilient structures, reducing susceptibility to progressive collapse and enhancing resistance to extreme loading conditions. According to Eurocode 1 [13] robustness is defined as a structure’s ability to withstand extraordinary events without experiencing disproportionate failure, thereby minimizing structural interventions, material use, and associated energy demand. Bocchini et al. [76], indeed, emphasize that robust structures exhibit lower life cycle environmental impact due to reduced reinforcement requirements, lower failure probabilities, and enhanced durability against climate stressors.
IN and MA are integral sustainability indicators, as efficient monitoring minimizes resource-intensive repairs and extends the functional lifespan of infrastructure. ISO 13822:2010 [77] states that structures designed for efficient inspection exhibit reduced maintenance demands, leading to lower economic and environmental impacts. The correlation between IN and MA, as demonstrated in the next paragraphs of this study, confirms that optimized inspection strategies reduce intrusive maintenance activities, lowering material consumption and energy expenditures. Frangopol et al. (2025) [78] further emphasizes that integrating inspection-oriented design principles mitigates the need for carbon-intensive repairs and reconstruction. The adoption of digital twin models and predictive maintenance algorithms strengthens the sustainability relevance of IN and MA, facilitating optimized maintenance schedules and extending infrastructure longevity. Existing studies propose various quantification methods for RO, IN, and MA, including probabilistic risk assessment [79], multi-criteria decision analysis (MCDA) [80], and life-cycle performance models [81]. However, these methods are primarily applied in later project stages, where more detailed structural data are available, and few studies have explored their application in the conceptual phase. Given that decisions made at early stages exert the greatest influence on long-term sustainability, it is crucial to explore how RO, IN, and MA interact with sustainability indicators at the conceptual design level. To address this gap, the following sections propose a methodological framework for evaluating RO, IN, and MA during conceptual footbridge design.
The proposed formulations for RO, IN, and MA have been constructed by adapting concepts from relevant standards and the literature. RO builds upon the Demand–Capacity Ratio (DCR) used in the GSA (2013) [82] guidelines for progressive collapse analysis. IN follows principles from ISO 13822:2010 [83], introducing a factor for inspection difficulty, while MA incorporates design for maintenance evaluation principles from international guides (FHWA-HIF-22-052 [84] and SHRP2 R19A [85]). Building on these foundational principles, the equations below provide a quantitative representation of the indicators for RO, IN, and MA, each tailored to reflect the specific design considerations outlined in the literature and standards mentioned above.
RO = K∙(1/DCR(GSA))
where the following apply:
  • RO is the robustness indicator.
  • DCR(GSA) is the demand capacity ratio for sectional verification performed as per the Alternate Path Method proposed by GSA (2013) [82].
K is a robustness sensitivity-based factor, considering a simplified risk analysis, and determined through a preliminary assessment that considers the project’s sensitivity to extreme events or disproportionate collapse. It ranges, in four steps, from 1 (minimum sensitivity) to 0.25 (hight sensitivity), and it is defined during the conceptual design phase through a structured evaluation of material behavior, structural configuration, and potential failure mechanisms. Although this approach does not reach the level of detail of risk-based methods typically applied in advanced design stages, it is grounded in validated engineering principles and enables consistent and meaningful comparison of robustness across early-stage design alternatives.
IN = IE∙D
where the following apply:
  • IN is the inspection indicator.
  • IE is the percentage of inspectable components or instrumented–monitored elements on the total number of structural components [85].
D is the inspection difficulty factor ranging from 1.0 (optimal conditions) to 0.25 (critical difficulty). It reflects the accessibility and complexity of performing structural inspections. It is calculated as the average of three sub-factors: (i) physical accessibility of structural elements, (ii) disruption of the function or operation of the bridge during inspection, and (iii) technical complexity, including time, personnel, and equipment required. Although ISO 13822:2010 [77] is primarily developed for existing structures, its qualitative criteria for inspection feasibility, especially those presented in Annex B, are adapted here to define a structured scoring system applicable at the conceptual design stage. This approach allows for consistent, comparative estimation of inspection-related constraints across design alternatives, even in the absence of detailed geometry or access data.
MA = ME∙Q
  • MA is the maintenance indicator.
  • ME is the grade obtained from a dedicated maintenance assessment formular considering the most common international maintenance practice requirements (FHWA-HIF-22-052 [83] and SHRP2 R19A [84]).
Q is the Maintenance Quality factor (Q), ranging from 1.0 (optimal conditions) to 0.25 (severe maintenance conditions). It reflects the complexity and frequency of required maintenance tasks, considering factors like equipment needs, accessibility, and service disruption. It is derived from standard maintenance frameworks and adapted for the conceptual design phase to enable comparative evaluations of maintenance requirements in early design alternatives ISO 15686-7:2017 [86].
The inclusion of RO, IN, and MA within the proposed sustainability assessment framework addresses a critical gap in SIRSs, which currently exclude structural performance indicators from life cycle sustainability evaluations. Prior research demonstrates that structural resilience and life cycle maintenance efficiency are directly linked to environmental and economic sustainability. Their integration enables a more comprehensive evaluation of bridge sustainability, establishing clear relationships between structural performance, GI, and TC. The following sections analyze these relationships in detail, quantifying their impact in the context of conceptual bridge design.

5. Proposed Framework for Sustainability Assessment in the Conceptual Design of Footbridges

5.1. Five Indicators Framework for Footbridge Conceptual Design

The proposed framework is built upon five performance indicators, introduced and formally defined in Section 3 and Section 4 and summarized in Table 3.
To ensure comparison and aggregation, a normalization of each value on a scale from 1 to 6 is applied. Indicator normalization was performed relative to each case study, to enable context-specific comparison of design alternatives. This method is appropriate for the conceptual phase, where project parameters vary widely, and universal benchmarks are not yet established. The goal is to support internal prioritization rather than cross-project ranking.
Since sustainability assessments involve multiple criteria with different units of measurement, a structured approach is required to aggregate these indicators into a single comprehensive evaluation. To achieve this, the Weighted Sum Model (WSM) within an MCDM framework is employed.
WSM is particularly suitable for sustainability evaluations because it enables the combination of diverse indicators into a single score based on predefined weightings. Its linear structure ensures transparency and consistency in ranking design alternatives, making it an effective tool for decision making during the conceptual phase [87]. Another advantage of WSM is its adaptability, allowing indicator weights to be adjusted according to project-specific sustainability priorities. Furthermore, WSM is computationally efficient and widely applied in infrastructure sustainability assessments, making it particularly useful for early-stage evaluations, for which data availability is often limited [88]. However, despite these advantages, WSM alone does not account for complex interdependence between sustainability indicators, as it assumes that all criteria are independent. To further strengthen the methodological robustness of the proposed framework, Pearson.correlation analysis is incorporated to quantify the relationships between indicators. This statistical method provides a robust measure of the strength and direction of interactions, ensuring that redundant or highly correlated variables do not distort the evaluation process. Pearson correlation is particularly valuable in infrastructure sustainability assessments, as it refines indicator selection and weighting, preventing potential overemphasis on highly dependent variables. Several studies have demonstrated the effectiveness of Pearson correlation in infrastructure assessments: applying it in railway sustainability monitoring demonstrates how it enhances decision making by eliminating redundant indicators and highlights the most influential parameters [89]. Similarly, Kalem et al. [90] integrated Pearson correlation into a Data Envelopment Analysis (DEA) framework, improving infrastructure efficiency assessments by refining indicator selection and weight allocation. Furthermore, Suprayoga et al. [91] employed Pearson correlation in road infrastructure sustainability evaluations, confirming its effectiveness in identifying dependencies between environmental and economic indicators, leading to a more reliable life cycle impact analysis. By incorporating Pearson correlation analysis within the framework, the weighting process in WSM is safeguarded against biases, ensuring that highly correlated indicators do not distort sustainability evaluations. This results in a more refined and interpretable assessment, allowing for statistically sound decision making in the conceptual phase of infrastructure design. Furthermore, the integration of WSM, Systems Thinking, and Pearson correlation enhances the framework’s ability to capture complex interactions, ensuring that structural performance, economic feasibility, and environmental impacts are holistically assessed. Recent studies highlight the effectiveness of combining MCDM techniques with Systems Thinking in infrastructure sustainability assessments. Francis and Thomas [92] demonstrated that system dynamics modeling enhances decision-making accuracy by integrating structural, economic, and environmental trade-offs into early-stage assessments. Similarly, Juarez-Quispe et al. [93] showed that applying Systems Thinking in infrastructure projects anticipates long-term sustainability challenges, particularly in materials selection, durability, and maintenance planning. By leveraging WSM for structured numerical evaluation and Systems Thinking for holistic interpretation, this framework provides a balanced and adaptable approach to sustainability assessments in conceptual bridge design.

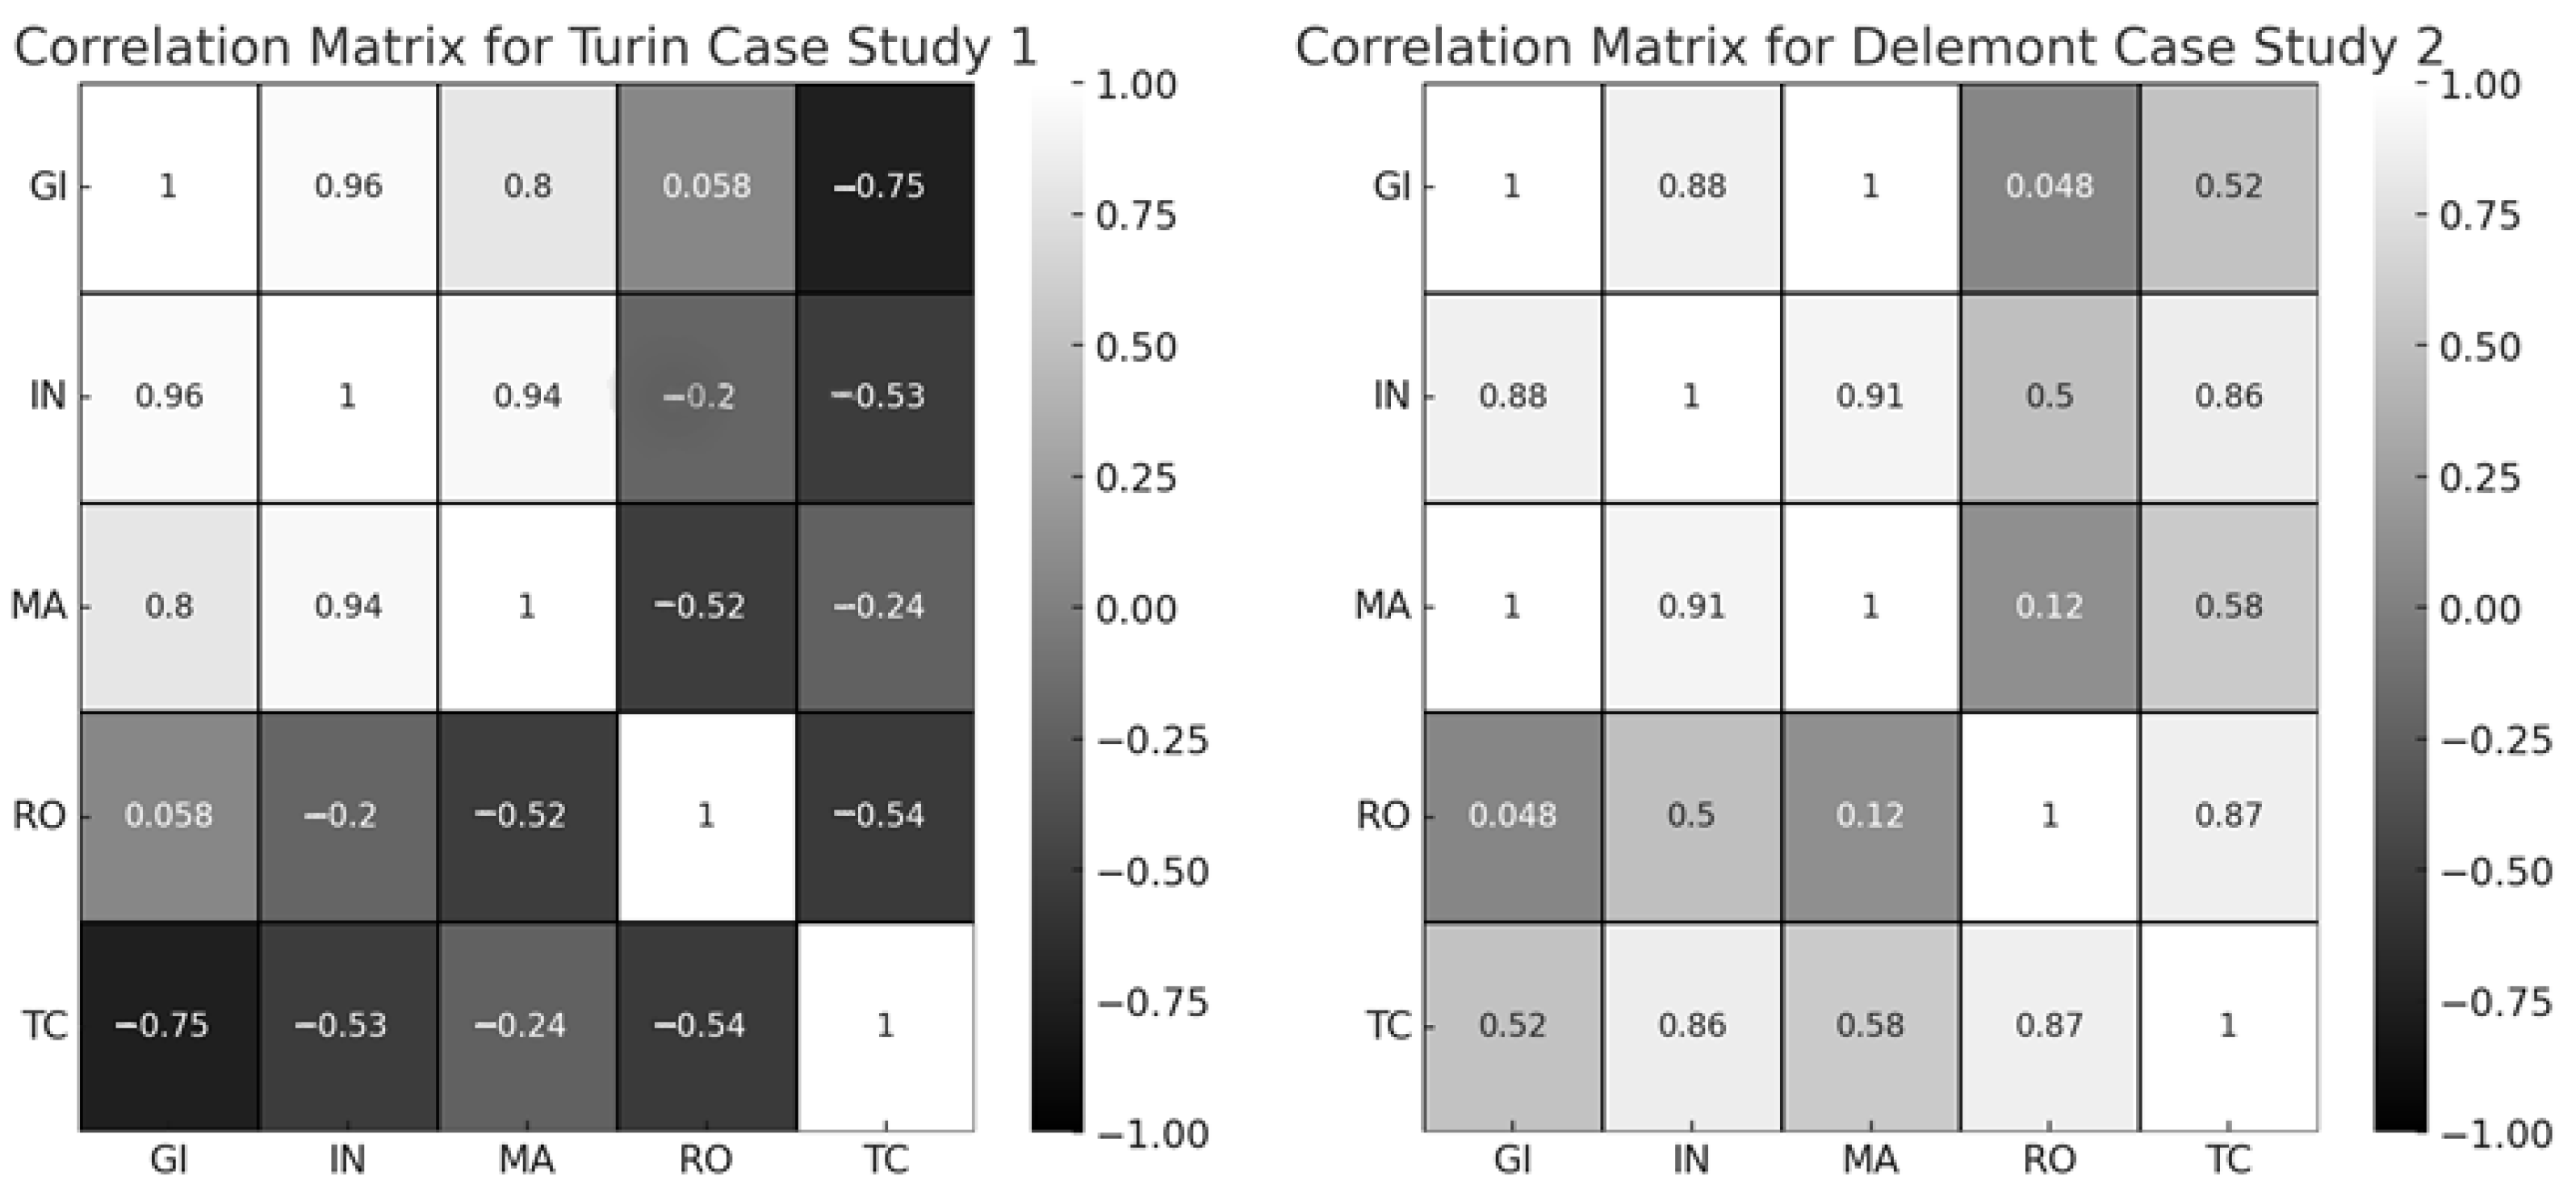
5.2. Case Studies and Results

The proposed methodology outlined in this study has been applied to two case studies, selected for their inclusion of high-quality data and preliminary design documentation. These conditions enabled the testing of the methodology at the conceptual design stage and allowed comparison across diverse urban contexts and design constraints.
Moreover, the two competitions presented different emphases, offering complementary perspectives for methodological validation. The first case study pertains to a preliminary design project for a pedestrian and bicycle bridge in Turin (Italy), and the brief focuses more on structural efficiency. The second case study involves a design competition for a pedestrian and bicycle bridge at the Delémont railway station in Switzerland (FFS, 2023), and the brief encourages greater attention to sustainability aspects.
  • Case study 1
This situation concerns a pedestrian and bicycle bridge designed to overpass the railways in the Turin area, just outside the Porta Nuova Railway station, extending towards the southern part of the city and connecting with the city’s slow mobility system. In the following four diagrams, different statical schemes and configurations are compared. The structural material in this case is not a design variable, as the client requested the use of steel for all options due to construction requirements and to speed up the work.
  • Case study 2
This case study examines the design of a pedestrian and bicycle bridge over the railway at the Delémont train station [94]. The bridge is intended to integrate with the city’s slow mobility system. Due to specific contextual constraints, certain design options, such as arches, suspended systems, and trusses, were immediately excluded. Additionally, as in case 1, materials like concrete and wood were deemed unsuitable due to construction requirements. As a result, the study focused on continuous steel beam solutions, assessing four different structural schemes and cross-sections.
In these two case studies, at this level of analysis, equal weights were applied to all indicators to better analyze their interdependence. Table 4 summarizes indicators’ values.
Furthermore, as can be observed in Figure 3, the normalization of the indicators was conducted relative to the specific case study. This is because no threshold values are imposed on the indicators; instead, the goal is to enable a direct comparison and assess their interrelationships. To facilitate a clear and immediate understanding of the performance differences among the design options, radar charts were used to visualize the normalized indicators for each case study, as shown in Figure 3. This representation also serves as the analytical basis for the subsequent correlation analysis.
As expected, Figure 3 reveals non-linear interactions among the five selected indicators. Therefore, a Pearson correlation analysis is conducted within the assessment framework to further explore the relationships between these indicators. Pearson’s correlation coefficient (r) is a statistical measure used to quantify the strength and direction of linear relationships between pairs of indicators. This method was chosen for its robustness in detecting both direct and inverse linear interdependencies, which is crucial for understanding potential collinearity and trade-offs in sustainability-oriented design evaluation. Pearson’s correlation coefficient is calculated as follows:
r = i = 1 n ( x i x ¯ ) ( y i y ¯ ) i = 1 n ( x i x ¯ ) 2   i = 1 n ( y i y ¯ ) 2
where xi and yi are the normalized values of two indicators across the n = 4 design alternatives of each case study, and x ¯ , y ¯ are the respective means. The input values for this analysis are the normalized indicators shown in Figure 3, which represent the performance of each design alternative in the two case studies. These normalized values ensure comparability and consistency across metrics with different units and scales. Pearson’s correlation coefficient was chosen for its ability to identify both positive and negative linear relationships, enabling a comprehensive understanding of possible collinearity and trade-offs in sustainability-oriented design evaluation. The results of this analysis are summarized in the matrices presented in Figure 4.
The resulting matrices in Figure 4 provide a clear overview of how each indicator is associated with the others, supporting the analysis of dependencies and potential redundancies in sustainability assessments during the conceptual design phase. This analysis is intended as a first step in demonstrating how sustainability and structural indicators can be assessed together at an early design stage. The results presented are based on a limited number of case studies and aim to highlight potential patterns and interactions between the indicators. Further validation of the framework, including additional case studies, will be conducted to refine these insights and ensure broader applicability.
The strong correlation between IN and MA seems to confirm that improved accessibility for inspection is often associated with lower maintenance complexity. This reinforces prior research indicating that enhanced inspection strategies contribute to more efficient long-term maintenance planning [95,96].
Furthermore, in these two cases, the high correlation between IN and MA implies potential collinearity in the weighting process, raising the question of whether these two indicators should be treated as separate variables with equal importance, or whether their weights should be adjusted to reflect their interdependence. Future research could explore whether a combined metric or differentiated weighting approach would better capture their contribution to sustainability assessments. Conversely, the relationship between GI and TC does not exhibit consistent behavior between the different analyses, suggesting that trade-offs between sustainability and cost could be highly context dependent. As reported from previous research [97,98], this means that in some cases, minimizing environmental impact may not necessarily lead to higher costs, and vice versa. The variability could stem from the fact that sustainability-oriented designs may rely on materials or construction techniques that either increase or decrease costs, depending on local availability, market conditions, and project constraints. Unlike the traditional assumption that sustainability improvements always lead to cost escalations [99], these findings suggest that early-stage project decisions, such as material selection and construction methodology, can optimize both sustainability and cost if properly aligned with project-specific conditions.
Interestingly, the near-independence between RO and GI seems to indicate that enhancing structural robustness does not inherently compromise sustainability. This is particularly relevant for designers, as it implies that robust structural solutions, such as increased redundancy or improved material performance, can be achieved without significantly increasing the project’s carbon footprint. This challenges the notion that robustness necessarily leads to higher material consumption and environmental impact. Instead, innovative engineering solutions, such as optimized structural geometries or high-performance materials, can provide enhanced robustness while maintaining environmental efficiency. This finding is consistent with Frangopol et al. [81], who demonstrated that optimizing robustness can be achieved without significantly increasing the environmental impacts of advanced material technologies and innovative structural solutions implemented. The literature suggests that the observed independence between robustness RO and environmental impact (GI) is primarily linked to the adopted design strategies rather than to the specific structural material. By focusing on layout, continuity, redundancy, and detailing, it is possible to enhance robustness without significantly increasing material quantities or embodied carbon, regardless of whether the structure is made of steel, concrete, timber, or FRP. This highlights the potential for material-independent optimization in sustainable structural design [96].
The relationship between robustness and maintenance appears to be complex and remains relatively underexplored in the current literature. While robust structures are generally associated with a reduced likelihood of failure, certain highly robust systems, particularly those involving complex configurations or innovative materials with limited historical performance data, may, paradoxically, require more frequent maintenance [99]. Conversely, simpler but well-designed structures might present lower structural robustness, yet still achieve minimal maintenance demands, especially when accessibility and monitoring are carefully integrated from the early design phase [100]. However, most existing studies address maintenance primarily in terms of its impact on robustness (e.g., as a cause of degradation), rather than exploring a mutual or dynamic relationship between the two. This suggests the need to consider robustness alongside inspection and maintenance strategies when aiming for life cycle sustainability [101]. The lack of a universal trend between TC and GI, as well as the near independence of RO and GI, supports the idea that applying absolute weights across all indicators may not be ideal. Instead, a context-specific weighting strategy, informed by correlation analysis, could provide a more accurate representation of sustainability’s trade-offs.
For decision makers in the conceptual design phase, these findings emphasize the importance of an integrated evaluation approach. The assumption that sustainability, cost, and structural performance are always in direct conflict is overly simplistic. Instead, this study highlights that the relationships among these factors vary significantly, depending on design choices, material specifications, and long-term operational considerations. Therefore, the application of multi-criteria analysis methods, such as WSM combined with correlation analysis, ensures that trade-offs are identified early, allowing for more informed and balanced decision making. These findings underscore the intricate interplay between sustainability, cost, and structural performance in bridge design. The absence of simple linear relationships among key indicators reinforces the necessity of adopting a MCDM framework to systematically balance competing objectives. Penadés-Plà et al. [18] highlighted that MCDM methodologies, such as WSM, provide a structured approach for integrating sustainability criteria into infrastructure decision making. Moreover, Vishnu [102] emphasized that a life cycle perspective in sustainability assessments enhances decision accuracy by capturing interdependence among cost, durability, and environmental impact. By integrating life-cycle-oriented quantitative decision-support approaches with robust correlation analysis, this study ensures a more holistic and data-driven approach to sustainability assessment in conceptual bridge design.

6. Conclusions

This study proposes a quantitative decision-support framework for assessing sustainability in the conceptual design phase of footbridges, where the potential for influencing long-term project outcomes is highest. The framework integrates five key performance indicators representing environmental, economic, and structural dimensions. These indicators were carefully selected based on their quantifiability, comparability, and relevance at early design stages. The aggregation of the indicators was performed using a Weighted Sum Model (WSM) within a Multi-Criteria Decision Making (MCDM) framework, enhanced by Pearson correlation analysis, to detect interdependence and potential redundancies among the variables. This methodology emphasizes transparency, adaptability, and objectivity, allowing stakeholders to evaluate design alternatives using normalized, data-driven criteria without relying on expert-based weighting systems.
The framework was tested on two real-world case studies, each including four design alternatives, for a total of eight design variants. This application enabled a comparative evaluation across different urban and technical contexts. The findings reveal critical interrelations among the sustainability indicators: (i) a strong positive correlation between Inspection (IN) and Maintenance (MA) suggests that designs facilitating inspection access tend to reduce the complexity and frequency of maintenance, thereby improving life cycle efficiency. (ii) The near-independence between Robustness (RO) and Global Warming Potential (GI) indicates that structural resilience can be enhanced without inherently increasing environmental impact. This supports the potential of material-independent optimization through strategic design choices such as redundancy, continuity, and detailing. (iii) The cost–sustainability relationships (Total Cost (TC) and GI) were found to be context-dependent, challenging the conventional assumption that sustainable solutions necessarily entail higher costs. These variations highlight the influence of project-specific constraints and design strategies.
These findings, aligning with the existing literature, confirm the value of integrating structural and sustainability metrics at early stages, and underscore the importance of treating certain indicators, particularly IN and MA, with caution due to potential collinearity in weighting procedures.
Building on the robust foundation established by the current framework, future developments will aim to further enhance their precision, adaptability, and practical relevance across a broader range of infrastructural contexts. One of the primary directions will be the implementation of sensitivity analysis to indicators weighing through Monte Carlo simulations, allowing the assessment of the stability and robustness of sustainability rankings under varying assumptions. This probabilistic approach will offer deeper insights into how different weighting schemes influence decision-making outcomes.
Another key area of development involves addressing potential redundancies among indicators, particularly the high correlation observed between MA and IN in case studies. Future work will evaluate whether these indicators should be combined, reweighted, or reformulated to reduce collinearity and improve the interpretability of aggregated assessments. The framework will also be extended to additional case studies in diverse urban and technical contexts and enriched through the incorporation of empirical data from infrastructure concessionaires and operators, such as maintenance logs, inspection reports, and life cycle cost records. These datasets will support broader methodological validation, enhance the generalizability of the framework, and refine the computational formulations of indicators to better reflect real-world performance. Moreover, this empirical expansion will enable a more accurate evaluation of how advanced material properties influence structural sustainability and will support the development of a structured dataset of design strategies focused on resilience and long-term sustainability.
Finally, the social dimension of sustainability will be further advanced by integrating Social Life Cycle Assessment (S-LCA) into the framework. Future research will focus on defining quantifiable and transferable social indicators, such as accessibility, user equity, and community integration, which are suitable for application during the conceptual design phase. These developments will strengthen the holistic nature of the framework, aligning it more closely with the principles of Life Cycle Sustainability Assessment (LCSA) and the broader goals of sustainable infrastructure development.
To conclude, this work contributes to the growing body of research that seeks to bridge the gap between engineering design practices and sustainability science. By introducing a structured, quantitative, and replicable tool that is independent of material selection and expert subjectivity, the framework enables evidence-based decision making in footbridge design, in which long-term environmental, economic, and structural implications must be carefully balanced. The approach is consistent with and expands upon recent developments in life cycle sustainability assessment and resilience engineering. Furthermore, the insights from the case studies demonstrate that robust, sustainable solutions are achievable without trade-offs, provided that structural and sustainability indicators are addressed jointly from the earliest design stages.

Author Contributions

Conceptualization, V.G. and L.G.H.; Methodology, V.G.; Software, V.G.; Validation, L.G.H.; Resources, V.G. and L.G.H.; Writing—original draft, V.G.; Writing—review & editing, L.G.H. and Supervision: V.G. and L.G.H.; project administration L.G.H.; funding acquisition, none. All authors have read and agreed to the published version of the manuscript.

Funding

This research received no external funding.

Institutional Review Board Statement

Not applicable.

Informed Consent Statement

Not applicable.

Data Availability Statement

All data, models, and code generated or used during the study will be made available upon request to the authors.

Acknowledgments

We are very grateful to Francesco Frontini SUPSI DACD; Stefano Zerbi SUPSI DACD and 4RnD Circular construction hub.

Conflicts of Interest

The authors declare no conflict of interest.

Abbreviations

The following abbreviations are used in this manuscript:
AcronymDefinition
LCALife Cycle Assessment—Methodology for assessing environmental impacts throughout the life cycle of a product or system.
LCCLife Cycle Costing—Economic analysis that considers all costs associated with the life of a project or asset.
S-LCASocial Life Cycle Assessment—Framework for evaluating the social impacts of products or systems across their life cycle.
LCSALife Cycle Sustainability Assessment—Integrated approach combining LCA, LCC, and S-LCA for comprehensive sustainability evaluation.
MCDMMulti-Criteria Decision Making—Set of methods for evaluating multiple conflicting criteria in decision-making processes.
WSMWeighted Sum Model—A linear method within MCDM used to aggregate performance indicators based on predefined weights.
GIGlobal Warming Potential Indicator—Quantitative measure of the greenhouse gas emissions associated with a system, expressed in CO2 equivalent.
TCTotal Cost—Aggregated cost indicator including planning, construction, operation, and decommissioning costs over the service life.
RORobustness—Structural indicator measuring the ability of a system to withstand exceptional loads without disproportionate failure.
INInspection—Indicator reflecting the inspectability and accessibility of structural components during the asset’s life cycle.
MAMaintenance—Indicator assessing the expected effort, complexity, and frequency of maintenance activities.
DCRDemand–Capacity Ratio—Ratio used in structural analysis to assess robustness against progressive collapse.
CECircular Economy—Economic system aimed at minimizing waste and making the most of resources through reuse, recycling, and design for disassembly.
SIRSsSustainable Infrastructure Rating Systems—Formalized frameworks for evaluating and certifying infrastructure sustainability across life cycle stages.

References

  1. EN 16310; Engineering services—Terminology to Describe Engineering Services for Buildings, Infrastructure and Industrial Facilities. CEN: Brussels, Belgium, 2013.
  2. Nava, S.; Chalabi, Z.; Bell, S.; Sendra, P.; Burman, E. Identifying the criteria for community-centred Life Cycle Sustainability Assessment of estate regeneration schemes. Heliyon 2024, 10, e31115. [Google Scholar] [CrossRef]
  3. Backes, J.G.; Traverso, M. Application of Life Cycle Sustainability Assessment in the Construction Sector: A Systematic Literature Review. Processes 2021, 9, 1248. [Google Scholar] [CrossRef]
  4. ISO 14040:2006; Environmental Management—Life Cycle Assessment—Principles and Framework. International Organization for Standardization: Geneva, Switzerland, 2006.
  5. ISO 14044:2006; Environmental Management—Life Cycle Assessment—Requirements and Guidelines. International Organization for Standardization: Geneva, Switzerland, 2006.
  6. ISO 15686-5:2017; Buildings and Constructed Assets—Service Life Planning—Part 5: Life-Cycle Costing. International Organization for Standardization: Geneva, Switzerland, 2017.
  7. ISO 14075:2024; Environmental Management—Life Cycle Assessment—Guidelines for the Interpretation of Results. International Organization for Standardization: Geneva, Switzerland, 2024.
  8. Dai, J.; Ueda, T. Carbon Footprint Analysis of Fibre Reinforced Polymer (FRP) Incorporated Pedestrian Bridges: A Case Study. Key Eng. Mater. 2012, 517, 724–729. [Google Scholar] [CrossRef]
  9. De Wolf, C.; Bianquis, R.; Ochsendorf, J.; Verbeeck, K. Material Quantities and Embodied Carbon of Footbridges. IABSE Symp. Rep. 2015, 105, 93–100. [Google Scholar] [CrossRef]
  10. Anastasiades, K.; Lambrechts, T.; Mennes, J.; Audenaert, A.; Blom, J. Formalising the R of Reduce in a Circular Economy Oriented Design Methodology for Pedestrian and Cycling Bridges. J 2022, 5, 35–51. [Google Scholar] [CrossRef]
  11. Gandy, C.A.; Armanios, D.E.; Samaras, C. Social Equity of Bridge Management. J. Manag. Eng. 2023, 39, 04023027. [Google Scholar] [CrossRef]
  12. Smith, J.; Johnson, A. Cost Estimation in Bridge Construction Projects: A Parametric Approach. J. Constr. Eng. Manag. 2020, 146, 04020015. [Google Scholar] [CrossRef]
  13. EN 1990:2023; Eurocode—Basis of Structural and Geotechnical Design. European Committee for Standardization (CEN): Brussels, Belgium, 2023.
  14. Habert, G.; Miller, S.A.; John, V.M.; Provis, J.L.; Favier, A.; Horvath, A.; Scrivener, K.L. Environmental impacts and decarbonization strategies in the cement and concrete industries. Nat. Rev. Earth Environ. 2020, 1, 559–573. [Google Scholar] [CrossRef]
  15. Larsen, I.L.; Thorstensen, R.T. The Influence of Steel Fibres on Compressive and Tensile Strength of Ultra High Performance Concrete: A Review. Constr. Build. Mater. 2020, 256, 119459. [Google Scholar] [CrossRef]
  16. Dimopoulou, D.; Khoshkhoo, N. Pedestrian Bridges of Different Materials—Comparison in Terms of Life Cycle Cost and Life Cycle Assessment. Master’s Thesis, Chalmers University of Technology, Gothenburg, Sweden, 2015. [Google Scholar]
  17. Van Tittelboom, K.; De Belie, N. Self-Healing in Cementitious Materials—A Review. Materials 2013, 6, 2182–2217. [Google Scholar] [CrossRef]
  18. Penadés-Plà, V.; García-Segura, T.; Martí, J.V.; Yepes, V. A Review of Multi-Criteria Decision-Making Methods Applied to the Sustainable Bridge Design. Sustainability 2016, 8, 1295. [Google Scholar] [CrossRef]
  19. Nguyen, T.D.H.N.; Moon, H.; Ahn, Y. Critical Review of Trends in Modular Integrated Construction Research with a Focus on Sustainability. Sustainability 2022, 14, 12282. [Google Scholar] [CrossRef]
  20. Ek, K.; Mathern, A.; Rempling, R.; Karlsson, M.; Brinkhoff, P.; Norin, M.; Lindberg, J.; Rosén, L. A Harmonized Method for Automatable Life Cycle Sustainability Performance Assessment and Comparison of Civil Engineering Works Design Concepts. IOP Conf. Ser. Earth Environ. Sci. 2020, 588, 042020. [Google Scholar] [CrossRef]
  21. Venkateswaran, C. Sustainable Practices in Bridge Construction. J. Sustain. Constr. Mater. Technol. 2021, 6, 24–28. [Google Scholar] [CrossRef]
  22. Sabatino, D.M.; Frangopol, D.M.; Dong, Y. Sustainability-Informed Maintenance Optimization of Highway Bridges Considering Multi-Attribute Utility and Risk Attitude. Eng. Struct. 2015, 102, 310–321. [Google Scholar] [CrossRef]
  23. Liljenström, C.; Björklund, A.; Toller, S. Including Maintenance in Life Cycle Assessment of Road and Rail Infrastructure—A Literature Review. Int. J. Life Cycle Assess. 2022, 27, 316–341. [Google Scholar] [CrossRef]
  24. Yadollahi, M.; Ansari, R.; Abd Majid, M.Z.; Yih, C.H. A Multi-Criteria Analysis for Bridge Sustainability Assessment: A Case Study of Penang Second Bridge, Malaysia. Struct. Infrastruct. Eng. 2015, 11, 638–654. [Google Scholar] [CrossRef]
  25. Milani, C.J.; Yepes, V.; Kripka, M. Proposal of Sustainability Indicators for the Design of Small-Span Bridges. Int. J. Environ. Res. Public Health 2020, 17, 4488. [Google Scholar] [CrossRef]
  26. Anastasiades, K.; Blom, J.; Buyle, M.; Audenaert, A. Translating the Circular Economy to Bridge Construction: Lessons Learnt from a Critical Literature Review. Renew. Sustain. Energy Rev. 2019, 109, 109522. [Google Scholar] [CrossRef]
  27. Górecki, J.; Núñez-Cacho, P. Decision-Making Problems in Construction Projects Executed under the Principles of Sustainable Development, Bridge Construction Case. Appl. Sci. 2022, 12, 6132. [Google Scholar] [CrossRef]
  28. Van den Broek, M. Design of Sustainable Bridges. In Manual for Civil Engineers; TU Delft: Delft, The Netherlands, 2012. [Google Scholar]
  29. Tromp, L.; van Ijselmuijden, K.; Zuidema, J. Designing Sustainable Footbridges: Comparing Steel, Concrete and FRP. In Proceedings of the IABSE Congress: The Evolving Metropolis, New York City, NY, USA, 4–6 September 2019; pp. 936–943. [Google Scholar] [CrossRef]
  30. Anastasiades, K.; van Hul, K.; Audenaert, A.; Blom, J. A Circularity Indicator for Pedestrian Bridges: A Work in Progress. In Proceedings of the International Winter Conferences 2020, Tignes, France, 27–31 January 2020. [Google Scholar]
  31. Verberne, J. Building Circularity Indicators—An Approach for Measuring Circularity of a Building; Eindhoven University of Technology: Eindhoven, The Netherlands, 2016. [Google Scholar]
  32. Grandic, I.Š.; Šculac, P.; Grandic, D.; Vodopija, I. The Accessible Design of Pedestrian Bridges. Sustainability 2024, 16, 1063. [Google Scholar] [CrossRef]
  33. Olalekan, E.I.; Emily, I.; Toheeb, J.; Rukayat, M.-S.; Oladoyinbo, W.; Aregbeshola, A.A.; Victoria, O.; Ortiz, C.C. Life Cycle Sustainability Assessment. In Encyclopedia of Sustainable Management; Idowu, S., Schmidpeter, R., Capaldi, N., Zu, L., Del Baldo, M., Abreu, R., Eds.; Springer International Publishing: Cham, Switzerland, 2023; pp. 1–11. [Google Scholar] [CrossRef]
  34. Sonnemann, G.; Valdivia, S. Handbook on Life Cycle Sustainability Assessment; Edward Elgar Publishing: Cheltenham, UK, 2024. [Google Scholar]
  35. Milić, I.; Bleiziffer, J. Life Cycle Assessment of the Sustainability of Bridges: Methodology, Literature Review and Knowledge Gaps. Front. Built Environ. 2024, 10, 1410798. [Google Scholar] [CrossRef]
  36. Yassamy, P.; Pellerin, R. Social Life-Cycle Assessment in the Construction Industry: A Review of Characteristics, Limitations, and Challenges of S-LCA through Case Studies. Sustainability 2023, 15, 14569. [Google Scholar] [CrossRef]
  37. UNEP. Guidelines for Social Life Cycle Assessment of Products and Organizations, 2020; United Nations Environment Programme: Nairobi, Kenya, 2020. [Google Scholar]
  38. ISO 26000:2010; Guidance on Social Responsibility. International Organization for Standardization: Geneva, Switzerland, 2010.
  39. Roundtable for Product Social Metrics. Handbook for Product Social Impact Assessment, 4th ed.; Roundtable for Product Social Metrics: Amersfoort, The Netherlands, 2021; Available online: https://www.social-value-initiative.org/wp-content/uploads/2021/04/20-01-Handbook2020.pdf (accessed on 10 October 2024).
  40. Norris, G.A.; Aulisio, D. Social Hotspots Database (SHDB); NewEarth B Corporation: Cambridge, MA, USA, 2013; Available online: http://www.socialhotspot.org/ (accessed on 11 October 2024).
  41. Nordic Council of Ministers. Nordic Guidelines for Social Life Cycle Assessment of Products; Nordic Council of Ministers: Copenhagen, Denmark, 2014. [Google Scholar]
  42. Global Reporting Initiative (GRI). GRI Standards: Sustainability Reporting Standards; Global Reporting Initiative: Amsterdam, The Netherlands, 2021; Available online: https://www.globalreporting.org/standards/ (accessed on 11 October 2024).
  43. Kustova, I.; Hudenko, J.; Lace, N. A Systematic Review of Sustainability Criteria in Infrastructure Development. Sustainability 2024, 16, 4564. [Google Scholar] [CrossRef]
  44. Awuzie, B.; Ngowi, A. Sustainability Performance of Infrastructure Projects: The Case for Life Cycle Sustainability Assessment Methodology. Sabinet Afr. J. 2018, 1664–1681. Available online: https://journals.co.za/doi/pdf/10.10520/EJC-10a44f89b9 (accessed on 23 March 2025).
  45. Hove, A.; Liu, X.; Stubhan, T.; Fuerst, N.K.; Downing, L. International Standards for Sustainable Infrastructure: An Overview; Deutsche Gesellschaft für Inter-nationale Zusammenarbeit (GIZ) Gmb: Bonn, Germany, 2020. [Google Scholar]
  46. Greenroads Foundation. Greenroads Rating System; Greenroads Foundation: Redmond, WA, USA, 2010; Available online: https://greenroads.com/ (accessed on 20 September 2024).
  47. Infrastructure Sustainability Council. Infrastructure Sustainability Rating Tool (IS); Infrastructure Sustainability Council: Sydney, Australia, 2021; Available online: https://www.iscouncil.org (accessed on 21 September 2024).
  48. Institute for Sustainable Infrastructure. Envision Rating System Version 3.0; Institute for Sustainable Infrastructure: Washington, DC, USA, 2018; Available online: https://www.sustainableinfrastructure.org (accessed on 21 September 2024).
  49. Federal Highway Administration (FHWA). INVEST—Infrastructure Voluntary Evaluation Sustainability Tool; Federal Highway Administration: Washington, DC, USA, 2020; Available online: https://www.sustainablehighways.org (accessed on 20 September 2024).
  50. Global Infrastructure Basel Foundation. SuRe—The Standard for Sustainable and Resilient Infrastructure; Global Infrastructure Basel Foundation: Basel, Switzerland, 2021; Available online: https://www.gib-foundation.org/sure-standard (accessed on 22 September 2024).
  51. BRE Group. CEEQUAL Version 6.0; BRE Group: Watford, UK, 2022; Available online: https://www.ceequal.com (accessed on 28 September 2024).
  52. Schweizerische Eidgenossenschaft. SNBS Infrastructure—Standard Nachhaltiges Bauen Schweiz; Bundesamt für Energie: Bern, Switzerland, 2020; Available online: https://nnbs.ch/ (accessed on 29 September 2024).
  53. Diaz-Sarachaga, J.M.; Jato-Espino, D.; Alsulami, B.; Castro-Fresno, D. Evaluation of Existing Sustainable Infrastructure Rating Systems for Their Application in Developing Countries. Ecol. Indic. 2016, 71, 491–502. [Google Scholar] [CrossRef]
  54. Moussavi, S.; Dvorak, B.; Lane, K. Life Cycle Sustainability Assessments of Critical Civil Infrastructure Systems: Additional Guidance for Future Research and Practical Application. Aqua Water Infrastructure. Ecosyst. Soc. 2024, 73, 2187–2195. [Google Scholar] [CrossRef]
  55. Del Rosario, P.; Traverso, M. Towards Sustainable Roads: A Systematic Review of Triple-Bottom-Line-Based Assessment Methods. Sustainability 2023, 15, 15654. [Google Scholar] [CrossRef]
  56. Dinh, T.H. Life Cycle Sustainability Assessment for Selecting Construction Materials in the Preliminary Design Phase of Road Construction Projects. Ph.D. Thesis, Technische Universität Chemnitz, Chemnitz, Germany, 2023. [Google Scholar]
  57. Wang, M.; Zhong, X.; Sun, C.; Chen, T.; Su, J.; Li, J. Comprehensive Performance of Green Infrastructure through a Life-Cycle Perspective: A Review. Sustainability 2023, 15, 10857. [Google Scholar] [CrossRef]
  58. Arshad, H.; Thaheem, M.J.; Bakhtawar, B.; Shrestha, A. Evaluation of Road Infrastructure Projects: A Life Cycle Sustainability-Based Decision-Making Approach. Sustainability 2021, 13, 3743. [Google Scholar] [CrossRef]
  59. Bragança, L.; Vieira, S.M.; Andrade, J.B. Early Stage Design Decisions: The Way to Achieve Sustainable Buildings at Lower Costs. Sci. World J. 2014, 2014, 365364. [Google Scholar] [CrossRef]
  60. Gupta, R.; Morris, J.W.F.; Espinoza, R.D. Financial Sustainability as a Metric for Infrastructure Projects. In Proceedings of the Geo-Chicago 2016; American Society of Civil Engineers: Reston, VA, USA, 2016; pp. 746–755. [Google Scholar] [CrossRef]
  61. Shahtaheri, Y.; Dhulipala, L.; Tahir, H.; Flint, M. Developing a Decision Framework for Multi-Hazard Design of Resilient, Sustainable Buildings. In Proceedings of the 1st International Conference on Sustainable Infrastructure and Built Environment (SIBE 2016), Bandung, Indonesia, 26–27 September 2016. [Google Scholar]
  62. Ugwu, O.O.; Kumaraswamy, M.M.; Wong, A.; Ng, S.T. Sustainability appraisal in infrastructure projects (SUSAIP): Part 1. Development of indicators and computational methods. Autom. Constr. 2006, 15, 239–251. [Google Scholar] [CrossRef] [PubMed]
  63. Ashraf, M.; Hossain, M.R.; Griffiths, A. A framework for infrastructure sustainability assessment. In Proceedings of the 10th International Conference on Advances in Steel Concrete Composite and Hybrid Structures, Singapore, 2–4 July 2012. [Google Scholar] [CrossRef]
  64. Bueno, P.C.; Vassallo Magro, J.M.; Cheung, K. Road Infrastructure Design for Optimizing Sustainability; TRANSYT Working Paper; Universidad Politécnica de Madrid: Madrid, Spain, 2014. [Google Scholar]
  65. Medland, C.J.; Chenoweth, J.; Mulheron, M. Infrastructure climate change resilience: A review of resilience assessment frameworks. Proc. Inst. Civ. Eng.—Eng. Sustain. 2024; in press. [Google Scholar] [CrossRef]
  66. Vagdatli, T.; Petroutsatou, K.; Panetsos, P.; Barmpa, Z.; Fragkakis, N. Probabilistic pre-estimation of life-cycle costs of road bridges using dynamic Bayesian networks. Struct. Infrastruct. Eng. 2024, 20, 1–20. [Google Scholar] [CrossRef]
  67. Sierra, L.A.; Yepes, V.; Pellicer, E. A Review of Multi-Criteria Assessment of the Social Sustainability of Infrastructures. J. Clean. Prod. 2018, 187, 496–513. [Google Scholar] [CrossRef]
  68. Khodaeiparchin, M. Decarbonization of Road Construction and Maintenance: An Analysis of Best Practices Through the Life Cycle Assessment (LCA) Methodology. Master’s Thesis, Politecnico di Torino, Turin, Italy, 2024. [Google Scholar]
  69. Aryan, Y.; Dikshit, A.K.; Shinde, A.M. A critical review of the life cycle assessment studies on road pavements and road infrastructures. J. Environ. Manag. 2023, 336, 117697. [Google Scholar] [CrossRef] [PubMed]
  70. Wang, S.; Feng, K.; Wang, Y. Modeling Performance and Uncertainty of Construction Planning under Deep Uncertainty: A Prediction Interval Approach. Buildings 2023, 13, 254. [Google Scholar] [CrossRef]
  71. Akkermann, J.; Suhm, M. Structural robustness as an extended status indicator in bridge maintenance management systems. In Proceedings of the IABSE Congress: Structural Engineering for Future Societal Needs, Ghent, Belgium, 22–24 September 2021; pp. 1049–1056. [Google Scholar] [CrossRef]
  72. Tanner, P.; Hingorani, R. Approach to Robust and Elegant Bridge Design. Struct. Eng. Int. 2021, 31, 638–648. [Google Scholar] [CrossRef]
  73. Faber, M.H.; Miraglia, S.; Qin, J.; Stewart, M.G. Bridging resilience and sustainability: Decision analysis for design and management of infrastructure systems. Sustain. Resilient Infrastruct. 2018, 3, 69–79. [Google Scholar] [CrossRef]
  74. Ghosn, M.; Frangopol, D.M.; Biondini, F. Reliability and performance of deteriorating structures: Life-cycle reliability, redundancy, and robustness. J. Struct. Eng. 2016, 142, F4016001. [Google Scholar] [CrossRef]
  75. Kim, H.; Kim, H.; Tae, S.; Ahn, Y.; Yang, J. Scenarios for Life Cycle Studies of Bridge Concrete Structure Maintenance. Sustainability 2020, 12, 9557. [Google Scholar] [CrossRef]
  76. Bocchini, P.; Frangopol, D.M.; Ummenhofer, T.; Zinke, T. Resilience and Sustainability of Civil Infrastructure: Toward a Unified Approach. J. Infrastruct. Syst. 2014, 20, 04014004. [Google Scholar] [CrossRef]
  77. ISO 13822:2010; Bases for Design of Structures—Assessment of Existing Structures. International Organization for Standardization: Geneva, Switzerland, 2010.
  78. Estes, A.C.; Frangopol, D.M. An optimized lifetime reliability-based inspection program for deteriorating structures. J. Struct. Eng. 2000, 126, 712–723. [Google Scholar]
  79. Faber, M.H.; Qin, J.; Miraglia, S.; Thöns, S. On the Probabilistic Characterization of Robustness and Resilience. Procedia Eng. 2017, 198, 1073–1085. [Google Scholar] [CrossRef]
  80. Lad, V.H.; Patel, D.A.; Chauhan, K.A. Prioritisation of Bridges for Resilience Using Multi-Criteria Decision-Making Techniques. J. Infrastruct. Syst. 2024, 30, 102345. [Google Scholar] [CrossRef]
  81. Frangopol, D.M.; Dong, Y.; Sabatino, S. Bridge Life-Cycle Performance and Cost: Analysis, Prediction, Optimisation and Decision-Making. In Structures and Infrastructure Systems; Taylor & Francis: Abingdon, UK, 2019. [Google Scholar]
  82. GSA. Progressive Collapse Analysis and Design Guidelines for New Federal Office Buildings and Major Modernization Projects; U.S. General Services Administration: Washington, DC, USA, 2013. [Google Scholar]
  83. Federal Highway Administration (FHWA). HWA-HIF-22-052: Reference Guide for Service Life Design of Bridges; FHWA: Washington, DC, USA, 2022. [Google Scholar]
  84. Strategic Highway Research Program 2. Service Life Design for Bridges Summary Guide (SHRP2 R19A); American Association of State Highway and Transportation Officials: Washington, DC, USA, 2018. [Google Scholar]
  85. Turksezer, Z.I.; Iacovino, C.; Giordano, P.F.; Limongelli, M.P. Development and Implementation of Indicators to Assess Bridge Inspection Practices. J. Constr. Eng. Manag. 2021, 147, 04021195. [Google Scholar] [CrossRef]
  86. ISO 15686-7:2017; Buildings and Constructed Assets—Service Life Planning—Part 7: Performance Evaluation for Feedback of Service Life Data from Practice. ISO: Geneva, Switzerland, 2017.
  87. Rowley, H.V.; Peters, G.M.; Lundie, S.; Moore, S.J. Aggregating sustainability indicators: Beyond the weighted sum. J. Environ. Manag. 2012, 111, 24–33. [Google Scholar] [CrossRef] [PubMed]
  88. Mabrouk, M.; Haoying, H. Urban resilience assessment: A multicriteria approach for identifying urban flood-exposed risky districts using multiple-criteria decision-making tools (MCDM). Int. J. Disaster Risk Reduct. 2023, 91, 103684. [Google Scholar] [CrossRef]
  89. Djordjevùić, B.; Mane, A.S.; Krmac, E. Analysis of dependency and importance of key indicators for railway sustainability monitoring: A new integrated approach with DEA and Pearson correlation. Res. Transp. Bus. Manag. 2021, 40, 100533. [Google Scholar] [CrossRef]
  90. Kalem, A.; Tadić, S.; Krstić, M.; Čabrić, N. Evaluation of railway infrastructure managers’ efficiency using a Pearson’s correlation-based DEA method model. Oppor. Chall. Sustain. 2024, 3, 5. [Google Scholar] [CrossRef]
  91. Suprayoga, G.B.; Bakker, M.; Witte, P.; Spit, T. A Systematic Review of Indicators to Assess the Sustainability of Road Infrastructure Projects. Eur. Transp. Res. Rev. 2020, 12, 19. [Google Scholar] [CrossRef]
  92. Francis, A.; Thomas, A. System Dynamics Modeling Coupled with Multi-Criteria Decision-Making (MCDM) for Sustainability-Related Policy Analysis and Decision-Making in the Built Environment. Smart Sustain. Built Environ. 2023, 12, 534–564. [Google Scholar] [CrossRef]
  93. Juarez-Quispe, J.; Rojas-Chura, E.; Espinoza Vigil, A.J. Advancing Sustainable Infrastructure Management: Insights from System Dynamics. Buildings 2025, 15, 210. [Google Scholar] [CrossRef]
  94. Gozzi, V.; Chiaia, B. Systemic Design of a Bridge. In Proceedings of the International FIB Symposium, Oslo, Norway, 29 June–1 July 2023; Novus Press: Oslo, Norway, 2023. [Google Scholar]
  95. Xu, G.; Azhari, F. Bridge Maintenance Management Based on Routine Inspection Data: A Quantitative Approach. J. Bridge Eng. 2024, 30, 04024111. [Google Scholar]
  96. Research and Innovation in Bridge Maintenance, Inspection and Monitoring. JRC 2019. Available online: https://publications.jrc.ec.europa.eu/repository/handle/JRC115319 (accessed on 23 March 2025).
  97. Pedneault, J.; Desjardins, V.; Margni, M.; Conciatori, D.; Fafard, M.; Sorelli, L. Economic and environmental life cycle assessment of a short-span aluminium composite. J. Clean. Prod. 2021, 310, 127405. [Google Scholar] [CrossRef]
  98. Jena, T.; Kaewunruen, S. Life cycle sustainability assessments of an innovative FRP Composite footbridge. Sustainability 2021, 13, 13000. [Google Scholar] [CrossRef]
  99. Nasereddin, M.; Price, A. Addressing the capital cost barrier to sustainable construction. Dev. Built Environ. 2021, 7, 100049. [Google Scholar] [CrossRef]
  100. Han, X.; Frangopol, D.M. Life-Cycle Risk-Based Optimal Maintenance Strategy for Bridge Networks Subjected to Corrosion and Seismic Hazards. J. Bridge Eng. 2025, 28, 1. [Google Scholar] [CrossRef]
  101. Zanini, M.A.; Faleschini, F.; Casas, J.R. State-Of-Research on Performance Indicators for Bridge Quality Control and Management, Front. Built Environ. 2019, 5, 22. [Google Scholar] [CrossRef]
  102. Vishnu, N. Multi-threat sustainability assessment of bridges and bridge networks. ProQuest Dissertations & Theses, Rice University, Houston, TX, USA, 2019. Available online: https://search.proquest.com/openview/e35f4c8f007ca2f38d44e0ce92ce7bed (accessed on 18 November 2024).
Figure 1. Framework integration across project stages, highlighting early-phase decision making and showing how increasing detail shifts the assessment from LCA and LCC to incorporating S-LCA. (modified figure from Gupta et al. [60]).
Sustainability 17 04562 g001
Figure 2. Schematic illustration of MacLeamy curve [70] showing impact of structural decisions on project outcomes in footbridges design along project life cycle.
Sustainability 17 04562 g002
Figure 3. Contexts and radar charts showing the normalized values of five performance indicators, Global Warming Potential (GI), Total Cost (TC), Robustness (RO), Inspection (IN), and Maintenance (MA), for each design option in the Turin (top) and Delémont (bottom) case studies. This graphical representation highlights the differences among alternatives within each case and serves as the basis for the correlation analysis in Figure 4. The red lines show the urban setting of the footbridges.
Sustainability 17 04562 g003
Figure 4. Pearson correlation matrices for the Turin (left) and Delémont (right) case studies, computed using the normalized indicator values from Figure 3. The five indicators include Global Warming Potential (GI), Total Cost (TC), Robustness (RO), Inspection (IN), and Maintenance (MA). Cell colors represent the correlation coefficient (r) on a continuous scale from –1 (strong inverse correlation) to +1 (strong direct correlation), with values near 0 indicating little or no linear relationship.
Sustainability 17 04562 g004
Table 1. Sustainable Infrastructure Rating Systems comparison.
SIRSsGreenroadsInfrastructure Sustainability (IS)EnvisionINVESTSuRe
(FAST Infra)
BREEAM
Infrastructure
SNBS
Infrastructure
Data
Year
of launch
20102012201220102015 (2024)2004 (2022)2020
Versionv.3 2020v. 2.1 (2021)v.3 2018v.1.3 2018v.2 2021v.6 2019 (2022)v.1 2020
InstitutionGreenroads InternationalInstitute Sustainability Council of AustraliaInstitute of Sustainable Infrastructure
(ISI)
Federal Highway
Administration (FHWA)
Global Infrastructure Basel
(GIB)
Building Research Establishment (BRE)Sustainable Construction Network Switzerland (NNBS)
GeographyU.S.Australia, N.Z.U.S.U.S.SwitzerlandU.K.Switzerland
Applicable toRoads and highways
Bicycle paths
Bridges
Footbridges
Road tunnels
Roads and highways
Bridges
Footbridges
Ports
Tunnels
Water infrastructure
Renewable energy (e.g., wind, solar)
Roads
Ports
Bridges and footbridges
Water infrastructure
Treatment plants
Renewable energy
Public buildings
Green urban spaces
Roads and highways
Multimodal transportation projects (including bridges, footbridges, tunnels, and railways)
Urban infrastructure (footbridges)
Water systems
Energy
Transport networks (roads, bridges)
Sustainable urban and rural projects
Bridges and footbridges
Tunnels
Water networks
Sewer systems
Energy grids
Urban regeneration projects
Green infrastructure
Roads
Railways
Bridges and footbridges
Tunnels
Water networks
Energy
Communication, protection, mobility infrastructure
Public buildings and services
Applicable Project phases
(UNI 16310)
Preliminary design
Detailed design
Construction
Planning
Preliminary design
Detailed design
Construction
Operation
Planning
Preliminary design
Detailed design
Construction
Operation
Planning
Preliminary design
Detailed design
Construction
Operation
Planning
Preliminary design
Detailed design
Construction
Operation
Decommissioning
Planning
Preliminary design
Detailed design
Construction
Operation
Decommissioning
Planning
Preliminary design
Detailed design
Construction
Operation
Total
Indicators
626460646124875
CategoriesProject requirements
Environment and water
Construction activities
Materials and design
Utilities and controls
Access and livability
Creativity and effort *
Governance
Economic performance
Resource use
Environmental impact
Workforce and community
Innovation
Quality of life
Leadership
Resource allocation
Natural world climate and resilience
System planning
Project development
Operations and maintenance *
Environment
Society
Governance
Management
Resilience
Communities and stakeholders
Land use and ecology
Landscape and historic environments
Pollution
Resources
Transport
Environment
Economy
Society
ApproachLCA suggested
LCC suggested
S-LCA not explicitly included
LCA mandatory
LCC mandatory
S-LCA suggested
LCA mandatory
LCC mandatory
S-LCA suggested
LCA suggested
LCC suggested
S-LCA not explicitly included
LCA mandatory
LCC mandatory
S-LCA mandatory
LCA mandatory
LCC suggested
S-LCA not explicitly included
LCA mandatory
LCC mandatory
S-LCA suggested
Principal databases and sector benchmarksEcoinvent
US LCI Database
AASHTO Pavement Design
PSILCA
SHDB
Australian Material
AusLCI
Ecoinvent
PSILCA
Ecoinvent
US LCI Database
ELCD
SHDB
US EPA LCA Benchmarks
FHWA Sustainability Guidelines
AASHTO Material Databases
UNEP Environmental Data
OECD Benchmarks
Ecoinvent
IFC Performance Metrics
PSILCA
SHDB
Ecoinvent
DEFRA Biodiversity Net Gain
ICE Database
ILCD
PSILCA
SHDB
Swiss KBOB Database
Ecoinvent
Swiss Federal LCA Database
PSILCA
SHDB
* INVEST is organized in categories according to project phases. These categories are made of 64 indicators concerning environmental, cost, and social aspects.
Table 2. Sustainability quantitative indicators during conceptual design of footbridges and their inclusion in sustainable rating systems. Even though not all systems explicitly use the Triple Bottom Line framework (LCA, LCC, and S-LCA), the authors have assigned each indicator in the table to one of these three categories.
SIRSsLSCA
Category
GreenroadsInfrastructure Sustainability (IS)EnvisionINVESTSuRe
(FAST Infra)
BREEAM
Infrastructure
SNBS
Infrastructure
Indicators
Global Potential
Warming (CO2-eq)
Environment0111111
Energy Consumption (kWh)Environment0111111
Recycled Materials %
(Percentage of total)
Environment0110111
Waste Management
(kg or tons)
Environment0110111
Water Use (m3) Environment0110111
Construction Costs (USD)Economic0111111
Operational Costs (USD)Economic0111111
Sustainable Transport Use % (Percentage of trips)Social0111111
Land Use Efficiency Social0110111
Biodiversity Impact (m2) Social0110111
Economics
Opportunities (n.jobs)
Social0110111
Table 3. Summary of framework indicators description and numerical definition.
IndicatorDefinition
Global Warming Potential Indicator (GI)CO2-eq equivalent emissions (GPWi) along the life cycle
Total Cost (TC)Project costs (Ci) in CHF along the life cycle
Robustness (RO)Demand–Capacity Ratio (DCR, GSA 2013 [82]) with sensitivity factor (K)
Inspection (IN)Percentage of inspectable-monitored components (IE), adjusted by difficulty inspection factor (D)
Maintenance (MA)Maintenance grade (ME) from specific assessment formular, adjusted by quality factor (Q)
Table 4. Normalized indicator values across case studies.
Case Study1A1B1C1D2A2B2C2D
Indicator
Global Warming Potential Indicator (GI)611.726114
Total Cost (TC)623.53.561.521
Robustness (RO)624.54.5632.25
Inspection (IN)4621463.21
Maintenance (MA)13646431
Disclaimer/Publisher’s Note: The statements, opinions and data contained in all publications are solely those of the individual author(s) and contributor(s) and not of MDPI and/or the editor(s). MDPI and/or the editor(s) disclaim responsibility for any injury to people or property resulting from any ideas, methods, instructions or products referred to in the content.

