Article

Retail Investors’ Social Media Interaction and Corporate Green Innovation: Evidence from China Listed Companies in Heavily Polluting Industries

1
School of Accounting, Hunan University of Technology and Business, Changsha 410205, China
2
School of Accounting, Zhengzhou Business University, Zhengzhou 451200, China
*
Author to whom correspondence should be addressed.
Sustainability 2025, 17(10), 4558; https://doi.org/10.3390/su17104558
Submission received: 28 February 2025 / Revised: 14 April 2025 / Accepted: 12 May 2025 / Published: 16 May 2025
(This article belongs to the Special Issue ESG Performance, Investment, and Risk Management)

Abstract

:
Green innovation, which promotes the coordinated development of the economy and ecology, serves as a critical means to achieve enterprises’ green transformation. Against the backdrop of the Internet era, retail investors, as an important supervisory group for enterprises, can generate online public opinion through interactive exchanges on social media platforms. This raises the question: Can such public opinion rooted in social media influence enterprises’ green innovation behaviors? To address this, this study uses data from Chinese A-share listed enterprises in heavily polluting industries on the Shanghai and Shenzhen Stock Exchanges from 2008–2021, comprising a total sample size of 8755, and employs ordinary least squares (OLS) regression models to empirically examine the relationship between retail investors’ social media interactions and enterprise green innovation. The findings reveal that interactive discussions by retail investors on social media significantly enhance enterprises’ green innovation levels. Mechanism tests show that social media interactions among these investors strengthen enterprises’ environmental awareness and alleviate their financing constraints, thereby promoting green innovation. Moderation effect tests indicate that the quality of social media information interaction and public opinion sentiment positively moderate the relationship between retail’s social media interactions and enterprise green innovation. Heterogeneity tests further show that the positive effect of retail’s social media interactions on enterprise green innovation is more pronounced in regions with stronger environmental information regulation and stronger investor protection. The conclusions of this study not only enrich research on the relationship between retail investors’ social media supervision and enterprises’ behavioral decision-making but also extend the literature on the influencing factors of enterprise green innovation from the perspective of public governance. These findings hold important implications for enterprises’ green transformation practices under the “double carbon” goals and provide valuable insights for corporate governance in the era of the digital economy.

1. Introduction

The production and operational activities of enterprises have long been regarded as an important cause of ecological damage and environmental pollution [1]. At the same time, environmental problems have increasingly become a global issue of common concern in both business and academic circles. The economy of China has recorded remarkable achievements since it opened up and initiated reform; however, the rapid economic growth is exerting unprecedented pressure on the ecology and environment of the country. To mitigate global climate risks, China has put forward the double carbon goal of “striving to peak carbon dioxide emissions before 2030 and striving to achieve carbon neutrality before 2060”.
Green innovation, as the premise of the green transformation of enterprises, affects the green attributes of enterprises [2] and is widely recognized by society as an important strategy of enterprises to achieve Sustainable Development Goals [3]. Therefore, green innovation activities of an enterprise provide a path to achieving the double carbon goal.
In recent years, the green innovation activities of enterprises have started receiving more attention from people of all walks of life; the impact of green innovation has become the focus of attention. The literature mainly discusses this impact on enterprises from the perspective of environmental regulations, particularly environmental protection taxes [4], pollutant discharge charges [5] and environmental protection subsidies [6], formulated by regulatory authorities for corporate green innovation. In turn, the discussion on the impact of informal environmental regulations on green innovation has found that the attention of capital market information intermediaries or investors, such as institutional investors [7,8,9] and the media [10,11,12,13], has a significant impact on green innovation by enterprises.
With the rapid development of information technology, the number of Internet users in China has seen geometric growth. Consequently, social media platforms should not be overlooked as information transmission channels [14]. In contrast to professional information intermediaries, such as institutional investors and the media, the users of certain social media platforms are often investors, whether individual investors or retail investors. The communication and interaction of retail investors on social media platforms can help them form alliances based on interest to bring together a scattered group and enable individuals representing retail investors to gain greater power, thus affecting corporate behavior, decision-making and the efficiency of capital markets [15].
Some scholars have examined the corporate governance effect of social media public opinion supervision from the perspectives of innovation [16,17]), mergers and acquisitions [18,19] and information [20]. However, few studies have explored whether public opinion, as a force formed by the social media alliance of retail investors, can have an effect on the green innovation of enterprises [13]. On the one hand, when faced by the public opinion of investors, managers could be motivated to implement green innovations to enhance the legitimacy of their enterprises, to maintain their green reputations and to stabilize their market positions; that is, public opinion could produce a “governance effect”. On the other hand, under the influence of occupational anxiety and pressure, the amplification effect of public opinion could make managers more inclined to safeguard their own, short-sighted interests, which could adversely affect the green innovation activities of enterprises; that is, public opinion could produce a “market pressure effect”. Considering the discussion above, the core issue of this paper is the role played by the attention and public opinions of retail investors regarding the green innovation of enterprises.
To empirically test the relationship between the social media interactions of retail investors and corporate green innovation, this study investigates listed Shanghai and Shenzhen A-share enterprises from heavy pollution industries from 2008 to 2021. With a mechanism test, we find that the social media interaction of retail investors promotes green innovation by enterprises by enhancing the environmental awareness of enterprises and easing their financing constraints.
The theoretical incremental contributions of this study include the following: First, it expands on the influencing factors promoting green innovation by enterprises from the perspective of supervision via public opinion expressed on social media. Although studies have explored the role of public opinion in corporate green innovation, most of these studies did so from the perspective of traditional media. Social media public opinion is very different from that of traditional media in terms of participants, publishing platforms and the communication efficiency of the media themselves. Second, the research conclusions of this study enrich the information available on the consequences of social media public opinion supervision. In the Internet era, an exploration of the social media network as a platform for public opinion is needed to investigate the relationship between social media and corporate green innovation; such research supplements the relevant literature on the consequences of public opinion supervision.
Additionally, the research conclusions of this paper also have strong practical guiding significance. On the one hand, the conclusions provide policy implications for regulatory authorities to guide capital market participation in environmental governance, confirming the effectiveness of small- and medium-sized investors’ social media interactions as an informal governance mechanism. Policymakers can leverage digital technology platforms to improve investor interaction channels and encourage stakeholders to strengthen the external supervision of enterprises’ green transformation through online inquiries, public opinion monitoring and other means. On the other hand, enhancing corporate environmental awareness and optimizing the allocation of financing resources are key paths to promoting green innovation. Regulatory agencies should collaborate with environmental authorities to build an incentive system for environmental information disclosure and guide financial institutions to develop green financial products to alleviate the resource constraints of enterprises’ green innovation. The conclusions of this paper are of important reference value for constructing a multi-stakeholder green governance system and advancing the realization of the “double carbon” goals.

2. Literature Review

2.1. Theoretical Background

2.1.1. Legitimacy Theory

Legitimacy refers to the universal beliefs constructed by social institutions regarding the meaning of their own existence, and such beliefs determine the survival and development of these institutions. Since then, scholars have introduced this concept into organizational research to explore the issue of organizational legitimacy. Subsequently, legitimacy theory is defined as a generalized perception and assumption that within the scope of values, beliefs, and normative principles constructed by social systems, organizational behaviors are considered desirable, appropriate, and suitable. Organizational legitimacy theory closely links social systems with the organizations operating within them, essentially representing a social contract between organizations and society. Society serves as the judge of a firm’s legitimacy, and legitimacy, as one of the most critical criteria for evaluating enterprises, profoundly influences their survival and development.
Current scholarly discussions on organizational legitimacy have primarily formed two major schools: the Institutional School and the Strategic School. Initially, research on organizational legitimacy was rooted in institutional theory, emphasizing that the institutional context is a key factor determining how firms acquire legitimacy—enterprises can only survive and develop by conforming to the institutional environment. The Institutional School argues that legitimacy is not actively pursued by firms but highlights the government’s role in “labeling” firms when they meet social expectations. This perspective views legitimacy as a set of norms and rules constraining corporate behavior, overlooking the subjective initiative of corporate practices. This legitimacy theory, based on institutional logic, is also known as “adaptive legitimacy”.
With the deepening of research, scholars have found that acquiring legitimacy requires not only organizational behavioral convergence to gain social recognition and obtain necessary resources but also transforming these resources into innovative outputs through optimal allocation and efficient utilization to build a positive corporate image and competitive advantage. Therefore, unlike the passive “labeling” perspective of the Institutional School, the Strategic School treats legitimacy as a strategic resource that helps firms acquire competitive advantages, emphasizing proactive strategic choices to coordinate resources rapidly and achieve legitimacy. This legitimacy theory, based on efficiency logic, is termed “strategic legitimacy”.
In practice, corporate legitimacy is dynamic. When a firm’s actions meet social expectations, it is considered legitimate. However, when its behavior contradicts social cognition, a legitimacy gap emerges, leading the firm into a legitimacy crisis. In such cases, firms need to engage in legitimization processes—such as participating in environmental protection and public welfare activities—to maintain or repair their legitimacy, aiming to acquire more development resources in the future market and consolidate their competitive edge. Therefore, legitimacy theory serves as a crucial theoretical foundation for this study.

2.1.2. Upper Echelons Theory

The Upper Echelons Theory posits that managerial rationality is bounded and emphasizes that individual characteristics of managers—such as cognition, values, and personality—significantly influence organizational decision-making. In organizational management, therefore, decisions made by managers are “personalized decisions” that integrate their unique traits, rather than “rational decisions” or “optimal decisions” in the traditional sense. Additionally, the theory operationalizes unquantifiable constructs like managerial cognition and values using observable demographic indicators (e.g., age, education, work experience), enabling its extensive application in empirical research.
When confronting internal or external environmental changes, managers first gather decision-relevant information based on their capabilities. Second, they filter and analyze environmental information through the lens of their cognition, values, and experiences. Finally, they make decisions shaped by these individual factors. In the context of organizational environmental management, environmental investment—often involving R&D innovation—typically requires substantial human and financial resources and entails high return uncertainty. It also exhibits dual externalities in environmental and technological domains. Under such circumstances, managers’ environmental awareness and green values determine the organization’s level of support for environmental investment. Generally, managers who perceive greater environmental pressure and possess stronger environmental awareness are more motivated to formulate environmental strategies and implement environmental initiatives. Thus, Upper Echelons Theory serves as a critical theoretical foundation for this study to examine the mediating role of environmental awareness in the relationship between small- and medium-sized investors’ social media interactions and corporate green innovation.

2.1.3. Information Asymmetry Theory

Originating in the 1970s and proposed by Akerlof and others, Information Asymmetry Theory is a classic framework in the field of information disclosure research. Traditional economic models assume that market participants have full access to information, overlooking the existence of information asymmetry. By contrast, this theory posits that disparities in information acquisition exist between transacting parties, enabling the better-informed side to gain advantages and profits from their informational edge, while the less-informed side incurs losses due to their disadvantaged position.
Information asymmetry gives rise to two core issues: adverse selection and moral hazard. Adverse selection, an ex-ante information asymmetry problem, occurs prior to contracting. When buyers lack complete information, they often mitigate expected losses by lowering prices, leading to price distortions and the prevalence of the “bad money driving out good money” phenomenon in markets. In capital markets, adverse selection means firms with high information transparency enjoy lower financing costs, whereas those with low disclosure face significant financing constraints. In contrast, moral hazard—a post-contractual, ex-post information asymmetry problem—arises when buyers cannot observe sellers’ actions after contracting, increasing the likelihood of sellers acting against buyers’ interests. For example, without investor supervision, firms may misallocate funds to riskier projects, escalating investment risks.
In the Internet era, capital market participants can access corporate behavioral information more quickly and comprehensively through online platforms, reducing information asymmetry between external stakeholders and firms and improving investors’ informational status. Alleviating information asymmetry also enhances external oversight of corporate behavior, reduces investors’ risk premiums and boosts resource allocation efficiency and market operation effectiveness. Therefore, Information Asymmetry Theory serves as a critical theoretical foundation for this study to investigate the mediating role of financing constraints in the relationship between small- and medium-sized investors’ social media interactions and corporate green innovation.

2.2. Previous Studies and Hypothesis Development

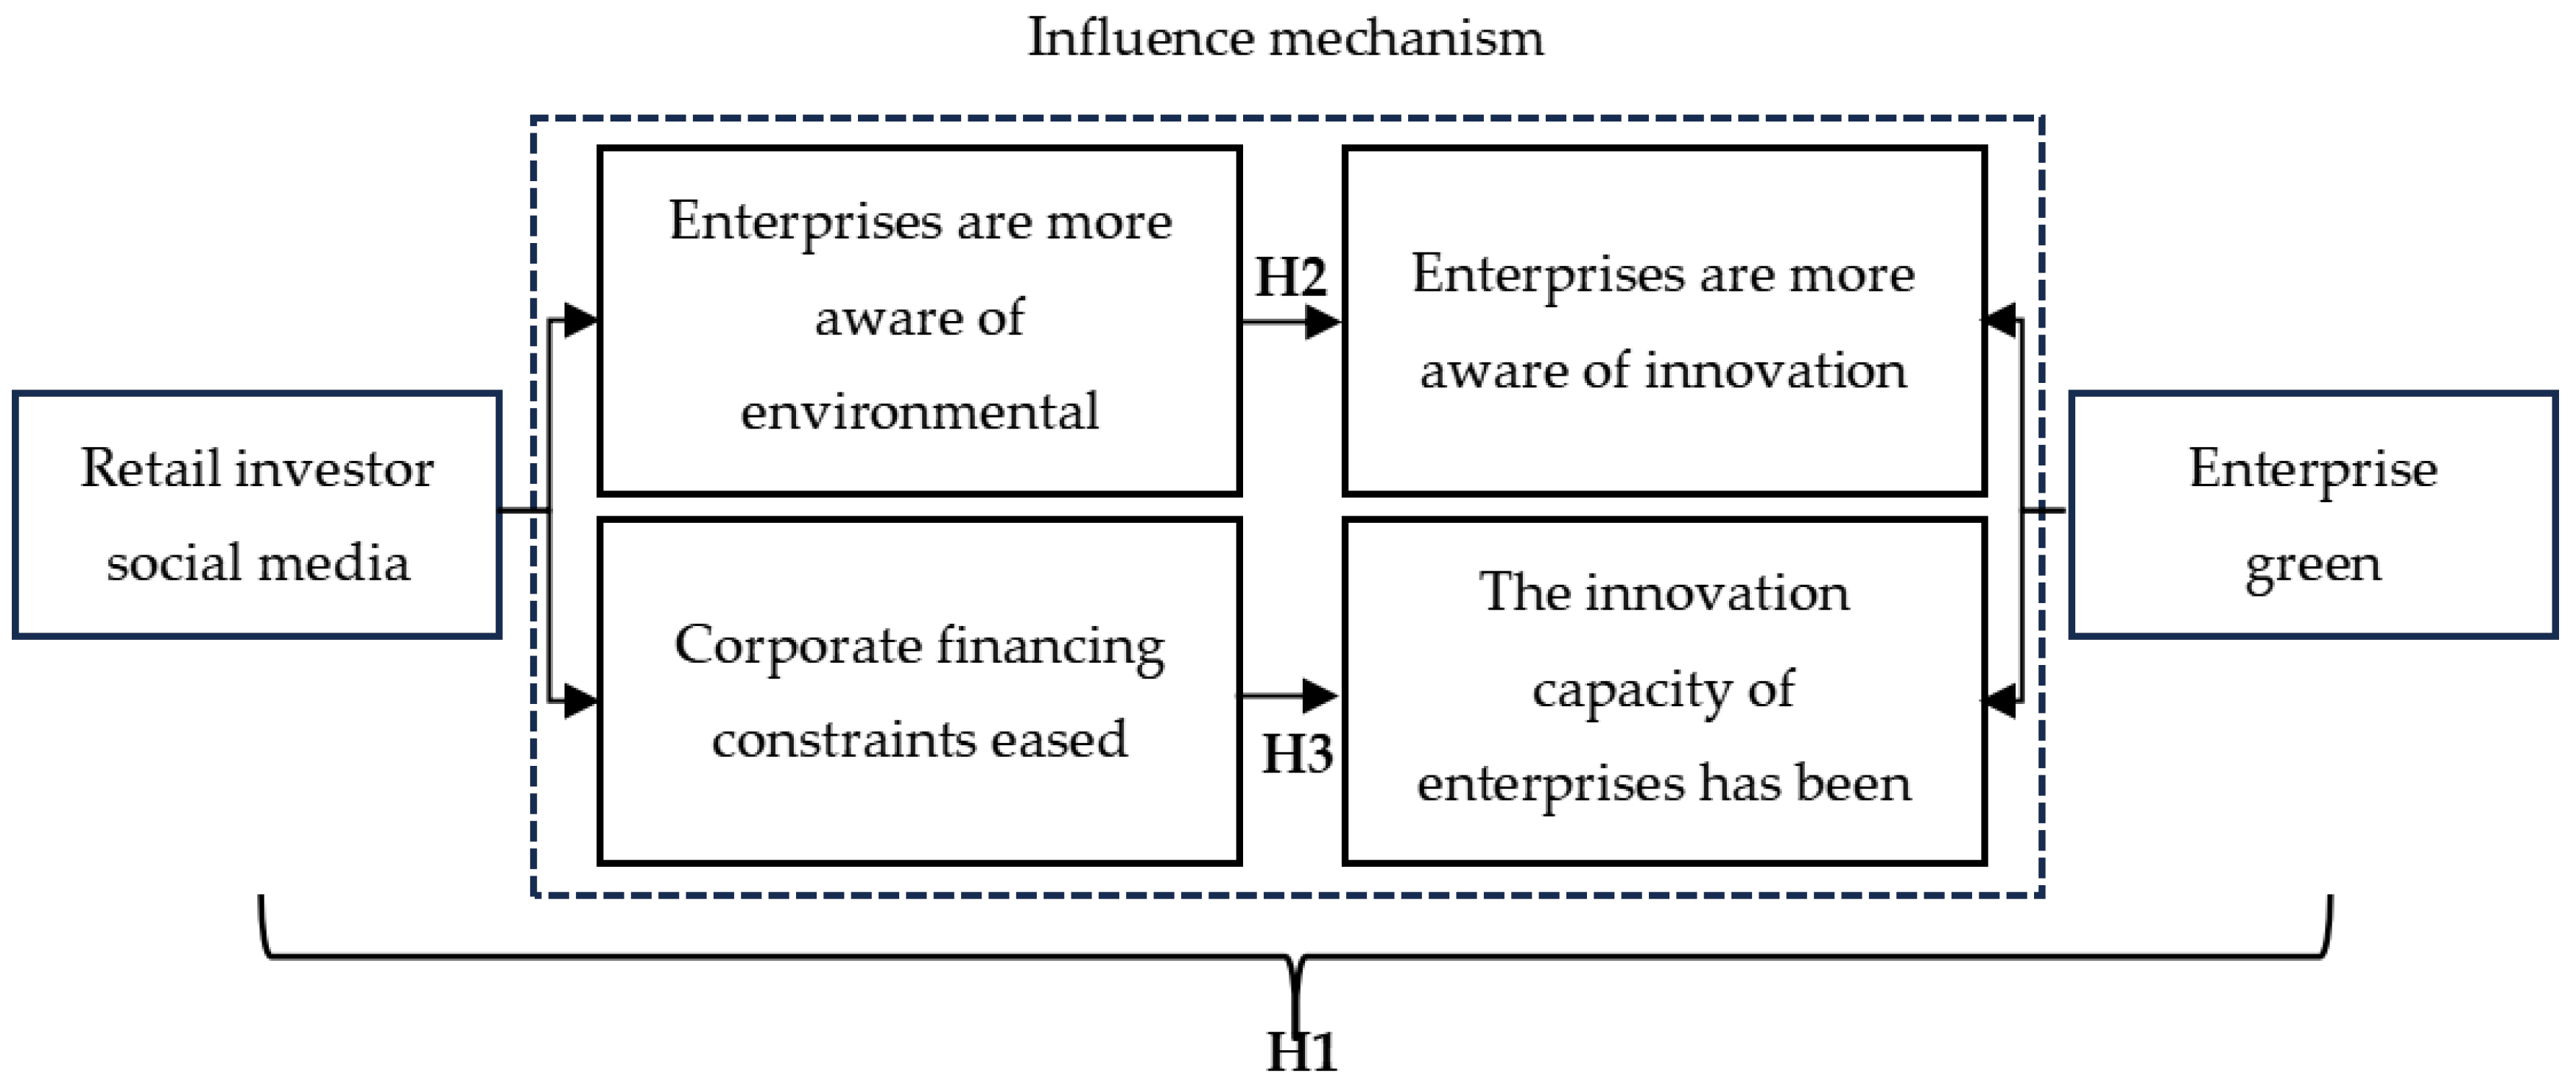
2.2.1. Effect of Social Media Interaction of Retail Investors on Corporate Green Innovation

With the rapid development of Internet technology, an investor communication platform, as a new form of social media, could have a positive supervisory effect on the field of corporate governance for the following reasons. First, social media participants have a relatively high level of homogeneity and a strong motivation to supervise. The members of an emerging investor exchange platform are generally minority shareholders or potential investors in a company; consequently, their communication on social media is targeted, and they pay close attention to a particular company. Second, the communication cost of social media is low, its communication efficiency is high and its influence is wide. Social media platforms can realize instant interaction for participants, and users are not restricted to publishing and receiving information. Because of these instant “many-to-many” interactions, any action of the concerned company is quickly captured, spread and amplified, thereby exerting pressure on the company and affecting its decision-making and behavior. Information exchange and dissemination via social media make certain users more sensitive to corporate behavior.
As public awareness of environmental protection increases, the problems caused by enterprises that are heavy polluters have become the focus of social attention on a national scale. When such polluting enterprises violate environmental protection regulations, large-scale information flow via social media arouses public attention, which results in stock price fluctuations and negative media reports and may even attract the attention of regulatory authorities, thus adversely affecting the value and image of such enterprises.
According to legitimacy theory, an enterprise is embedded in a specific social environment, and it is only by adapting to the institutional environment that it can obtain legitimacy and maintain its survival and development [21]. Dualistic legitimacy emphasizes that the acquisition and enhancement of legitimacy requires enterprises not only to obtain public recognition through behavioral convergence (adaptive legitimacy) but also to achieve innovation output through the efficient allocation of resources. In this way, a good corporate image and strong market competitive advantage (strategic legitimacy) can be created [22]. On the one hand, green innovation can enhance the adaptation legitimacy of enterprises. For example, studies have found that green innovation can realize cleaner production, encourage enterprises to adhere to environmental regulations and standards and thereby achieve public recognition of their environmentally friendly behavior, thus enhancing their adaptation legitimacy [23]. On the other hand, green innovation can enhance the strategic legitimacy of enterprises by, for instance, helping enterprises achieve the Sustainable Development Goals of energy conservation and environmental protection to create a good green image [24]. Green innovation could even enhance the residual value of enterprises by creating green demand from consumers. In addition, strategic legitimacy can help companies guide public opinion and enhance their green reputations and images [25]. Therefore, it is clear that green investment has become a hard indicator for enterprises that are engaged in polluting activities to enhance their legitimacy. Based on the above discussion, this paper proposes that, in the face of the public opinion of investors, polluting enterprises will take the initiative to enhance their corporate legitimacy by engaging in green innovation to maintain their green reputations and stabilize their market positions. That is, the greater the pressure of public opinion faced by enterprises, the higher the intensity of their green innovation. Based on the above analysis, this paper puts forward the following hypothesis:
Hypothesis 1 (H1).
The social media interaction of retail investors has a positive effect on corporate green innovation. Social media interactions by retail investors promote corporate green innovation.

2.2.2. Social Media Interaction of Retail Investors, Innovation Awareness and Corporate Green Innovation

In recent years and faced with increasing environmental degradation, people’s awareness of the need for environmental protection and their environmental risk perception has increased. The behavior of polluting enterprises, as the main source of environmental pollution, is attracting more and more attention. The rapid development of Internet technology and, in particular, network social media platforms represented by stock bars, have broadened the channels for retail investors to participate in corporate governance. The extent to which investors interact on online social media platforms reflects their interest in enterprises. Their interactions on social media can form online public opinion, which could have an effect on brand image, market position and the production and operation activities of an enterprise. When enterprises engage in behaviors that are considered detrimental to the environment, a high degree of investor attention and efficient information exchange can cause enterprises to be caught in the vortex of public opinion, resulting in damage to corporate reputations [26]. Furthermore, the collective wisdom of retail investors, through information sharing on social media platforms, conveys to managers the public’s demands and expectations regarding the environment and the green transformation of enterprises. In the field of institutional economics, public opinion is an informal institution [27]. In the face of institutional pressure, the judgment of a firm on whether public opinion represents an opportunity or a threat affects the further strategic decisions of the firm. Higher-order theory holds that the environmental cognition of management determines the strategic choices of the firm. External public pressure in relation to environmental protection will have a certain effect on this environmental cognition. When a company behavior that has a detrimental effect on the environment is exposed by public opinion, management is likely to enhance its environmental awareness in order to enhance its reputation and safeguard its own interests. Furthermore, punishing enterprises for polluting behavior has particular educational significance for managers and contributes to improving managers’ environmental awareness [28].
The environmental awareness of management is an important force in organizational management and affects the strategic judgment of enterprises, which, in turn, affects the environmental management practices of enterprises [29]. Environmental awareness is the premise for enterprises to undertake green investment. Management with strong environmental awareness will regard the reduction of negative environmental behaviors as an aspect of corporate social responsibility. The development of green production technology is an important way of reducing corporate environmental pollution. Therefore, the stronger the environmental awareness of enterprises, the more they will take responsibility for green innovation, and the more willing they will be to invest in green innovation. Informal institutional pressure has enhanced the environmental awareness of management and has prompted enterprises to incorporate the concept of environmental protection in all aspects of production work—the concept of environmental protection becomes the internal driving force of enterprise operations [30].
To sum up, the public attention generated by the social media interaction of retail investors can enhance the environmental awareness of enterprises, which encourages the formulation of green innovation strategies by enterprises [31]. In this way, enterprises are encouraged to continuously improve their green technology capabilities in order to enhance their competitiveness and build a good corporate image. Based on this argument, this paper proposes the following hypothesis:
Hypothesis 2 (H2).
The social media interaction of retail investors enhances the environmental awareness of enterprises, which, in turn, promotes the green innovation of enterprises.

2.2.3. Social Media Interaction of Retail Investors, Innovation Ability and Corporate Green Innovation

Green innovation is characterized by high capital intensity and long cycles, requiring sustained investment in R&D funding, environmental protection equipment and human capital [32], with financial resources serving as a key driving force for enterprises to engage in green innovation. To achieve profit goals when financial resources are scarce, enterprises are inclined to choose projects with rapid returns on investment. Only when enterprise resources are sufficient are enterprises likely to consider investing in projects with long-term benefits. However, the processes of green innovation projects are complex, and the degree of information asymmetry is high, so it is difficult to estimate their long-term value with reasonable accuracy [33]; furthermore, achieving economic value is not ensured. Therefore, the enthusiasm of enterprises to engage in green innovation is easily affected by inherent resources. The weaker the resource base of the firm, the less willing it will be to carry out green innovation. Limited access to financial resources is one of the reasons for a lack of motivation for enterprises to carry out green innovation [34]. Studies have pointed out that information asymmetry is an important factor in corporate financing constraints [35].
The theory of information asymmetry holds that investors are at a disadvantage when it comes to information acquisition. Information asymmetry between enterprises and investors will affect the decision-making of investors. However, a reduction in the degree of information asymmetry depends not only on the initiative of enterprises to disclose information but also on investors’ own acquisition and interpretation of corporate information. In an era of open information, investors can obtain corporate information easily through Internet searches and can exchange views with other investors via social media platforms. This Internet-based kind of information acquisition and interaction reduces the degree of information asymmetry between investors and enterprises and realizes the supervision of enterprise behavior by external entities.
In turn, investors increase the supply of corporate information on the capital market through social media interaction. Easing information asymmetry will help investors to estimate the long-term value of corporate investment projects, thus helping enterprises to obtain more financial support, reduce the cost of external financing and alleviate their financing constraints. Abundant resources are a necessary condition for enterprises to conduct green innovation activities. Social media, which is based on mobile Internet, provides an interactive platform for investors to exchange real-time information so that enterprises can carry out green innovation activities. The openness of a network social media platform means that the interaction of investors has a strong information diffusion effect—any user can share, view and comment on the interactive content of other users at any time, which greatly expands the dissemination scope of corporate innovation information in the financial market. This kind of interactive information disclosure reduces the information asymmetry between enterprises and external entities and is conducive to easing the financing constraints of enterprises. It produces positive incentives for enterprises to carry out green innovation. Based on this argument, this paper proposes the following hypothesis:
Hypothesis 3 (H3).
The social media interaction of retail investors alleviates the financing constraints of enterprises and thus promotes the green innovation of enterprises.
Based on the above assumptions, Figure 1 shows the research framework diagram for the research hypotheses in this paper.

3. Research Design

3.1. Sample Selection and Data Source

This study uses data from listed Shanghai and Shenzhen A-share enterprises from heavy pollution industries from 2008 to 2021 to empirically test the effect of the social media interaction of retail investors on corporate green innovation. Enterprises that are heavy polluters are selected as the research sample mainly because China has vigorously advocated for green development since the nineteenth session of the National Congress of the Chinese Communist Party. Enterprises that cause environmental pollution are not only the key targets of supply-side structural reform but have also attracted the attention of the media in recent years. In an era when China is vigorously promoting high-quality development, it is of great practical significance to study the green innovation of enterprises that pollute the environment. This paper refers to the research of Ni and Kong [36] and is guided by the “Management Directory of Listed Companies Environmental Protection Industry Classification” and “Guide on Listed Companies’ Environmental Information Disclosure” issued by the Ministry of Ecology and Environment of the People’s Republic of China in 2008 and 2010, respectively, combined with the industry classification standard that was revised by the China Securities Regulatory Commission in 2012. This paper selected 16 polluting enterprises from industries such as coal mining and washing, oil and natural gas mining and black metal mining.
The relevant data sources of this paper are as follows: (1) green innovation data were obtained from the State Intellectual Property Office, which we retrieved manually; (2) data related to the social media interaction of retail investors originated from the China Research Data Services Platform (CNRDS); and (3) data of other variables were sourced from corporate annual reports, the “China Environmental Statistical Yearbook”, the platform of the Institute of Public and Environmental Affairs, the “Market Index Report” of China by province, the CNRDS and the China Stock Market and Accounting Research Database. In accordance with the practices of other studies, this study conducts the following operations on the original data that were collected and sorted: (1) we eliminate the samples processed by ST, *ST and PT during the study period (key indicators reflecting the special financial conditions or delisting risks of listed companies); (2) we remove missing samples of relevant variable data during the study period; (3) we exclude the sample of the IPO year; and (4) to avoid the impact of extreme values on the regression results, we winsorize 1% up or down for all continuous variables in this paper.

3.2. Definitions of Variables

3.2.1. Explained Variable: Corporate Green Innovation (Green)

The innovation levels of patents, from high to low, are invention patent, utility model patent and design patent. Substantive innovation oriented by technological progress is the source of enterprise value and is used to reflect the innovation ability of enterprises; the patent technology in the application process may have an impact on the value of enterprises. Therefore, with reference to the practice of Li et al. [26], this study measures the green innovation level of enterprises by the number of green invention patent applications of the companies in the sample. The IPC Green Inventory, which was launched by the World Intellectual Property Organization in 2010, divides green patents into seven categories, of which transportation, administrative, regulatory or design aspects, nuclear power generation and agriculture/forestry are less relevant to polluting industries; these categories also involve fewer green patent classifications.
Therefore, based on the research of Li and Xiao [6], this study uses three green patent projects—alternative energy production, waste management and energy conservation—as the basis for measuring green innovation and uses the green patent classification number listed in the IPC Green Inventory. The green invention patent application data of heavily polluting enterprises were manually searched for on the website of the State Intellectual Property Office and, finally, the green innovation level of enterprises was measured by the natural logarithm (Green), according to the number of sorted green invention patent applications plus 1. At the same time, we selected the total number of green patent applications and the total number of green patent grants for a robustness test.

3.2.2. Explanatory Variable: Retail Investors’ Social Media Interactions (Post/Read/Comment)

On the most visited stock network forum in China, the high ratio of users to minority shareholders provides us with a good research environment. The Guba Database, under the CNRDS, uses machine learning to carry out statistical and sentiment analysis on Oriental Wealth stock bar forum posts and divides stock bar posts into three categories—positive, neutral and negative—according to natural day. We use STATA 17.0 software to sum daily data into annual data, and we draw references from the studies of Wang et al. [37] and Sun et al. [38]. The natural logarithm of the number of posts (Post), the number of reads (Read) and the number of comments (Comment) on the stock exchange are used to measure the degree of interaction between retail investors on social media.

3.2.3. Intermediate Variables

  • Environmental awareness (EnvAware)
This paper draws on the research of Liu et al. [30]. Python 3.11 is used to capture keywords appearing in the 2008–2021 annual reports of listed companies related to the environment (such as environmental awareness, environmental standards, environmental friendliness), green (such as green development, green products, green environmental protection), concepts (such as green water and green mountains, new development concepts, recycling) and other ideas and concepts relevant to corporate environmental protection. The appearance frequency of each keyword is counted. We use the total word frequency of enterprise environmental protection keywords plus the natural logarithm of 1 to measure the intensity of enterprise environmental protection awareness.
  • Financing constraints (WW)
The existing literature primarily measures financing constraints using the KZ index [39], the WW index [40]) and the SA index [41]. Compared with the SA index, the WW index incorporates financial indicators such as cash flow and debt, which can more meticulously reflect the financing difficulties faced by enterprises. Meanwhile, the WW index excludes Tobin’s Q, which helps better address endogeneity issues. Therefore, in accordance with the research of Wu Chaopeng and Tang Di [42], this paper uses the financing constraint index, namely the WW index, to measure the financing constraints faced by enterprises. The larger the value of the WW index, the higher the degree of financing constraint.

3.2.4. Control Variables

The research question of this paper refers to both the governance effect of social media and corporate green innovation; therefore, to exclude the influence of other factors on the results of regression analysis, this paper refers to the studies of Jiang et al. [43], Li and Xiao [6] and Yang et al. [10] and introduces a series of variables: news media attention (Media), business size (Size), capital structure (Lev), profitability (Roa), business age (Age), capital intensity (Ppe), cash flow (Ocf), property nature (Soe) and dual function (Dual). In addition, all regressions control for year, industry and province fixed effects and are clustered at the firm level. The main variable definitions are given in Table 1.

3.3. Model Construction

To test the effect of social media interaction of retail investors about listed enterprises in heavily polluting industries on corporate green innovation, this study constructs a regression model. First of all, to explore the effect of social media interaction by retail investors on corporate green innovation, the following regression model is estimated:
Greeni,t = β0 + β1Posti,t−1/Readi,t−1/Commenti,t−1 + ΣβnControlsi,t + Year + Industry + Province + εi,t
where Greeni,t is the green innovation level of enterprise i in year t; Posti,t−1/Readi,t−1/Commenti,t−1 and t − 1, respectively, represent the number of posts, reads and comments by retail investors of enterprise i in yeart−1; Controlsi,t indicates control variables; and Year indicates the year fixed effect. Industry indicates the industry fixed effect; Province indicates the Regional fixed effect. β0 is the intercept term; β1, βn are variable coefficients; and εi,t is the random error term.
Secondly, in the part of mechanism analysis, this paper uses the method of Wen and Ye [44] to test the mediating effects of environmental awareness and financing constraints. The regression model is as follows, and the control variables are the same as model (1):
EnvAwrei,t/WWi,t = β0 + β1Posti,t−1/Readi,t−1/Commenti,t−1 + ΣβnControlsi,t + Year + Industry + Province + εi,t
Greeni,t = β0 + β1EnvAwrei,t/WWi,t+ β2Posti,t−1/Readi,t−1/Commenti,t−1+ ΣβnControlsi,t + Year + Industry + Province + εi,t

4. Empirical Test Results and Analysis

4.1. Descriptive Statistics of Variables

Table 2 shows the descriptive statistics of the main variables in this paper. During the study period, (1) the median value of Green innovation (Green) was 0.000, the standard deviation was 0.549 and the minimum and maximum values were 0.000 and 2.773, respectively, which indicates that the green innovation level of China’s enterprises that are involved in serious pollution was generally low; the green innovation levels of different enterprises varied greatly; and (2) the median values of social media interaction of retail investors (Post/Read/Comment) were 8.702, 15.600 and 9.293, respectively, and the mean values were 8.694, 15.600 and 9.275, respectively, which are greater than the median and mean values of news media attention. This shows that retail investors interact with different enterprises more evenly on social media; social media has advantages over traditional media in terms of the amount of information transmitted. At the same time, this finding reflects the characteristics of retail investors’ active “voices” on social media.

4.2. Correlation Analysis

Table 3 reports the correlation coefficients of the main variables. Green innovation (Green) and social media interaction of retail investors (Post/Read/Comment) are significantly and positively correlated at the confidence level of 1%, which indicates that social media interaction of retail investors has a positive impact on the green innovations of enterprises. With this finding, Research Hypothesis 1is preliminarily verified. In addition, the correlation coefficients between Post and Read; Post and Comment; and Read and Comment are as high as 0.811, 0.683 and 0.722, respectively, which indicates that the three indicators that measure explanatory variables have a certain homogeneity. Furthermore, the absolute values of the correlation coefficients between the control variables are all lower than the multicollinearity threshold of 0.7 in the classical literature, which indicates that there is no significant multicollinearity problem between the study variables, and subsequent regression results will not be affected.

4.3. Hypothesis Testing

4.3.1. Reference Regression Test

To test the effect of social media interaction by retail investors in listed enterprises in heavy polluting industries on corporate green innovation, this paper first uses Model (1) to conduct regression analysis; Table 4 lists the regression results of the model. Columns (1), (3) and (5) are regression analysis results that control only the fixed effects of industry, year and province. The coefficients of explanatory variables (Post/Read/Comment) are 0.097, 0.099 and 0.067, respectively, all of which are significant at the 1% confidence level. Subsequently, control variables were added to Columns (2), (4) and (6), and the coefficients of explanatory variables (Post/Read/Comment) are 0.042, 0.046 and 0.030, respectively, all of which are significant at least at the 5% level. These regression results show that the more frequent the interaction of retail investors on social media, the higher the level of green innovation of enterprises. Taking Column (2) as an example, if the interaction degree of retail investors on social media increases by 10%, the green innovation level of enterprises increases by 0.4%; that is, the social media interaction of retail investors in listed enterprises in industries that are heavy polluters has a significant promoting effect on the green innovation of enterprises. Hypothesis 1 is assumed to be established. In addition, the correlation between control variables such as news media attention (Media), firm size (Size), capital structure (Lev) and explained variables such as green innovation (Green) is basically consistent with previous studies [6,10,43].

4.3.2. Mechanism Test

  • Mechanism test based on innovation consciousness
The environmental awareness of enterprise management changes together with the external environment. When an enterprise is concerned about the view of society because of a certain green technology, the enterprise will improve and upgrade the green technology further to build entry barriers and safeguard its own interests. In contrast, when an enterprise is exposed by public opinion for behavior that is detrimental to the environment, in addition to being punished, the enterprise is likely to enhance its environmental awareness and actively deal with the environmental problems it faces [28]. In other words, the pressure of public opinion on protecting the environment enhances the environmental awareness of enterprises and causes management to realize the importance of green development for enterprises and even society, thus promoting the green innovation practices of enterprises. To test this mechanism, this study uses the mediation effect test model to test the mechanism of the effect of social media interaction of retail investors on corporate green innovation.
Because of space constraints, the direct regression results of retail investors’ social media interaction (Post/Read/Comment) on corporate green innovation, after the removal of missing values of the intermediate variable (EnvAware), are not presented in Table 5. At this time, the coefficients of retail investors’ social media interaction (Post/Read/Comment) are 0.041, 0.044 and 0.029, respectively. From the regression results in Table 5, it is clear that there is a significant positive correlation between retail investors’ social media interaction (Post/Read/Comment) and the environmental awareness (EnvAware) of an enterprise, at the level of 5%, which indicates that the social media interaction of retail investors has a positive effect on enhancing the environmental awareness of an enterprise. When the variable of corporate environmental awareness is added to the regression model, corporate environmental awareness (EnvAware) significantly and positively correlates with green innovation, and retail investors’ social media interaction (Post/Read/Comment) is still significantly positively correlated with corporate green innovation (Green). This indicates that environmental awareness is the intermediary mechanism for retail investors’ social media interaction to enhance green innovation. In other words, retail investors’ social media interaction promotes the green innovation activities of enterprises by enhancing enterprises’ environmental awareness, and we can assume Hypothesis 2 is established.
  • Mechanism test based on innovation ability
In the process of green innovation, information asymmetry between internal and external entities is an important reason for innovation activities to fall into financial difficulties. Investors’ analysis and interpretation of information is promoted by better corporate information disclosure and the mitigation of information asymmetry [27]. Investors’ social media interaction on Internet platforms overcomes the drawbacks of traditional disclosure methods. This kind of real-time information interaction improves the efficiency of external subjects’ immediate interpretation of information, reduces the lag interpretation [45], helps investors to understand the real-time dynamics of enterprises in a timely manner, reduces information asymmetry and thus reduces the negative impact of financing constraints on green innovation. Therefore, this study uses the mediation effect test model to test the mechanism of financing constraints on the promotion of corporate green innovation by social media interaction of retail investors.
Owing to space constraints, the direct regression results of retail investors’ social media interaction (Post/Read/Comment) on corporate green innovation, after the removal of the missing value of the intermediate variable financing constraint (WW), are not presented in Table 6. At this time, the coefficients of retail investors’ social media interaction (Post/Read/Comment) are 0.050, 0.053 and 0.034, respectively. From Columns (1), (2) and (3) of Table 6, it is clear that the regression coefficients of retail investors’ social media interaction (Post/Read/Comment) and corporate financing constraints (WW) are significantly negative at the statistical level of 1%, which indicates that social media interaction of retail investors can help alleviate corporate financing constraints. As can be seen from Columns (4), (5) and (6) in Table 6, when financing constraint (WW) is added to the regression model, it is significantly negatively correlated with corporate green innovation, and the degree of retail investors’ social media interaction (Post/Read/Comment) is still significantly positively correlated with corporate green innovation. This indicates that financing constraints are the intermediary mechanism by which social media interaction of retail investors affects corporate green innovation. Thus, the social media interaction of retail investors alleviates the financing constraints of enterprises and thus promotes the green innovation of enterprises. We can assume that Hypothesis 3 is established.

4.3.3. Robustness Test

  • Difference-in-difference test
To solve the endogeneity problem, the difference-in-difference (DID) model is re-examined to improve the robustness of the research conclusions. The stock bar mobile terminal is the product of the popularization of mobile Internet technology and was not established to affect the green innovation of enterprises. Therefore, the emergence of the stock bar mobile terminal is a powerful exogenous effect in relation to the research problem of this paper. Moreover, the establishment of the stock bar mobile terminal has different effects on different companies. We believe that the establishment of the stock bar mobile terminal has greatly improved convenience for users, and the main participants in social media are retail investors. That is, the more retail investors a company has, the more active the interaction between retail investors will be after the launch of the stock bar mobile terminal, which will stimulate discussion on enterprise-related matters among retail investors and help retail investors to supervise the behavior of listed companies [37]. Therefore, this paper takes “the establishment of mobile end of stock bar” as an exogenous impact and draws on the practice of Jiang et al. [43] to group the average number of minority shareholders (the number of corporate shareholders—the number of institutional investors) of all enterprises in heavily polluting industries in the median group. Listed companies with a greater number of minority shareholders are set as the experimental group, and Treat is assigned as 1. Listed companies whose number of minority shareholders is less than the median are set as the control group, and the Treat value is 0. As for the selection of the time window, we first take five years before and after the launch of the stock bar mobile terminal as the standard (2010–2019). If the sample is located in 2015–2019 (2010–2014), the value of after is 1 (0). Considering that DID in a single phase is susceptible to interference from other event factors, this paper also narrows the time window to three years (2012–2017) before and after the launch of the stock bar mobile app for re-testing. If the sample was located in 2015–2017 (2012–2014), the value of after is 1 (0). The selection and definition of other variables are the same as in Model (1). The specific regression model is as follows:
Greeni,t = β0 + β1Treati,t × Afteri,t + β2Treati,t + ΣβnControlsi,t + Year + Industry + Province + εi,t
In Model (4), the coefficient β1 of Treat × after is the focus. It can be seen from the test results in Table 7 that the coefficient is significantly positive; thus, after the establishment of the mobile end of the stock bar, listed enterprises in heavily polluting industries with a large number of minority shareholders will have a more obvious green innovation improvement effect, which is consistent with the empirical results presented above. In addition, the premise of the DID test is that there is a parallel trend between the experimental and control samples in the explained variables before the policy is implemented. To this end, this study combines the event study approach to conduct the parallel trend test (2012–2017) on the dynamic effects before and after the establishment of the stock bar mobile terminal, and the results are shown in Figure 2. We take the year before the launch of the stock bar mobile terminal (2014) as the baseline, and current represents the year of the launch of the stock bar mobile terminal (2015), with the left and right scales corresponding to the periods before and after the launch of the stock bar mobile terminal. It can be seen that the explained variables in this paper have a common trend before the launch of the stock bar mobile terminal.
  • Propensity score matching
To reduce the effects of the own characteristics of enterprises (such as enterprise size, performance level and property rights) on the research results, this study uses a propensity score method to resolve the estimation bias caused by sample selection bias in regression analysis. First, according to the average values of Post, Read and Comment, interact binary virtual variables are constructed respectively: when interact is 1, retail investors have a higher degree of social media interaction; when interact is 0, retail investors have a low degree of social media interaction; in this way, the experimental group and the control group are constructed. Second, this study takes the control variables in Model (1) as the characteristic variables and controls the fixed effects of year, industry and province at the same time. Then, the logit model is used for regression, and the propensity score is calculated. Next, the nearest neighbor matching method is used to carry out one-to-many matching. Finally, the samples that satisfy the common supporting hypothesis are retained, and the regression is performed again using Model (1). According to Table 8, the regression results are consistent with the conclusions above.
  • Remeasurement of the argument
At present, online social media platforms, such as forums and stock bars, continue to emerge and provide good channels for communication between participants in the capital market. In this paper, the stock bar network platform was used as the research scene. Although the stock bar platform has good representation, the interaction between retail investors takes place mainly in the stock bar, which lacks the participation of company management and may have a more indirect impact on decision-making by management [46]. On the interactive platform, retail investors can pose questions directly to the management of an enterprise, and according to the rules of the platform, the enterprise must arrange for professionals to respond to the questions of investors in a timely manner. Such direct interaction between investors and enterprise management reflects the governance tendency of retail investors [47]. In this regard, to ensure the robustness of the research conclusions, we refer to the studies of Yang and Zhang [33] and Pan et al. [18]. In this study, the social media interaction of retail investors is measured by the investor interaction platform question data, namely the total number of investor questions (Ques_Num), the total number of investor environment-related questions (GreenQues_Num) and the ratio of investor environment-related questions to the total number of questions (GreenQues_Ratio). The regression results in Table 9 show that Ques_Num, GreenQues_Num and GreenQues_Ratio are still significantly positively correlated with Green, which indicates that the research conclusion of this study is robust.
  • Change how the dependent variable is measured
The total number of green patent applications and the total number of green patent grants are used to remeasure the green innovation level of enterprises, which is, specifically, (1) Green_application = l n (total number of green patent applications of enterprises + 1) and (2) Green_grant = l n (total number of enterprise green patent grants + 1); then, Model (1) is used for regression. The results are shown in Table 10. In general, the social media interaction of retail investors maintains a relatively significant positive correlation with corporate green innovation—a finding that is consistent with the test results given above.
  • Change measurement model
Since the explained variable (Green) has a clustering phenomenon at the minimum value 0 and is a truncated variable with non-normal distribution, this study uses the Tobit model to control the bias caused by the truncated variable. The test results after the replacement of the measurement model are shown in Table 11. The coefficients of explanatory variables (Post/Read/Comment) are all significantly positive, and the research conclusions above are verified.
In empirical analysis, OLS (ordinary least squares) is widely used for its simplicity and interpretability, though its core assumptions require the dependent variable to theoretically allow unrestricted variation and the error term to follow a normal distribution. However, the dependent variable in this study exhibits a significant clustering effect at zero, meaning OLS may produce biased coefficient estimates due to neglecting the truncation mechanism. In contrast to OLS’s insufficient utilization of data truncation information, the Tobit model can simultaneously account for the generation processes of zero and positive values through maximum likelihood estimation, theoretically providing more efficient parameter estimates.
This study employs an OLS model in the baseline regression and supplements it with a Tobit model in robustness tests. The regression results show consistent coefficient signs and close significance levels between the two models, indicating that the core conclusions are insensitive to model selection and enhancing the robustness of the results. Therefore, although OLS has theoretical limitations due to data truncation in this study, its combined use with the Tobit model still forms an effective analytical framework. Moreover, the robustness tests confirm the consistency of the research conclusions, suggesting that OLS is applicable in this specific context.
  • Change time series
The results of green innovations of enterprises require a certain time to realize. Therefore, we re-examine the green innovation of enterprises by using the social media interaction of retail investors with a lag of 2 and 3 periods. The regression results in Table 12 show that the coefficient of the independent variable is significant at least at the level of 5%, which is consistent with the main conclusions of this paper.

5. An Examination of the Moderating Effects of Social Media Environment

With the rapid development and popularization of Internet technology, social media, instead of traditional media, has gradually become a channel for enterprises to exchange information with the outside world. However, the quality of information published on social media platforms and the emotional tendencies expressed in the information content have a certain effect on the corporate governance of social media. Therefore, this part explores in depth the moderating effect of the quality and the emotional nature of the environment of social media information on the relationship between social media interaction of retail investors and corporate green innovation. This discussion will promote our understanding of the marginal effect conditions of public opinion via social media in promoting corporate green innovation.

5.1. Testing the Moderating Effect of Information Environment Remediation on Information Quality of Social Media

The information transmitted by media can trigger the reaction of participants in the capital market, which, in turn, has an effect on economic and social development [48,49,50]. This is an important reason why the media plays a role in governance [51]. Social media is a product of the Internet era and has greatly enhanced the dissemination of information. One of the functions of social media is corporate governance [48,52]. Traditional media is guaranteed by the reputation of the newspaper; in contrast, the accountability mechanism of social media is imperfect, and the cost to users of spreading false information is low. Therefore, in spite of improving the efficiency of information dissemination, the Internet and social media are, to some extent, also “connived” at the “prevalence” of false information on media platforms. The presence of false information will not only reduce the trust of capital market participants in the network information environment but also adversely affect the role of social media governance [53]. Therefore, effective governance of the Internet spatial information environment is an important issue facing China. Studies have found that Internet information environment remediation increases the risks and cost of network users spreading false information, thereby effectively improving the quality of information on the Internet and on social media and helping social media to play a role in corporate governance [38].
With reference to Sun et al. [38] and Wang et al. [37], this paper agrees that “online defamatory information ‘forwarded more than 500 times’ can be prosecuted for criminal responsibility” and takes it as an exogenous scenario to explore the differential impact of retail investors’ social media interaction on enterprises’ green innovation practices before and after the implementation of Internet information environment remediation measures. In this paper, Policy is defined as the dummy variable before and after the implementation of Internet information environment remediation measures in 2013; that is, the value of policy before and after 2013 is 0, otherwise it is 1. The cross-multiplicative regression method is adopted to test the difference in enterprise green innovation before and after the implementation of Internet information environment remediation measures. It can be reasonably expected that Internet remediation measures will effectively improve the network information environment, enhance the information quality of social media and enable the information on social media to be adopted by more market participants, thereby improving the effectiveness of its governance effect on the behavior of listed companies. The regression results are shown in Table 13. The coefficients of social media interaction (Post/Read/Comment × Policy) and the information environment remediation of retail investors are both positive, and the coefficients of Read × Policy and Comment × Policy are significantly positive at the level of at least 10%. This shows that the better the social media information quality environment, the stronger the role retail investors can fulfil via social media interaction to promote corporate green innovation. Therefore, this paper believes that, after implementing Internet information environment remediation measures, the interaction behavior of retail investors on social media was significantly more effective in influencing the green innovations of enterprises.

5.2. Examining the Moderating Effect of the Emotional Environment Caused by Social Media Information

China is a capital market with retail investors as the main body. Therefore, stock bars are generally considered to be communication platforms for retail investors [54]. As the main participants of stock bars, retail investors often convey optimistic or pessimistic views on the operating status, earnings expectations and future developments of companies in the daily postings of the stock bar—this information represents investor sentiment. Under the powerful information-dissemination power of the stock market, such sentiments will resonate with the majority of investors and trigger the convergence behavior of investors, thus placing the enterprise in a strong “emotional environment” [55]. Studies have found that, compared with the inhibitory effect of negative emotions on innovation activities, positive emotions can boost public confidence in enterprise innovation research and development, thus promoting enterprise innovation activities [56]. Similarly, when an enterprise is subject to more positive public opinion, the media will convey positive information about the enterprise to the outside world and enhance investor confidence [57]. To maintain the good reputation of enterprises, managers will be more willing to take actions that are conducive to the long-term development of enterprises and that could enhance the value of enterprises, so that the good reputation can be maintained. Then, under the effect of an “emotional spiral”, a positive social media environment could promote the green innovation activities of enterprises. Therefore, it can be reasonably predicted that a relatively optimistic stock market sentiment of retail investors is more likely to promote the green innovation behavior of enterprises.
This paper refers to the research of Antweiler and Frank [58] and Yang et al. [59] and creates the optimistic post volume (Pospost) and pessimistic post volume (Negpost) of stock bars. Sentiment = l n[(Pospost + 1)/(Negpost + 1)], an indicator representing the sentiment posted by retail investors overall in this year, is constructed, and the differences in corporate green innovation generated by different social media emotional environments are tested by means of interaction term regression. The empirical test results are shown in Table 14. The regression results show that the coefficients of the cross-pollination term (Post/Read/Comment × Sentiment) are significantly positive at the level of at least 5%, which indicates that the more positive the emotional environment of social media information, the stronger the role of social media interaction of retail investors in promoting corporate green innovation.

6. Heterogeneity Test of External Institutional Environment

The institutional environment has a profound effect on the production and management activities of enterprises. The green innovation activities of enterprises are not only restricted by environment-related laws and regulations but also influenced by informal institutional factors. Therefore, this section includes the external institutional environment in the research framework and discusses the heterogeneous role of the external institutional environment (environmental information supervision and regional investor protection) in the social media interaction of retail investors and the promotion of corporate green innovation.

6.1. Heterogeneity Test Based on Environmental Information Regulation

Today, China is experiencing a period of economic transition. The allocation of key resources needed by enterprises is mostly in the hands of the government, and the supervision mechanism of public opinion requires further improvement. Government regulation greatly affects the role of public opinion in corporate governance [60]. When an enterprise commits an environmental violation, the media’s public opinion information triggers the intervention of the Central Supervision Office of Ecological and Environmental Protection, resulting in increased risks for the enterprise. Furthermore, the disclosure of polluting behavior will damage the green image of enterprises and weaken their market competitiveness. Studies have found that if enterprises increase their investment in green innovation, this can improve government satisfaction and enhance the market competitiveness for that enterprise [61]. Improving government satisfaction is an important way for enterprises to enhance their legitimacy. Therefore, to avoid risks and enhance legitimacy, enterprises often choose to increase their green investment [62].
Consequently, this study draws on the research of Shen and Feng [63] and adopts China’s Pollution Source Supervision Information Disclosure Index (PITI Index) as an indicator to measure the environmental information supervision provided by local government. The PITI Index mainly evaluates the supervision of urban pollution sources, pollution treatment work and information disclosure to the public. It provides the most comprehensive and objective data to evaluate the implementation of environmental information disclosure policies of local governments in China and reflects the environmental supervision efforts of local government. The more transparent and strictly regulated urban environmental information is, the higher the index score. Because the PITI Index has data up to 2019, the empirical data range for this section is 2008–2019. Depending on whether the intensity of government environmental information supervision of the city in which an enterprise is located is greater than the annual and industry median, we distinguish between a weak supervision group and a strong supervision group and conduct a sub-sample test on the relationship between the social media interaction of retail investors and the green innovation practice of enterprises. According to the regression results provided in Table 15, only in the strong supervision group does the social media interaction of retail investors have a significant promoting effect on the green innovation practices of enterprises. This is because in areas with strong environmental information supervision, government departments pay closer attention to ecological protection than the pursuit of economic progress. Then, once the negative pollution behaviors of enterprises have been exposed by public opinion, not only do the enterprises face penalties imposed by environmental regulatory authorities, but also, the government is less satisfied with those particular enterprises. Therefore, government environmental information supervision can improve the sensitivity of enterprises to public opinion and promote pressure by public opinion, which then improves its role in promoting the green innovation of enterprises.

6.2. Heterogeneity Test Based on Regional Investor Protection

Although China is in a transitional economic stage, the legal system as it relates to investor protection needs to be improved, and there is room for improvement in the protection of the rights and interests of retail investors. However, the level of investor protection varies greatly by region. The effect of information disseminating interaction of retail investors on social media on green innovation by enterprises is closely related to the level of investor protection in the region where the enterprises are located. In regions with relatively sound investor protection systems, information liquidity is stronger, transparency is higher and trading behavior in the market is easier to observe by investors. Once an enterprise breaks faith with retail investors, it is punished by the capital market [64]. In regions with relatively high levels of investor protection, retail investors have a stronger sense of self-protection and object to the self-interested behaviors of major shareholders and managers; this objection by investors can restrict opportunistic behaviors to a great extent. In the information age, investors and netizens are strongly coupled, and the “agglomeration effect” of social media makes it easier for retail investors in areas with high levels of investor protection to “bind together”, thus realizing the supervision of and intervention in corporate behavior.
Consequently, with reference to the research of Dou and Luo [65], this study uses the market development scores of provinces and cities in the Fan Gang Marketization Index to measure the levels of investor protection in the regions where enterprises are located. Depending on whether the level of investor protection in a region is greater or weaker than the annual and industry medians, we divide the companies into a strong protection group and a weak protection group and conduct a sub-sample test on the relationship between the social media interaction of retail investors and corporate green innovation. As can be seen from the group test and the difference results of regression coefficients in Table 16, when the investor protection level is higher in the region where the enterprise is located, the regression coefficients of Post, Read and Comment are significantly higher than those of the low protection group. In other words, the promotion effect of social media interaction of retail investors on corporate green innovation is more obvious for enterprises that operate in regions that have higher investor protection levels.

7. Conclusions and Implications

7.1. Research Conclusions

The impact of stakeholders on corporate green innovation activities has been examined in previous research from various perspectives, including media attention [12,66], common institutional ownership [67], institutional investors [68,69], investor communication [70] and environmental investors [71].
By investigating Shanghai–Shenzhen A-share listed enterprises in heavily polluting industries from 2008 to 2021, this paper discusses the relationship between social media interaction of retail investors and corporate green innovation and draws the following main conclusions.
The social media interaction of retail investors can promote corporate green innovation. This indicates that public opinion expressed via social media plays a positive role in promoting corporate green innovation. This conclusion is still valid after conducting robustness tests, such as controlling endogeneity and changing the definition of variables.
The results of the mechanism test show that the social media interaction of retail investors promotes the green innovation practices of enterprises mainly by enhancing their innovation awareness and innovation ability. Specifically, the social media interaction of retail investors can enhance the environmental awareness of enterprises, alleviate financing constraints of enterprises and promote green innovations by enterprises.
The moderating effect test results show that interaction that involves good quality information and generates positive public opinion has a positive moderating effect on the relationship between retail investors’ social media interaction and corporate green innovation. Heterogeneity analysis found that in regions with higher environmental supervision intensity and higher investor protection, the social media interaction of retail investors has a stronger promoting effect on corporate green innovation.

7.2. Policy Suggestions and Managerial Implications

This study reveals the mechanisms and practical impacts of social media interactions by retail investors on corporate green innovation, with findings that offer multi-dimensional insights for various stakeholders:
For Enterprises, the conclusions highlight the new role of retail investors—traditionally a vulnerable group—in modern corporate governance. The informal supervision mechanism formed through social media interactions prompts enterprises to internalize environmental responsibility as a core element of strategic decision-making, urging management to optimize resource allocation and accelerate green technology R&D. The mitigating effect of financing constraints provides a feasible path for enterprises to convert environmental performance into financing advantages, incentivizing them to enhance capital market recognition by improving ESG information disclosure and establishing investor interaction response mechanisms. The study also warns enterprises to heed the changing investor preferences reflected in online public opinion, integrate green innovation into long-term value creation systems and enhance sustainable development capabilities by building a virtuous cycle between environmental governance and financial performance.
For Investors, the research finds that social media interactions serve not only as a vehicle for information exchange but also as an external governance force influencing corporate strategic decisions, offering new pathways for retail investors to participate in corporate governance. By confirming that online public opinion indirectly promotes green innovation through enhancing corporate environmental awareness and alleviating financing constraints, the study shows that investors can form collective action effects through rational and sustained discussions on environmental issues, guiding capital allocation toward green technologies and achieving long-term value investment goals while fulfilling social responsibilities. This finding helps investors recognize the influence of non-financial issues and encourages their shift from passive observation to active participation in environmental governance.
For Policymakers, the conclusions provide a theoretical basis for improving the green financial system and capital market governance. The promoting effect of public opinion pressure from retail investors on corporate environmental behavior underscores the importance of building a diversified environmental supervision system. Policymakers need to further optimize online public opinion guidance mechanisms and enhance the quality and dissemination efficiency of environmental information disclosure. Meanwhile, the existence of financing constraint mitigation effects indicates structural gaps in current green financial policies, calling for measures such as innovating green credit tools and improving environmental rights trading markets to unblock capital transmission channels. The study also advises regulatory authorities to prioritize the standardization of investor interaction platforms, incorporate online public opinion monitoring into environmental governance evaluation frameworks and promote the formation of a green innovation ecosystem where market-driven forces and policy incentives operate synergistically.

7.3. Limitations and Future Research

This study investigates the impact of retail investors’ social media interactions on green innovation, yet it contains several limitations and areas for improvement.
First, the research focuses on heavy-polluting enterprises, whose unique characteristics may make them more sensitive to changes in external pressures. Future studies could adopt a full sample of listed companies to examine how retail investors influence green innovation. This approach would help generalize the findings beyond industry-specific contexts and mitigate potential bias arising from the concentrated sample selection, as the responsiveness of heavy-polluting firms to stakeholder pressures might not fully represent the broader corporate landscape.
Second, this study measures retail investors’ social media engagement by the quantity of posts and comments, which may include discussions on financial issues rather than exclusively environmental concerns. To address this, future research should refine the selection of independent variables to distinguish the effect of retail investors’ attention to environmental issues from their focus on financial matters. For example, constructing indicators that isolate environmental-related content (e.g., through sentiment analysis or keyword filtering) would enable a more precise assessment of how environmental-specific attention drives green innovation.
Third, the study treats retail investors as a homogeneous group, overlooking differences in their investment styles, expertise and capital scale. These heterogeneities can significantly shape their focus areas and influence corporate decisions. Incorporating investor segmentation—such as distinguishing between individual investors with varying risk tolerances, knowledge levels or investment horizons—would provide a more nuanced understanding of how different retail investor subgroups impact green innovation.
Finally, the current measurement of corporate green innovation may not fully capture the scope of a firm’s green technological research activities. Future research could employ broader indicators that encompass not only formal innovation outputs but also incremental technological improvements, sustainable process innovations and environmental management practices. This expanded framework would offer a more comprehensive evaluation of how stakeholder interactions translate into diverse forms of green initiatives beyond traditional metrics.

Author Contributions

Conceptualization, M.Z. and Y.S.; methodology, Y.S.; software, Y.S.; validation, Y.S., M.Z. and Z.Z.; formal analysis, Y.S.; investigation, M.Z.; resources, M.Z.; data curation, Y.S.; writing—original draft preparation, M.Z. and Y.S.; writing—review and editing, M.Z., Z.Z. and Y.S.; visualization, Y.S. and Z.Z.; supervision, M.Z.; project administration, M.Z.; funding acquisition, M.Z. All authors have read and agreed to the published version of the manuscript.

Funding

Natural Science Foundation of Hunan, China (2023JJ40247); Education Department of Hunan Province of China (23B0607).

Institutional Review Board Statement

Not applicable.

Informed Consent Statement

Not applicable.

Data Availability Statement

All data and materials are available upon request.

Conflicts of Interest

The authors declare no conflicts of interest.

References

  1. Lee, K.H.; Min, B. Green R&D for eco-innovation and its impact on carbon emissions and firm performance. J. Clear. Prod. 2015, 108, 534–542. [Google Scholar]
  2. Huang, M.; Li, M.Y.; Liao, Z.H. Do politically connected CEOs promote Chinese listed industrial firms’ green innovation? The mediating role of external governance environments. J. Clean. Prod. 2021, 278, 123634. [Google Scholar] [CrossRef]
  3. Huang, J.W.; Li, Y.H. Green innovation and performance: The view of organization capability and social reciprocity. J. Bus. Ethics 2017, 145, 309–324. [Google Scholar] [CrossRef]
  4. Liu, J.; Xiao, Y. China’s Environmental Protection Tax and Green Innovation: Incentive Effect or Crowding-out Effect? Econ. Res. J. 2022, 57, 72–88. [Google Scholar]
  5. Acemoglu, D.; Aghion, P.; Bursztyn, L.; Hemous, D. The environment and directed technical change. Am. Econ. Rev. 2012, 102, 131–166. [Google Scholar] [CrossRef] [PubMed]
  6. Li, Q.; Xiao, Z. Heterogeneous Environmental Regulation Tools and Green Innovation Incentives: Evidence from Green Patents of Listed Companies. Econ. Res. J. 2020, 55, 192–208. [Google Scholar]
  7. Jin, M. The Preference of Green Innovation Preference of Institutional Investors. Financ. Theory Pract. 2022, 65–75. [Google Scholar] [CrossRef]
  8. Jin, C.; Monfort, A.; Chen, F.; Xia, N.; Wu, B. Institutional investor ESG activism and corporate green innovation against climate change: Exploring differences between digital and non-digital firms. Technol. Forecast. Soc. Change 2024, 200, 123129. [Google Scholar] [CrossRef]
  9. Zhang, L.; Xie, Y.; Xu, D. Green Investor Holdings and Corporate Green Technological Innovation. Sustainability 2024, 16, 4292. [Google Scholar] [CrossRef]
  10. Yang, Z.; Chen, J.; Ling, H. Media Attention, Environmental Policy Uncertainty and Firm’s Green Technology: Empirical Evidence from Chinese A-share Listed Firms. J. Ind. Eng. Eng. Manag. 2023, 37, 1–15. [Google Scholar]
  11. Cai, C.; Fan, M.; Dong, X.; Zhang, J. The Effect of Environmental Protection-Related Media Coverage on Corporate Green Innovation. Sustainability 2024, 16, 10887. [Google Scholar] [CrossRef]
  12. Gao, X.; Zhang, G. Media coverage and corporate green innovation. Financ. Res. Lett. 2025, 74, 106740. [Google Scholar] [CrossRef]
  13. He, F.; Guo, X.; Yue, P. Media coverage and corporate ESG performance: Evidence from China. Int. Rev. Financ. Anal. 2024, 91, 103003. [Google Scholar] [CrossRef]
  14. Das, S.R.; Chen, M.Y. Yahoo! for Amazon: Sentiment extraction from small talk on the web. Manag. Sci. 2007, 53, 1375–1388. [Google Scholar] [CrossRef]
  15. Cade, N.L. Corporate social media: How two-way disclosure channels influence investors. Account. Organ. Soc. 2018, 68, 63–79. [Google Scholar] [CrossRef]
  16. Xiong, X.; Di, J.; Gao, Y. The Influence of Green Concerns on the Green Innovation of Listed Companies—Based on the Investor Interactive Platforms. Syst. Eng.-Theory Pract. 2023, 43, 1873–1893. [Google Scholar]
  17. Li, Y.; Zhang, W. The power of retail Investor voice: The effect of online discussions on corporate innovation. Br. J. Manag. 2023, 34, 1811–1831. [Google Scholar] [CrossRef]
  18. Pan, A.; Zhang, Q.; Li, G. Does Retail Investors’ Environmental Concerns Affect the Green M&A of Heavy Polluting Enterprises? Nankai Bus. Rev. 2024, 135–147. Available online: https://nbr.nankai.edu.cn/nkglpl/article/abstract/230206218 (accessed on 14 April 2025).
  19. Ang, J.S.; Hsu, C.; Tang, D.; Wu, C. The role of social media in corporate governance. Account. Rev. 2021, 96, 1–32. [Google Scholar] [CrossRef]
  20. Lepore, L.; Landriani, L.; Pisano, S.; D’Amore, G.; Pozzoli, S. Corporate governance in the digital age: The role of social media and board independence in CSR disclosure. Evidence from Italian listed companies. J. Manag. Gov. 2023, 27, 749–785. [Google Scholar] [CrossRef]
  21. Dimaggio, P.J.; Powell, W.W. The iron cage revisited: Institutional isomorphism and collective rationality in organizational fields. Am. Sociol. Rev. 1983, 48, 147–160. [Google Scholar] [CrossRef]
  22. Tornikoski, E.T.; Newbert, S.L. Exploring the determinants of organizational emergence: A legitimacy perspective. J. Bus. Ventur. 2007, 22, 311–335. [Google Scholar] [CrossRef]
  23. Shu, C.; Zhou, K.Z.; Xiao, Y.; Gao, S. How green management influences product innovation in China: The role of institutional benefits. J. Bus. Ethics 2016, 133, 471–485. [Google Scholar] [CrossRef]
  24. Xie, X.; Huo, J.; Qi, G.; Zhu, K.X. Green process innovation and financial performance in emerging economics: Moderating effects of absorptive capacity and green subsidies. IEEE Trans. Eng. Manag. 2016, 63, 101–112. [Google Scholar] [CrossRef]
  25. Xie, X.; Zhu, Q. How Can Green Innovation Solve the Dilemmas of “Harmonious Coexistence”? J. Manag. World 2021, 37, 128–149+9. [Google Scholar]
  26. Li, D.; Song, J.; Chen, L.; Li, D. Can the Media Pressure Foster Corporate Green Innovation? RD Manag. 2018, 30, 23–33. [Google Scholar]
  27. Han, G.; Gan, Y. Can Investors’ Attention Promote Green Innovation Performance? The Mediating Effect of Financing Constraints and the Moderating Effect of Environmental Regulation. Sci. Technol. Prog. Policy 2023, 40, 89–98. [Google Scholar]
  28. Dai, W.; Lu, W. The Impact of Environmental Public Opinion Pressure on Manufacturing Firm’s Green Innovation Capability: The Chain Mediating Role of Leader Environmental Awareness and Organizational Green Learning. Sci. Technol. Prog. Policy 2020, 37, 131–137. [Google Scholar]
  29. Yao, S.; Pan, Y.; Wang, L.; Sensoy, A.; Cheng, F. Building eco-friendly corporations: The role of minority shareholders. J. Bus. Ethics 2023, 182, 933–966. [Google Scholar] [CrossRef]
  30. Liu, Y.W.; Chen, X.J.; Gao, J.L.; Tan, H.Z. Media Attention and Green Technology Innovation in Heavily Polluting Enterprises. China Soft Sci. 2023, 9, 30–40. [Google Scholar]
  31. Petkova, A.; Wadhwa, A.; Yao, X.; Jain, S. Reputation and decision making under ambiguity: A study of US venture capital firms’ investments in the emerging clean energy sector. Acad. Manag. J. 2014, 57, 1077–1093. [Google Scholar] [CrossRef]
  32. Horbach, J.; Rammer, C.; Rennings, K. Determinants of eco-innovations by type of environmental impact—The role of regulatory push/pull, technology push and market pull. Ecol. Econ. 2012, 78, 112–122. [Google Scholar] [CrossRef]
  33. Yang, F.; Zhang, Y. Investors’ “Posting Information” via Social Media and Corporate Technical Innovation—A Study Based on Information Effect and Governance Effect. J. Shanxi Univ. Financ. Econ. 2021, 43, 115–126. [Google Scholar]
  34. Manso, G. Motivating innovation. J. Financ. 2011, 66, 1823–1860. [Google Scholar] [CrossRef]
  35. Myerss, C.; Majlufn, S. Corporate financing and investment decisions when firms have information that investors do not have. J. Financ. Econ. 1984, 13, 187–221. [Google Scholar] [CrossRef]
  36. Ni, J.; Kong, L. Environmental Information Disclosure, Bank Credit Decisions and Debt Financing Cost: Evidence from the Listed Company in Heavy Polluting Industries of A-Shares in Shanghai Stork Market and Shenzhen Stork Market. Econ. Rev. 2016, 1, 147–156+160. [Google Scholar]
  37. Wang, Y.; Dong, T.; Lu, C. The Impact of Minority Shareholders’ Voice in Social Media on Investment Efficiency. Bus. Manag. J. 2022, 44, 115–132. [Google Scholar]
  38. Sun, K.; Wang, D.; Xiao, X. Internet Scrutiny and Corporate Governance Effect of Social Media. J. Manag. World 2020, 36, 106–132. [Google Scholar]
  39. Kaplan, S.N.; Zingales, L. Do investment-cash flow sensitivities provide useful measures of financing constraints? Q. J. Econ. 1997, 112, 169–215. [Google Scholar] [CrossRef]
  40. Whited, T.M.; Wu, G. Financial constraints risk. Rev. Financ. Stud. 2006, 19, 531–559. [Google Scholar] [CrossRef]
  41. Hadlock, C.J.; Pierce, R. New evidence on measuring financial constraints: Moving beyond the KZ index. Rev. Financ. Stud. 2010, 23, 1909–1940. [Google Scholar] [CrossRef]
  42. Wu, C.; Tang, D. Intellectual Property Rights Enforcement, Corporate Innovation and Operating Performance: Evidence from China’s Listed Companies. Econ. Res. J. 2016, 51, 125–139. [Google Scholar]
  43. Jiang, X.; Zhu, L.; Yi, Z. Internet Public Opinion and Corporate Innovation. China Econ. Q. 2021, 21, 113–134. [Google Scholar]
  44. Wen, Z.; Ye, B. Analyses of Mediating Effects: The Development of Methods and Models. Adv. Psychol. Sci. 2014, 22, 731–745. [Google Scholar] [CrossRef]
  45. Li, X.; Zhu, H. Limited Attention and Information Processing. J. Financ. Res. 2011, 8, 128–142. [Google Scholar]
  46. Yang, J.; Shen, Y.; Li, P. The Role of Internet Negative Criticism in Enhancing the Efficiency and Fairness of the Management Compensation. Bus. Manag. J. 2017, 39, 117–134. [Google Scholar]
  47. Zhao, Y.; Lyu, W. The Impact of Individual Shareholder Activism on Auditor Decision. Audit. Res. 2022, 80–91. [Google Scholar] [CrossRef]
  48. Bednar, M.K. Watchdog or lapdog? A behavioral view of the media as a corporate governance mechanism. Acad. Manag. J. 2012, 55, 131–150. [Google Scholar] [CrossRef]
  49. Dai, L.; Parwada, J.T.; Zhang, B. The governance effect of the media’s news dissemination role: Evidence from insider trading. J. Account. Res. 2015, 53, 331–366. [Google Scholar] [CrossRef]
  50. Liu, B.; McConnell, J. The role of the media in corporate governance: Do the media influence managers’ capital allocation decisions? J. Financ. Econ. 2013, 110, 1–17. [Google Scholar] [CrossRef]
  51. Dyck, A.; Morse, A.; Zingales, L. Who blows the whistle on corporate fraud. J. Financ. 2010, 65, 2223–2253. [Google Scholar] [CrossRef]
  52. Chen, Q.; Chen, X.; Schipper, K.; Xu, Y.; Xue, J. The Sensitivity of Corporate Cash Holdings to Corporate Governance. Rev. Financ. Stud. 2012, 25, 3610–3644. [Google Scholar] [CrossRef]
  53. Gentzkow, M.; Shapiro, J.M. Media bias and reputation. J. Political Econ. 2006, 114, 280–316. [Google Scholar] [CrossRef]
  54. Wang, D.; Sun, K.; Gao, H. The Impact of “Voting with Your Mouth” on Management Voluntary Disclosure. J. Financ. Res. 2020, 11, 188–206. [Google Scholar]
  55. You, J.; Wu, J. Spiral of Silence: Media Sentiment and the Asset Mispricing. Econ. Res. J. 2012, 47, 141–152. [Google Scholar]
  56. Lv, K. Medai Coverage and Corporate Innovation: A study Based on the Dual Effect of Media. Master’s Thesis, Southwestern University of Finance and Economics, Chengdu, China, 2023. [Google Scholar]
  57. Tian, G.; Li, X.; Si, Y.; Qin, L. Option Incentives, Media Coverage and Tax Aggressive: The Corporate Governance Mechanism of Media from Coverage Mode Perspective. J. Ind. Eng. Eng. Manag. 2019, 33, 1–11. [Google Scholar]
  58. Antweiler, W.; Frank, M.Z. Is all that just noise? The information content of internet stock message boards. J. Financ. 2004, 59, 1259–1294. [Google Scholar] [CrossRef]
  59. Yang, X.; Shen, H.; Zhu, Y. The Effect of Local Bias in Investor Attention and Inveator Sentiment on Stork Market: Evidence from Online Forum. J. Financ. Res. 2016, 12, 143–158. [Google Scholar]
  60. Dai, Y.; Pan, Y.; Chen, F. Media Coverage, Government Governance and Auditor Switch. Account. Res. 2013, 89–95+97. [Google Scholar] [CrossRef]
  61. Wan, L.; Luo, Y. Equilibrium Model of Corporate Social Responsibility. China Ind. Econ. 2006, 117–124. [Google Scholar] [CrossRef]
  62. Berrone, P.; Fosfuri, A.; Gelabert, L.; Gomez-Mejia, L.R. Necessity as mother of ‘green’ inventions: Institutional pressures and environmental innovations. Strateg. Manag. J. 2013, 34, 891–909. [Google Scholar] [CrossRef]
  63. Shen, H.; Feng, J. Media Monitoring, Government Supervision, and Corporate Environmental Disclosure. Account. Res. 2012, 72–78+97. [Google Scholar] [CrossRef]
  64. Luo, J.; Dou, C. Does the Social Media “Voice” of Minority Shareholders Affect Corporate M&A Preference? Evidence Based on Interactive Platforms. J. Shanghai Univ. Financ. Econ. 2022, 24, 123–137. [Google Scholar]
  65. Dou, C.; Luo, J.B. Minority Shareholders’ Voice on Social Media and the Effectiveness of Executive Compensation Contracts. Financ. Trade Econ. 2020, 41, 85–100. [Google Scholar]
  66. Liu, L.; Ge, M.; Ding, Z. Impacts of online media and investor attention on enterprise green innovation. Int. Rev. Econ. Financ. 2024, 96, 103569. [Google Scholar] [CrossRef]
  67. Lu, C.; Zhu, T.; Xia, X.; Zhao, Z.; Zhao, Y. Common institutional ownership and corporate green investment: Evidence from China. Int. Rev. Econ. Financ. 2024, 91, 1123–1149. [Google Scholar] [CrossRef]
  68. He, J.; Shen, X. Institutional investor cross-ownership networks and green innovation: Evidence from China. Int. Rev. Econ. Financ. 2024, 96, 103657. [Google Scholar] [CrossRef]
  69. Zhao, J.; Qu, J.; Wei, J.; Yin, H.; Xi, X. The effects of institutional investors on firms’ green innovation. J. Prod. Innov. Manag. 2023, 40, 195–230. [Google Scholar] [CrossRef]
  70. Wang, J. The impact of investor communication on enterprise green innovation. Financ. Res. Lett. 2023, 57, 104158. [Google Scholar] [CrossRef]
  71. Wang, H.; Lin, W.; Xie, R.; Ma, C.; Gong, L. Can environmental investors stimulate corporate green technological innovation?—Evidence from China. Appl. Econ. 2024, 6, 1–7. [Google Scholar] [CrossRef]
Figure 1. Research hypothesis framework.
Sustainability 17 04558 g001
Figure 2. Parallel trend test.
Sustainability 17 04558 g002
Table 1. Variable definition table.
Variable TypeVariable NameVariable SymbolVariable DefinitionSource Literature
Explained variableGreen innovationGreenThe natural logarithm of the company’s total green invention patent applications plus 1Li et al. [26]
Explanatory variablesRetail investors
Social media interaction
PostThe natural logarithm of the total number of posts posted by the company’s stock barWang et al. [37]; Sun et al. [38]
ReadThe natural logarithm of the total number of posts read by the company’s stock bar
CommentThe natural logarithm of the total number of comments on posts posted by the company’s stock bar
Intermediate variablesEnvironmental awarenessEnvAwareThe natural logarithm of word frequency plus 1 for environment-related keywords in corporate annual reportsLiu et al. [30]
Financing constraintWWWW index
Control variablesNews media attentionMediaThe natural logarithm of the total number of times a company appears in a news headlineWu&Tang [42]
Enterprise scaleSizeThe natural logarithm of the number of employees in a businessJiang et al. [43]; Li&Xiao [6]; Yang et al. [10]
Capital structureLevTotal liabilities/total assets
ProfitabilityRoaNet profit/total assets
Enterprise ageAgeThe natural logarithm of the number of years a business has been established
Capital intensityPpeNet fixed assets/total assets
Cash flowOcfNet cash flow from operating activities/total assets
Property right natureSoeWhether the listed company is state-owned; state-owned enterprise is 1, otherwise 0
Dual functionDualWhether the chairman concurrently serves as the general manager; if concurrently, the value is 1, otherwise it is 0
Annual fixed effectYearAnnual fixed effect
Industry fixed effectIndustryIndustry fixed effect
Provincial fixed effectProvinceProvincial fixed effect
Table 2. Descriptive statistics.
VariablesObserved ValueMean ValueMid-ValueStandard DeviationMaximum ValueMinimum Value
Green87550.2240.0000.5492.7730.000
Post87558.6948.7020.86710.8606.480
Read875515.60015.6001.03617.99013.250
Comment87559.2759.2931.09512.0106.666
Media87554.5114.5641.14011.1700.000
Size87557.9067.8281.18810.8505.283
Lev87550.4300.4290.2040.8940.052
Roa87550.0460.0400.0610.233−0.165
Age87552.8052.8330.3553.4661.609
Ppe87550.3130.2870.1660.7660.036
Ocf87550.0610.0590.0710.659−0.670
Soe87550.4440.0000.4971.0000.000
Dual87550.2030.0000.4021.0000.000
Table 3. Correlation coefficient matrix of main variables.
VariablesGreenPostReadCommentMediaSizeLev
Green1
Post0.183 ***1
Read0.133 ***0.811 ***1
Comment0.101 ***0.683 ***0.722 ***1
Media0.139 ***0.299 ***0.327 ***0.344 ***1
Size0.278 ***0.289 ***0.278 ***0.288 ***0.203 ***1
Lev0.121 ***0.136 ***0.153 ***0.216 ***0.050 ***0.413 ***1
Roa−0.006−0.045 ***−0.063 ***−0.069 ***0.109 ***−0.038 ***−0.462 ***
Age0.054 ***0.322 ***0.132 ***−0.045 ***0.041 ***0.057 ***0.077 ***
Ppe0.123 ***0.054 ***0.091 ***0.130 ***−0.036 ***0.277 ***0.403 ***
Ocf0.069 ***0.038 ***0.0060.0010.032 ***0.119 ***−0.161 ***
Soe0.167 ***0.109 ***0.134 ***0.223 ***0.0000.363 ***0.349 ***
Dual−0.081 ***−0.072 ***−0.107 ***−0.143 ***−0.021 **−0.213 ***−0.135 ***
VariablesRoaAgePpeOcfSoeDual
Roa1
Age−0.052 ***1
Ppe−0.232 ***0.028 ***1
Ocf0.456 ***0.035 ***0.154 ***1
Soe−0.186 ***0.072 ***0.380 ***0.022 **1
Dual0.075 ***0.00500−0.164 ***−0.010−0.272 ***1
Note: ** and ***, respectively, indicate that the regression coefficient is significant at the level of 5% and 1%.
Table 4. Baseline regression results.
VariablesGreen
(1)(2)(3)(4)(5)(6)
Post0.097 ***0.042 ***
(5.62)(2.81)
Read 0.099 ***0.046 ***
(6.12)(3.33)
Comment 0.067 ***0.030 **
(5.06)(2.56)
Media 0.042 *** 0.042 *** 0.042 ***
(3.73) (3.67) (3.72)
Size 0.096 *** 0.094 *** 0.098 ***
(6.15) (6.03) (6.24)
Lev −0.037 −0.035 −0.036
(−0.40) (−0.38) (−0.39)
Roa 0.114 0.112 0.109
(0.68) (0.66) (0.64)
Age −0.069 −0.072 −0.067
(−1.39) (−1.46) (−1.35)
Ppe 0.098 0.101 0.098
(1.01) (1.05) (1.01)
Ocf 0.273 ** 0.270 ** 0.272 **
(2.56) (2.53) (2.55)
Soe 0.092 *** 0.093 *** 0.093 ***
(2.90) (2.91) (2.92)
Dual −0.013 −0.013 −0.013
(−0.71) (−0.68) (−0.70)
Constant−0.539 ***−0.935 ***−1.239 ***−1.255 ***−0.417 ***−0.902 ***
(−4.25)(−5.20)(−5.69)(−5.59)(−3.48)(−5.03)
N752475247524752475247524
Adj_R20.1380.1870.1410.1880.1350.187
YearYesYesYesYesYesYes
IndustryYesYesYesYesYesYes
ProvinceYesYesYesYesYesYes
Note: ** and ***, respectively, indicate that the regression coefficient is significant at the level of 5% and 1%, and the t value from clustering to the enterprise level is in parentheses, as shown in the table below.
Table 5. Regression results for the transmission mechanism based on enhancing enterprise environmental awareness.
VariablesEnvAwareGreen
(1)(2)(3)(4)(5)(6)
Post0.056 ** 0.039 ***
(2.41) (2.59)
Read 0.053 ** 0.042 ***
(2.35) (3.09)
Comment 0.037 ** 0.028 **
(2.07) (2.38)
EnvAware 0.033 ***0.033 ***0.034 ***
(2.76)(2.75)(2.78)
Media0.0010.0010.0010.042 ***0.041 ***0.042 ***
(0.07)(0.04)(0.08)(3.68)(3.63)(3.67)
Size0.251 ***0.250 ***0.254 ***0.087 ***0.086 ***0.089 ***
(10.77)(10.72)(10.94)(5.42)(5.30)(5.50)
Lev0.279 **0.282 **0.281 **−0.043−0.041−0.042
(2.17)(2.19)(2.18)(−0.47)(−0.45)(−0.46)
Roa−0.169−0.177−0.1790.1130.1110.108
(−0.51)(−0.54)(−0.54)(0.66)(0.65)(0.63)
Age−0.043−0.044−0.039−0.063−0.066−0.062
(−0.48)(−0.49)(−0.44)(−1.28)(−1.35)(−1.25)
Ppe0.699 ***0.702 ***0.699 ***0.0770.0800.077
(4.31)(4.32)(4.31)(0.79)(0.83)(0.79)
Ocf−0.121−0.123−0.1220.271 **0.269 **0.270 **
(−0.56)(−0.57)(−0.56)(2.53)(2.50)(2.52)
Soe0.0310.0320.0320.090 ***0.090 ***0.091 ***
(0.54)(0.55)(0.56)(2.85)(2.86)(2.87)
Dual−0.115 **−0.114 **−0.115 **−0.010−0.009−0.010
(−2.46)(−2.44)(−2.45)(−0.53)(−0.50)(−0.52)
Constant−0.832 ***−1.164 ***−0.774 ***−0.901 ***−1.199 ***−0.873 ***
(−2.82)(−3.16)(−2.66)(−5.03)(−5.37)(−4.88)
N749174917491749174917491
Sobel-Z (p-Value) 0.0030.0030.008
Adj_R20.5740.5740.5740.1890.1900.189
YearYesYesYesYesYesYes
IndustryYesYesYesYesYesYes
ProvinceYesYesYesYesYesYes
Note: *** p < 0.01, ** p < 0.05.
Table 6. Regression results for the transmission mechanism based on easing corporate financing constraints.
VariablesWWGreen
(1)(2)(3)(4)(5)(6)
Post−0.006 *** 0.038 **
(−5.99) (2.47)
Read −0.007 *** 0.042 ***
(−6.89) (3.00)
Comment −0.005 *** 0.028 **
(−6.06) (2.38)
WW −1.379 ***−1.356 ***−1.379 ***
(−4.78)(−4.72)(−4.81)
Media−0.004 ***−0.004 ***−0.004 ***0.038 ***0.038 ***0.038 ***
(−5.02)(−4.85)(−4.96)(3.30)(3.25)(3.29)
Size−0.038 ***−0.038 ***−0.039 ***0.038 **0.037 **0.039 **
(−29.53)(−29.32)(−29.81)(2.14)(2.09)(2.21)
Lev−0.014 *−0.014 **−0.014 *−0.073−0.070−0.071
(−1.90)(−1.97)(−1.94)(−0.74)(−0.71)(−0.72)
Roa−0.315 ***−0.314 ***−0.315 ***−0.271−0.265−0.274
(−20.31)(−20.34)(−20.29)(−1.37)(−1.33)(−1.38)
Age0.009 **0.010 **0.009 **−0.055−0.059−0.054
(2.33)(2.49)(2.32)(−1.08)(−1.16)(−1.06)
Ppe0.020 **0.019 **0.020 **0.1430.1450.143
(2.54)(2.49)(2.53)(1.43)(1.45)(1.43)
Ocf−0.037 ***−0.036 ***−0.036 ***0.239 **0.237 **0.237 **
(−3.26)(−3.22)(−3.22)(2.18)(2.16)(2.17)
Soe0.0020.0020.0020.093 ***0.093 ***0.094 ***
(0.88)(0.87)(0.85)(2.83)(2.84)(2.85)
Dual−0.002−0.002−0.002−0.019−0.018−0.019
(−0.77)(−0.82)(−0.78)(−0.93)(−0.90)(−0.92)
Constant−0.659 ***−0.608 ***−0.659 ***−1.842 ***−2.125 ***−1.826 ***
(−47.66)(−34.81)(−48.04)(−6.29)(−6.46)(−6.19)
Sobel-Z (p-Value) 0.0000.0000.000
N676467646764676467646764
Adj_R20.6960.6980.6970.2060.2060.205
YearYesYesYesYesYesYes
IndustryYesYesYesYesYesYes
ProvinceYesYesYesYesYesYes
Note: *** p < 0.01, ** p < 0.05, * p < 0.1.
Table 7. Robustness test—difference-in-difference test.
VariablesGreen
(1)(2)
2010–20192012–2017
Treat × Post0.244 ***0.110 ***
(6.38)(3.26)
Treat0.0020.037
(0.06)(1.21)
Media0.043 ***0.039 ***
(3.55)(2.88)
Size0.098 ***0.093 ***
(6.05)(5.03)
Lev−0.0390.001
(−0.42)(0.01)
Roa0.0360.165
(0.20)(0.67)
Age−0.052−0.080
(−1.08)(−1.42)
Ppe0.0690.091
(0.71)(0.82)
Ocf0.302 **0.215 *
(2.57)(1.69)
Soe0.089 ***0.081 **
(2.65)(2.07)
Dual−0.017−0.011
(−0.87)(−0.44)
Constant−0.667 ***−0.465 **
(−3.94)(−2.30)
N63813818
Adj_R20.1720.161
YearYesYes
IndustryYesYes
ProvinceYesYes
Note: *** p < 0.01, ** p < 0.05, * p < 0.1.
Table 8. Robustness test—propensity score matching (PSM).
VariablesGreen
(1)(2)(3)(4)(5)(6)
AllPSMAllPSMAllPSM
Post0.042 ***0.030 *
(2.81)(1.93)
Read 0.046 ***0.032 **
(3.33)(2.35)
Comment 0.030 **0.022 **
(2.56)(2.05)
Media0.042 ***0.044 ***0.042 ***0.033 ***0.042 ***0.032 ***
(3.73)(3.94)(3.67)(2.84)(3.72)(2.96)
Size0.096 ***0.082 ***0.094 ***0.089 ***0.098 ***0.095 ***
(6.15)(5.45)(6.03)(5.67)(6.24)(5.88)
Lev−0.037−0.021−0.035−0.057−0.0360.002
(−0.40)(−0.23)(−0.38)(−0.65)(−0.39)(0.02)
Roa0.1140.0210.1120.0740.1090.168
(0.68)(0.12)(0.66)(0.45)(0.64)(0.96)
Age−0.069−0.093 *−0.072−0.039−0.0670.003
(−1.39)(−1.78)(−1.46)(−0.81)(−1.35)(0.06)
Ppe0.0980.0420.1010.1220.0980.069
(1.01)(0.44)(1.05)(1.37)(1.01)(0.78)
Ocf0.273 **0.1430.270 **0.227 **0.272 **0.120
(2.56)(1.27)(2.53)(2.01)(2.55)(1.07)
Soe0.092 ***0.078 ***0.093 ***0.081 **0.093 ***0.078 **
(2.90)(2.63)(2.91)(2.57)(2.92)(2.47)
Dual−0.013−0.049 ***−0.013−0.018−0.013−0.012
(−0.71)(−2.74)(−0.68)(−0.97)(−0.70)(−0.63)
Constant−0.935 ***−0.670 ***−1.255 ***−1.109 ***−0.902 ***−0.941 ***
(−5.20)(−3.66)(−5.59)(−4.78)(−5.03)(−5.00)
N752452027524518375244999
Adj_R20.1870.1470.1880.1680.1870.156
YearYesYesYesYesYesYes
IndustryYesYesYesYesYesYes
ProvinceYesYesYesYesYesYes
Note: *** p < 0.01, ** p < 0.05, * p < 0.1.
Table 9. Robustness test results—change the measure of the independent variable.
VariablesGreen
(1)(2)(3)
Question_Num0.018 *
(1.89)
GreenQues_Num 0.073 ***
(3.71)
GreenQues_Ratio 1.999 ***
(3.45)
Media0.044 ***0.045 ***0.046 ***
(3.50)(3.54)(3.63)
Size0.110 ***0.108 ***0.110 ***
(6.23)(6.13)(6.29)
Lev−0.023−0.031−0.036
(−0.24)(−0.33)(−0.38)
Roa0.1390.0920.114
(0.77)(0.52)(0.63)
Age−0.027−0.027−0.031
(−0.52)(−0.52)(−0.60)
Ppe0.1150.1110.114
(1.10)(1.07)(1.10)
Ocf0.280 **0.280 **0.262 **
(2.11)(2.12)(1.97)
Soe0.095 ***0.095 ***0.090 ***
(2.71)(2.74)(2.59)
Dual−0.019−0.019−0.020
(−0.95)(−0.93)(−0.99)
Constant−0.912 ***−0.872 ***−0.890 ***
(−4.59)(−4.47)(−4.61)
N607260726072
Adj_R20.1910.1970.197
YearYesYesYes
IndustryYesYesYes
ProvinceYesYesYes
Note: *** p < 0.01, ** p < 0.05, * p < 0.1.
Table 10. Robustness test—change how the dependent variable is measured.
VariablesGreen_applicationGreen_grant
(1)(2)(3)(4)(5)(6)
Post0.039 ** 0.031 **
(2.06) (2.00)
Read 0.046 *** 0.036 **
(2.65) (2.54)
Comment 0.029 ** 0.024 **
(2.00) (2.02)
Media0.054 ***0.053 ***0.054 ***0.043 ***0.042 ***0.043 ***
(3.78)(3.72)(3.76)(3.59)(3.54)(3.57)
Size0.137 ***0.135 ***0.138 ***0.110 ***0.108 ***0.111 ***
(6.88)(6.76)(6.96)(6.66)(6.55)(6.74)
Lev−0.007−0.005−0.005−0.0020.000−0.000
(−0.06)(−0.04)(−0.05)(−0.02)(0.00)(−0.01)
Roa0.2900.2900.2860.2490.2490.246
(1.38)(1.38)(1.36)(1.44)(1.43)(1.42)
Age−0.103−0.107 *−0.102−0.103 **−0.107 **−0.103 **
(−1.64)(−1.72)(−1.62)(−1.97)(−2.04)(−1.96)
Ppe0.293 **0.297**0.294 **0.306 ***0.309 ***0.307 ***
(2.35)(2.39)(2.36)(2.96)(2.99)(2.96)
Ocf0.1940.1910.1930.0660.0640.065
(1.48)(1.46)(1.47)(0.61)(0.59)(0.60)
Soe0.084 **0.084 **0.084 **0.056 *0.056 *0.056 *
(2.10)(2.10)(2.11)(1.71)(1.71)(1.72)
Dual−0.021−0.020−0.021−0.025−0.024−0.025
(−0.85)(−0.82)(−0.84)(−1.25)(−1.22)(−1.24)
Constant−1.191 ***−1.530 ***−1.172 ***−0.936 ***−1.201 ***−0.925 ***
(−5.26)(−5.44)(−5.16)(−4.92)(−5.11)(−4.86)
N752475247524752475247524
Adj_R20.2260.2270.2260.2120.2120.212
YearYesYesYesYesYesYes
IndustryYesYesYesYesYesYes
ProvinceYesYesYesYesYesYes
Note: *** p < 0.01, ** p < 0.05, * p < 0.1.
Table 11. Robustness test—change measurement model.
VariablesGreen
(1)(2)(3)
Post0.155 **
(2.56)
Read 0.167 ***
(3.03)
Comment 0.081 *
(1.76)
Media0.140 ***0.136 ***0.143 ***
(2.99)(2.92)(3.04)
Size0.414 ***0.406 ***0.426 ***
(7.06)(6.92)(7.29)
Lev0.0100.0220.012
(0.03)(0.06)(0.03)
Roa0.7920.7730.752
(0.97)(0.95)(0.92)
Age−0.371−0.380−0.358
(−1.59)(−1.63)(−1.53)
Ppe0.1790.1870.175
(0.45)(0.47)(0.44)
Ocf1.204 **1.195 **1.204 **
(2.28)(2.27)(2.28)
Soe0.370 ***0.370 ***0.374 ***
(2.70)(2.70)(2.73)
Dual−0.073−0.071−0.073
(−0.69)(−0.66)(−0.69)
Constant−6.251 ***−7.419 ***−5.939 ***
(−8.12)(−7.72)(−7.81)
N752475247524
Adj_R20.1300.1310.130
YearYesYesYes
IndustryYesYesYes
ProvinceYesYesYes
Note: *** p < 0.01, ** p < 0.05, * p < 0.1.
Table 12. Robustness test—change time series.
VariablesGreen
Two Lag PeriodsThree Lag Periods
(1)(2)(3)(4)(5)(6)
Post0.044 *** 0.060 ***
(2.61) (3.16)
Read 0.046 *** 0.056 ***
(2.97) (3.21)
Comment 0.030 ** 0.041 ***
(2.37) (2.95)
Media0.041 ***0.040 ***0.041 ***0.042 ***0.042 ***0.043 ***
(3.44)(3.41)(3.44)(3.48)(3.46)(3.50)
Size0.105 ***0.103 ***0.107 ***0.112 ***0.111 ***0.114 ***
(6.23)(6.11)(6.30)(6.06)(6.00)(6.17)
Lev−0.029−0.025−0.028−0.033−0.028−0.031
(−0.29)(−0.25)(−0.27)(−0.30)(−0.26)(−0.29)
Roa0.0950.0930.0890.1720.1730.162
(0.53)(0.51)(0.49)(0.87)(0.87)(0.82)
Age−0.070−0.073−0.067−0.097−0.099−0.093
(−1.26)(−1.32)(−1.22)(−1.52)(−1.54)(−1.46)
Ppe0.0930.0960.0940.0870.0920.088
(0.89)(0.91)(0.89)(0.76)(0.80)(0.77)
Ocf0.317 **0.316 **0.313 **0.361 **0.361 **0.362 **
(2.48)(2.47)(2.45)(2.55)(2.55)(2.56)
Soe0.092 ***0.093 ***0.093 ***0.102 ***0.104 ***0.104 ***
(2.74)(2.75)(2.77)(2.87)(2.91)(2.92)
Dual−0.018−0.018−0.018−0.023−0.024−0.023
(−0.91)(−0.91)(−0.90)(−1.06)(−1.08)(−1.06)
Constant−1.014 ***−1.323 ***−0.973 ***−1.077 ***−1.431 ***−1.027 ***
(−4.83)(−5.10)(−4.69)(−4.53)(−4.92)(−4.37)
N661466146614576557655765
Adj_R20.1920.1920.1910.2040.2040.203
YearYesYesYesYesYesYes
IndustryYesYesYesYesYesYes
ProvinceYesYesYesYesYesYes
Note: *** p < 0.01, ** p < 0.05.
Table 13. Regression results for the moderating effects of information quality environment based on social media.
VariablesGreen
(1)(2)(3)
Post0.021
(1.05)
Post × Policy0.040
(1.60)
Read 0.020
(1.14)
Read × Policy 0.048 **
(2.02)
Comment 0.009
(0.60)
Comment y× Policy 0.032 *
(1.69)
Media0.042 ***0.041 ***0.042 ***
(3.72)(3.65)(3.73)
Size0.096 ***0.094 ***0.098 ***
(6.14)(6.01)(6.27)
Lev−0.038−0.036−0.037
(−0.41)(−0.39)(−0.40)
Roa0.1140.1150.107
(0.67)(0.67)(0.63)
Age−0.064−0.066−0.062
(−1.28)(−1.32)(−1.23)
Ppe0.0980.1020.097
(1.02)(1.06)(1.01)
Ocf0.269 **0.265 **0.268 **
(2.53)(2.49)(2.53)
Soe0.093 ***0.093 ***0.093 ***
(2.91)(2.93)(2.94)
Dual−0.013−0.012−0.013
(−0.71)(−0.65)(−0.69)
Constant−0.784 ***−0.899 ***−0.734 ***
(−4.41)(−3.70)(−4.20)
N752475247524
Adj_R20.1880.1890.187
YearYesYesYes
IndustryYesYesYes
ProvinceYesYesYes
Note: *** p < 0.01, ** p < 0.05, * p < 0.1.
Table 14. Regression results for the moderating effects of emotional environment based on social media information.
VariablesGreen
(1)(2)(3)
Post0.047 ***
(2.88)
Post × Sentiment0.071 **
(2.17)
Read 0.048 ***
(3.36)
Read × Sentiment 0.060 **
(2.45)
Comment 0.029 **
(2.53)
Comment × Sentiment 0.034 *
(1.83)
Sentiment0.0400.0370.042
(1.31)(1.28)(1.30)
Media0.042 ***0.041 ***0.042 ***
(3.75)(3.69)(3.74)
Size0.095 ***0.094 ***0.098 ***
(6.13)(6.04)(6.25)
Lev−0.033−0.030−0.032
(−0.37)(−0.33)(−0.35)
Roa0.0740.0750.068
(0.43)(0.43)(0.39)
Age−0.067−0.070−0.066
(−1.35)(−1.43)(−1.35)
Ppe0.0950.0990.097
(0.99)(1.03)(1.01)
Ocf0.274 **0.271 **0.270 **
(2.57)(2.54)(2.53)
Soe0.089 ***0.091 ***0.092 ***
(2.80)(2.86)(2.88)
Dual−0.013−0.013−0.013
(−0.71)(−0.68)(−0.69)
Constant−1.023 ***−1.345 ***−0.955 ***
(−5.30)(−5.52)(−5.11)
N752475247524
Adj_R20.1900.1900.188
YearYesYesYes
IndustryYesYesYes
ProvinceYesYesYes
Note: *** p < 0.01, ** p < 0.05, * p < 0.1.
Table 15. Heterogeneity test based on environmental information regulation.
VariablesGreen
(1)(2)(3)(4)(5)(6)
Weak SupervisionStrong SupervisionWeak SupervisionStrong SupervisionWeak SupervisionStrong Supervision
Post0.0100.080 **
(0.52)(2.51)
Read 0.0210.094 ***
(1.17)(3.22)
Comment 0.0140.056 **
(0.84)(2.35)
Media0.038 **0.078 ***0.037 **0.074 ***0.037 **0.077 ***
(2.49)(3.03)(2.43)(2.97)(2.45)(3.00)
Size0.068 ***0.114 ***0.066 ***0.111 ***0.067 ***0.118 ***
(3.32)(4.30)(3.23)(4.16)(3.31)(4.37)
Lev−0.046−0.161−0.046−0.159−0.046−0.162
(−0.30)(−0.93)(−0.30)(−0.93)(−0.30)(−0.94)
Roa−0.0320.314−0.0270.313−0.0250.307
(−0.14)(0.81)(−0.12)(0.81)(−0.11)(0.79)
Age−0.0810.001−0.085−0.007−0.0840.006
(−1.53)(0.02)(−1.62)(−0.07)(−1.60)(0.06)
Ppe−0.1000.364 *−0.0960.365 *−0.0970.367 *
(−0.77)(1.80)(−0.74)(1.82)(−0.75)(1.82)
Ocf0.555 ***0.2370.551 ***0.2300.551 ***0.229
(2.89)(1.17)(2.88)(1.14)(2.89)(1.13)
Soe0.145 ***0.0470.144 ***0.0470.144 ***0.049
(3.60)(0.74)(3.59)(0.76)(3.58)(0.79)
Dual−0.031−0.030−0.030−0.029−0.031−0.030
(−1.02)(−0.80)(−1.01)(−0.79)(−1.02)(−0.79)
Constant−0.598 **−1.581 ***−0.789 **−2.279 ***−0.627 **−1.523 ***
(−2.51)(−4.64)(−2.57)(−4.94)(−2.58)(−4.58)
Difference between groups (p-Value)0.0070.0030.031
N219421012194210121942101
Adj_R20.1950.2490.1950.2520.1950.248
YearYesYesYesYesYesYes
IndustryYesYesYesYesYesYes
ProvinceYesYesYesYesYesYes
Note: *** p < 0.01, ** p < 0.05, * p < 0.1.
Table 16. Heterogeneity test of investor protection based on region.
VariablesGreen
(1)(2)(3)(4)(5)(6)
Weak ProtectionStrong ProtectionWeak ProtectionStrong ProtectionWeak ProtectionStrong Protection
Post0.0230.066 ***
(1.51)(2.73)
Read 0.029 *0.065 ***
(1.94)(2.97)
Comment 0.0180.046 **
(1.40)(2.49)
Media0.027 **0.061 ***0.026 **0.060 ***0.027 **0.061 ***
(2.26)(3.64)(2.23)(3.59)(2.26)(3.61)
Size0.052 ***0.134 ***0.051 ***0.132 ***0.053 ***0.137 ***
(3.24)(5.70)(3.14)(5.64)(3.31)(5.79)
Lev0.133−0.197 *0.135−0.193 *0.134−0.192 *
(1.19)(−1.77)(1.21)(−1.75)(1.19)(−1.73)
Roa0.440 **−0.1240.440 *−0.1280.439 *−0.133
(1.97)(−0.58)(1.96)(−0.59)(1.95)(−0.61)
Age−0.092−0.033−0.096−0.036−0.092−0.030
(−1.58)(−0.50)(−1.64)(−0.54)(−1.57)(−0.45)
Ppe−0.0510.287 **−0.0480.292 **−0.0510.292 **
(−0.42)(2.27)(−0.39)(2.31)(−0.42)(2.29)
Ocf0.362 **0.239 *0.358 **0.237 *0.359 **0.242 *
(2.40)(1.72)(2.38)(1.71)(2.39)(1.73)
Soe0.150 ***0.0120.150 ***0.0140.150 ***0.014
(3.67)(0.27)(3.68)(0.31)(3.68)(0.31)
Dual−0.019−0.014−0.019−0.012−0.018−0.014
(−0.68)(−0.55)(−0.68)(−0.49)(−0.67)(−0.56)
Constant−0.371 *−1.488 ***−0.594 **−1.913 ***−0.362−1.433 ***
(−1.70)(−5.61)(−2.19)(−5.45)(−1.64)(−5.44)
Difference between groups (p-Value)0.0200.0390.048
N396135633961356339613563
Adj_R20.1940.2170.1950.2170.1940.216
YearYesYesYesYesYesYes
IndustryYesYesYesYesYesYes
ProvinceYesYesYesYesYesYes
Note: *** p < 0.01, ** p < 0.05, * p < 0.1.
Disclaimer/Publisher’s Note: The statements, opinions and data contained in all publications are solely those of the individual author(s) and contributor(s) and not of MDPI and/or the editor(s). MDPI and/or the editor(s) disclaim responsibility for any injury to people or property resulting from any ideas, methods, instructions or products referred to in the content.

