

Life Cycle Cost and Environmental Performance of Electric and Gasoline Vehicles in Cold Climate and Coal-Dependent Regions: A Case Study of Heilongjiang Province, China
 ,
,  ,
,  and
and
Abstract
1. Introduction
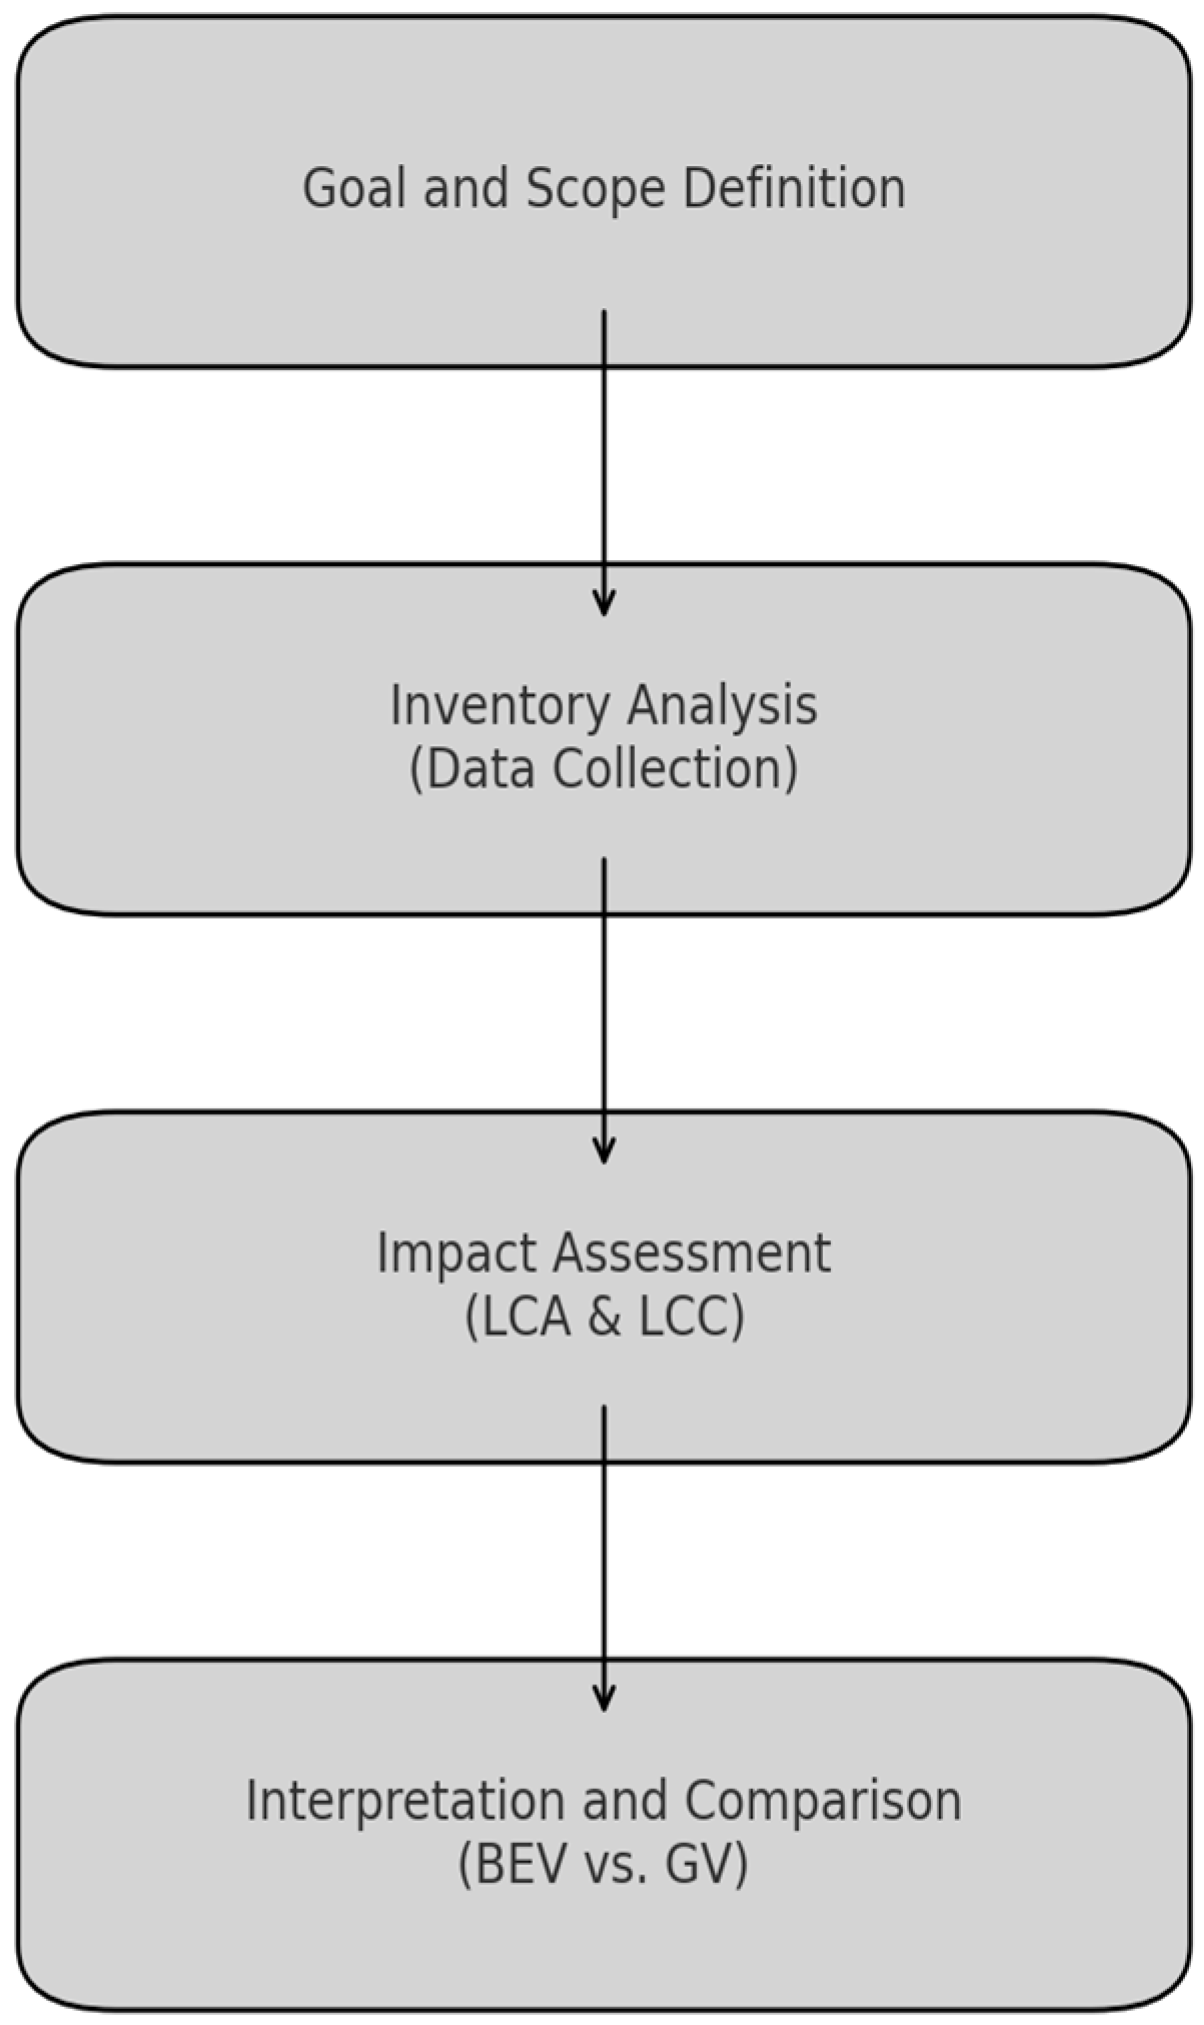
2. Methodology
2.1. Life Cycle Costing Inventory Analysis and Impact Assessment
- LCCNPV: life cycle costing net present value;
- n: current year;
- CPV: cumulative present value;
- Ird: real discount rate;
- PV: present value;
- OC: operating cost;
- MRC: maintenance and replacement cost.
- IPC: initial purchase cost;
- P: purchase price;
- PT: purchase tax;
- MD: merchant discount;
- C: charging pile fee;
- L: license plate fee;
- IC: insurance cost;
- VVT: vehicle and vessel tax;
- VIC: annual vehicle inspection cost;
- EC: energy cost;
- CC: cleaning cost;
- RC: replacement cost;
- SC: service cost.
- RV: residual valuation;
- RP: resale price;
- RC: resale cost.
- Ivd: vehicle depreciation rate.
- r: discount rate;
- e: escalation rate.
2.2. Environmental Performance (Life Cycle Assessment) Inventory Analysis and Impact Assessment
3. Result
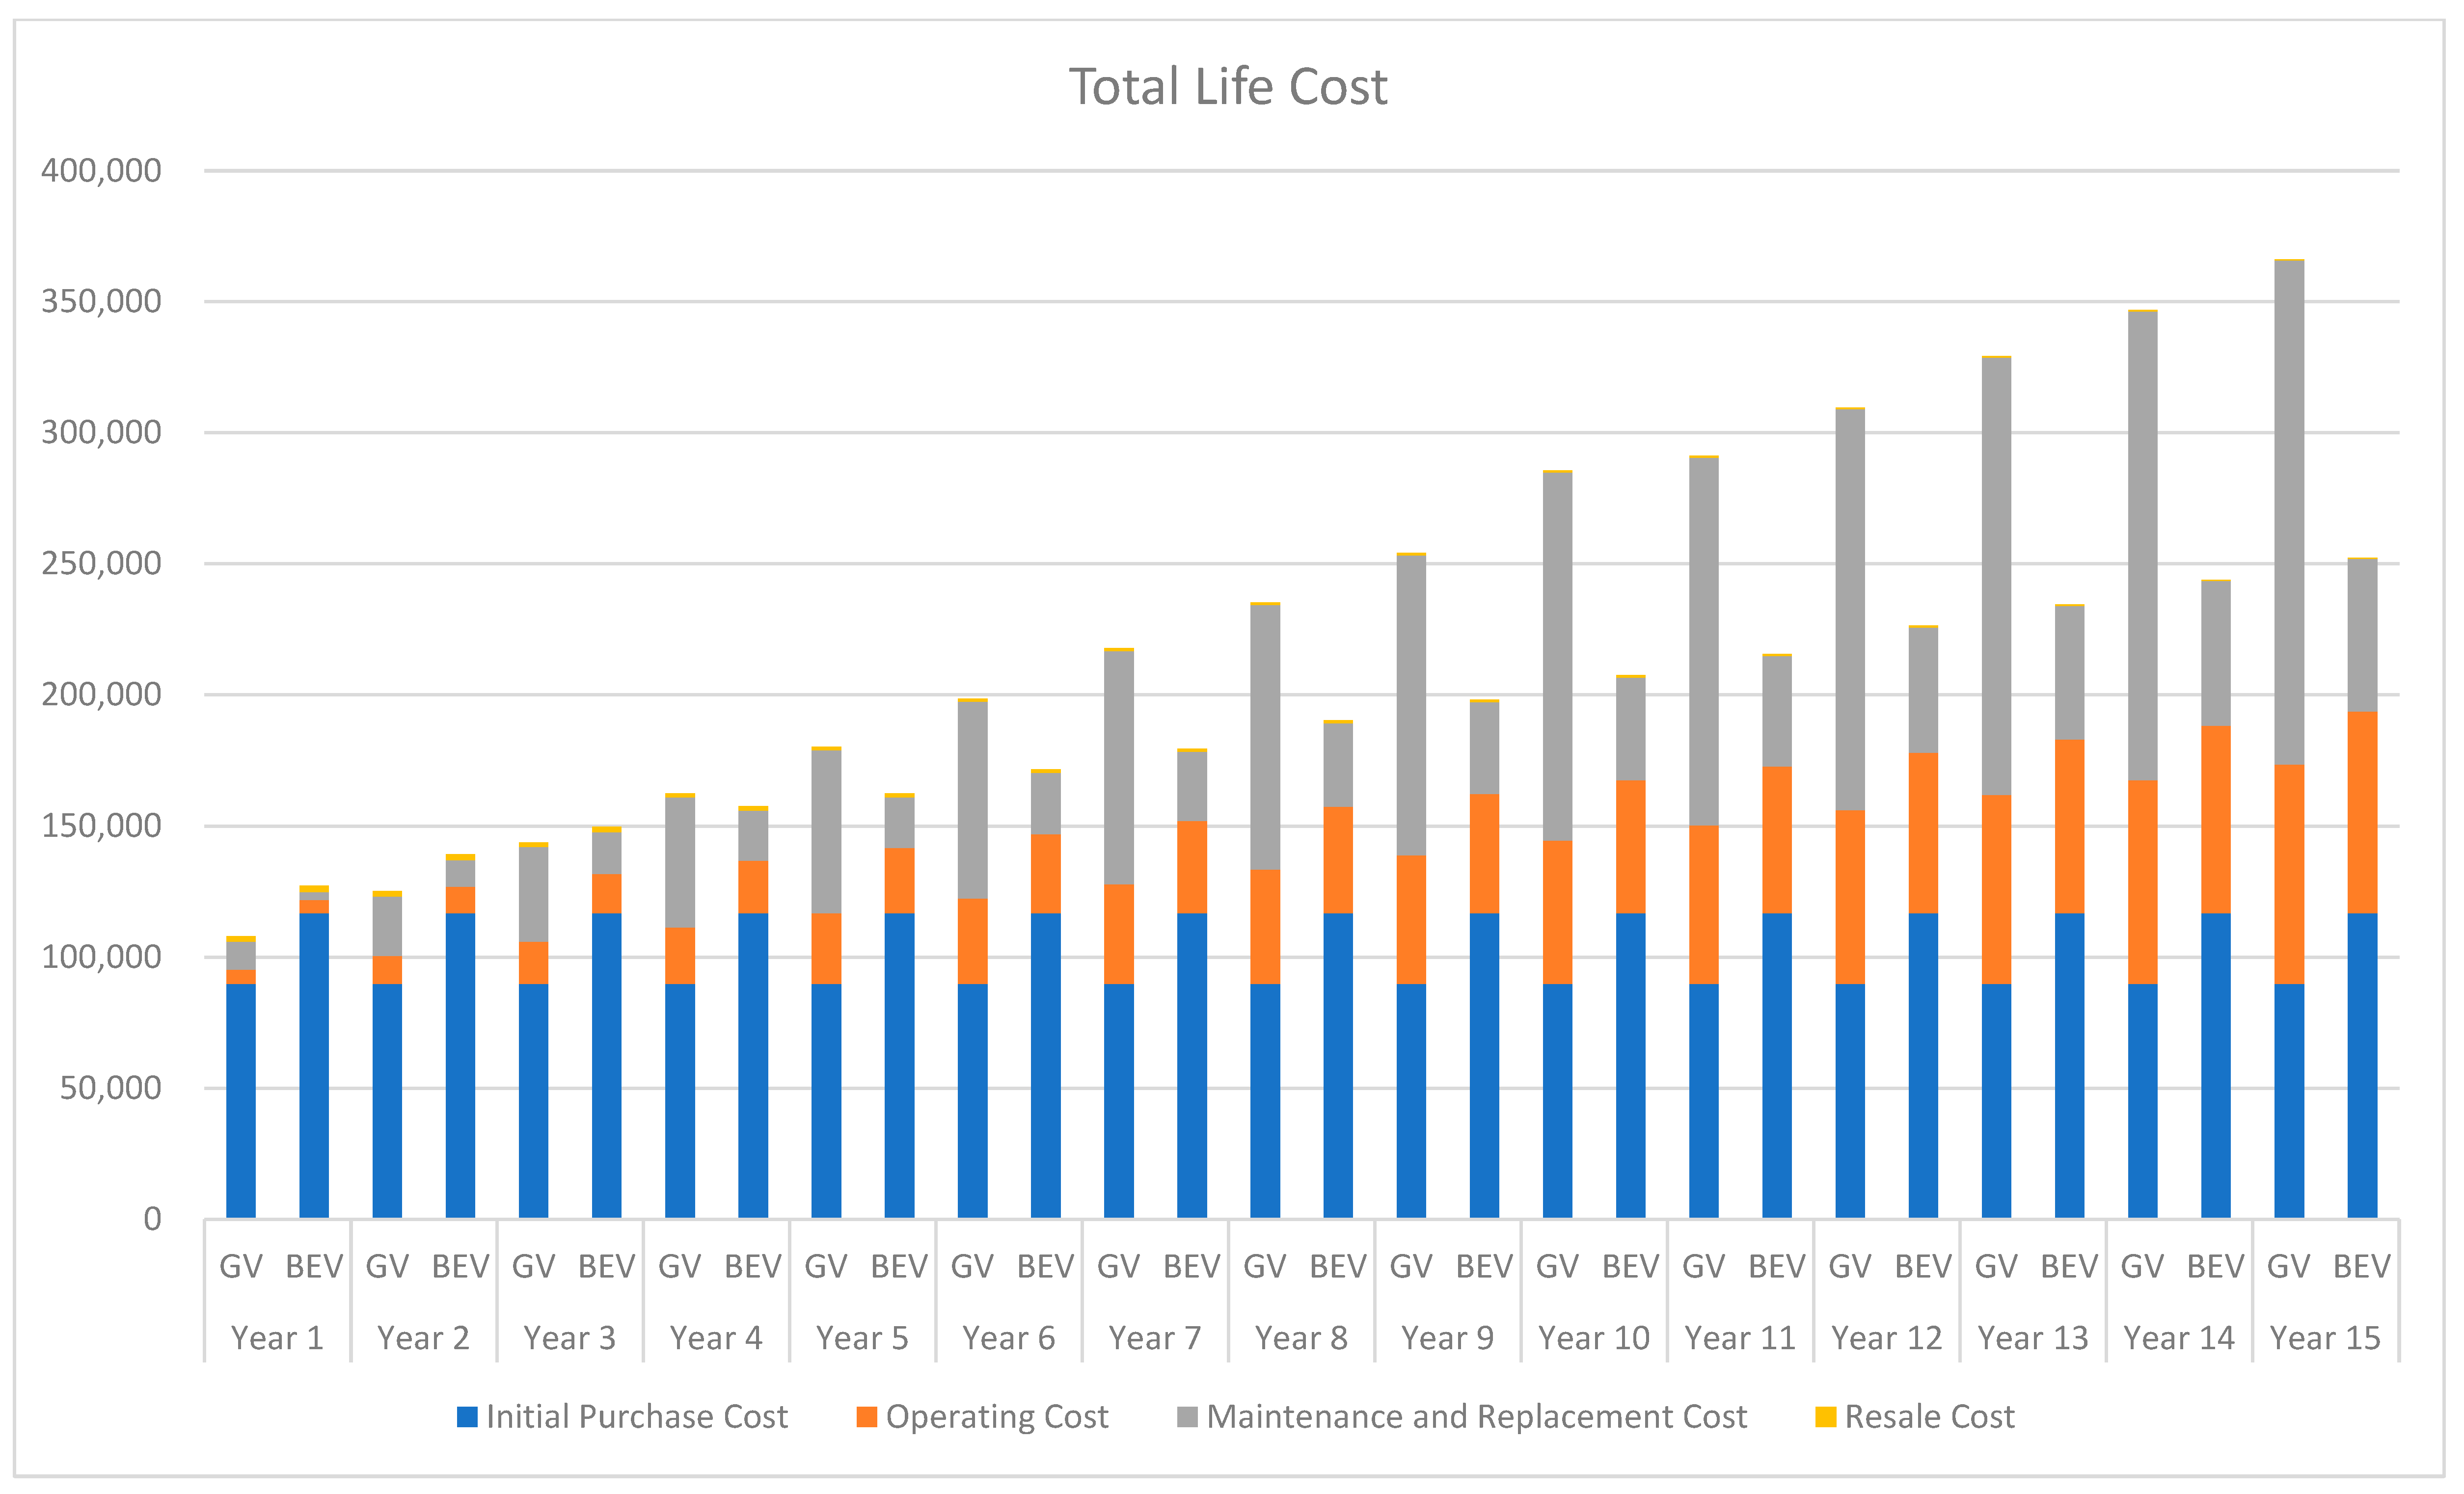
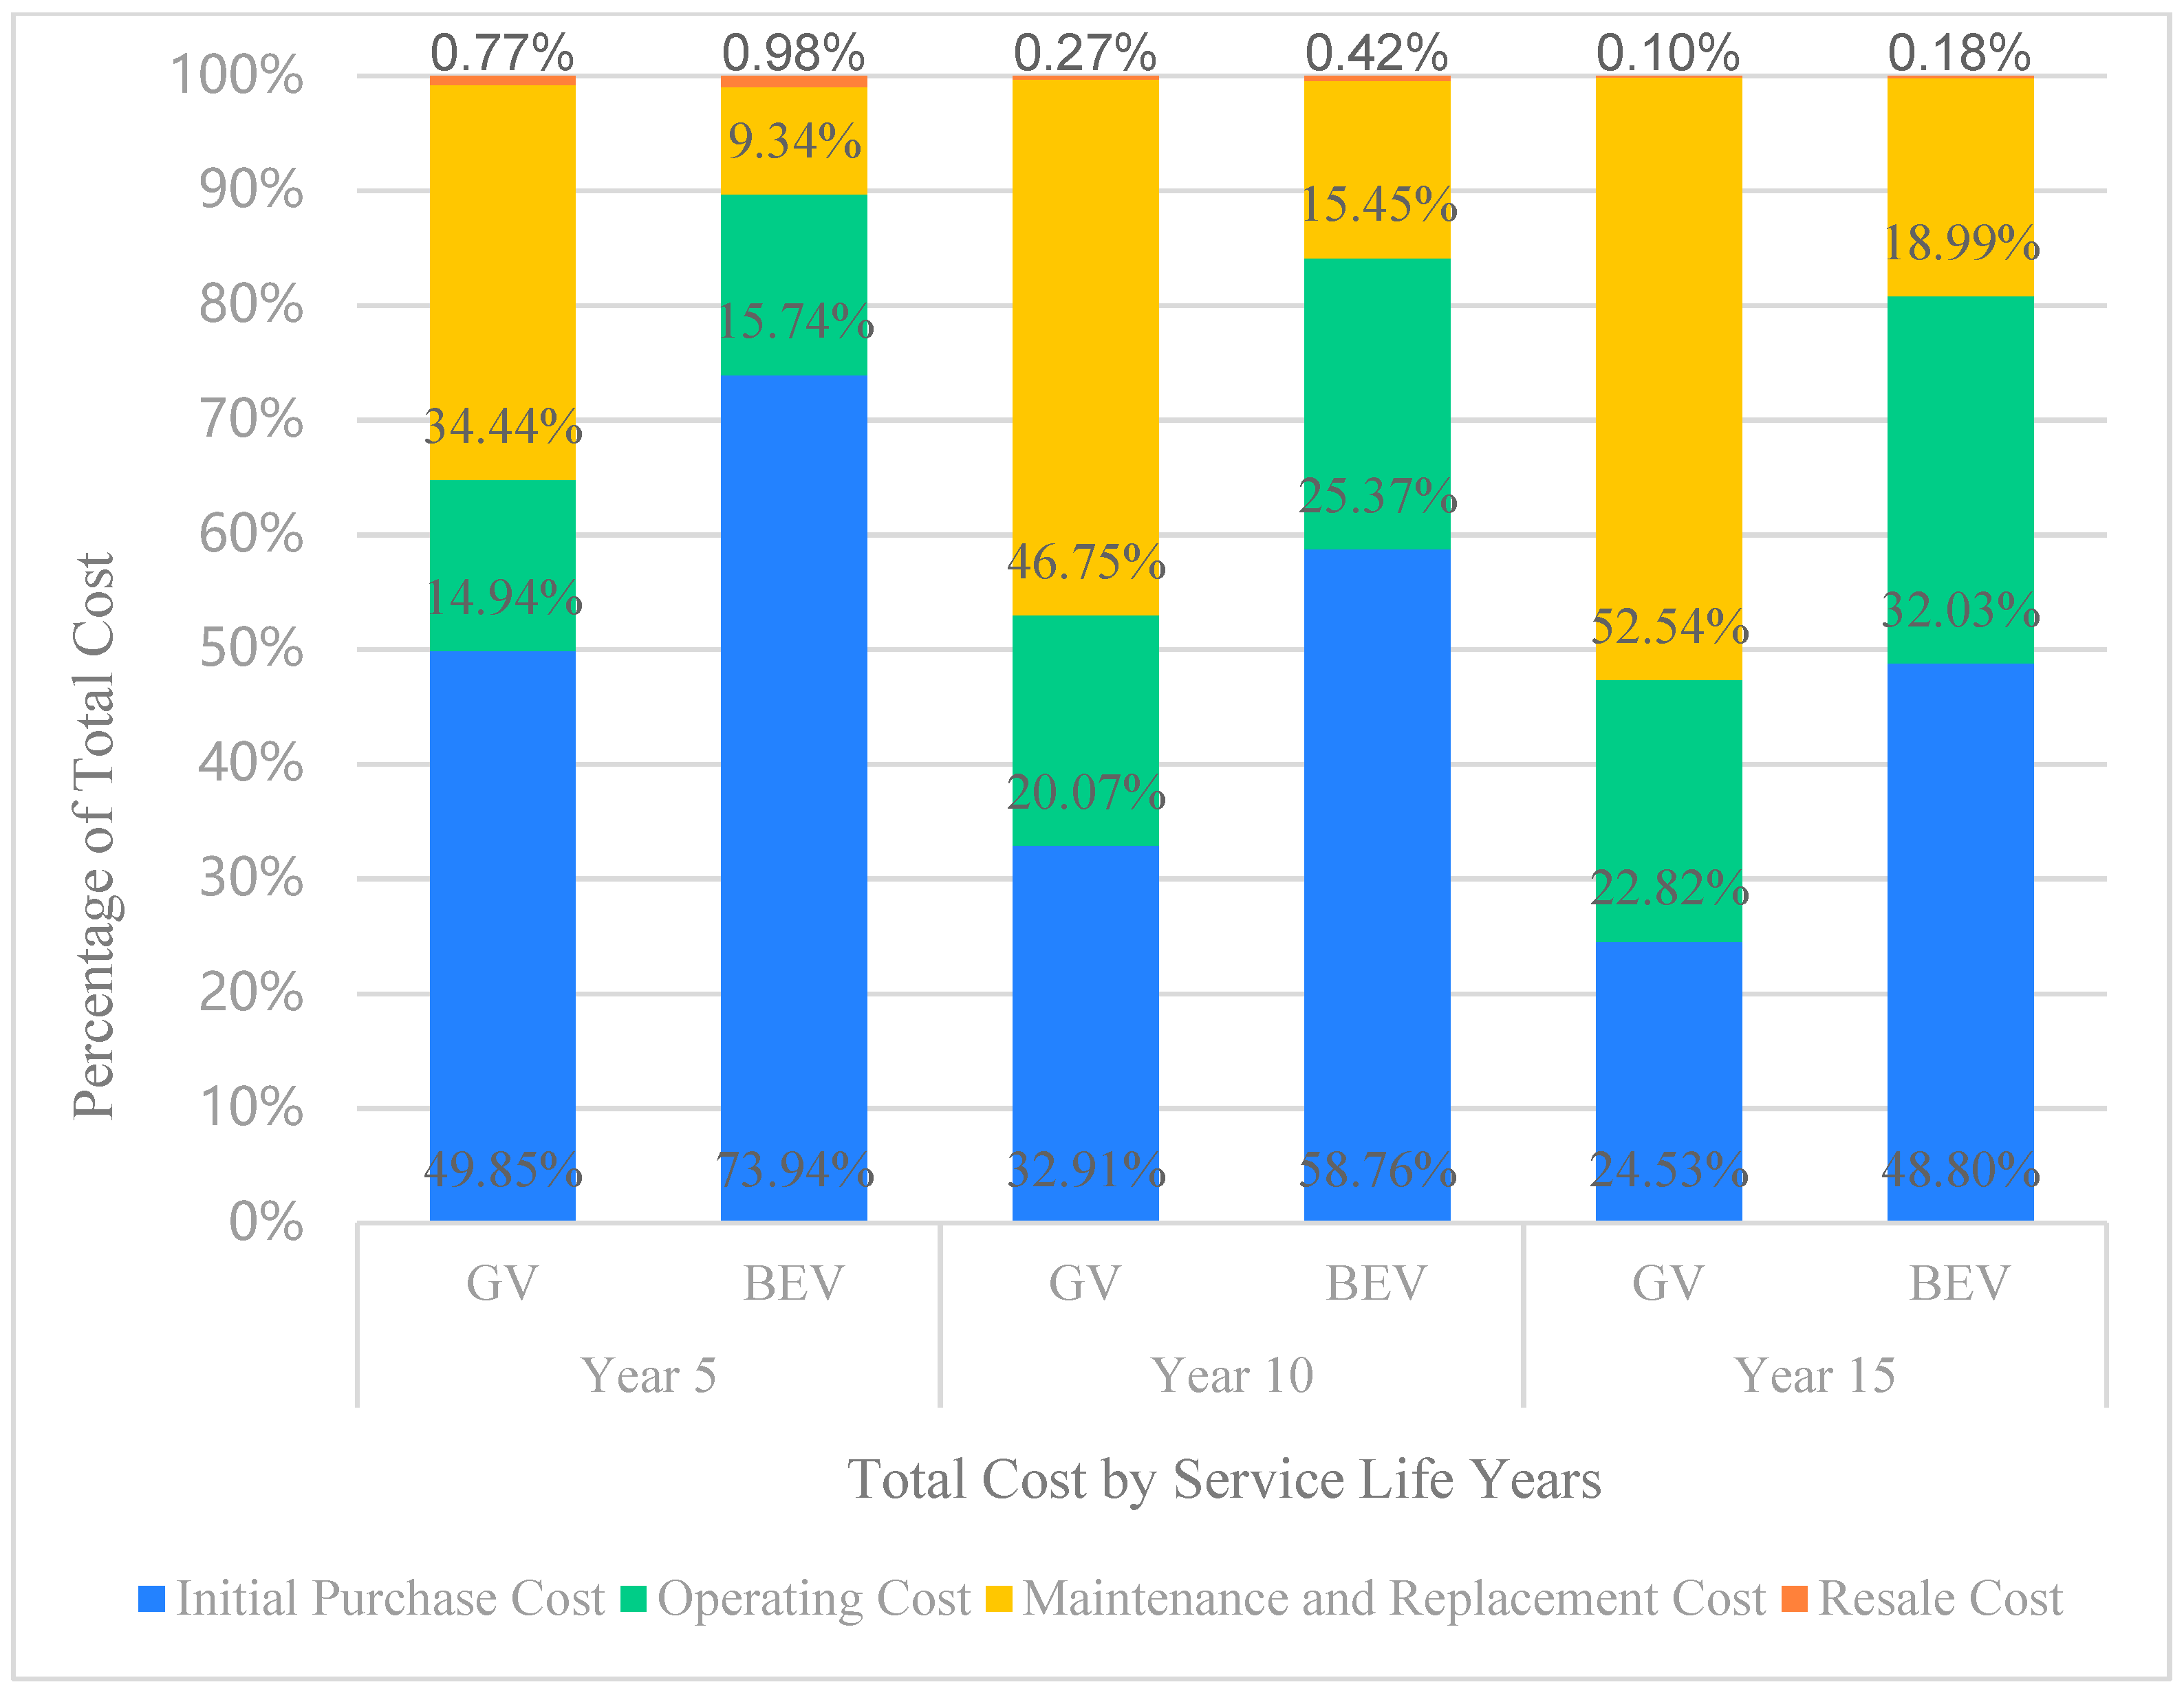
3.1. Assessing the Overall Cost for Consumers in the Utilization of BEVs and GVs
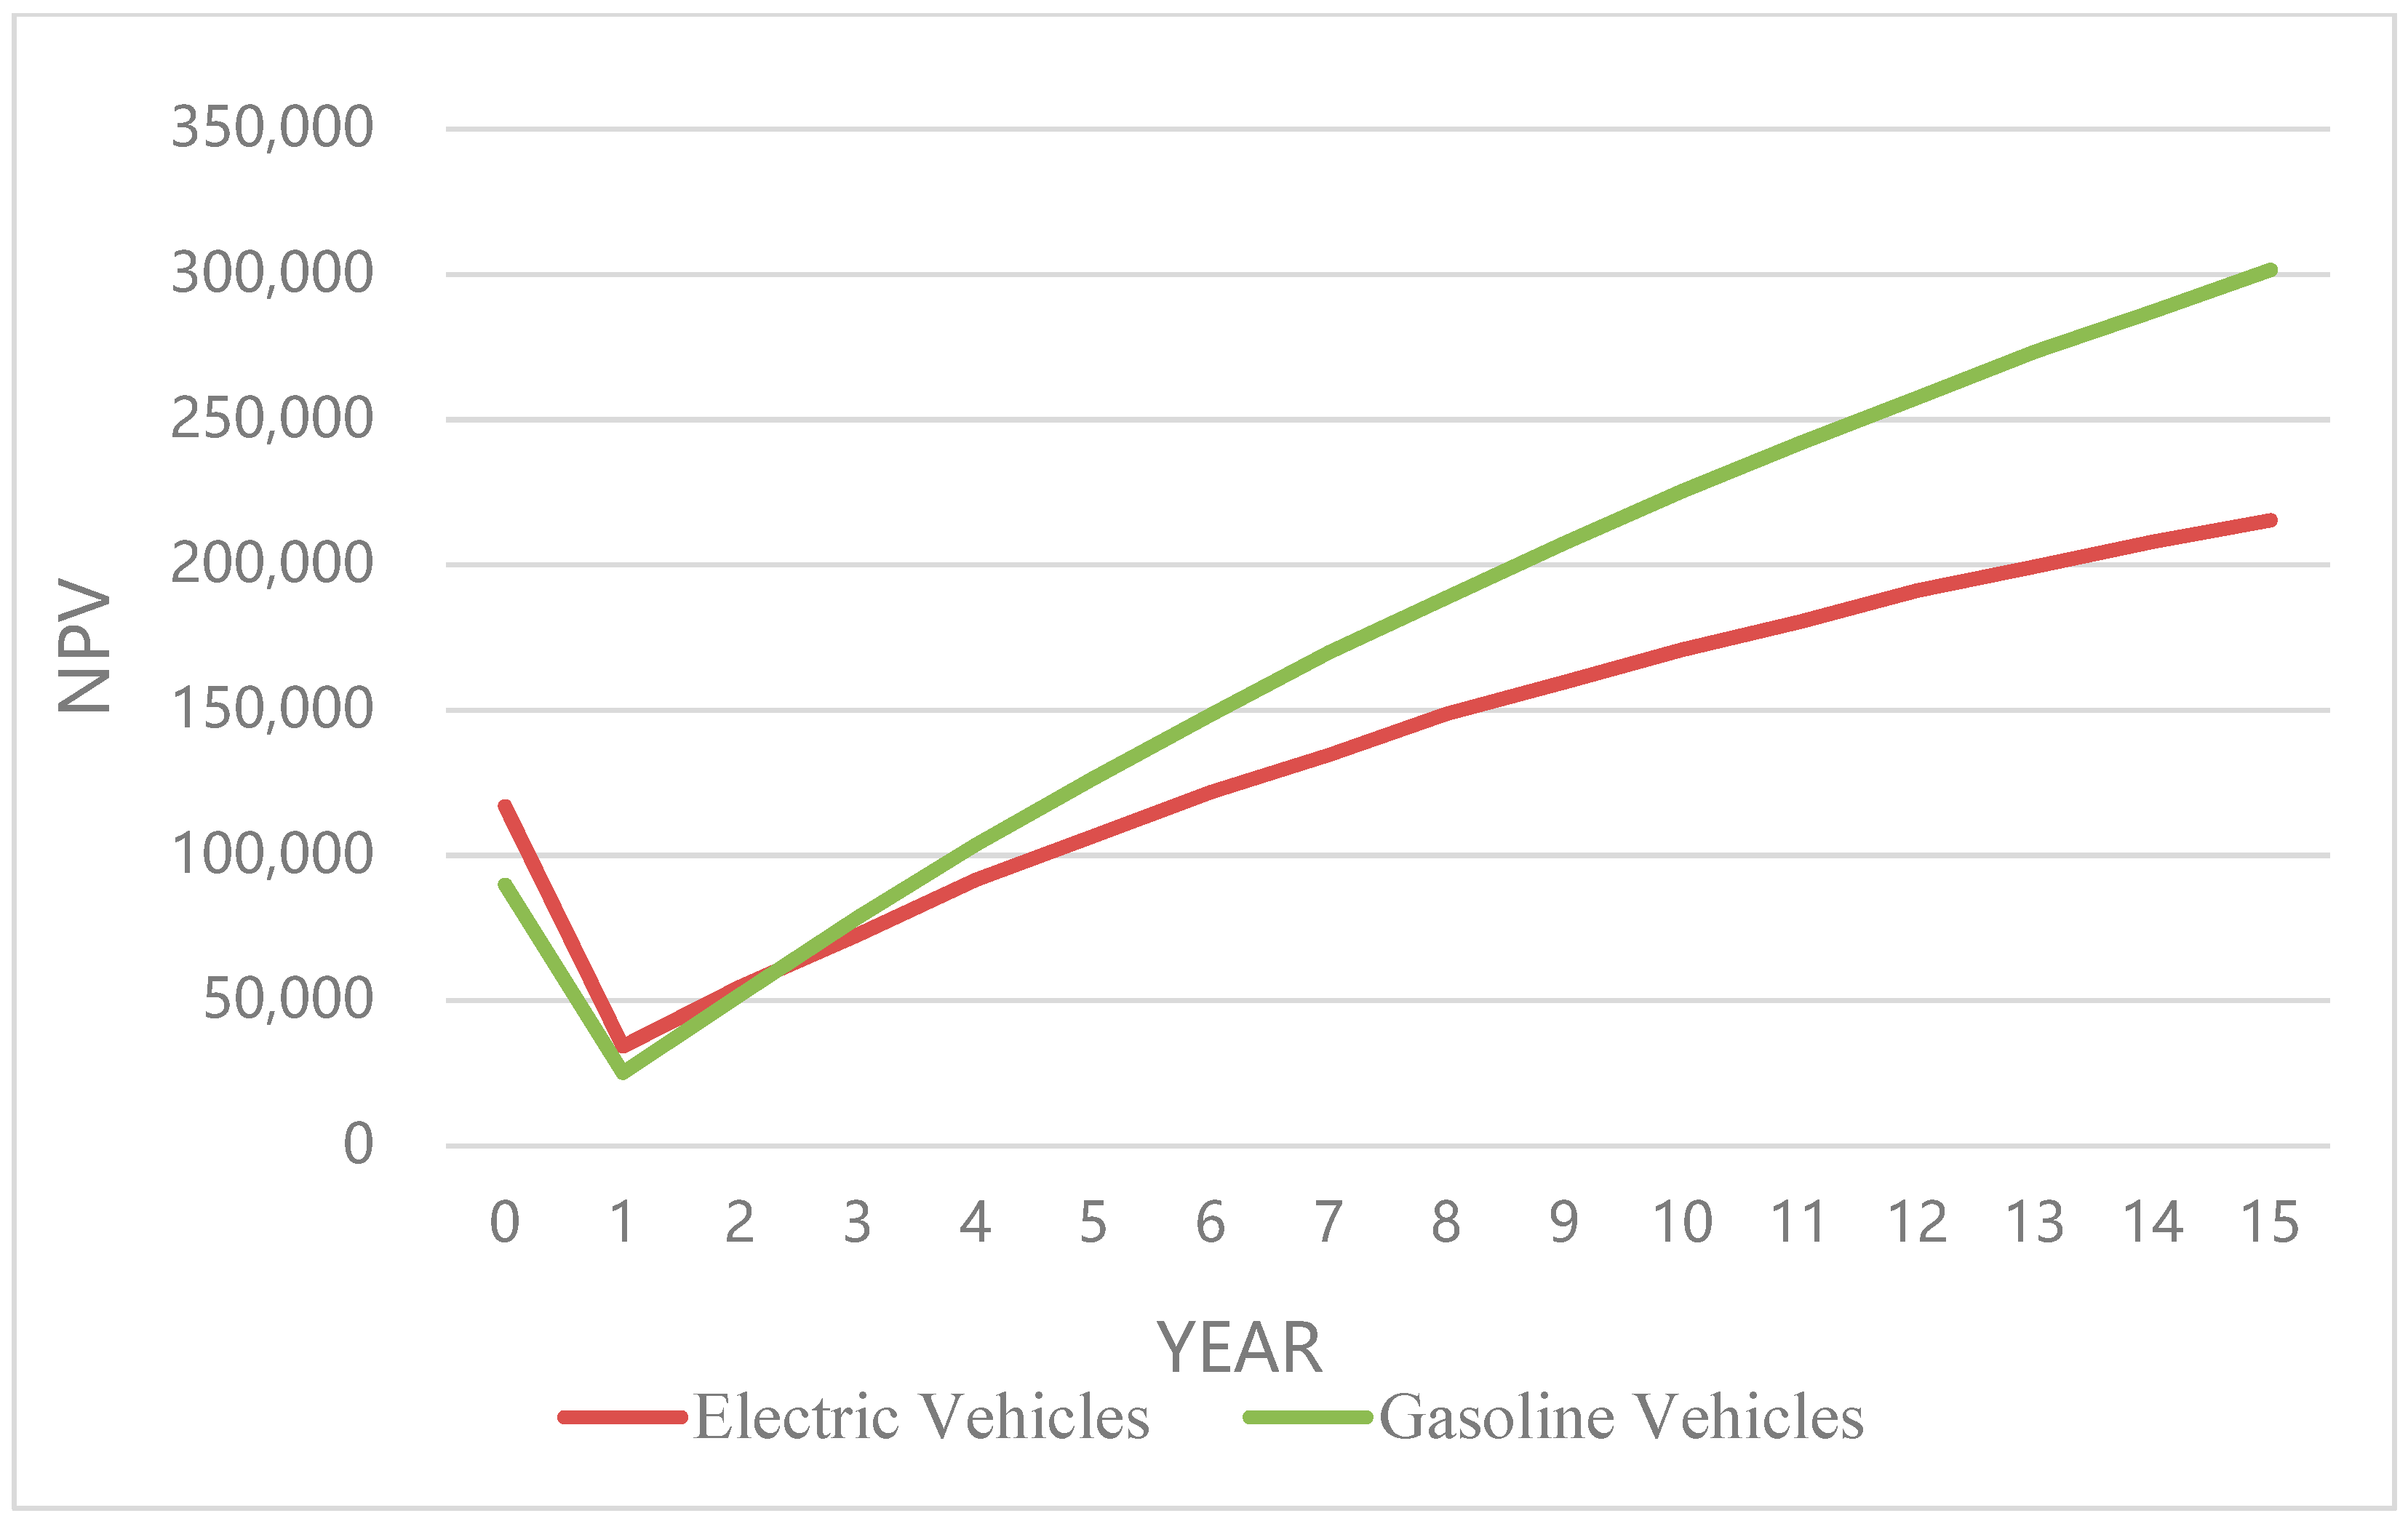
3.2. EVs and GVs Net Present Value (NPV) from Year 1 to Year 15
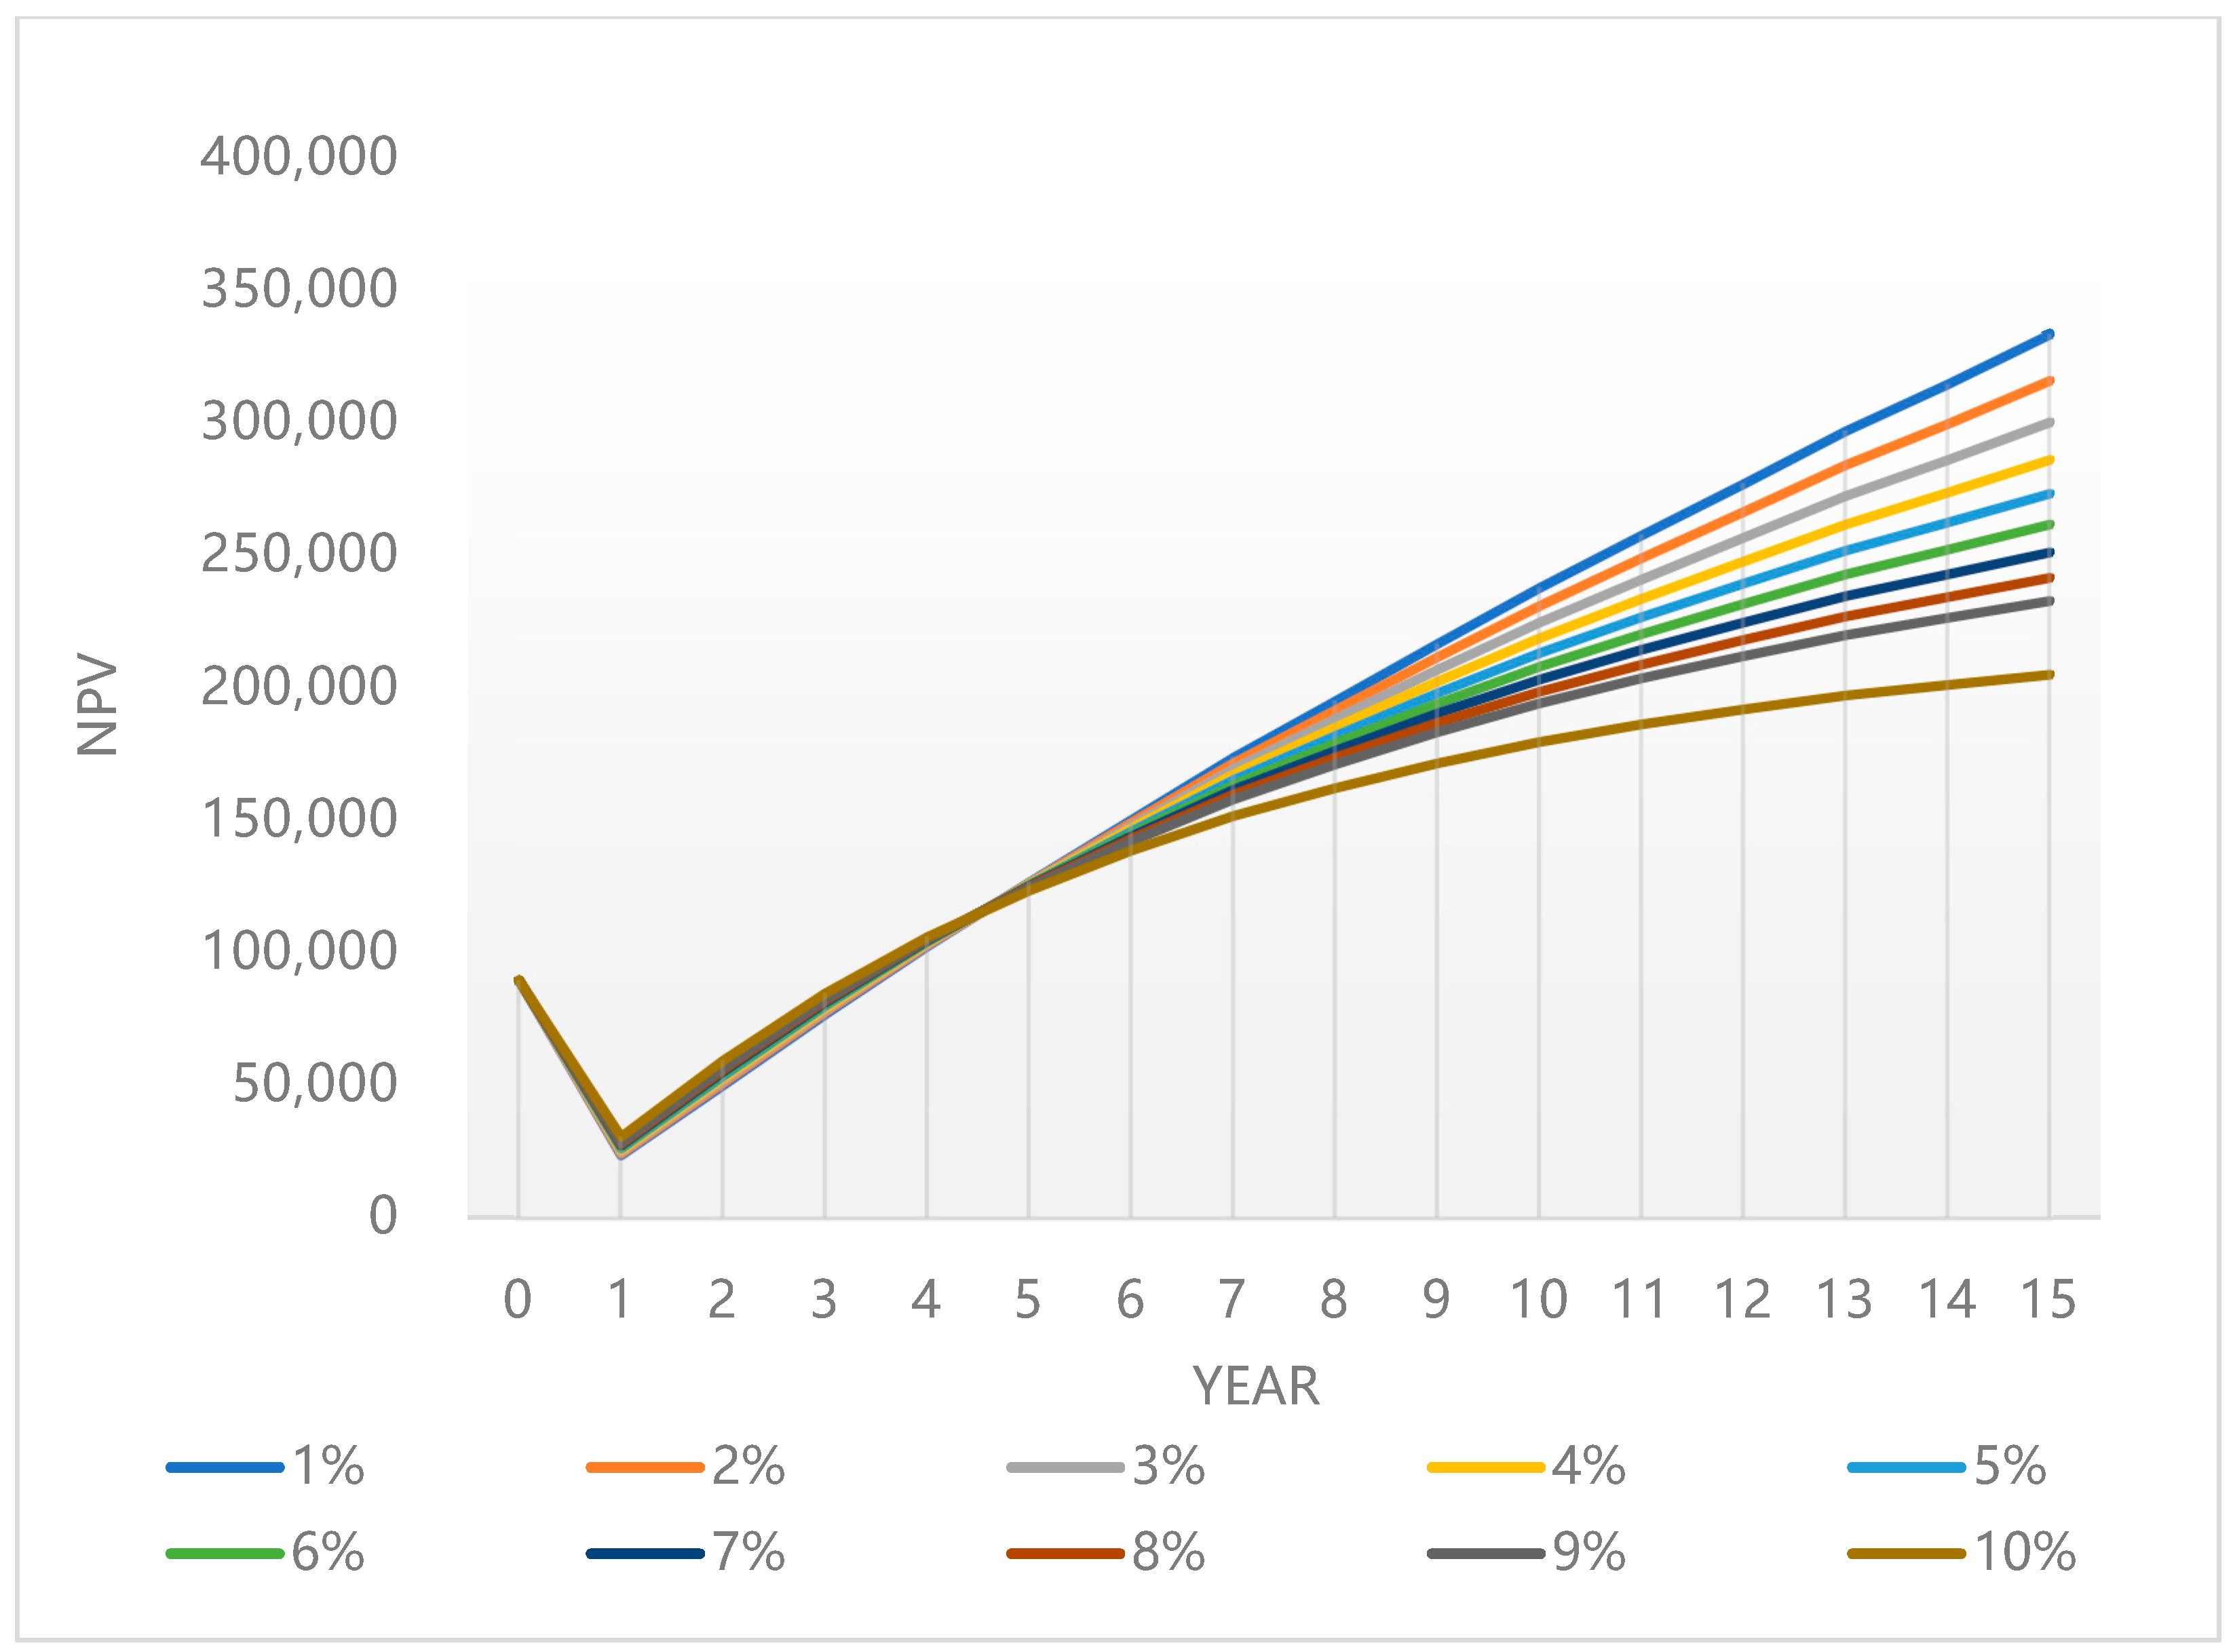
3.3. Analysis of the Real Discount Rate Affecting the Overall Cost for Consumers in Using BEVs and GVs
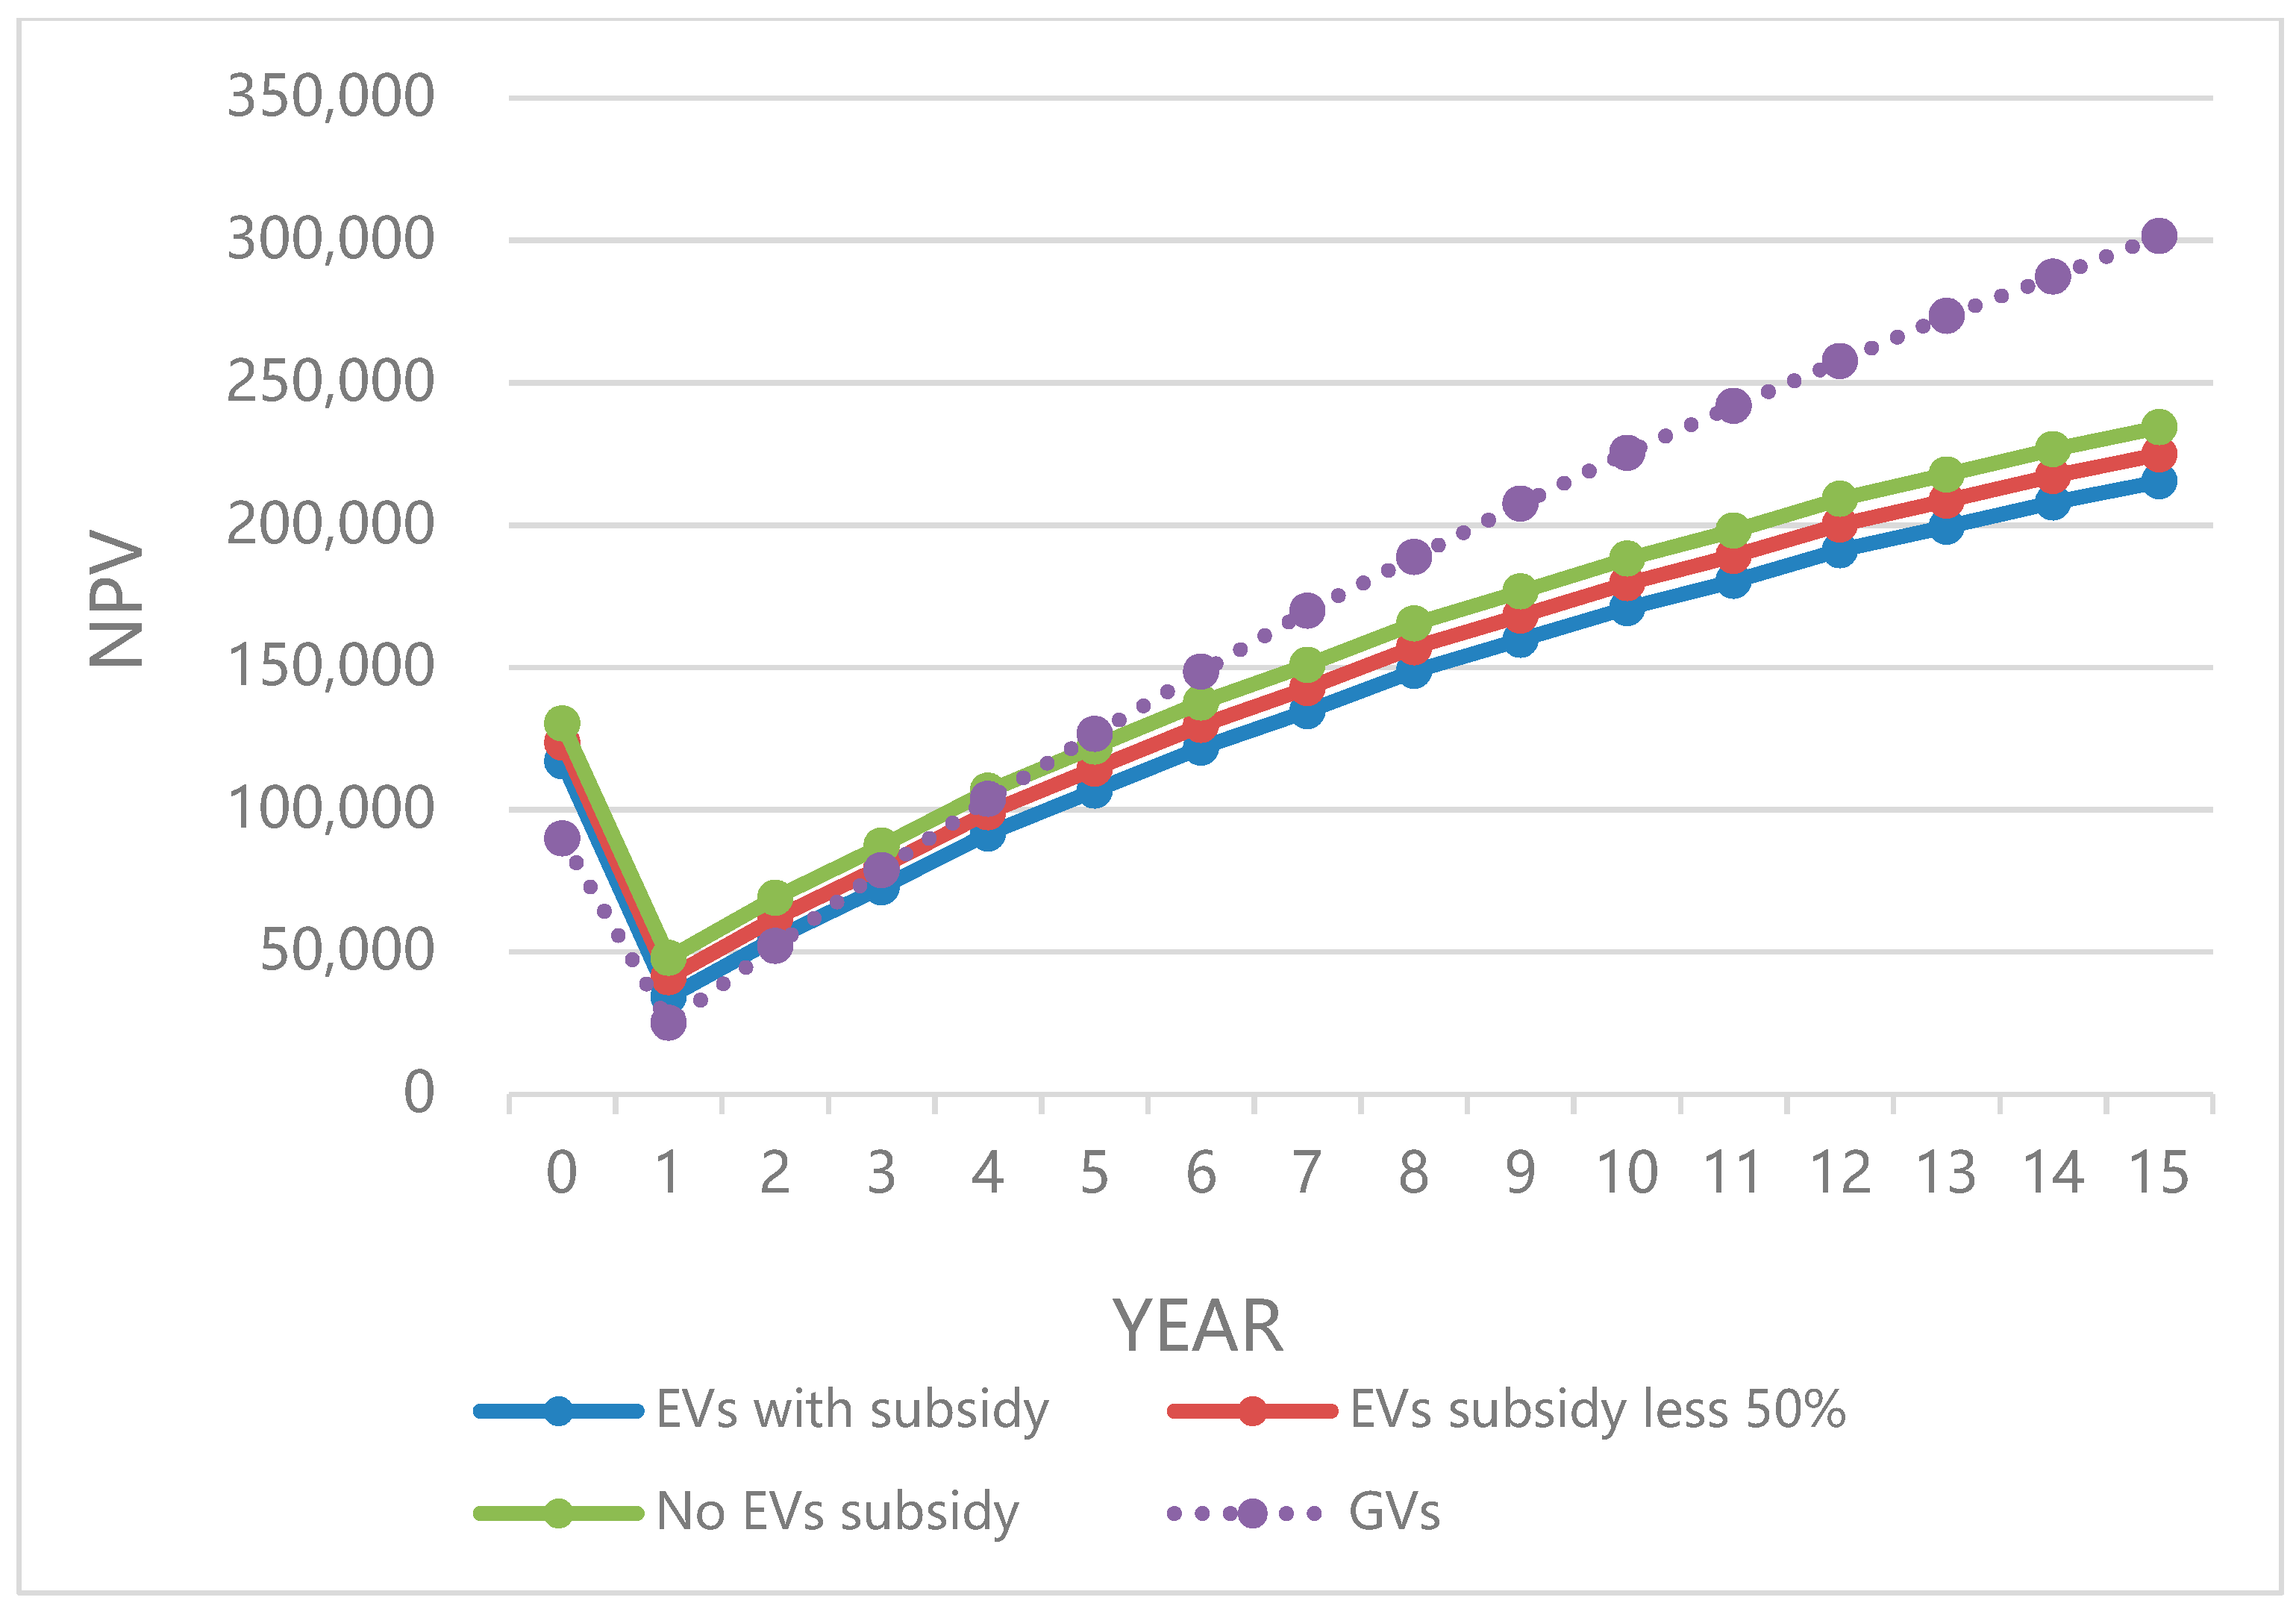
3.4. Analyzing Subsidies Affecting the Overall Cost for Consumers in the Utilization of BEVs and GVs
3.5. Use Phase Energy Consumption and Environmental Impacts
3.5.1. Overview of Energy Consumption
3.5.2. Extended Environmental Impacts: Trade-Off Analysis
4. Discussion
4.1. Interpretation of Cost Structure Results
4.2. Interpretation of NPV Comparison
4.3. Discussion on Discount Rate Sensitivity
4.4. Discussion on Subsidies Affecting Overall Cost for Consumers in the Utilization of BEVs and GVs
4.5. Discussion on Use Phase Energy Consumption and Environmental Impacts
4.5.1. Overview of Energy Consumption Discussion
4.5.2. Discussion on Extended Environmental Impacts: Trade-Off Analysis
5. Conclusions
Author Contributions
Funding
Institutional Review Board Statement
Data Availability Statement
Acknowledgments
Conflicts of Interest
Abbreviations
| BEVs | Battery electric vehicles |
| EVs | Electric vehicles |
| GVs | Gasoline vehicles |
| LCC | Three letter acronyms |
| NPV | Net present value |
| PV | Present value |
Appendix A

| Optiona 1: Electric Vehicles | Unit: | CNY | |||||||||||||||||
|---|---|---|---|---|---|---|---|---|---|---|---|---|---|---|---|---|---|---|---|
| Real Disscont Rate: | 2.94% | ||||||||||||||||||
| Year | Initial Purchase Cost | Operating Cost | Maintenance and Replacement Cost | Residual Valuation | Present Value | Cumulative Present Value | Net Present Value | Net Present Value (USD) | Net Present Value (EUR) | Year | |||||||||
| Purchase Price | Purchase Tax | Merchant Discount | Charging Pile Fee | License Plate Fee | Insurance Cost | Vehicle and Vessel Tax | Annual Vehicle Inspection Cost | Energy Cost | Cleaning Cost | Replacement and Service Cost | Resale Price | Resale Cost | |||||||
| 0 | 123,800.00 | 0.00 | 7000.00 | 0.00 | 130.00 | 116,930.00 | 116,930.00 | 116,930.00 | 16,709.06 | 15,582.36 | 0 | ||||||||
| 1 | 4979.00 | 0.00 | 2526.00 | 240.00 | 240.00 | 95,615.69 | 2448.39 | 7756.86 | 124,686.86 | 34,181.48 | 4884.46 | 4555.10 | 1 | ||||||
| 2 | 4979.00 | 0.00 | 2526.00 | 240.00 | 1463.00 | 85,461.62 | 2194.54 | 8689.35 | 133,376.20 | 54,799.27 | 7830.70 | 7302.67 | 2 | ||||||
| 3 | 4979.00 | 0.00 | 2526.00 | 240.00 | 240.00 | 76,159.28 | 1961.98 | 7319.94 | 140,696.14 | 72,678.63 | 10,385.63 | 9685.32 | 3 | ||||||
| 4 | 4979.00 | 0.00 | 2526.00 | 240.00 | 2963.00 | 67,664.13 | 1749.60 | 9535.68 | 150,231.83 | 91,533.65 | 13,079.97 | 12,197.98 | 4 | ||||||
| 5 | 4979.00 | 0.00 | 2526.00 | 240.00 | 240.00 | 59,931.58 | 1556.29 | 6907.63 | 157,139.46 | 106,640.39 | 15,238.69 | 14,211.14 | 5 | ||||||
| 6 | 4979.00 | 0.00 | 230.00 | 2526.00 | 240.00 | 1463.00 | 52,917.07 | 1380.93 | 7931.32 | 165,070.78 | 121,761.87 | 17,399.52 | 16,226.26 | 6 | |||||
| 7 | 4979.00 | 0.00 | 2526.00 | 240.00 | 240.00 | 46,576.04 | 1222.40 | 6518.55 | 171,589.33 | 134,564.91 | 19,229.05 | 17,932.42 | 7 | ||||||
| 8 | 4979.00 | 0.00 | 230.00 | 2526.00 | 240.00 | 2963.00 | 40,863.90 | 1079.60 | 8674.11 | 180,263.44 | 148,713.48 | 21,250.85 | 19,817.89 | 8 | |||||
| 9 | 4979.00 | 0.00 | 2526.00 | 240.00 | 240.00 | 35,736.11 | 951.40 | 6151.38 | 186,414.82 | 159,617.82 | 22,809.06 | 21,271.03 | 9 | ||||||
| 10 | 4979.00 | 0.00 | 230.00 | 2526.00 | 240.00 | 1463.00 | 31,148.08 | 836.70 | 7062.99 | 193,477.81 | 170,794.08 | 24,406.13 | 22,760.41 | 10 | |||||
| 11 | 4979.00 | 0.00 | 230.00 | 2526.00 | 240.00 | 240.00 | 27,055.25 | 734.38 | 5972.10 | 199,449.91 | 180,315.29 | 25,766.69 | 24,029.22 | 11 | |||||
| 12 | 4979.00 | 0.00 | 230.00 | 2526.00 | 240.00 | 2963.00 | 23,413.06 | 643.33 | 7724.46 | 207,174.38 | 191,094.29 | 27,306.99 | 25,465.66 | 12 | |||||
| 13 | 4979.00 | 0.00 | 230.00 | 2526.00 | 240.00 | 240.00 | 20,176.92 | 562.42 | 5635.71 | 212,810.09 | 199,354.01 | 28,487.28 | 26,566.37 | 13 | |||||
| 14 | 4979.00 | 0.00 | 230.00 | 2526.00 | 240.00 | 1463.00 | 17,302.29 | 490.56 | 6289.73 | 219,099.82 | 207,896.04 | 29,707.92 | 27,704.70 | 14 | |||||
| 15 | 4979.00 | 0.00 | 460.00 | 2526.00 | 240.00 | 240.00 | 14,744.58 | 426.61 | 5467.17 | 224,566.99 | 215,297.75 | 30,765.61 | 28,691.06 | 15 | |||||
| Optiona 2: Gasoline Vehicles | Unit: | CNY | |||||||||||||||||
|---|---|---|---|---|---|---|---|---|---|---|---|---|---|---|---|---|---|---|---|
| Real Disscont Rate: | 2.94% | ||||||||||||||||||
| Year | Initial Purchase Cost | Operating Cost | Maintenance and Replacement Cost | Residual Valuation | Present Value | Cumulative Present Value | Net Present Value | Net Present Value (USD) | Net Present Value (EUR) | Year | |||||||||
| Purchase Price | Purchase Tax | Mechant Discount | Charging Pile Fee | License Plate Fee | Insurance Cost | Vehicle and Ve-sel Tax | Annual Vehicle Inspection Cost | Energy Cost | Cleaning Cost | Replacement and Service Cost | Resale Price | Resale Cost | |||||||
| 0 | 110,000.00 | 9734.50 | 30,000.00 | 0.00 | 130.00 | 89,864.50 | 89,864.50 | 89,864.50 | 12,841.45 | 11,975.55 | 0 | ||||||||
| 1 | 4906.00 | 480.00 | 9941.15 | 240.00 | 504.00 | 84,957.40 | 2181.94 | 15,611.97 | 105,476.47 | 25,066.02 | 3581.88 | 3340.35 | 1 | ||||||
| 2 | 4906.00 | 480.00 | 9941.15 | 240.00 | 1771.00 | 75,935.20 | 1956.38 | 16,361.55 | 121,838.03 | 52,026.18 | 7434.44 | 6933.13 | 2 | ||||||
| 3 | 4906.00 | 480.00 | 9941.15 | 240.00 | 3290.00 | 67,669.80 | 1749.75 | 17,286.56 | 139,124.59 | 78,694.93 | 11,245.35 | 10,487.06 | 3 | ||||||
| 4 | 4906.00 | 480.00 | 9941.15 | 240.00 | 3196.00 | 60,121.60 | 1561.04 | 16,708.95 | 155,833.54 | 103,684.22 | 14,816.26 | 13,817.19 | 4 | ||||||
| 5 | 4906.00 | 480.00 | 9941.15 | 240.00 | 2404.00 | 53,251.00 | 1389.28 | 15,546.41 | 171,379.96 | 126,515.61 | 18,078.82 | 16,859.76 | 5 | ||||||
| 6 | 4906.00 | 480.00 | 310.00 | 9941.15 | 240.00 | 2576.00 | 47,018.40 | 1233.46 | 15,507.28 | 186,887.24 | 148,411.42 | 21,207.69 | 19,777.64 | 6 | |||||
| 7 | 4906.00 | 480.00 | 9941.15 | 240.00 | 3829.00 | 41,384.20 | 1092.61 | 15,834.04 | 202,721.28 | 169,829.26 | 24,268.26 | 22,631.83 | 7 | ||||||
| 8 | 4906.00 | 480.00 | 310.00 | 9941.15 | 240.00 | 1771.00 | 36,308.80 | 965.72 | 13,995.43 | 216,716.71 | 188,688.75 | 26,963.24 | 25,145.09 | 8 | |||||
| 9 | 4906.00 | 480.00 | 9941.15 | 240.00 | 3290.00 | 31,752.60 | 851.82 | 14,526.93 | 231,243.64 | 207,438.68 | 29,642.57 | 27,643.75 | 9 | ||||||
| 10 | 4906.00 | 480.00 | 310.00 | 9941.15 | 240.00 | 3196.00 | 27,676.00 | 749.90 | 14,273.52 | 245,517.16 | 225,366.83 | 32,204.46 | 30,032.89 | 10 | |||||
| 11 | 4906.00 | 480.00 | 310.00 | 9941.15 | 240.00 | 2404.00 | 24,039.40 | 658.99 | 13,289.94 | 258,807.10 | 241,810.12 | 34,554.18 | 32,224.16 | 11 | |||||
| 12 | 4906.00 | 480.00 | 310.00 | 9941.15 | 240.00 | 2576.00 | 20,803.20 | 578.08 | 13,031.70 | 271,838.80 | 257,555.73 | 36,804.19 | 34,322.46 | 12 | |||||
| 13 | 4906.00 | 480.00 | 310.00 | 9941.15 | 240.00 | 3829.00 | 17,927.80 | 506.20 | 13,518.96 | 285,357.76 | 273,406.06 | 39,069.17 | 36,434.71 | 13 | |||||
| 14 | 4906.00 | 480.00 | 310.00 | 9941.15 | 240.00 | 1771.00 | 15,373.60 | 442.34 | 11,761.19 | 297,118.95 | 287,168.36 | 41,035.78 | 38,268.71 | 14 | |||||
| 15 | 4906.00 | 480.00 | 620.00 | 9941.15 | 240.00 | 3290.00 | 13,101.00 | 385.53 | 12,609.23 | 309,728.18 | 301,496.36 | 43,083.22 | 40,178.09 | 15 | |||||
References
- The State Council of the People’s Republic China Xi Jinping: China’s Promised Time from Carbon Peak to Carbon Neutrality Is Far Shorter than the Time Taken by Developed Countries. Available online: http://www.gov.cn/xinwen/2021-04/22/content_5601515.htm (accessed on 19 March 2023).
- U.S. Department of Transportation Electric Vehicle Types. Available online: https://www.transportation.gov/rural/ev/toolkit/ev-basics/vehicle-types (accessed on 18 March 2023).
- Wang, Y.; Zhou, G.; Li, T.; Wei, X. Comprehensive Evaluation of the Sustainable Development of Battery Electric Vehicles in China. Sustainability 2019, 11, 5635. [Google Scholar] [CrossRef]
- Kim, S.; Lee, J.; Lee, C. Does Driving Range of Electric Vehicles Influence Electric Vehicle Adoption? Sustainability 2017, 9, 1783. [Google Scholar] [CrossRef]
- Anjos, M.; Gendron, B.; Joyce-Moniz, M. Increasing Electric Vehicle Adoption Through the Optimal Deployment of Fast-Charging Stations for Local and Long-Distance Travel. Eur. J. Oper. Res. 2020, 285, 263–278. [Google Scholar] [CrossRef]
- Li, Z.; Liang, F.; Cheng, M. Research on the Impact of High-End Ev Sales Business Model on Brand Competitiveness. Sustainability 2021, 13, 14045. [Google Scholar] [CrossRef]
- Jiang, N.; Xie, C.; Duthie, J.C.; Waller, S.T. A Network Equilibrium Analysis on Destination, Route and Parking Choices with Mixed Gasoline and Electric Vehicular Flows. EURO J. Transp. Logist. 2014, 3, 55–92. [Google Scholar] [CrossRef]
- Thomitzek, M.; von Drachenfels, N.; Cerdas, F.; Herrmann, C.; Thiede, S. Simulation-Based Assessment of the Energy Demand in Battery Cell Manufacturing. Procedia CIRP 2019, 80, 126–131. [Google Scholar] [CrossRef]
- International Energy Agency. Global Electric Vehicle Outlook 2022; International Energy Agency: Paris, France, 2022. [Google Scholar]
- Bekel, K.; Pauliuk, S. Prospective Cost and Environmental Impact Assessment of Battery and Fuel Cell Electric Vehicles in Germany. Int. J. Life Cycle Assess. 2019, 24, 2220–2237. [Google Scholar] [CrossRef]
- Wang, H.; Zhang, X.; Ouyang, M. Energy and Environmental Life-Cycle Assessment of Passenger Car Electrification Based on Beijing Driving Patterns. Sci. China Technol. Sci. 2015, 58, 659–668. [Google Scholar] [CrossRef]
- Litman, T.; Todd Alexander Litman, B.; Eric Doherty, W. Transportation Cost and Benefit Analysis Techniques, Estimates and Implications Second Edition. Vic. Transp. Policy Inst. 2009, 31, 9. [Google Scholar]
- Stodola, P.; Stodola, J. Model of Predictive Maintenance of Machines and Equipment. Appl. Sci. 2019, 10, 213. [Google Scholar] [CrossRef]
- The State Council, the People’s Republic of China Announcement on Continuing and Optimizing the Vehicle Purchase Tax Reduction and Reduction Policy for New Energy Vehicles. Available online: https://www.gov.cn/zhengce/zhengceku/202306/content_6887734.htm (accessed on 27 November 2023).
- Li, J.; Liang, M.; Cheng, W.; Wang, S. Life Cycle Cost of Conventional, Battery Electric, and Fuel Cell Electric Vehicles Considering Traffic and Environmental Policies in China. Int. J. Hydrogen Energy 2021, 46, 9553–9566. [Google Scholar] [CrossRef]
- Beijing Evening News How Long Can New Energy Pure Electric Vehicle Batteries Last? People’s Daily Online, 18 October 2016. Available online: http://kpzg.people.com.cn/n1/2016/1018/c404389-28788353.html (accessed on 12 May 2025).
- Iora, P.; Tribioli, L. Effect of Ambient Temperature on Electric Vehicles’ Energy Consumption and Range: Model Definition and Sensitivity Analysis Based on Nissan Leaf Data. World Electr. Veh. J. 2019, 10, 2. [Google Scholar] [CrossRef]
- English—People’s Daily Online What Is the New Energy Vehicle Charging Electric Car Video? Xinhua Net, 27 Septemper 2023. Available online: http://www.news.cn/fortune/2023-09/27/c_1129887953.htm (accessed on 12 May 2025).
- Zhou, Z.; Shi, H.; Fu, Q.; Li, T.; Gan, T.Y.; Liu, S.; Liu, K. Is the Cold Region in Northeast China Still Getting Warmer Under Climate Change Impact? Atmos. Res. 2020, 237, 104864. [Google Scholar] [CrossRef]
- The Paper Who dares to drive an “electric daddy” in Northeast China? The Paper, 14 February 2023. Available online: https://m.thepaper.cn/newsDetail_forward_21918698 (accessed on 12 May 2025).
- China Energy News Power grid construction continues to improve quality and efficiency (interconnection). People’s Daily Online, 9 March 2020. Available online: http://paper.people.com.cn/zgnyb/html/2020-03/09/content_1975661.htm (accessed on 12 May 2025).
- Cai, B.; Zhao, L.; Zhang, Z.; Lu, X.; Jia, M.; Zhang, L.; Liu, M.; Lei, Y.; Jiang, L.; Gao, Y.; et al. China Regional Power Grids Carbon Dioxide Emission Factors (2023); Chinese Rcademy of Environmental Planning: Beijing, China, 2023. [Google Scholar]
- China Passenger Car Association-Statistical Data. Available online: http://data.cpcadata.com/ (accessed on 24 July 2024).
- Yang, L.; Yu, B.; Yang, B.; Chen, H.; Malima, G.; Wei, Y.-M. Life Cycle Environmental Assessment of Electric and Internal Combustion Engine Vehicles in China. J. Clean. Prod. 2021, 285, 124899. [Google Scholar] [CrossRef]
- Kromydas, T. Rethinking Higher Education and Its Relationship with Social Inequalities: Past Knowledge, Present State and Future Potential. Palgrave Commun. 2017, 3, 1. [Google Scholar] [CrossRef]
- Wang, D.; Zamel, N.; Jiao, K.; Zhou, Y.; Yu, S.; Du, Q.; Yin, Y. Life Cycle Analysis of Internal Combustion Engine, Electric and Fuel Cell Vehicles for China. Energy 2013, 59, 402–412. [Google Scholar] [CrossRef]
- Marques, P.; Garcia, R.; Kulay, L.; Freire, F. Comparative Life Cycle Assessment of Lithium-Ion Batteries for Electric Vehicles Addressing Capacity Fade. J. Clean. Prod. 2019, 229, 787–794. [Google Scholar] [CrossRef]
- Weis, A.; Jaramillo, P.; Michalek, J. Consequential Life Cycle Air Emissions Externalities for Plug-in Electric Vehicles in the PJM Interconnection. Environ. Res. Lett. 2016, 11, 024009. [Google Scholar] [CrossRef]
- Holland, S.P.; Mansur, E.T.; Muller, N.Z.; Yates, A.J. Are There Environmental Benefits from Driving Electric Vehicles? The Importance of Local Factors. Am. Econ. Rev. 2016, 106, 3700–3729. [Google Scholar] [CrossRef]
- Tessum, C.W.; Hill, J.D.; Marshall, J.D. Life Cycle Air Quality Impacts of Conventional and Alternative Light-Duty Transportation in the United States. Proc. Natl. Acad. Sci. USA 2014, 111, 18490–18495. [Google Scholar] [CrossRef] [PubMed]
- Michalek, J.J.; Chester, M.; Jaramillo, P.; Samaras, C.; Shiau, C.S.N.; Lave, L.B. Valuation of Plug-in Vehicle Life-Cycle Air Emissions and Oil Displacement Benefits. Proc. Natl. Acad. Sci. USA 2011, 108, 16554–16558. [Google Scholar] [CrossRef]
- Qiao, Q.; Zhao, F.; Liu, Z.; He, X.; Hao, H. Life Cycle Greenhouse Gas Emissions of Electric Vehicles in China: Combining the Vehicle Cycle and Fuel Cycle. Energy 2019, 177, 222–233. [Google Scholar] [CrossRef]
- Zhang, C.; Zhang, C.; Li, J. Charging and discharging characteristics of lithium-ion batteries for electric transmission armored vehicles. Power Technol. 2010, 34, 109–112. [Google Scholar]
- ISO 14040:2006; Environmental Management—Life Cycle Assessment—Principles and Framework. ISO: Geneva, Switzerland, 2006. Available online: https://www.iso.org/standard/37456.html (accessed on 27 March 2022).
- Automotive Industry Portal Mark Lines. Electric Vehicle (BEV/PHV/FCV) Sales Monthly Report; Automotive Industry Portal Mark Lines: Tokyo, Japan, 2023. [Google Scholar]
- Ministry of Ecology and Environment of the People’s Republic of China 2019 Emission Reduction Project China Regional Grid Baseline Emission Factors. Available online: https://www.mee.gov.cn/ywgz/ydqhbh/wsqtkz/202012/t20201229_815386.shtml (accessed on 11 April 2023).
- Heilongjiang Meteorological Bureau. Heilongjiang Province Climate Bulletin; Heilongjiang Meteorological Bureau: Harbin, China, 2021. [Google Scholar]
- Liu, K.; Wang, J.; Yamamoto, T.; Morikawa, T. Exploring the Interactive Effects of Ambient Temperature and Vehicle Auxiliary Loads on Electric Vehicle Energy Consumption. Appl. Energy 2018, 227, 324–331. [Google Scholar] [CrossRef]
- Jin, L.; Wang, S.; He, H. Report on Actual Driving Performance, Energy Consumption, Cruising Range and Charging Mode of Guochure Electric Passenger Vehicles; International Council on Clean Transportation: Washington, DC, USA, 2023. [Google Scholar]
- Zhou, B. Electric Vehicle Lifespan and Healthy Driving Habits, China National Radio, 26 December 2020. Available online: https://www.cnr.cn/gsgb/2015yw/20201226/t20201226_525375131.shtml (accessed on 12 May 2025).
- Ministry of Industry and Information Technology of the People’s Republic of China. Notice on the Financial Support Policy for the Promotion and Application of New Energy Vehicles from 2016 to 2020; Ministry of Industry and Information Technology of the People’s Republic of China: Beijing, China, 2015. [Google Scholar]
- BYD Auto Official Website BYD Auto—The Leader in New Energy Vehicles. Available online: https://www.bydauto.com.cn/pc/configCar/?id=82&networkType=ocean (accessed on 19 November 2023).
- Zhao, D.; Guo, Q.; Ren, H.; Lu, Z.; Wang, H.; Chen, C.; Jia, M.; Ge, P.; Yu, R.; Liu, S.; et al. Report on the Development of China Energy-Saving and New Energy Vehicle (2017); China Sutomotive Technologu & Research Center: Tianjin, China, 2017; p. 8. [Google Scholar]
- BYD. BYD DolphinOwner’s Manual. Available online: https://www.carobook.com/byd-sms/byd-haitun-owners-manual.html (accessed on 19 November 2023).
- Evtimov, I.; Ivanov, R.; Stanchev, H.; Kadikyanov, G.; Staneva, G. Life cycle assessment of fuel cells electric vehicles. Transp. Probl. 2020, 15, 153–166. [Google Scholar] [CrossRef]
- Song, Q.; Wu, Y.; Li, J.; Wang, Z.; Yu, D.; Duan, H. Well-to-Wheel GHG Emissions and Mitigation Potential from Light-Duty Vehicles in Macau. Int. J. Life Cycle Assess. 2018, 23, 1916–1927. [Google Scholar] [CrossRef]
- Sherif, Y.S.; Kolarik, W.J. Life Cycle Costing: Concept and Practice. Omega 1981, 9, 287–296. [Google Scholar] [CrossRef]
- Onat, N.C.; Kucukvar, M.; Tatari, O. Integrating Triple Bottom Line Input–Output Analysis into Life Cycle Sustainability Assessment Framework: The Case for US Buildings. Int. J. Life Cycle Assess 2014, 19, 1488–1505. [Google Scholar] [CrossRef]
- ISO 15686-5:2017(En); Buildings and Constructed Assets—Service Life Planning—Part 5: Life-Cycle Costing. ISO: Geneva, Switzerland, 2017. Available online: https://www.iso.org/obp/ui/#iso:std:iso:15686:-5:ed-2:v1:en (accessed on 17 June 2021).
- Ghisellini, P.; Ripa, M.; Ulgiati, S. Exploring Environmental and Economic Costs and Benefits of a Circular Economy Approach to the Construction and Demolition Sector. A Literature Review. J. Clean. Prod. 2018, 178, 618–643. [Google Scholar] [CrossRef]
- Saic Volkswagen Saic Volkswagen. Available online: https://brand.svw-volkswagen.com/buyersGuide/promotion?mz_ca=2339374 (accessed on 19 November 2023).
- China Tax Service and Publicity Center What Vehicle Purchase Tax Incentives Will Taxpayers Have When Purchasing New Energy Vehicles from 2024 to 2027? Available online: http://heilongjiang.chinatax.gov.cn/art/2023/6/25/art_4941_472009.html (accessed on 19 November 2023).
- The State Council, the People’s Republic of China How to Calculate the Amount of Vehicle Purchase Tax Payable? Available online: https://www.gov.cn/fuwu/2019-07/19/content_5411535.htm (accessed on 19 November 2023).
- Auto Baodian A Comprehensive Collection of Information Required for Motor Vehicle Registration in Harbin “Harbin Vehicle Registration”. Available online: http://www.bdiy.net/abroad/2023103191945.html (accessed on 15 November 2023).
- Car Home Monthly Car Cost Is 556 Yuan, Analysis of 2023 BYD Dolphin Car Cost. Available online: https://chejiahao.m.autohome.com.cn/info/12075715 (accessed on 19 November 2023).
- Guo, W. Statutory Automobile Liability Insurance New Car Charging Standards. Available online: https://baike.pcauto.com.cn/17960.html (accessed on 19 November 2023).
- PCGROUP BYD Dolphin: The Guide Price Is 123,800 Yuan, and the Comprehensive Car Cost in the First Year Is About 5819 Yuan. Available online: https://hj.pcauto.com.cn/article/1969029 (accessed on 19 November 2023).
- Heilongjiang Provincial Tax Service, State Taxation Adiministration. State Administration of Taxation Heilongjiang Provincial Taxation Bureau Policy Documents Guidelines for Green and Low-Carbon Related Tax Preferential Policies; Heilongjiang Provincial Tax Service, State Taxation Adiministration: Harbin, China, 2021. [Google Scholar]
- State Council. Vehicle and Vessel Tax Law of the People’s Republic of China; State Council: Beijing, China, 2011. [Google Scholar]
- Car Owners Guide Car Review Fee Standards in 2023, New Annual Inspection Fee Standards Are Here. Available online: https://www.icauto.com.cn/baike/68/680082.html (accessed on 19 November 2023).
- Xinhuanet New Energy Vehicle Testing Charges Must Not Be Mixed or Bundled. Available online: http://www.news.cn/fortune/2021-08/26/c_1127798098.htm (accessed on 19 November 2023).
- Cogold Today’s Heilongjiang Gasoline Price—Heilongjiang Diesel Price. Available online: https://www.cngold.org/crude/heilongjiang.html (accessed on 19 November 2023).
- Vehicle Owner’s Guide How Much Does a Volkswagen Lavida Tire Cost? How Much Does It Cost to Replace a New Lavida Tire? Available online: https://www.icauto.com.cn/baike/63/636186.html (accessed on 19 November 2023).
- Vehicle Owner’s Guide How Much Does It Cost to Maintain a Lavida 1.5L? Lavida 1.5L Maintenance Cycle and Cost. Available online: https://www.icauto.com.cn/car/mt1018_byzq.html (accessed on 19 November 2023).
- China Pacific Insurance (Group) Co., Ltd. How Much Does It Cost to Transfer a Car? Available online: https://www.cpic.com.cn/baike/61.html (accessed on 19 November 2023).
- Xinhua China’s CPI up 2% in 2022. Available online: http://english.scio.gov.cn/pressroom/2023-01/12/content_85055550.htm (accessed on 17 November 2023).
- Biolek, V.; Hanák, T. LCC Estimation Model: A Construction Material Perspective. Buildings 2019, 9, 182. [Google Scholar] [CrossRef]
- Beers, B. Present Value vs. Net Present Value: What’s the Difference? Available online: https://www.investopedia.com/ask/answers/033115/what-difference-between-present-value-and-net-present-value.asp (accessed on 19 November 2023).
- Lazzarin, R.M.; Busato, F.; Castelloti, F. Life Cycle Assessment and Life Cycle Cost of Buildings’ Insulation Materials in Italy. Int. J. Low-Carbon Technol. 2008, 3, 44–58. [Google Scholar] [CrossRef]
- Kupec, J.; Dlask, P. Residual Method Used for Commercial Real Estate Valuation and Its Sensitivity. Bus. IT 2020, X(1), 12–21. [Google Scholar] [CrossRef]
- Wyatt, P. Property Valuation: In an Economic Context; Wiley: Hoboken, NJ, USA, 2007; ISBN 978-1-4051-3045-5. [Google Scholar]
- Dunn, D. Electric Vehicle Life Cycle Cost Analysis; Bureau of Transportation Statistics: Washington, DC, USA, 2017. [Google Scholar]
- Shafique, M.; Azam, A.; Rafiq, M.; Luo, X. Life Cycle Assessment of Electric Vehicles and Internal Combustion Engine Vehicles: A Case Study of Hong Kong. Res. Transp. Econ. 2022, 91, 101112. [Google Scholar] [CrossRef]
- Ecoinvent, v3.9.1; Ecoinvent: Zurich, Switzerland, 2022.
- Huijbregts, M.A.J.; Steinmann, Z.J.N.; Elshout, P.M.F.; Stam, G.; Verones, F.; Vieira, M.; Zijp, M.; Hollander, A.; van Zelm, R. ReCiPe2016: A Harmonised Life Cycle Impact Assessment Method at Midpoint and Endpoint Level. Int. J. Life Cycle Assess 2017, 22, 138–147. [Google Scholar] [CrossRef]
- He, H.; Bandivadekar, A. Comparative Study on Fiscal and Taxation Policies for Passenger Car CO2 Emission Reduction in Various Countries; The Internatinal Councl on Clean Transportation: Washington, DC, USA, 2010. [Google Scholar]
- United States Environmental Protection Agency. Greenhouse Gas Emissions from a Typical Passenger Vehicle. Available online: https://19january2021snapshot.epa.gov/greenvehicles/greenhouse-gas-emissions-typical-passenger-vehicle (accessed on 28 December 2023).
- GB 18352.6-2016; Limities and Measurment Methods for Emissions from Light-Duty Vehicle (China 6). Ministry of Environmental Protection General Administration of Quality Supervision, Inspection and Quarantine: Beijing, China, 2016.
- Bora, D.B. Comparison between NET present Value and internal rate of return. Int. J. Res. Financ. Mark. 2015, 5, 61–71. [Google Scholar]
- Lu, K.; Jiang, X.; Yu, J.; Tam, V.W.Y.; Skitmore, M. Integration of Life Cycle Assessment and Life Cycle Cost Using Building Information Modeling: A Critical Review. J. Clean. Prod. 2021, 285, 125438. [Google Scholar] [CrossRef]
- Liu, S.; Ning, X. A Two-Stage Building Information Modeling Based Building Design Method to Improve Lighting Environment and Increase Energy Efficiency. Appl. Sci. 2019, 9, 4076. [Google Scholar] [CrossRef]
- Wouterszoon Jansen, B.; van Stijn, A.; Gruis, V.; van Bortel, G. A Circular Economy Life Cycle Costing Model (CE-LCC) for Building Components. Resour. Conserv. Recycl. 2020, 161, 104857. [Google Scholar] [CrossRef]
- Ong, H.C.; Mahlia, T.M.I.; Masjuki, H.H.; Honnery, D. Life Cycle Cost and Sensitivity Analysis of Palm Biodiesel Production. Fuel 2012, 98, 131–139. [Google Scholar] [CrossRef]
- Kumar, A. Financing Norms and Schemes; IREDA: New Delhi, India, 2017. [Google Scholar]
- Li, J.; Ren, H.; Wang, M. How to Escape the Dilemma of Charging Infrastructure Construction? A Multi-Sectorial Stochastic Evolutionary Game Model. Energy 2021, 231, 120807. [Google Scholar] [CrossRef]
- Ministry of Ecology and Environment; National Bureau of Statistics. Announcement on the Release of 2022 Electricity Carbon Dioxide Emission Factors; Ministry of Ecology and Environment of the People’s Republic of China: Beijing, China, 2024. [Google Scholar]
- IPCC. 2006 IPCC Guidelines for National Greenhouse Gas Inventories; Intergovernmental Panel on Climate Change: Geneva, Switzerland, 2006; Volume 2. [Google Scholar]
- Onat, N.C.; Kucukvar, M.; Afshar, S. Eco-Efficiency of Electric Vehicles in the United States: A Life Cycle Assessment Based Principal Component Analysis. J. Clean. Prod. 2019, 212, 515–526. [Google Scholar] [CrossRef]
- Shi, X.; Wang, X.; Yang, J.; Sun, Z. Electric Vehicle Transformation in Beijing and the Comparative Eco-Environmental Impacts: A Case Study of Electric and Gasoline Powered Taxis. J. Clean. Prod. 2016, 137, 449–460. [Google Scholar] [CrossRef]
- Boureima, F.-S.; Messagie, M.; Matheys, J.; Wynen, V.; Sergeant, N.; Van Mierlo, J.; De Vos, M.; De Caevel, B. Comparative LCA of Electric, Hybrid, LPG and Gasoline Cars in Belgian Context. World Electr. Veh. J. 2009, 3, 469–476. [Google Scholar] [CrossRef]
- Abdul-Manan, A.F.N. Uncertainty and Differences in GHG Emissions between Electric and Conventional Gasoline Vehicles with Implications for Transport Policy Making. Energy Policy 2015, 87, 1–7. [Google Scholar] [CrossRef]
- Weldon, P.; Morrissey, P.; O’Mahony, M. Long-Term Cost of Ownership Comparative Analysis between Electric Vehicles and Internal Combustion Engine Vehicles. Sustain. Cities Soc. 2018, 39, 578–591. [Google Scholar] [CrossRef]
- Yang, L.; Yu, B.; Malima, G.; Yang, B.; Chen, H.; Wei, Y.-M. Are Electric Vehicles Cost Competitive? A Case Study for China Based on a Lifecycle Assessment. Env. Sci. Pollut. Res. 2022, 29, 7793–7810. [Google Scholar] [CrossRef] [PubMed]
- Liu, Z.; Song, J.; Kubal, J.; Susarla, N.; Knehr, K.W.; Islam, E.; Nelson, P.; Ahmed, S. Comparing Total Cost of Ownership of Battery Electric Vehicles and Internal Combustion Engine Vehicles. Energy Policy 2021, 158, 112564. [Google Scholar] [CrossRef]
- Lévay, P.Z.; Drossinos, Y.; Thiel, C. The Effect of Fiscal Incentives on Market Penetration of Electric Vehicles: A Pairwise Comparison of Total Cost of Ownership. Energy Policy 2017, 105, 524–533. [Google Scholar] [CrossRef]
- Jones, B.; Elliott, R.J.R.; Nguyen-Tien, V. The EV Revolution: The Road Ahead for Critical Raw Materials Demand. Appl. Energy 2020, 280, 115072. [Google Scholar] [CrossRef]
- Guo, X.; Sun, Y.; Ren, D. Life Cycle Carbon Emission and Cost-Effectiveness Analysis of Electric Vehicles in China. Energy Sustain. Dev. 2023, 72, 1–10. [Google Scholar] [CrossRef]
- Dua, R. Net-Zero Transport Dialogue: Emerging Developments and the Puzzles They Present. Energy Sustain. Dev. 2024, 82, 101516. [Google Scholar] [CrossRef]
- Guo, Z.; Li, T.; Peng, S.; Zhang, H. Environmental and Economic Consequences of the Incentive Policy on Electric Vehicle Industry: A CGE Based Study in China. Resour. Conserv. Recycl. 2021, 169, 105542. [Google Scholar] [CrossRef]
- Zhou, B.; Hu, H.; Dai, L. Assessment of the Development of Time-Sharing Electric Vehicles in Shanghai and Subsidy Implications: A System Dynamics Approach. Sustainability 2020, 12, 345. [Google Scholar] [CrossRef]
- Lyu, X.; Xu, Y.; Sun, D. An Evolutionary Game Research on Cooperation Mode of the NEV Power Battery Recycling and Gradient Utilization Alliance in the Context of China’s NEV Power Battery Retired Tide. Sustainability 2021, 13, 4165. [Google Scholar] [CrossRef]
- Ayodele, B.V.; Mustapa, S.I. Life Cycle Cost Assessment of Electric Vehicles: A Review and Bibliometric Analysis. Sustainability 2020, 12, 2387. [Google Scholar] [CrossRef]
- Tang, Y.; Zhang, Q.; Li, Y.; Li, H.; Pan, X.; Mclellan, B. The Social-Economic-Environmental Impacts of Recycling Retired EV Batteries under Reward-Penalty Mechanism. Appl. Energy 2019, 251, 113313. [Google Scholar] [CrossRef]
- Fridstrøm, L.; Østli, V. Direct and Cross Price Elasticities of Demand for Gasoline, Diesel, Hybrid and Battery Electric Cars: The Case of Norway. Eur. Transp. Res. Rev. 2021, 13, 3. [Google Scholar] [CrossRef]
- Nonaka, T.; Nakano, M. Carbon Taxation Using LCCO 2 and LCC for Clean Energy Vehicles. Nihon Kikai Gakkai Ronbunshu C Hen/Trans. Jpn. Soc. Mech. Eng. Part C 2011, 77, 4024–4033. [Google Scholar]
- Zheng, X.; Lin, H.; Liu, Z.; Li, D.; Llopis-Albert, C.; Zeng, S. Manufacturing Decisions and Government Subsidies for Electric Vehicles in China: A Maximal Social Welfare Perspective. Sustainability 2018, 10, 672. [Google Scholar] [CrossRef]
- Huang, Y.; Hu, X.; Zhang, F.; Pan, S.; Tan, J. Electricity Carbon Accounting Framework for China’s Regional Power Grids: A Case Study of the Southern Power Grid. Front. Energy Res. 2024, 12, 1479316. [Google Scholar] [CrossRef]
- Ning, L.; Ren, J.; Zhang, Z.; Cai, B.; Zhang, C. Study on the Carbon Footprint of China’s Regional and Provincial Power Grids in 2020. Environ. Eng. 2023, 41, 229–236. [Google Scholar] [CrossRef]
- Hu, D.; Zhou, K.; Hu, R.; Yang, J. Provincial Inequalities in Life Cycle Carbon Dioxide Emissions and Air Pollutants from Electric Vehicles in China. Commun. Earth Environ. 2024, 5, 726. [Google Scholar] [CrossRef]
- Khzouz, M.; Gkanas, E.I.; Shao, J.; Sher, F.; Beherskyi, D.; El-Kharouf, A.; Al Qubeissi, M. Life Cycle Costing Analysis: Tools and Applications for Determining Hydrogen Production Cost for Fuel Cell Vehicle Technology. Energies 2020, 13, 3783. [Google Scholar] [CrossRef]
- Daylan, B.; Ciliz, N. Life Cycle Assessment and Environmental Life Cycle Costing Analysis of Lignocellulosic Bioethanol as an Alternative Transportation Fuel. Renew. Energy 2016, 89, 578–587. [Google Scholar] [CrossRef]
- Cicconi, P.; Postacchini, L.; Pallotta, E.; Monteriù, A.; Prist, M.; Bevilacqua, M.; Germani, M. A Life Cycle Costing of Compacted Lithium Titanium Oxide Batteries for Industrial Applications. J. Power Sources 2019, 436, 226837. [Google Scholar] [CrossRef]
- Popien, J.-L.; Thies, C.; Barke, A.; Spengler, T.S. Comparative Sustainability Assessment of Lithium-Ion, Lithium-Sulfur, and All-Solid-State Traction Batteries. Int. J. Life Cycle Assess. 2023, 28, 462–477. [Google Scholar] [CrossRef]
- Iken, N.; Morel, S.; Aggeri, F. Towards a Sustainable Material Use in the Automotive Industry: Life Cycle Costing and Socio-Technical Approach to Material Use. Matér. Tech. 2019, 107, 504. [Google Scholar] [CrossRef]
- Wilken, D.; Oswald, M.; Draheim, P.; Pade, C.; Brand, U.; Vogt, T. Multidimensional Assessment of Passenger Cars: Comparison of Electric Vehicles with Internal Combustion Engine Vehicles. Procedia CIRP 2020, 90, 291–296. [Google Scholar] [CrossRef]
- Wulf, C.; Haase, M.; Baumann, M.; Zapp, P. Weighting Factor Elicitation for Sustainability Assessment of Energy Technologies. Sustain. Energy Fuels 2023, 7, 832–847. [Google Scholar] [CrossRef]
- Moro, A.; Lonza, L. Electricity Carbon Intensity in European Member States: Impacts on GHG Emissions of Electric Vehicles. Transp. Res. Part D Transp. Environ. 2018, 64, 5–14. [Google Scholar] [CrossRef]
- Shafique, M.; Luo, X. Environmental Life Cycle Assessment of Battery Electric Vehicles from the Current and Future Energy Mix Perspective. J. Environ. Manag. 2022, 303, 114050. [Google Scholar] [CrossRef]
- Al-Buenain, A.; Al-Muhannadi, S.; Falamarzi, M.; Kutty, A.A.; Kucukvar, M.; Onat, N.C. The Adoption of Electric Vehicles in Qatar Can Contribute to Net Carbon Emission Reduction but Requires Strong Government Incentives. Vehicles 2021, 3, 618–635. [Google Scholar] [CrossRef]
- Khanna, D. Life Cycle Assessment of Battery Electric Vehicles and Hydrogen Fuel Cell Vehicles. Master’s Thesis, University of Alberta, Edmonton, AB, Canada, 2023. [Google Scholar]
- Poovanna, P.; Davis, R.; Argue, C. Environmental Life Cycle Assessment of Electric Vehicles in Canada. Available online: https://toolkit.bc.ca/tool/environmental-life-cycle-assessment-of-electric-vehicles-in-canada/ (accessed on 1 May 2025).
- Göhlich, D.; Ly, T.-A.; Kunith, A.; Jefferies, D. Economic Assessment of Different Air-Conditioning and Heating Systems for Electric City Buses Based on Comprehensive Energetic Simulations. World Electr. Veh. J. 2015, 7, 398–406. [Google Scholar] [CrossRef]
- Ke, W.; Zhang, S.; He, X.; Wu, Y.; Hao, J. Well-to-Wheels Energy Consumption and Emissions of Electric Vehicles: Mid-Term Implications from Real-World Features and Air Pollution Control Progress. Appl. Energy 2017, 188, 367–377. [Google Scholar] [CrossRef]
- Hou, R.; Lei, L.; Jin, K.; Lin, X.; Xiao, L. Introducing Electric Vehicles? Impact of Network Effect on Profits and Social Welfare. Energy 2022, 243, 123002. [Google Scholar] [CrossRef]
- Cai, Y.; Applegate, S.; Yue, W.; Cai, J.; Wang, X.; Liu, G.; Li, C. A Hybrid Life Cycle and Multi-Criteria Decision Analysis Approach for Identifying Sustainable Development Strategies of Beijing’s Taxi Fleet. Energy Policy 2017, 100, 314–325. [Google Scholar] [CrossRef]
- Ding, N.; Liu, J.; Kong, Z.; Yan, L.; Yang, J. Life Cycle Greenhouse Gas Emissions of Chinese Urban Household Consumption Based on Process Life Cycle Assessment: Exploring the Critical Influencing Factors. J. Clean. Prod. 2019, 210, 898–906. [Google Scholar] [CrossRef]
- Yu, B.; Li, X.; Xue, M. Impacts of Shared Mobility on Energy Consumption and Emissions in China. Transp. Energy Res. 2020, 223–242. [Google Scholar] [CrossRef]
- Harbin Municipal Government. Harbin Electric Vehicle Charging and Swapping Facility Construction Acceptance and Operation Management Measures (Interim); Harbin Municipal Government: Harbin, China, 2025. [Google Scholar]
- Heilongjiang Province Healthcare Security Administration Opinions of the CPC Heilongjiang Provincial Committee and the People’s Government of Heilongjiang Province on Comprehensively Implementing Xi Jinping’s Thoughts on Ecological Civilization and Accelerating the Construction of a Green Heilongjiang. Available online: https://ybj.hlj.gov.cn/ybj/c105511/202405/c00_31749024.shtml (accessed on 1 May 2025).

| Category | Details |
|---|---|
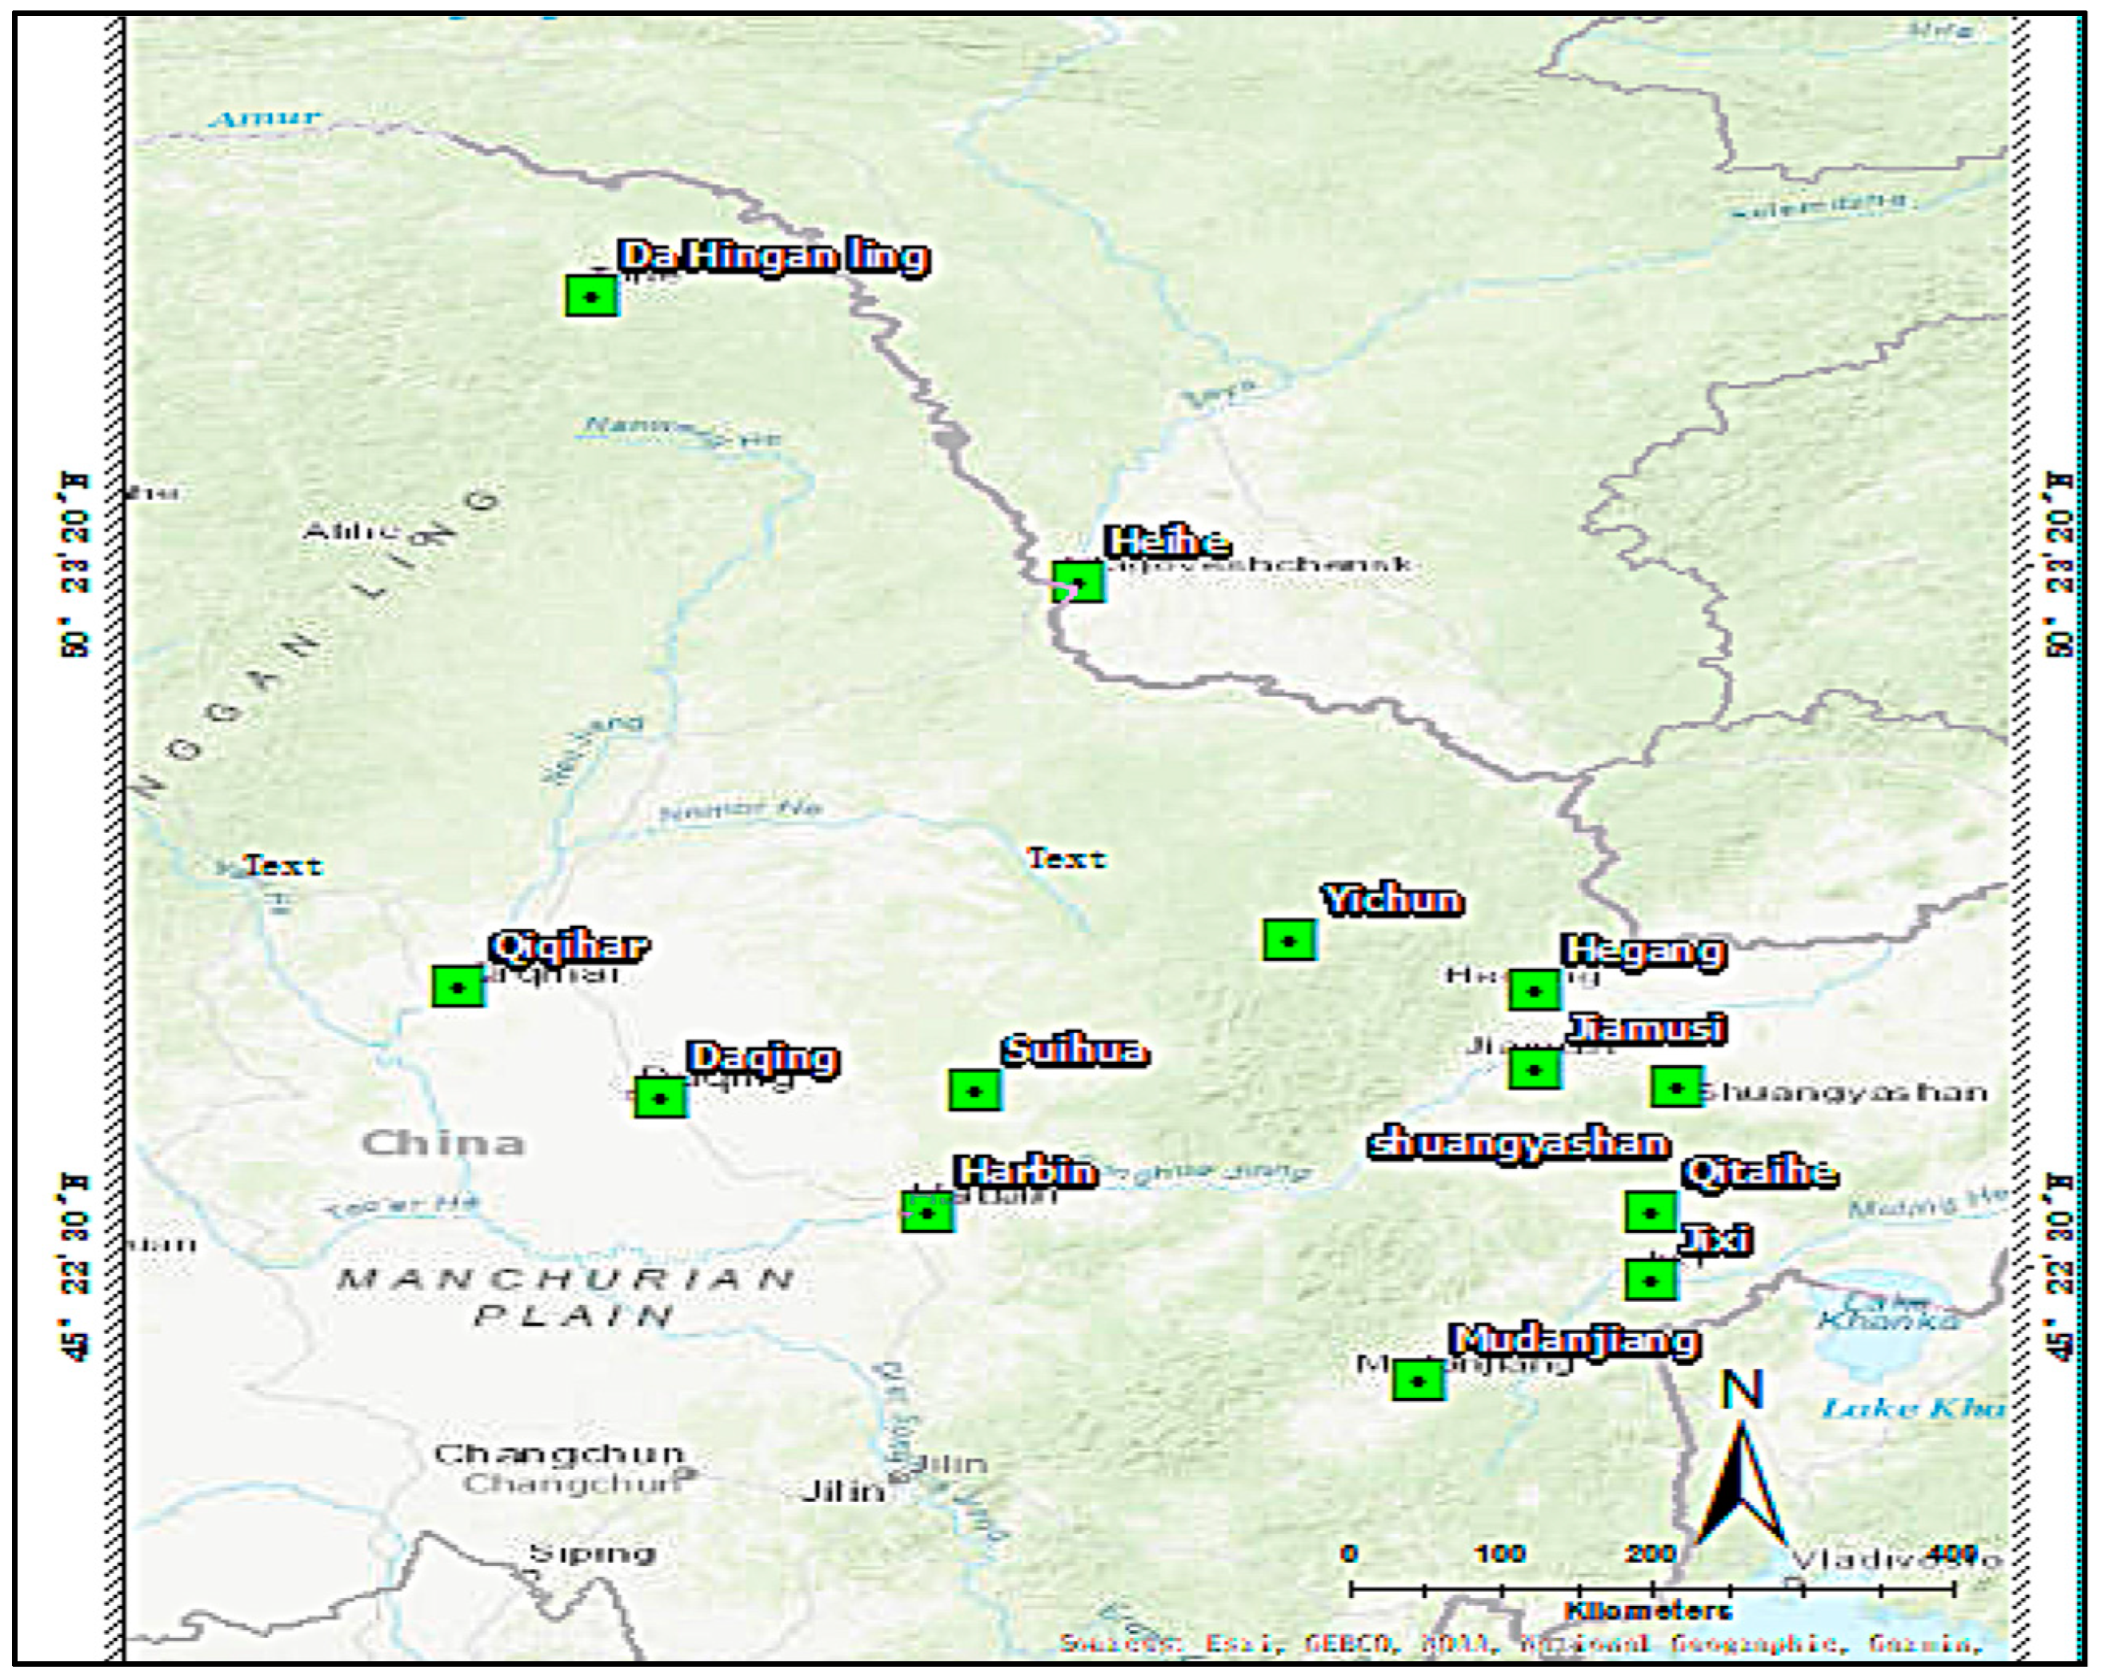
| Province Name | Heilongjiang Province |
| Capital City | Harbin |
| Total Land Area | 473,000 km2 (6th largest in China) |
| Geographic Boundaries | Borders Russia (N/E), Inner Mongolia (W), and Jilin Province (S) |
| Urban Land Use (est.) | 15% |
| Industrial Land Use (est.) | 10% |
| Natural Zones (forests, rivers, wetlands) | 65% |
| Pedestrian/Leisure Zones (est.) | 10% |
| Major Rivers | Heilongjiang, Songhua, Wusuri, and Suifen |
| Major Lakes | Xingkai Lake, Jingbo Lake, and Wudalianchi |
| Climate Type | Cold temperate and mid-temperate; continental monsoon |
| Frost-Free Period | 90–160 days, decreasing from south to north |
| Impact Category | Indicators | Sources |
|---|---|---|
| Initial purchase cost | Purchase price | [42,51] |
| Purchase tax | [52,53] | |
| Subsidy | [42,51] | |
| Charging Pile Fee | [42] | |
| License Plate Fee | [54] | |
| Insurance Cost | [55,56,57] | |
| Operating and maintenance cost | Vehicle And Vessel Tax | [58,59] |
| Annual Vehicle Inspection Cost | [60,61] | |
| Energy Cost | [62] | |
| Cleaning cost | Based on general price at market | |
| Replacement Cost and Service Cost | [44,63,64] | |
| End of life | Resale price | Calculate based on vehicle depreciation rate |
| Resale cost | [65] | |
| Inflation rate | 2% | [66] |
| discount rate | 5% | [67] |
| Energy consumption | 5.98 L/100 km 44.9 kWh/420 km | [42,51] |
| Average electricity fee | 0.9192583125 RMB/kWh | [40] State grid Heilongjiang electric power company limited |
| Average gasoline fee | 8.312083333 RMB/L | [62] |
| Parameter | Unit | GV | BEV (NECG, Four-Season Adjusted) |
|---|---|---|---|
| Energy consumption (20,000 km) | kg fuel/kWh electricity | 1196 kg petrol | 2706.5 kWh electricity |
| Emission factor (full life cycle of petrol or electricity) | kg CO2/kg or kg CO2/kWh | 3.55 | 1.498 |
| Total CO2 emissions | kg CO2 eq | 4245.51 | 4053.67 |
| CO2 emissions per kilometer | kg/km | 0.212 | 0.203 |
| Impact Category | Unit | GV | BEV (NECG) | Δ (%) BEV vs. GV |
|---|---|---|---|---|
| Global warming | kg CO2 eq | 4245.514 | 4053.67 | −4.52% |
| Stratospheric ozone depletion | kg CFC11 eq | 0.005 | 0.001 | −83.84% |
| Ionizing radiation | kBq Co-60 eq | 19.498 | 73.750 | 278.24% |
| Ozone formation: human health | kg NOx eq | 3.602 | 11.239 | 212.04% |
| Fine particulate matter formation | kg PM2.5 eq | 1.670 | 5.927 | 261.51% |
| Ozone formation: terrestrial | kg NOx eq | 4.409 | 11.272 | 155.67% |
| Terrestrial acidification | kg SO2 eq | 4.675 | 12.815 | 174.09% |
| Freshwater eutrophication | kg P eq | 0.083 | 0.736 | 784.22% |
| Marine eutrophication | kg N eq | 0.115 | 0.049 | −57.67% |
| Terrestrial ecotoxicity | kg 1,4-DCB | 3460.524 | 2725.750 | −21.23% |
| Freshwater ecotoxicity | kg 1,4-DCB | 11.233 | 47.878 | 326.24% |
| Marine ecotoxicity | kg 1,4-DCB | 20.084 | 64.616 | 221.73% |
| Human carcinogenic toxicity | kg 1,4-DCB | 42.788 | 122.072 | 185.29% |
| Human non-carcinogenic toxicity | kg 1,4-DCB | 355.613 | 1801.315 | 406.54% |
| Land use | m2a crop eq | 29.278 | 47.857 | 63.46% |
| Mineral resource scarcity | kg Cu eq | 2.328 | 1.543 | −33.73% |
| Fossil resource scarcity | kg oil eq | 1466.821 | 778.063 | −46.96% |
| Water consumption | m3 | 3.224 | 9.932 | 208.05% |
Disclaimer/Publisher’s Note: The statements, opinions and data contained in all publications are solely those of the individual author(s) and contributor(s) and not of MDPI and/or the editor(s). MDPI and/or the editor(s) disclaim responsibility for any injury to people or property resulting from any ideas, methods, instructions or products referred to in the content. |
© 2025 by the authors. Licensee MDPI, Basel, Switzerland. This article is an open access article distributed under the terms and conditions of the Creative Commons Attribution (CC BY) license (https://creativecommons.org/licenses/by/4.0/).
Share and Cite
Ma, S.; Sharaai, A.H.; He, Z.; Matthew, N.K.; Zainordin, N.S. Life Cycle Cost and Environmental Performance of Electric and Gasoline Vehicles in Cold Climate and Coal-Dependent Regions: A Case Study of Heilongjiang Province, China. Sustainability 2025, 17, 4554. https://doi.org/10.3390/su17104554
Ma S, Sharaai AH, He Z, Matthew NK, Zainordin NS. Life Cycle Cost and Environmental Performance of Electric and Gasoline Vehicles in Cold Climate and Coal-Dependent Regions: A Case Study of Heilongjiang Province, China. Sustainability. 2025; 17(10):4554. https://doi.org/10.3390/su17104554
Chicago/Turabian StyleMa, Sining, Amir Hamzah Sharaai, Zhijian He, Nitanan Koshy Matthew, and Nazatul Syadia Zainordin. 2025. "Life Cycle Cost and Environmental Performance of Electric and Gasoline Vehicles in Cold Climate and Coal-Dependent Regions: A Case Study of Heilongjiang Province, China" Sustainability 17, no. 10: 4554. https://doi.org/10.3390/su17104554
APA StyleMa, S., Sharaai, A. H., He, Z., Matthew, N. K., & Zainordin, N. S. (2025). Life Cycle Cost and Environmental Performance of Electric and Gasoline Vehicles in Cold Climate and Coal-Dependent Regions: A Case Study of Heilongjiang Province, China. Sustainability, 17(10), 4554. https://doi.org/10.3390/su17104554