
Resilience and Functional Service Life of Modern Heritage Timber Buildings Amid Climate Change in Chile


Abstract
1. Introduction
2. Materials and Methods
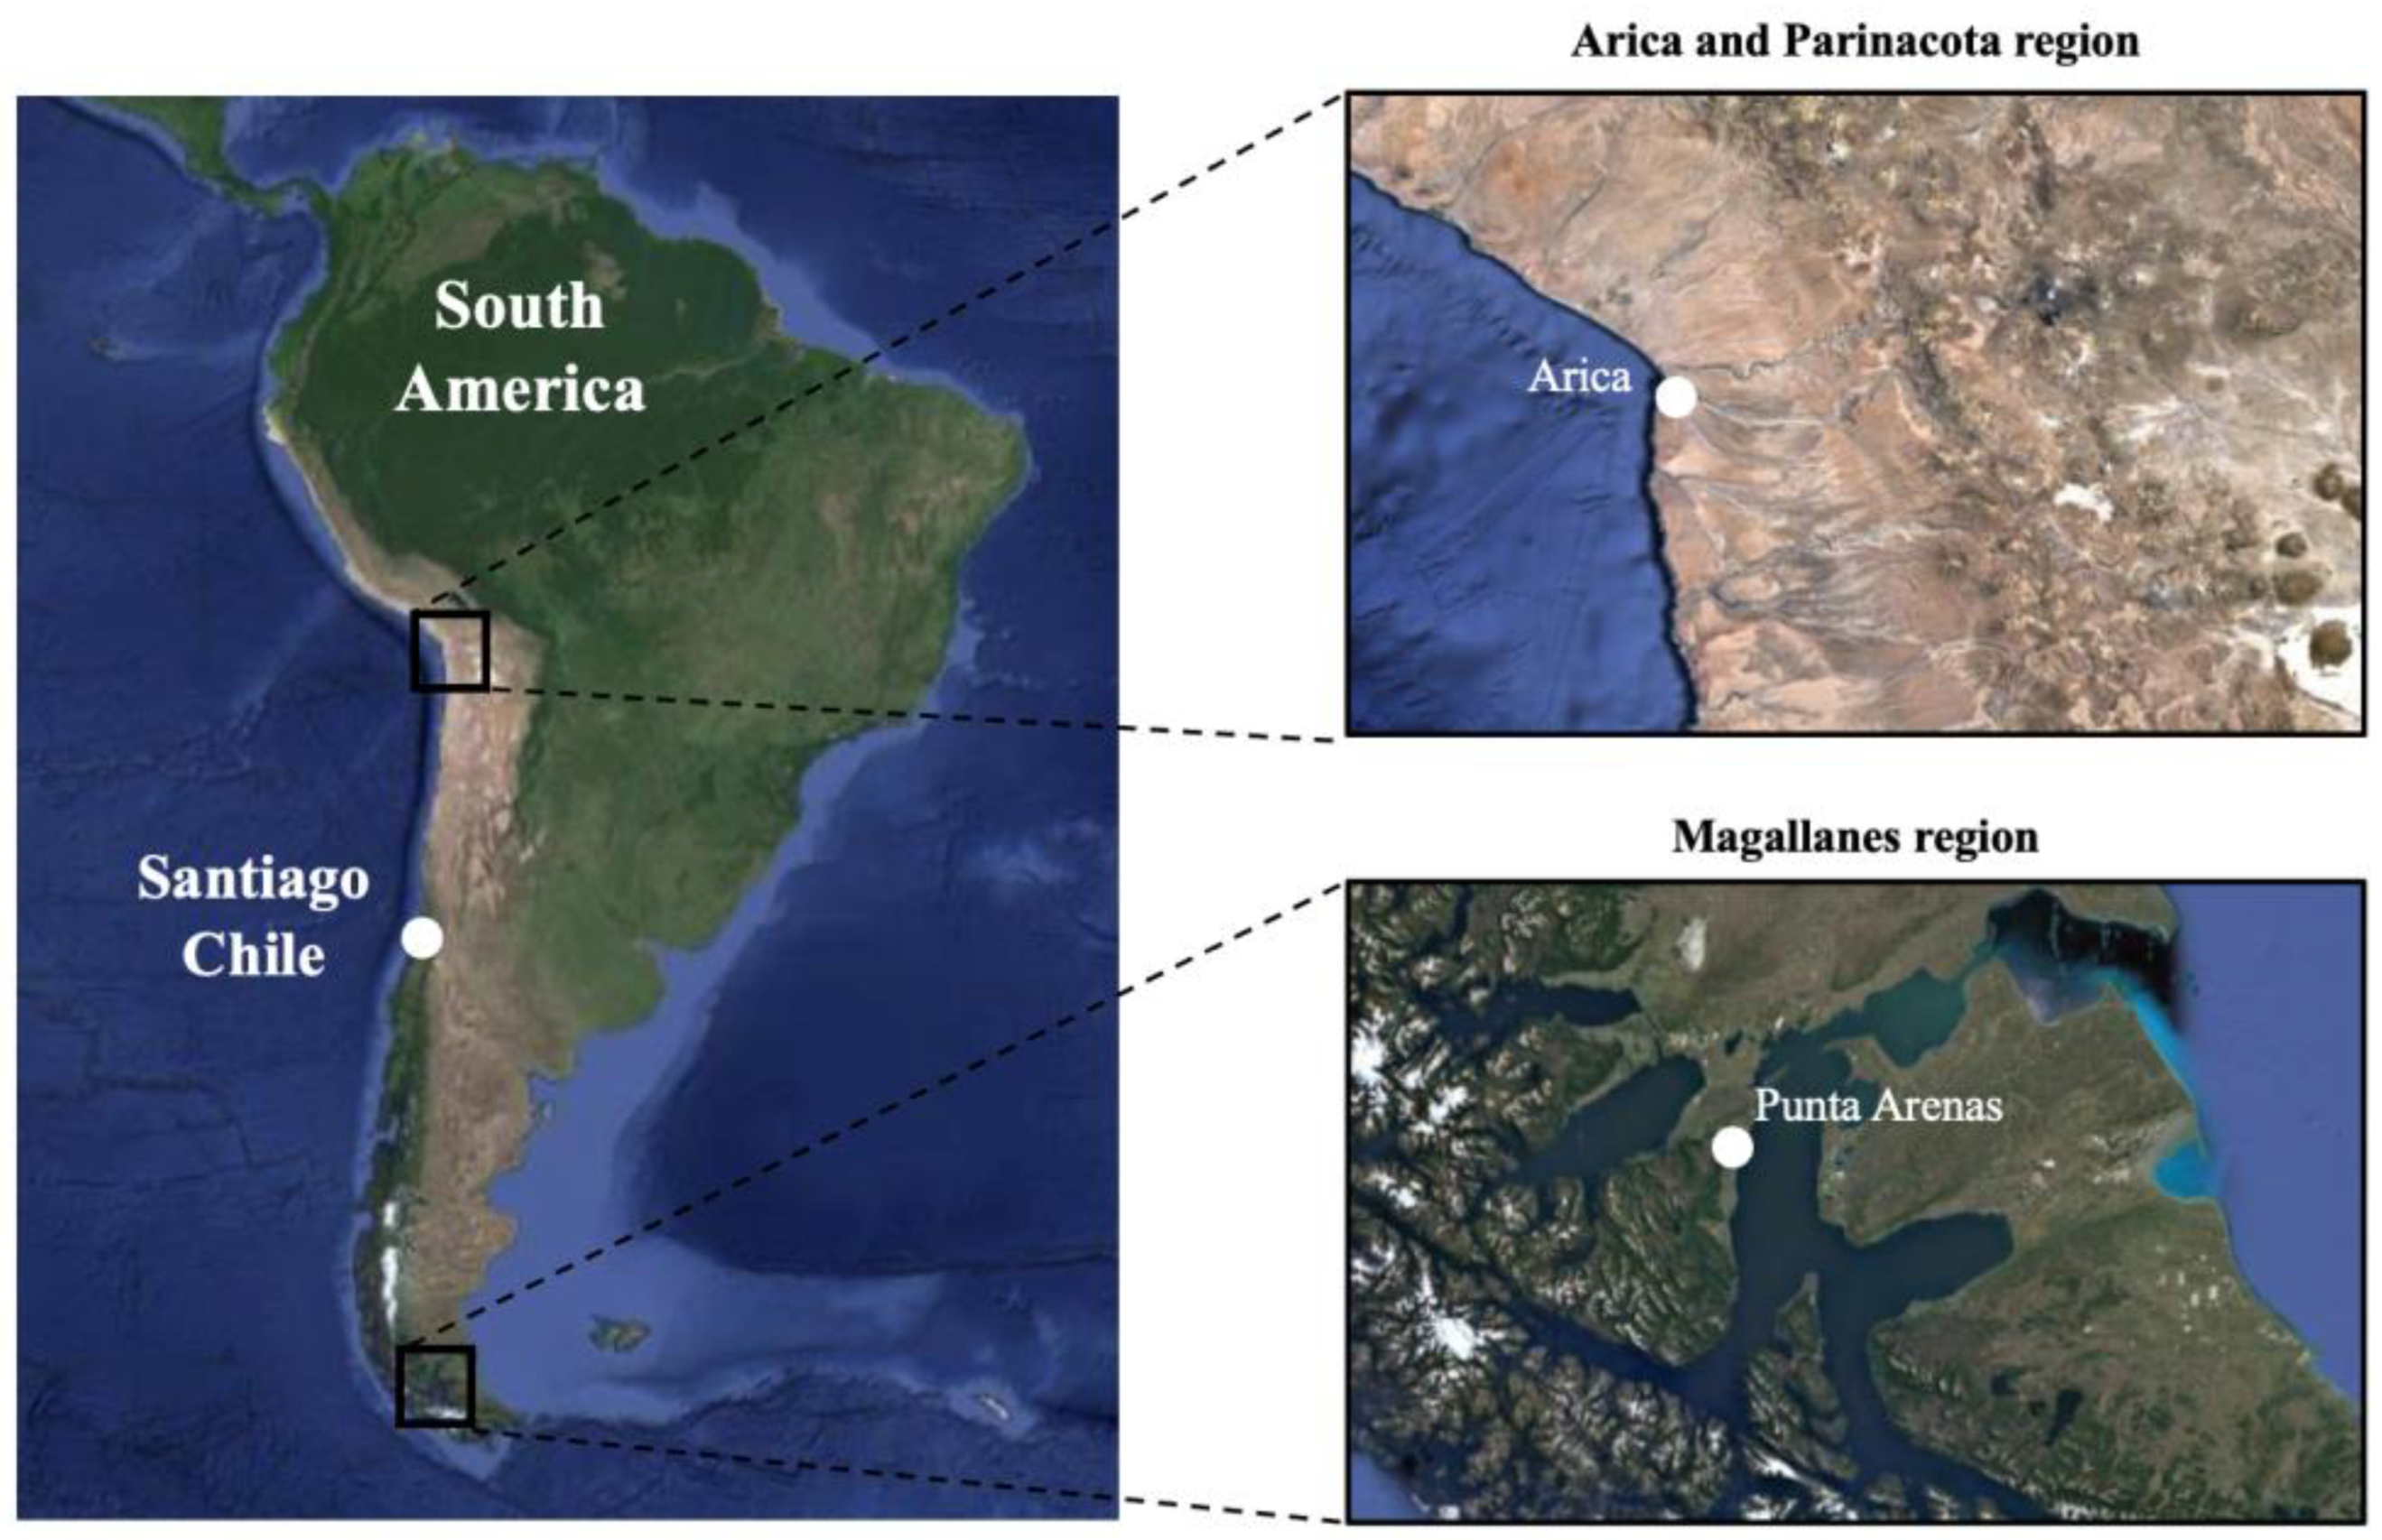
2.1. Climatic and Geographical Characterisation of the Locations
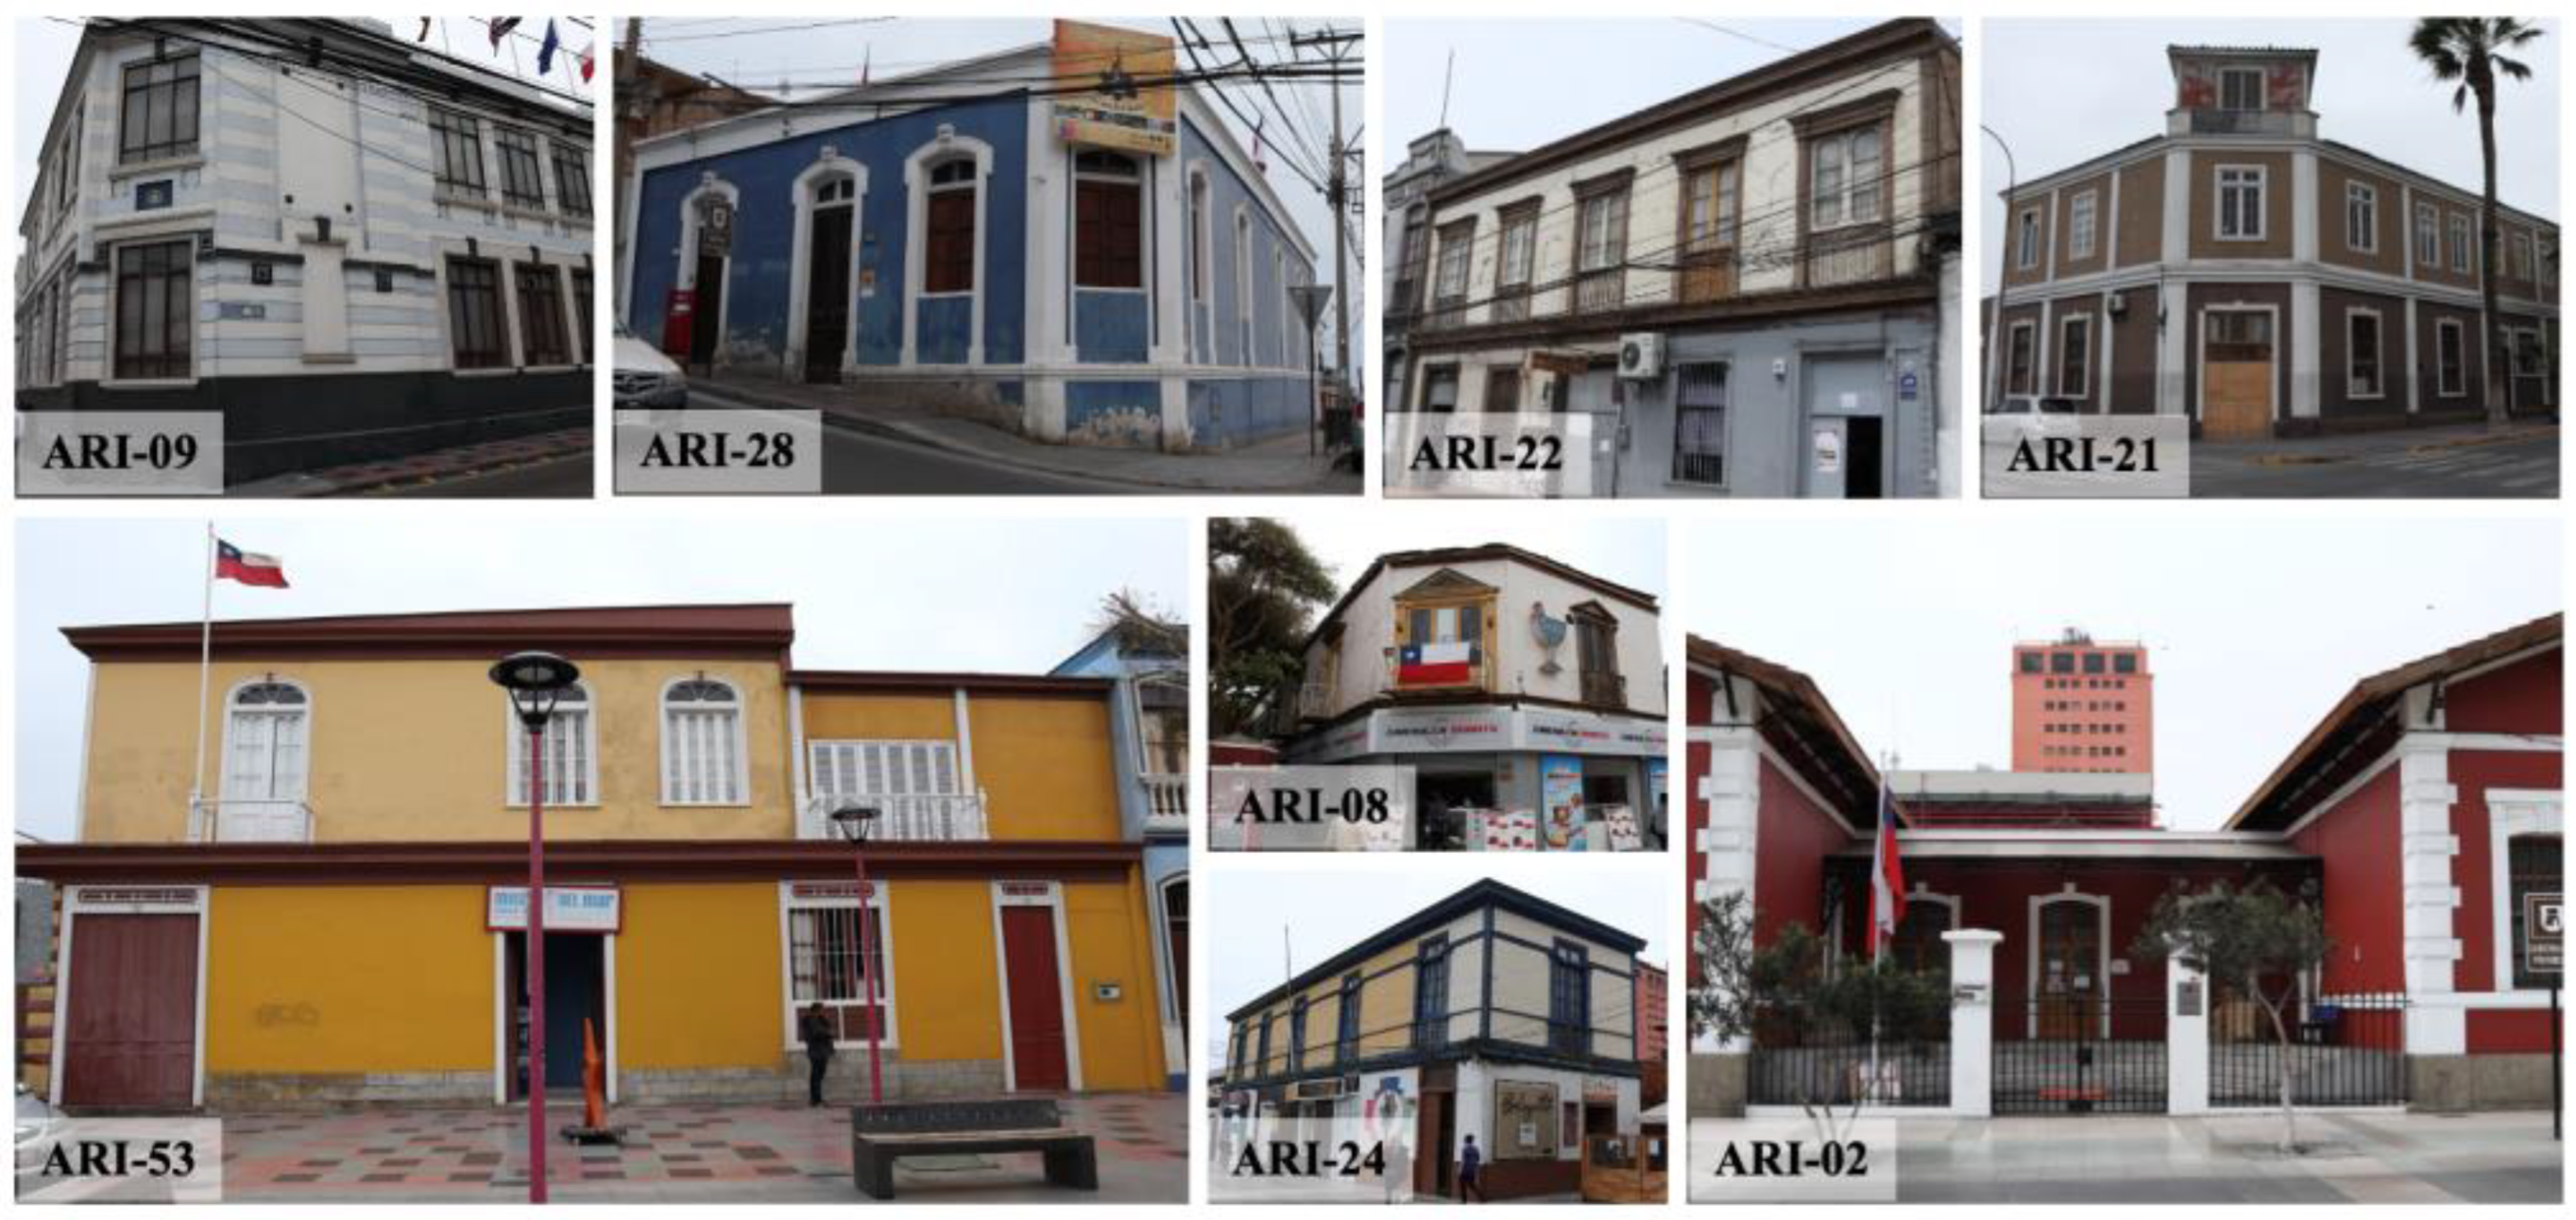
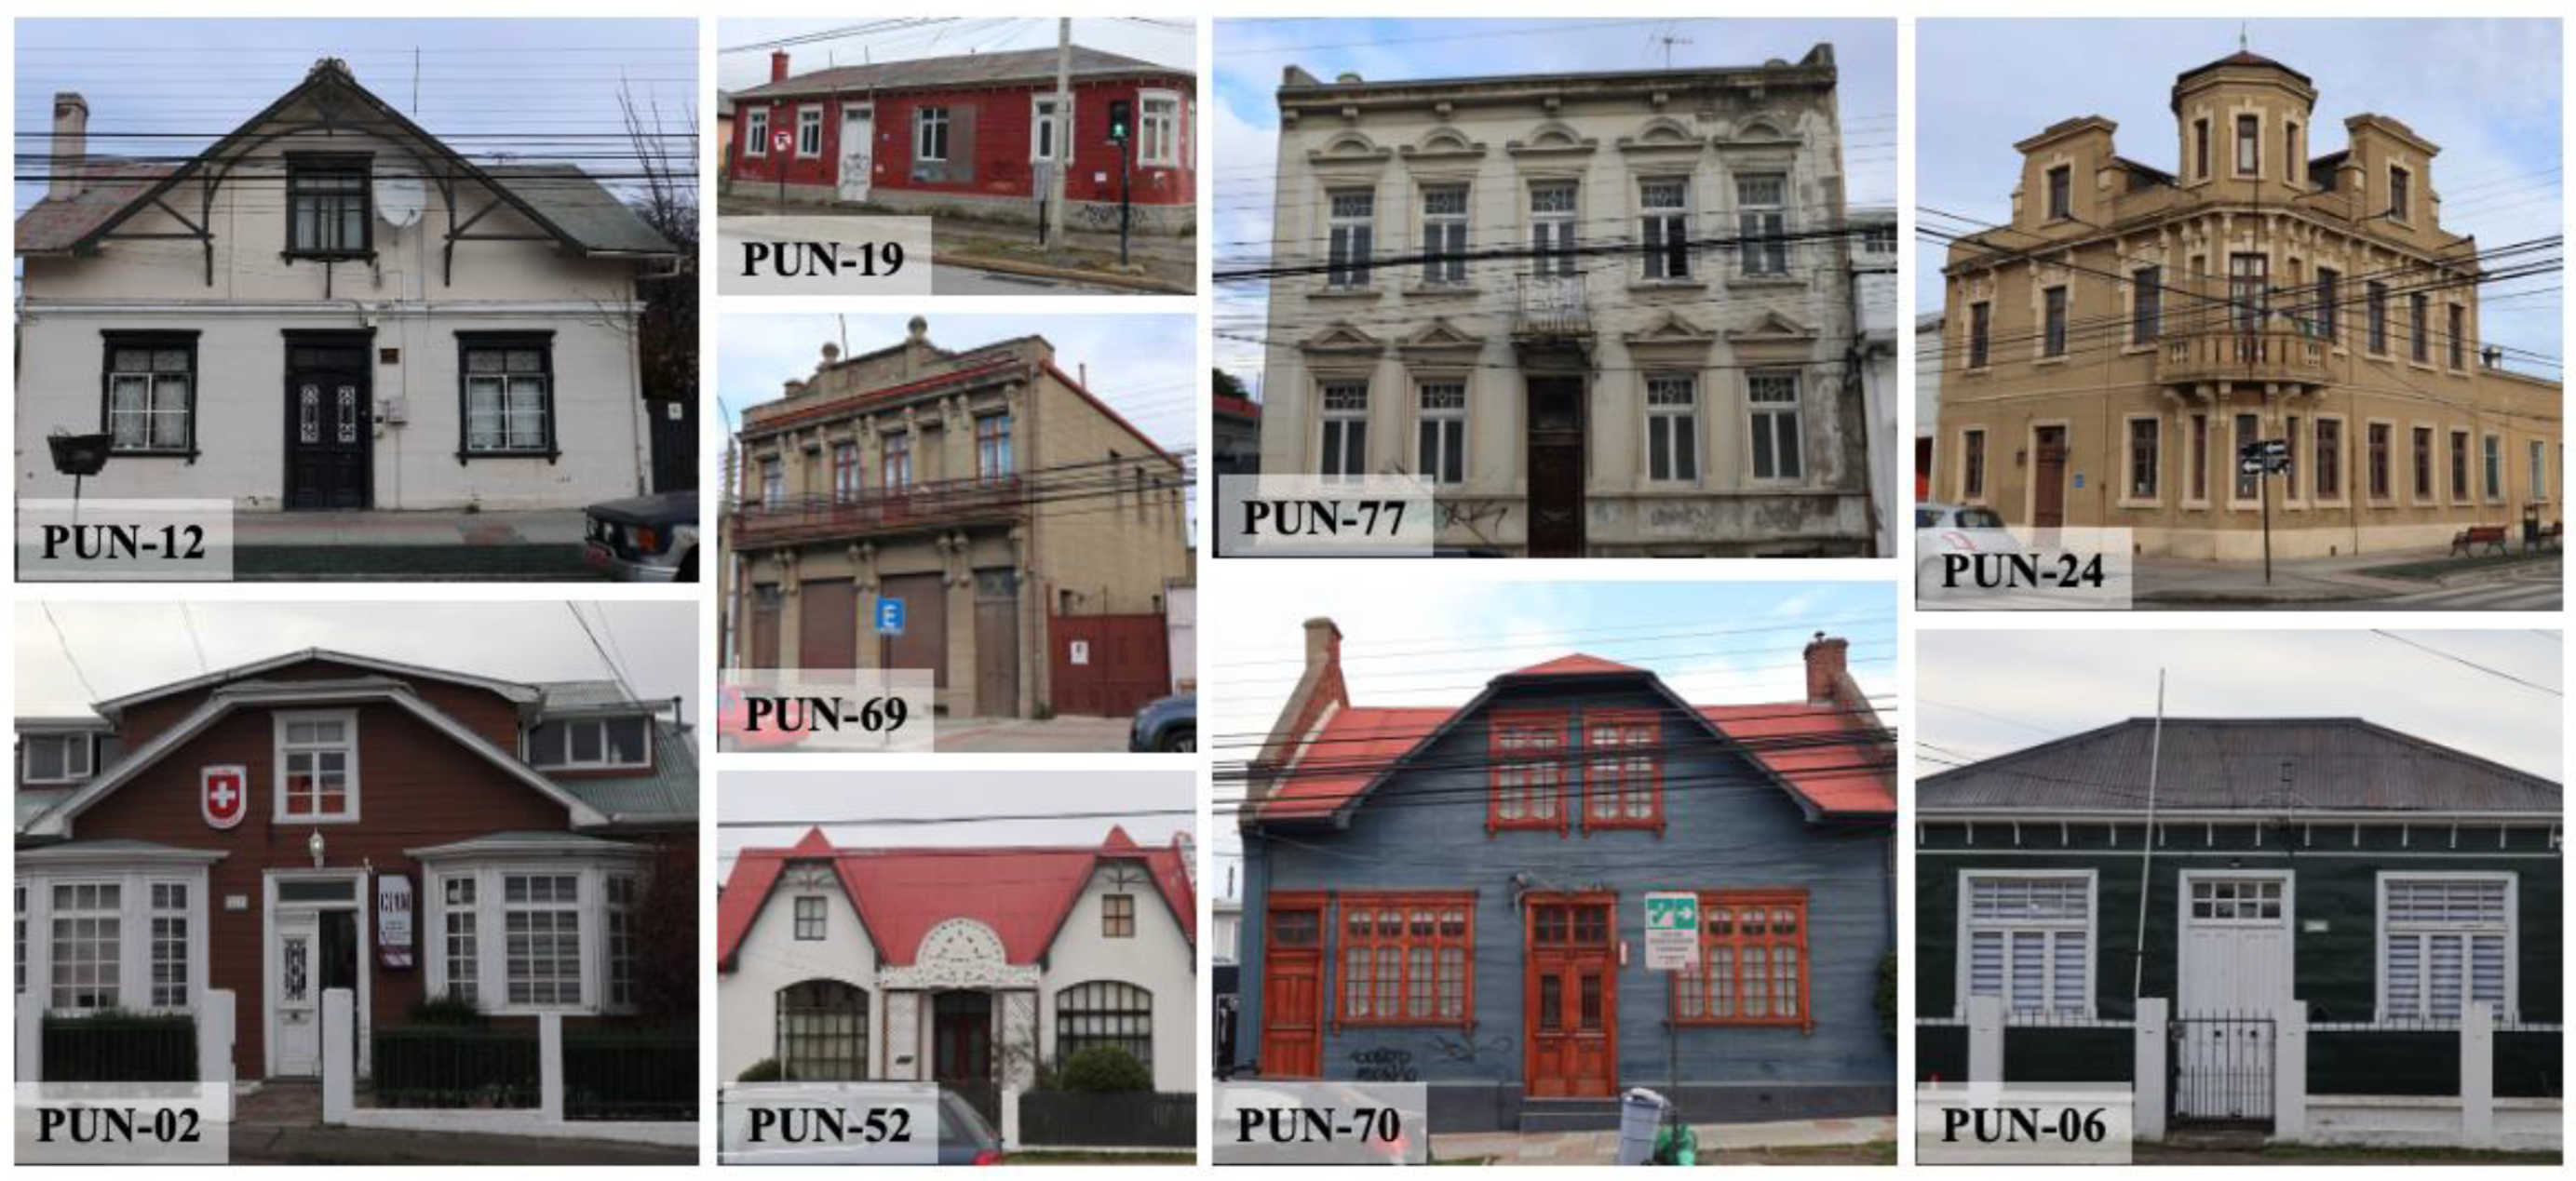
2.2. Case Studies Characterisation
2.3. Digital Fuzzy Logic Model Focused on Functional Service Life Prediction
2.4. Stakeholders and Community Survey
3. Results and Discussion
3.1. FIS Model Application to Heritage Timber Buildings, Under Current Climatic Conditions
3.2. Building Resilience Under Climate Change Conditions and for a Near Future Period (2020–2044)
3.3. Building Resilience Under Climate Change Conditions and for a Distant Future Period (2045–2069)
- Arica: (i) the average annual temperature (°C) will be 21.6 °C, corresponding to 1.0 points in the input variable r13 (temperature); (ii) the average annual precipitation (mm) will be 1.9 mm, corresponding to 1.0 points in the input variable r12 (precipitation) (Figure 6).
4. Conclusions and Future Research Directions
Author Contributions
Funding
Institutional Review Board Statement
Informed Consent Statement
Data Availability Statement
Acknowledgments
Conflicts of Interest
References
- Fatorić, S.; Seekamp, E. Are cultural heritage and resources threatened by climate change? A systematic literature review. Clim. Change 2017, 142, 227–254. [Google Scholar] [CrossRef]
- Sesana, E.; Gagnon, A.S.; Bertolin, C.; Hughes, J. Adapting cultural heritage to climate change risks: Perspectives of cultural heritage experts in Europe. Geosciences 2018, 8, 305. [Google Scholar] [CrossRef]
- Macías-Bernal, J.M.; Calama-Rodríguez, J.M.; Chávez-de Diego, M.J. Modelo de predicción de la vida útil de la edificación patrimonial a partir de la lógica difusa. Inf. Construcción 2014, 66, e006. [Google Scholar] [CrossRef]
- Prieto, A.J.; Verichev, K.; Silva, A. An approach concerning climate change and timber building resilience: Araucanía Region, South Chile. Buildings 2021, 11, 452. [Google Scholar] [CrossRef]
- Barrera-Animas, A.Y.; Delgado, J.M.D. Generating real-world-like labelled synthetic datasets for construction site applications. Autom. Constr. 2023, 151, 104850. [Google Scholar] [CrossRef]
- Olazabal, M.; De Gopegui, M.R. Adaptation planning in large cities is unlikely to be effective. Landsc. Urban Plan. 2021, 206, 103974. [Google Scholar] [CrossRef]
- Sarricolea, P.; Herrera-Ossandon, M.; Meseguer-Ruiz, Ó. Climatic regionalisation of continental Chile. J. Maps 2017, 13, 66–73. [Google Scholar] [CrossRef]
- Verichev, K.; Zamorano, M.; Carpio, M. Effects of climate change on variations in climatic zones and heating energy consumption of residential buildings in the southern Chile. Energy Build. 2020, 215, 109874. [Google Scholar] [CrossRef]
- Haunschild, R.; Bornmann, L.; Marx, W. Climate change research in view of bibliometrics. PLoS ONE 2016, 11, e0160393. [Google Scholar] [CrossRef]
- Bulkeley, H. Cities and Climate Change; Routledge: London, UK, 2013. [Google Scholar]
- Parisi, F.; Augenti, N. Earthquake damages to cultural heritage constructions and simplified assessment of artworks. Eng. Fail. Anal. 2013, 34, 735–760. [Google Scholar] [CrossRef]
- Bonazza, A.; Maxwell, I.; Drdácký, M.; Vintzileou, E.; Hanus, C. Safeguarding Cultural Heritage from Natural and Man-Made Disasters: A Comparative Analysis of Risk Management in the EU; Publications Office of the European Union: Luxembourg, Luxembourg, 2018. [Google Scholar]
- Rezvani, S.M.; Falcão, M.J.; Komljenovic, D.; de Almeida, N.M. A Systematic Literature Review on Urban Resilience Enabled with Asset and Disaster Risk Management Approaches and GIS-Based Decision Support Tools. Appl. Sci. 2023, 13, 2223. [Google Scholar] [CrossRef]
- Allan, R.P.; Arias, P.A.; Berger, S.; Canadell, J.G.; Cassou, C.; Chen, D.; Cherchi, A.; Connors, S.L.; Coppola, E.; Cruz, F.A.; et al. Summary for Policymakers. In Climate Change 2021: The Physical Science Basis. Contribution of Working Group I to the Sixth Assessment Report of the Intergovernmental Panel on Climate Change; Cambridge University Press: Cambridge, UK, 2023; pp. 3–32. [Google Scholar]
- Force, I.C.R.T. Report from the Drafting Team on the Consultation on Paper #6 The Climate Change Adaptation Gap: An Actuarial Perspective. International Change Adaptation Gap. April 2023. Available online: https://actuaries.org/paper/the-climate-change-adaptation-gap-an-actuarial-perspective/ (accessed on 8 March 2025).
- Li, Y.; Du, Y.; Yang, M.; Liang, J.; Bai, H.; Li, R.; Law, A. A review of the tools and techniques used in the digital preservation of architectural heritage within disaster cycles. Herit. Sci. 2023, 11, 199. [Google Scholar] [CrossRef]
- Adegoriola, M.I.; Yung, E.H.; Lai, J.H.; Chan, E.H.; Yevu, S.K. Understanding the influencing factors of heritage building maintenance management: Findings from developed and developing regions. Build. Res. Inf. 2023, 51, 605–624. [Google Scholar] [CrossRef]
- D’Urso, M.G.; Marino, C.L.; Aldrighettoni, J. Degradation of historic masonry by analytical and digital photogrammetry: A quantitative analysis. ISPRS Ann. Photogramm. Remote Sens. Spat. Inf. Sci. 2023, 47–54. [Google Scholar] [CrossRef]
- Almusaed, A.; Yitmen, I.; Almssad, A. Reviewing and integrating AEC practices into Industry 6.0: Strategies for smart and sustainable future-built environments. Sustainability 2023, 15, 13464. [Google Scholar] [CrossRef]
- Cabello-Briones, C.; Prieto, A.J.; Ortiz, P. Determination of the technical suitability of shelters for archaeological sites using fuzzy logic. J. Cult. Herit. 2021, 48, 211–226. [Google Scholar] [CrossRef]
- Thomas, V. Risk and Resilience in the Era of Climate Change; Springer Nature: Cham, Switzerland, 2023. [Google Scholar]
- Maskrey, A.; Jain, G.; Lavell, A. The social construction of systemic risk: Towards an actionable framework for risk governance. Disaster Prev. Manag. Int. J. 2023, 32, 4–26. [Google Scholar] [CrossRef]
- Douglas, J. Building Adaptation; Routledge: London, UK, 2006. [Google Scholar]
- Huovila, P. Buildings and Climate Change: Status, Challenges, and Opportunities; United Nations Environment Programme (UNEP): Nairobi, Kenya, 2007. [Google Scholar]
- Nalau, J.; Verrall, B. Mapping the evolution and current trends in climate change adaptation science. Clim. Risk Manag. 2021, 32, 100290. [Google Scholar] [CrossRef]
- Kottek, M.; Grieser, J.; Beck, C.; Rudolf, B.; Rubel, F. World map of the Köppen-Geiger climate classification updated. Meteorol. Z. 2006, 15, 259–263. [Google Scholar] [CrossRef]
- Cornejo, L.; Martín-Pomares, L.; Alarcon, D.; Blanco, J.; Polo, J. A thorough analysis of solar irradiation measurements in the region of Arica Parinacota, Chile. Renew. Energy 2017, 112, 197–208. [Google Scholar] [CrossRef]
- Schneider, C.; Glaser, M.; Kilian, R.; Santana, A.; Butorovic, N.; Casassa, G. Weather observations across the southern Andes at 53°S. Phys. Geogr. 2003, 24, 97–119. [Google Scholar] [CrossRef]
- CR2–Centre for Climate and Resilience Research (CR2). Available online: https://www.cr2.cl/ (accessed on 8 March 2024).
- IPCC. Climate Change 2013: The Physical Science Basis. Contribution of Working Group I to the Fifth Assessment Report of the Intergovernmental Panel on Climate Change; Cambridge University Press: Cambridge, UK; New York, NY, USA, 2013. [Google Scholar]
- Van Vuuren, D.P.; Stehfest, E.; den Elzen, M.G.; Kram, T.; van Vliet, J.; Deetman, S.; van Ruijven, B. RCP2.6: Exploring the possibility to keep global mean temperature increase below 2°C. Clim. Change 2011, 109, 95–116. [Google Scholar] [CrossRef]
- Taylor, K.E.; Stouffer, R.J.; Meehl, G.A. An overview of CMIP5 and the experiment design. Bull. Am. Meteorol. Soc. 2012, 93, 485–498. [Google Scholar] [CrossRef]
- Prieto, A.J.; Verichev, K.; Silva, A.; de Brito, J. On the impacts of climate change on the functional deterioration of heritage buildings in South Chile. Build. Environ. 2020, 183, 107138. [Google Scholar] [CrossRef]
- Riahi, K.; Krey, V.; Rao, S.; Chirkov, V.; Fischer, G.; Kolp, P.; Rafai, P. RCP-8.5: Exploring the consequence of high emission trajectories. Clim. Change 2011, 109, 33–57. [Google Scholar] [CrossRef]
- Ministerio de Vivienda y Urbanismo (MINVU). Available online: www.minvu.gob.cl (accessed on 26 February 2024).
- Zadeh, L.A. Fuzzy sets. Inf. Control. 1965, 8, 338–353. [Google Scholar] [CrossRef]
- Pedrycz, W.; Gomide, F. Fuzzy Systems Engineering: Toward Human-Centric Computing; John Wiley & Sons: Hoboken, NJ, USA, 2007. [Google Scholar]
- Bozanic, D.; Tešić, D.; Puška, A.; Štilić, A.; Muhsen, Y.R. Ranking challenges, risks and threats using Fuzzy Inference System. Decis. Mak. Appl. Manag. Eng. 2023, 6, 933–947. [Google Scholar] [CrossRef]
- Xfuzzy 3.0, Computer Software; CNM–Centro Nacional de Microelectrónica and IMSE–Instituto de Microelectrónica de Sevilla: Seville, Spain, 2020.
- ISO 31000:2009; Risk Management–Principles and Guidelines. International Organization for Standardization (ISO): Geneva, Switzerland, 2009.
- Madhu, C.; Sudhakar, M.S. Adaptive Bezier Curve-based Membership Function formulation scheme for interpretable edge detection. Appl. Soft Comput. 2023, 133, 109968. [Google Scholar] [CrossRef]
- Li, Y.; Deng, J.M.; Wei, M.Y. Meaning and precision of adaptive fuzzy systems with Gaussian-type membership functions. Fuzzy Sets Syst. 2002, 127, 85–97. [Google Scholar] [CrossRef]
- Lilja, K.K.; Laakso, K.; Palomäki, J. Using the Delphi method. In Proceedings of the PICMET’11: Technology Management in the Energy Smart World (PICMET), Portland, OR, USA, 31 July–4 August 2011; pp. 1–10. [Google Scholar]
- Pokorádi, L.; Koçak, S.; Tóth-Laufer, E. Fuzzy failure modes and effects analysis using summative defuzzification methods. Acta Polytech. Hung. 2021, 18, 111–126. [Google Scholar] [CrossRef]
- Prieto, A.J.; Silva, A.; De Brito, J.; Macias-Bernal, J.M. Serviceability of facade claddings. Build. Res. Inf. 2018, 46, 179–190. [Google Scholar] [CrossRef]
- Henríquez, C.; Qüense, J.; Villarroel, C.; Mallea, C. 50-Years of climate extreme indices trends and inventory of natural disasters in Chilean cities (1965–2015). In Urban Climates in Latin America; Springer: Cham, Switzerland, 2019; pp. 281–308. [Google Scholar]
- Williams, C.J. Climate change in Chile: An analysis of state-of-the-art observations, satellite-derived estimates, and climate model simulations. J. Earth Sci. Clim. Change 2017, 8, 400. [Google Scholar] [CrossRef]
- Prieto, A.J.; Verichev, K.; Carpio, M. Heritage, resilience and climate change: A fuzzy logic application in timber-framed masonry buildings in Valparaíso, Chile. Build. Environ. 2020, 174, 106657. [Google Scholar] [CrossRef]


| Characteristics Analysed | Number of Case Studies | % of Case Studies | |
|---|---|---|---|
| Region | Arica and Parinacota | 57 | 100% |
| Location (city) | Arica | 57 | 100% |
| Year of construction | >1901 | 36 | 63% |
| <1900 | 2 | 4% | |
| Use | Services | 37 | 65% |
| Housing | 20 | 35% | |
| Legal status | Private | 44 | 77% |
| Public | 13 | 23% | |
| Foundations | Concrete | 32 | 56% |
| Timber | 24 | 42% | |
| Adobe | 1 | 2% | |
| Structure | Timber and adobe | 28 | 49% |
| Concrete | 16 | 28% | |
| Masonry | 6 | 11% | |
| Adobe | 5 | 9% | |
| Masonry and steel | 1 | 2% | |
| Steel | 1 | 2% | |
| Cover | Galvanised steel | 48 | 84% |
| Fibre cement | 3 | 5% | |
| Clay tile | 3 | 5% | |
| Concrete | 2 | 4% | |
| Polycarbonate | 1 | 2% | |
| Facade | Rendered | 57 | 100% |
| Characteristics Analysed | Number of Case Studies | % of Case Studies | |
|---|---|---|---|
| Region | Magallanes | 101 | 100% |
| Location (city) | Punta Arenas | 101 | 100% |
| Year of construction | <1900 | 101 | 100% |
| Use | Services | 74 | 73% |
| Housing | 27 | 27% | |
| Legal status | Private | 84 | 83% |
| Public | 17 | 17% | |
| Foundations | Concrete | 101 | 100% |
| Structure | Masonry | 76 | 75% |
| Timber | 22 | 22% | |
| Timber-framed masonry | 3 | 3% | |
| Cover | Galvanised steel | 101 | 100% |
| Facade | Rendered | 78 | 77% |
| Galvanised steel | 17 | 17% | |
| Timber | 3 | 3% | |
| Rendered and galvanised steel | 2 | 2% | |
| Brick | 1 | 1% |
| Vulnerability and External Risk | Parameters | Ranges | Qualitative Valuation |
|---|---|---|---|
| Vulnerability parameters | Geological location (v1) | (1–4) | Constant value in Chile: 3.9 and 4.0 (*) |
| Roof design (v2) | (1–8) | 1—Fast evacuation of water 8—Complex and slow evacuation of water | |
| Environmental conditions (v3) | (1–8) | 1—Building without complex constructions around it 8—Building located inside the complex constructions around it | |
| Constructive system (v4) | (1–8) | 1—Uniform characteristics of constructive system 8—Heterogeneous characteristics of constructive system | |
| Conservation (v5) | (1–8) | 1—Optimal state of conservation 8—Neglected state of conservation | |
| Static-Structural parameters | Load state modification (r6) | (1–8) | 1—Apparent modification 8—Disorderly modification |
| Live loads (r7) | (1–8) | 1—Live load lower than the original level 8—Live load higher than the original level | |
| Ventilation (r8) | (1–8) | 1—Natural cross-ventilation in all areas 8—No natural cross-ventilation | |
| Facilities (r9) | (1–8) | 1—All facilities are in use 8—Facilities cannot be used | |
| Fire (r10) | (1–8) | 1—Low fire load in relation to the combustible structure 8—High fire load in relation to the combustible structure | |
| Inner environment (r11) | (1–8) | 1—Maximum level of health. Cleanliness and hygiene of the building’s spaces 8—Low level of health. Cleanliness and hygiene of the building’s spaces | |
| Atmospheric parameters | Precipitation (r12) | (1–8) | 1—Area with low/medium/maximum annual rainfall 8—Area with maximum annual rainfall |
| Temperature (r13) | (1–8) | 1—Area with low temperature differences 8—Area with maximum temperature differences | |
| Anthropic parameters | Population growth (r14) | (1–8) | 1—Population growth greater than 15% 8—Population growth less than 5% |
| Heritage value (r15) | (1–8) | 1—Properties with great historical value 8—Properties with low historical value | |
| Furniture value (r16) | (1–8) | 1—Social, cultural and liturgical appreciation (high value) 8—Social, cultural and liturgical appreciation (low value) | |
| Occupancy (r17) | (1–8) | 1—High occupancy in the building 8—Low occupancy in the building |
| Range | Conditions | Description |
|---|---|---|
| [72–30] | A | The vulnerabilities and risks are regarded as so small that they do not require any kind of intervention. (The maximum value (72.0 points) was achieved ranking all the variables as 1.0 point (the best possible), with the exception of v1 = 1.0; r11 = 2.5; r12 = 1.0; r13 = 1.0; r14 = 3.0). |
| [30–20] | B | The vulnerabilities and risks are regarded as medium, where costs and benefits are considered and balanced. |
| [20–9] | C | The vulnerabilities and risks are regarded as significantly dangerous to the structures; building inspection and possible intervention in the short term is recommended. |
| Range | Conditions | Description |
|---|---|---|
| [53–30] | A | The vulnerabilities and risks are regarded as so small that they do not require any kind of intervention. (The maximum value (53.0 points) was achieved ranking all the variables as 1.0 point (the best possible), with the exception of v1 = 1.0; r11 = 5.0; r12 = 6.0; r13 = 5.0; r14 = 4.0). |
| [30–20] | B | The vulnerabilities and risks are regarded as medium, where costs and benefits are considered and balanced. |
| [20–9] | C | The vulnerabilities and risks are regarded as significantly dangerous to the structures; building inspection and possible intervention in the short term is recommended. |
| Ids | Location | v1 | v2 | v3 | v4 | v5 | r6 | r7 | r8 | r9 | r10 | r11 | r12 | r13 | r14 | r15 | r16 | r17 | FBSL2.0 | Condition |
|---|---|---|---|---|---|---|---|---|---|---|---|---|---|---|---|---|---|---|---|---|
| ARI-27 | Arica | 4.0 | 7.5 | 7.0 | 7.0 | 8.0 | 5.0 | 7.0 | 8.0 | 8.0 | 8.0 | 2.5 | 1.0 | 1.0 | 3.0 | 1.0 | 8.0 | 8.0 | 19.38 | C |
| ARI-19 | Arica | 4.0 | 8.0 | 8.0 | 8.0 | 8.0 | 8.0 | 7.0 | 8.0 | 8.0 | 5.0 | 2.5 | 1.0 | 1.0 | 3.0 | 1.0 | 8.0 | 8.0 | 19.40 | C |
| ARI-28 | Arica | 4.0 | 5.4 | 4.5 | 3.2 | 6.2 | 4.5 | 4.0 | 5.2 | 4.5 | 3.5 | 2.5 | 1.0 | 1.0 | 3.0 | 1.0 | 6.0 | 5.5 | 22.84 | B |
| ARI-52 | Arica | 4.0 | 5.7 | 7.2 | 2.8 | 8.0 | 2.4 | 6.0 | 8.0 | 8.0 | 4.7 | 2.5 | 1.0 | 1.0 | 3.0 | 1.0 | 8.0 | 8.0 | 23.56 | B |
| ARI-50 | Arica | 4.0 | 5.6 | 7.0 | 3.0 | 7.2 | 3.5 | 5.0 | 7.0 | 7.0 | 4.7 | 2.5 | 1.0 | 1.0 | 3.0 | 1.0 | 7.0 | 7.0 | 24.40 | B |
| ARI-43 | Arica | 4.0 | 5.5 | 5.5 | 4.0 | 6.8 | 4.2 | 3.4 | 5.5 | 5.0 | 3.0 | 2.5 | 1.0 | 1.0 | 3.0 | 1.0 | 6.0 | 6.0 | 24.90 | B |
| ARI-35 | Arica | 4.0 | 5.6 | 5.4 | 2.5 | 5.6 | 3.5 | 4.0 | 5.3 | 4.2 | 2.5 | 2.5 | 1.0 | 1.0 | 3.0 | 1.0 | 5.5 | 5.0 | 26.30 | B |
| ARI-39 | Arica | 4.0 | 5.4 | 6.5 | 3.0 | 7.2 | 5.0 | 5.3 | 5.6 | 5.5 | 4.0 | 2.5 | 1.0 | 1.0 | 3.0 | 1.0 | 6.0 | 5.0 | 26.62 | B |
| ARI-38 | Arica | 4.0 | 5.4 | 7.2 | 2.0 | 7.4 | 5.0 | 5.4 | 7.0 | 6.6 | 5.0 | 2.5 | 1.0 | 1.0 | 3.0 | 1.0 | 6.5 | 6.0 | 26.64 | B |
| ARI-29 | Arica | 4.0 | 5.2 | 6.7 | 3.4 | 6.0 | 4.5 | 4.5 | 5.0 | 4.5 | 3.7 | 2.5 | 1.0 | 1.0 | 3.0 | 1.0 | 5.5 | 4.5 | 26.74 | B |
| ARI-44 | Arica | 4.0 | 5.5 | 5.2 | 3.3 | 6.8 | 4.0 | 5.5 | 5.5 | 5.5 | 2.4 | 2.5 | 1.0 | 1.0 | 3.0 | 1.0 | 6.0 | 4.0 | 26.97 | B |
| ARI-36 | Arica | 4.0 | 5.5 | 7.0 | 2.8 | 6.4 | 5.2 | 5.8 | 5.5 | 4.5 | 4.8 | 2.5 | 1.0 | 1.0 | 3.0 | 1.0 | 5.0 | 4.0 | 28.17 | B |
| ARI-22 | Arica | 4.0 | 5.0 | 7.0 | 3.2 | 6.2 | 5.0 | 5.5 | 5.0 | 4.5 | 4.5 | 2.5 | 1.0 | 1.0 | 3.0 | 1.0 | 5.5 | 4.0 | 28.78 | B |
| ARI-37 | Arica | 4.0 | 5.7 | 7.0 | 2.2 | 6.7 | 4.7 | 5.0 | 5.5 | 4.5 | 4.8 | 2.5 | 1.0 | 1.0 | 3.0 | 1.0 | 5.0 | 4.5 | 28.79 | B |
| ARI-45 | Arica | 4.0 | 5.5 | 6.0 | 3.3 | 5.6 | 4.0 | 4.5 | 5.0 | 4.0 | 3.2 | 2.5 | 1.0 | 1.0 | 3.0 | 1.0 | 5.0 | 5.0 | 29.13 | B |
| ARI-33 | Arica | 4.0 | 5.2 | 6.7 | 3.3 | 6.3 | 4.0 | 4.0 | 5.0 | 4.0 | 3.8 | 2.5 | 1.0 | 1.0 | 3.0 | 1.0 | 5.0 | 3.5 | 29.42 | B |
| ARI-51 | Arica | 4.0 | 7.2 | 4.5 | 2.7 | 4.0 | 3.6 | 4.0 | 4.5 | 4.0 | 3.0 | 2.5 | 1.0 | 1.0 | 3.0 | 1.0 | 4.5 | 4.0 | 30.81 | A |
| ARI-40 | Arica | 4.0 | 5.6 | 5.4 | 3.5 | 5.0 | 4.0 | 5.5 | 5.3 | 3.5 | 3.0 | 2.5 | 1.0 | 1.0 | 3.0 | 1.0 | 5.4 | 4.0 | 31.07 | A |
| ARI-47 | Arica | 4.0 | 5.6 | 7.2 | 3.0 | 5.6 | 4.0 | 5.0 | 5.0 | 4.0 | 4.5 | 2.5 | 1.0 | 1.0 | 3.0 | 1.0 | 5.0 | 4.0 | 31.21 | A |
| ARI-30 | Arica | 4.0 | 5.0 | 7.0 | 2.4 | 6.6 | 4.0 | 4.5 | 6.0 | 5.4 | 4.8 | 2.5 | 1.0 | 1.0 | 3.0 | 1.0 | 6.5 | 5.0 | 31.89 | A |
| ARI-49 | Arica | 4.0 | 5.3 | 6.6 | 3.0 | 5.5 | 3.7 | 4.0 | 5.4 | 5.0 | 4.0 | 2.5 | 1.0 | 1.0 | 3.0 | 1.0 | 6.0 | 6.0 | 33.52 | A |
| ARI-24 | Arica | 4.0 | 5.4 | 6.6 | 3.2 | 5.7 | 4.0 | 5.3 | 5.4 | 4.0 | 4.0 | 2.5 | 1.0 | 1.0 | 3.0 | 1.0 | 4.5 | 3.5 | 33.53 | A |
| ARI-31 | Arica | 4.0 | 5.4 | 7.0 | 3.2 | 6.0 | 4.0 | 4.0 | 5.5 | 5.0 | 4.0 | 2.5 | 1.0 | 1.0 | 3.0 | 1.0 | 5.0 | 4.5 | 34.01 | A |
| ARI-16 | Arica | 4.0 | 7.2 | 5.5 | 4.5 | 5.7 | 3.5 | 4.0 | 5.0 | 4.5 | 3.2 | 2.5 | 1.0 | 1.0 | 3.0 | 1.0 | 4.5 | 3.5 | 35.36 | A |
| ARI-26 | Arica | 4.0 | 5.0 | 6.5 | 3.0 | 5.8 | 4.5 | 5.0 | 4.5 | 4.5 | 4.2 | 2.5 | 1.0 | 1.0 | 3.0 | 1.0 | 5.0 | 4.5 | 35.42 | A |
| ARI-23 | Arica | 4.0 | 5.0 | 7.0 | 2.5 | 5.8 | 4.6 | 5.0 | 5.0 | 4.2 | 4.5 | 2.5 | 1.0 | 1.0 | 3.0 | 1.0 | 4.8 | 3.5 | 35.97 | A |
| ARI-41 | Arica | 4.0 | 5.3 | 6.6 | 1.6 | 4.8 | 3.0 | 3.5 | 5.0 | 4.0 | 4.0 | 2.5 | 1.0 | 1.0 | 3.0 | 1.0 | 5.5 | 5.5 | 36.77 | A |
| ARI-55 | Arica | 4.0 | 6.2 | 5.6 | 2.5 | 7.5 | 2.5 | 2.4 | 3.0 | 6.0 | 3.0 | 2.5 | 1.0 | 1.0 | 3.0 | 1.0 | 4.0 | 4.5 | 37.89 | A |
| ARI-11 | Arica | 4.0 | 6.0 | 6.0 | 5.0 | 5.0 | 4.0 | 3.5 | 3.5 | 3.5 | 3.5 | 2.5 | 1.0 | 1.0 | 3.0 | 1.0 | 3.4 | 2.5 | 38.13 | A |
| ARI-07 | Arica | 4.0 | 7.0 | 6.5 | 5.0 | 5.0 | 2.0 | 3.5 | 4.0 | 3.5 | 3.5 | 2.5 | 1.0 | 1.0 | 3.0 | 1.0 | 3.5 | 3.4 | 39.49 | A |
| ARI-56 | Arica | 4.0 | 7.5 | 4.6 | 6.4 | 5.4 | 4.5 | 4.0 | 4.0 | 4.0 | 3.3 | 2.5 | 1.0 | 1.0 | 3.0 | 1.0 | 3.6 | 1.2 | 39.61 | A |
| ARI-13 | Arica | 4.0 | 6.0 | 6.5 | 3.0 | 5.6 | 4.0 | 3.5 | 5.5 | 4.0 | 3.6 | 2.5 | 1.0 | 1.0 | 3.0 | 1.0 | 5.0 | 2.0 | 39.65 | A |
| ARI-53 | Arica | 4.0 | 6.0 | 6.2 | 3.4 | 5.4 | 4.0 | 5.3 | 4.0 | 3.0 | 3.2 | 2.5 | 1.0 | 1.0 | 3.0 | 1.0 | 2.6 | 2.4 | 39.69 | A |
| ARI-34 | Arica | 4.0 | 5.5 | 7.0 | 2.9 | 5.3 | 3.0 | 3.0 | 4.5 | 4.0 | 4.0 | 2.5 | 1.0 | 1.0 | 3.0 | 1.0 | 4.0 | 3.0 | 39.70 | A |
| ARI-10 | Arica | 4.0 | 7.3 | 3.5 | 2.2 | 4.5 | 2.8 | 3.0 | 4.0 | 3.5 | 3.0 | 2.5 | 1.0 | 1.0 | 3.0 | 1.0 | 3.0 | 3.0 | 39.78 | A |
| ARI-09 | Arica | 4.0 | 6.2 | 6.5 | 2.6 | 5.2 | 3.0 | 3.5 | 3.2 | 3.0 | 4.0 | 2.5 | 1.0 | 1.0 | 3.0 | 1.0 | 3.0 | 3.0 | 39.95 | A |
| ARI-54 | Arica | 4.0 | 6.4 | 4.0 | 2.6 | 5.0 | 3.6 | 3.4 | 3.5 | 3.0 | 3.0 | 2.5 | 1.0 | 1.0 | 3.0 | 1.0 | 3.5 | 2.0 | 39.97 | A |
| ARI-42 | Arica | 4.0 | 5.4 | 6.6 | 3.0 | 5.5 | 3.6 | 4.0 | 5.5 | 5.0 | 4.0 | 2.5 | 1.0 | 1.0 | 3.0 | 1.0 | 5.0 | 5.0 | 39.99 | A |
| ARI-57 | Arica | 4.0 | 6.5 | 5.2 | 4.0 | 4.6 | 4.0 | 4.0 | 3.0 | 2.5 | 3.0 | 2.5 | 1.0 | 1.0 | 3.0 | 1.0 | 3.5 | 2.0 | 40.12 | A |
| ARI-58 | Arica | 4.0 | 6.5 | 4.0 | 2.0 | 4.5 | 4.0 | 4.4 | 3.0 | 3.0 | 2.7 | 2.5 | 1.0 | 1.0 | 3.0 | 1.0 | 3.5 | 2.0 | 40.61 | A |
| ARI-05 | Arica | 4.0 | 6.5 | 7.0 | 3.5 | 5.4 | 3.2 | 3.5 | 4.0 | 3.0 | 4.0 | 2.5 | 1.0 | 1.0 | 3.0 | 1.0 | 3.0 | 2.0 | 40.77 | A |
| ARI-21 | Arica | 4.0 | 5.0 | 3.5 | 3.0 | 6.0 | 4.8 | 5.5 | 4.0 | 3.5 | 2.5 | 2.5 | 1.0 | 1.0 | 3.0 | 1.0 | 4.0 | 2.5 | 40.87 | A |
| ARI-06 | Arica | 4.0 | 6.5 | 7.0 | 4.0 | 4.5 | 3.0 | 3.5 | 3.5 | 3.0 | 4.0 | 2.5 | 1.0 | 1.0 | 3.0 | 1.0 | 3.0 | 2.0 | 40.92 | A |
| ARI-04 | Arica | 4.0 | 7.0 | 7.0 | 4.0 | 5.0 | 4.0 | 4.0 | 3.5 | 2.0 | 4.0 | 2.5 | 1.0 | 1.0 | 3.0 | 1.0 | 1.0 | 1.0 | 41.46 | A |
| ARI-12 | Arica | 4.0 | 5.4 | 2.7 | 5.0 | 5.5 | 4.0 | 4.0 | 5.5 | 4.3 | 3.0 | 2.5 | 1.0 | 1.0 | 3.0 | 1.0 | 5.0 | 2.0 | 41.55 | A |
| ARI-32 | Arica | 4.0 | 5.2 | 7.0 | 3.3 | 5.5 | 3.8 | 3.0 | 3.5 | 3.0 | 5.0 | 2.5 | 1.0 | 1.0 | 3.0 | 1.0 | 2.5 | 2.3 | 41.82 | A |
| ARI-03 | Arica | 4.0 | 2.5 | 5.6 | 3.0 | 5.5 | 4.0 | 3.0 | 4.0 | 3.5 | 4.2 | 2.5 | 1.0 | 1.0 | 3.0 | 1.0 | 4.0 | 4.0 | 41.99 | A |
| ARI-46 | Arica | 4.0 | 5.4 | 5.2 | 3.0 | 5.2 | 3.5 | 5.0 | 4.0 | 3.5 | 3.2 | 2.5 | 1.0 | 1.0 | 3.0 | 1.0 | 3.5 | 3.0 | 42.10 | A |
| ARI-18 | Arica | 4.0 | 3.6 | 6.5 | 3.2 | 5.4 | 3.5 | 3.0 | 5.0 | 4.3 | 4.5 | 2.5 | 1.0 | 1.0 | 3.0 | 1.0 | 5.0 | 4.0 | 42.51 | A |
| ARI-20 | Arica | 4.0 | 5.5 | 6.5 | 3.5 | 5.5 | 4.0 | 3.5 | 4.5 | 3.5 | 4.5 | 2.5 | 1.0 | 1.0 | 3.0 | 1.0 | 4.5 | 2.5 | 42.57 | A |
| ARI-01 | Arica | 4.0 | 5.0 | 5.5 | 2.4 | 5.0 | 3.0 | 3.5 | 4.0 | 3.0 | 4.0 | 2.5 | 1.0 | 1.0 | 3.0 | 1.0 | 3.0 | 3.5 | 42.61 | A |
| ARI-15 | Arica | 4.0 | 6.5 | 7.0 | 3.0 | 5.0 | 4.5 | 4.0 | 2.5 | 1.5 | 3.7 | 2.5 | 1.0 | 1.0 | 3.0 | 1.0 | 2.0 | 1.0 | 42.87 | A |
| ARI-17 | Arica | 4.0 | 3.2 | 6.5 | 3.6 | 5.7 | 3.5 | 3.0 | 5.2 | 4.3 | 4.5 | 2.5 | 1.0 | 1.0 | 3.0 | 1.0 | 5.0 | 4.0 | 42.94 | A |
| ARI-02 | Arica | 4.0 | 4.5 | 5.0 | 3.0 | 5.2 | 3.5 | 4.0 | 4.0 | 3.0 | 3.7 | 2.5 | 1.0 | 1.0 | 3.0 | 1.0 | 3.0 | 3.5 | 43.59 | A |
| ARI-61 | Arica | 4.0 | 6.5 | 2.0 | 2.4 | 3.5 | 2.6 | 3.0 | 3.5 | 3.4 | 2.7 | 2.5 | 1.0 | 1.0 | 3.0 | 1.0 | 3.0 | 2.4 | 44.70 | A |
| ARI-14 | Arica | 4.0 | 5.0 | 2.4 | 2.4 | 5.0 | 3.0 | 3.5 | 3.0 | 2.5 | 2.8 | 2.5 | 1.0 | 1.0 | 3.0 | 1.0 | 2.5 | 2.4 | 44.84 | A |
| ARI-08 | Arica | 4.0 | 4.0 | 6.8 | 4.2 | 6.2 | 5.0 | 5.4 | 4.0 | 4.0 | 4.2 | 2.5 | 1.0 | 1.0 | 3.0 | 1.0 | 3.5 | 1.5 | 44.85 | A |
| Ids | Location | v1 | v2 | v3 | v4 | v5 | r6 | r7 | r8 | r9 | r10 | r11 | r12 | r13 | r14 | r15 | r16 | r17 | FBSL2.0 | Condition |
|---|---|---|---|---|---|---|---|---|---|---|---|---|---|---|---|---|---|---|---|---|
| PUN-31 | Pta. Arenas | 4.0 | 8.0 | 8.0 | 8.0 | 8.0 | 8.0 | 8.0 | 8.0 | 8.0 | 8.0 | 5.0 | 6.0 | 5.0 | 4.0 | 5.0 | 8.0 | 8.0 | 15.69 | C |
| PUN-100 | Pta. Arenas | 4.0 | 4.5 | 4.0 | 1.5 | 8.0 | 3.0 | 5.0 | 8.0 | 8.0 | 3.5 | 5.0 | 6.0 | 5.0 | 4.0 | 1.0 | 8.0 | 8.0 | 18.05 | C |
| PUN-70 | Pta. Arenas | 4.0 | 3.2 | 6.5 | 2.3 | 8.0 | 4.0 | 6.0 | 7.5 | 7.5 | 4.0 | 5.0 | 6.0 | 5.0 | 4.0 | 1.0 | 7.0 | 8.0 | 18.90 | C |
| PUN-13 | Pta. Arenas | 4.0 | 4.2 | 6.5 | 3.8 | 5.6 | 2.0 | 2.5 | 4.5 | 3.5 | 6.5 | 5.0 | 6.0 | 5.0 | 4.0 | 1.0 | 5.0 | 5.5 | 19.23 | C |
| PUN-102 | Pta. Arenas | 4.0 | 5.0 | 7.2 | 3.0 | 5.8 | 3.0 | 3.5 | 5.4 | 4.0 | 7.0 | 5.0 | 6.0 | 5.0 | 4.0 | 1.0 | 5.0 | 5.2 | 19.38 | C |
| PUN-55 | Pta. Arenas | 4.0 | 4.0 | 5.0 | 2.2 | 6.4 | 4.0 | 4.0 | 5.2 | 4.8 | 5.0 | 5.0 | 6.0 | 5.0 | 4.0 | 1.0 | 6.0 | 6.2 | 19.64 | C |
| PUN-110 | Pta. Arenas | 4.0 | 5.2 | 4.3 | 2.8 | 5.5 | 2.5 | 3.6 | 5.0 | 4.0 | 3.8 | 5.0 | 6.0 | 5.0 | 4.0 | 1.0 | 5.5 | 5.5 | 20.20 | B |
| PUN-66 | Pta. Arenas | 4.0 | 2.4 | 4.2 | 2.8 | 6.3 | 4.0 | 4.0 | 5.5 | 4.0 | 5.4 | 5.0 | 6.0 | 5.0 | 4.0 | 1.0 | 6.5 | 6.0 | 20.52 | B |
| PUN-54 | Pta. Arenas | 4.0 | 3.5 | 4.5 | 3.2 | 5.4 | 4.2 | 5.0 | 4.0 | 3.0 | 6.0 | 5.0 | 6.0 | 5.0 | 4.0 | 1.0 | 2.5 | 3.0 | 20.95 | B |
| PUN-99 | Pta. Arenas | 4.0 | 2.0 | 6.5 | 3.3 | 5.3 | 4.0 | 5.4 | 5.3 | 4.0 | 5.0 | 5.0 | 6.0 | 5.0 | 4.0 | 1.0 | 5.5 | 3.5 | 20.99 | B |
| PUN-103 | Pta. Arenas | 4.0 | 2.5 | 5.2 | 2.8 | 5.6 | 3.5 | 2.5 | 5.0 | 3.8 | 4.4 | 5.0 | 6.0 | 5.0 | 4.0 | 1.0 | 5.0 | 5.5 | 21.08 | B |
| PUN-42 | Pta. Arenas | 4.0 | 3.0 | 5.2 | 2.0 | 6.0 | 4.0 | 5.0 | 5.2 | 4.4 | 4.5 | 5.0 | 6.0 | 5.0 | 4.0 | 1.0 | 5.5 | 4.0 | 21.40 | B |
| PUN-78 | Pta. Arenas | 4.0 | 4.0 | 5.2 | 2.4 | 5.0 | 3.0 | 3.6 | 4.0 | 4.0 | 5.2 | 5.0 | 6.0 | 5.0 | 4.0 | 1.0 | 6.0 | 5.0 | 21.87 | B |
| PUN-18 | Pta. Arenas | 4.0 | 7.0 | 5.0 | 2.6 | 5.3 | 3.5 | 4.0 | 5.5 | 4.0 | 3.8 | 5.0 | 6.0 | 5.0 | 4.0 | 1.0 | 4.5 | 3.0 | 22.01 | B |
| PUN-14 | Pta. Arenas | 4.0 | 2.2 | 7.4 | 2.2 | 6.6 | 5.2 | 5.4 | 4.0 | 4.0 | 5.0 | 5.0 | 6.0 | 5.0 | 4.0 | 1.0 | 4.5 | 5.0 | 22.05 | B |
| PUN-15 | Pta. Arenas | 4.0 | 2.2 | 4.5 | 2.6 | 5.2 | 3.5 | 3.5 | 5.4 | 4.0 | 6.0 | 5.0 | 6.0 | 5.0 | 4.0 | 1.0 | 6.0 | 5.5 | 22.07 | B |
| PUN-60 | Pta. Arenas | 4.0 | 3.0 | 4.8 | 2.2 | 6.7 | 3.0 | 4.0 | 5.2 | 4.2 | 4.4 | 5.0 | 6.0 | 5.0 | 4.0 | 1.0 | 5.8 | 5.6 | 22.29 | B |
| PUN-72 | Pta. Arenas | 4.0 | 3.0 | 7.2 | 2.2 | 6.8 | 4.0 | 5.0 | 5.0 | 4.4 | 5.0 | 5.0 | 6.0 | 5.0 | 4.0 | 1.0 | 5.0 | 5.0 | 22.33 | B |
| PUN-86 | Pta. Arenas | 4.0 | 4.4 | 4.8 | 2.0 | 5.8 | 3.0 | 4.0 | 5.2 | 4.0 | 5.0 | 5.0 | 6.0 | 5.0 | 4.0 | 1.0 | 5.0 | 5.0 | 22.34 | B |
| PUN-75 | Pta. Arenas | 4.0 | 3.0 | 4.4 | 3.2 | 5.7 | 4.0 | 5.2 | 5.0 | 4.0 | 5.6 | 5.0 | 6.0 | 5.0 | 4.0 | 1.0 | 5.0 | 4.5 | 22.43 | B |
| PUN-73 | Pta. Arenas | 4.0 | 2.2 | 7.4 | 2.2 | 6.4 | 5.0 | 5.5 | 3.5 | 3.5 | 5.0 | 5.0 | 6.0 | 5.0 | 4.0 | 1.0 | 4.5 | 4.0 | 22.47 | B |
| PUN-57 | Pta. Arenas | 4.0 | 3.0 | 5.0 | 3.0 | 6.0 | 3.0 | 3.5 | 4.8 | 4.0 | 4.5 | 5.0 | 6.0 | 5.0 | 4.0 | 1.0 | 6.0 | 5.5 | 22.53 | B |
| PUN-94 | Pta. Arenas | 4.0 | 3.0 | 7.0 | 2.4 | 6.5 | 4.0 | 5.5 | 5.5 | 4.0 | 4.5 | 5.0 | 6.0 | 5.0 | 4.0 | 1.0 | 4.0 | 3.5 | 22.53 | B |
| PUN-64 | Pta. Arenas | 4.0 | 4.0 | 5.0 | 3.0 | 5.0 | 3.0 | 4.0 | 4.0 | 3.5 | 6.2 | 5.0 | 6.0 | 5.0 | 4.0 | 1.0 | 4.0 | 4.0 | 22.74 | B |
| PUN-41 | Pta. Arenas | 4.0 | 4.0 | 6.0 | 3.5 | 5.5 | 2.5 | 3.5 | 5.0 | 4.0 | 4.5 | 5.0 | 6.0 | 5.0 | 4.0 | 1.0 | 5.0 | 5.0 | 22.77 | B |
| PUN-44 | Pta. Arenas | 4.0 | 3.8 | 4.6 | 4.5 | 4.4 | 3.5 | 4.0 | 5.0 | 4.0 | 5.0 | 5.0 | 6.0 | 5.0 | 4.0 | 1.0 | 5.5 | 5.5 | 22.89 | B |
| PUN-62 | Pta. Arenas | 4.0 | 4.0 | 6.0 | 2.2 | 4.6 | 3.5 | 3.5 | 5.0 | 4.0 | 4.2 | 5.0 | 6.0 | 5.0 | 4.0 | 1.0 | 5.5 | 5.0 | 22.97 | B |
| PUN-115 | Pta. Arenas | 4.0 | 3.2 | 7.0 | 2.4 | 5.0 | 3.0 | 3.0 | 4.5 | 3.0 | 5.0 | 5.0 | 6.0 | 5.0 | 4.0 | 1.0 | 5.5 | 5.5 | 23.09 | B |
| PUN-77 | Pta. Arenas | 4.0 | 3.0 | 7.2 | 2.2 | 5.4 | 4.2 | 5.5 | 5.0 | 4.0 | 5.0 | 5.0 | 6.0 | 5.0 | 4.0 | 1.0 | 3.5 | 2.5 | 23.34 | B |
| PUN-45 | Pta. Arenas | 4.0 | 2.8 | 5.0 | 2.2 | 6.0 | 3.5 | 3.5 | 5.0 | 4.0 | 4.2 | 5.0 | 6.0 | 5.0 | 4.0 | 1.0 | 5.0 | 5.0 | 23.41 | B |
| PUN-105 | Pta. Arenas | 4.0 | 3.0 | 5.0 | 2.2 | 5.2 | 4.0 | 5.0 | 5.0 | 2.5 | 5.0 | 5.0 | 6.0 | 5.0 | 4.0 | 1.0 | 5.0 | 3.2 | 23.45 | B |
| PUN-91 | Pta. Arenas | 4.0 | 4.3 | 4.6 | 2.6 | 6.3 | 4.5 | 4.0 | 5.0 | 4.0 | 4.8 | 5.0 | 6.0 | 5.0 | 4.0 | 1.0 | 3.2 | 2.2 | 23.48 | B |
| PUN-12 | Pta. Arenas | 4.0 | 6.0 | 5.2 | 3.2 | 5.0 | 3.2 | 3.0 | 4.0 | 3.0 | 5.5 | 5.0 | 6.0 | 5.0 | 4.0 | 1.0 | 5.5 | 3.5 | 23.67 | B |
| PUN-90 | Pta. Arenas | 4.0 | 3.2 | 7.4 | 2.3 | 4.8 | 4.0 | 4.2 | 4.5 | 3.5 | 5.0 | 5.0 | 6.0 | 5.0 | 4.0 | 1.0 | 4.0 | 2.8 | 23.67 | B |
| PUN-47 | Pta. Arenas | 4.0 | 3.2 | 4.0 | 3.2 | 4.8 | 3.5 | 5.0 | 3.5 | 3.0 | 6.0 | 5.0 | 6.0 | 5.0 | 4.0 | 1.0 | 5.0 | 3.0 | 23.70 | B |
| PUN-82 | Pta. Arenas | 4.0 | 3.4 | 7.5 | 2.3 | 5.8 | 4.5 | 5.3 | 5.0 | 3.5 | 5.2 | 5.0 | 6.0 | 5.0 | 4.0 | 1.0 | 2.0 | 2.5 | 23.90 | B |
| PUN-101 | Pta. Arenas | 4.0 | 3.3 | 6.8 | 2.0 | 5.5 | 3.5 | 5.2 | 5.0 | 4.0 | 4.3 | 5.0 | 6.0 | 5.0 | 4.0 | 1.0 | 4.0 | 3.5 | 24.05 | B |
| PUN-03 | Pta. Arenas | 4.0 | 6.0 | 6.2 | 1.5 | 4.0 | 2.0 | 3.5 | 3.5 | 3.0 | 4.0 | 5.0 | 6.0 | 5.0 | 4.0 | 1.0 | 3.5 | 4.5 | 24.13 | B |
| PUN-35 | Pta. Arenas | 4.0 | 4.5 | 5.0 | 2.0 | 4.0 | 3.2 | 4.5 | 4.0 | 2.5 | 6.0 | 5.0 | 6.0 | 5.0 | 4.0 | 1.0 | 4.5 | 3.5 | 24.19 | B |
| PUN-69 | Pta. Arenas | 4.0 | 3.0 | 7.0 | 3.0 | 5.8 | 4.0 | 5.0 | 5.0 | 3.5 | 5.0 | 5.0 | 6.0 | 5.0 | 4.0 | 1.0 | 4.0 | 2.5 | 24.37 | B |
| PUN-34 | Pta. Arenas | 4.0 | 3.0 | 7.0 | 2.8 | 5.0 | 3.5 | 3.0 | 5.0 | 4.0 | 4.8 | 5.0 | 6.0 | 5.0 | 4.0 | 1.0 | 3.0 | 3.0 | 24.62 | B |
| PUN-92 | Pta. Arenas | 4.0 | 3.0 | 7.2 | 2.6 | 4.6 | 3.6 | 5.2 | 5.0 | 4.0 | 5.0 | 5.0 | 6.0 | 5.0 | 4.0 | 1.0 | 4.0 | 4.0 | 24.62 | B |
| PUN-98 | Pta. Arenas | 4.0 | 5.0 | 7.2 | 2.3 | 5.4 | 4.2 | 5.0 | 4.5 | 2.8 | 5.0 | 5.0 | 6.0 | 5.0 | 4.0 | 1.0 | 3.5 | 2.5 | 25.11 | B |
| PUN-83 | Pta. Arenas | 4.0 | 3.0 | 7.2 | 2.3 | 6.8 | 3.6 | 5.0 | 4.0 | 3.5 | 5.0 | 5.0 | 6.0 | 5.0 | 4.0 | 1.0 | 4.0 | 2.5 | 25.14 | B |
| PUN-114 | Pta. Arenas | 4.0 | 3.2 | 5.6 | 1.8 | 4.8 | 3.5 | 5.5 | 5.0 | 2.0 | 4.5 | 5.0 | 6.0 | 5.0 | 4.0 | 1.0 | 3.5 | 2.5 | 25.36 | B |
| PUN-113 | Pta. Arenas | 4.0 | 3.4 | 3.6 | 2.3 | 6.5 | 3.4 | 5.0 | 5.5 | 4.5 | 2.5 | 5.0 | 6.0 | 5.0 | 4.0 | 1.0 | 3.5 | 3.5 | 25.57 | B |
| PUN-89 | Pta. Arenas | 4.0 | 3.5 | 7.4 | 2.5 | 5.3 | 4.0 | 4.5 | 4.5 | 3.5 | 5.0 | 5.0 | 6.0 | 5.0 | 4.0 | 1.0 | 4.0 | 3.0 | 25.74 | B |
| PUN-95 | Pta. Arenas | 4.0 | 2.5 | 4.5 | 2.3 | 5.5 | 4.0 | 4.5 | 4.5 | 4.2 | 4.2 | 5.0 | 6.0 | 5.0 | 4.0 | 1.0 | 5.8 | 2.5 | 25.97 | B |
| PUN-68 | Pta. Arenas | 4.0 | 3.5 | 4.6 | 2.8 | 4.2 | 3.5 | 5.0 | 5.0 | 3.0 | 5.0 | 5.0 | 6.0 | 5.0 | 4.0 | 1.0 | 4.8 | 3.0 | 26.05 | B |
| PUN-96 | Pta. Arenas | 4.0 | 4.2 | 6.5 | 2.7 | 3.8 | 3.4 | 3.0 | 4.0 | 2.0 | 5.0 | 5.0 | 6.0 | 5.0 | 4.0 | 1.0 | 3.0 | 3.0 | 26.13 | B |
| PUN-71 | Pta. Arenas | 4.0 | 4.2 | 6.5 | 2.7 | 3.8 | 3.4 | 3.0 | 4.0 | 2.0 | 5.0 | 5.0 | 6.0 | 5.0 | 4.0 | 1.0 | 3.0 | 3.0 | 26.22 | B |
| PUN-46 | Pta. Arenas | 4.0 | 3.2 | 6.8 | 2.0 | 6.0 | 3.5 | 4.6 | 4.7 | 3.0 | 4.3 | 5.0 | 6.0 | 5.0 | 4.0 | 1.0 | 3.3 | 3.0 | 26.55 | B |
| PUN-17 | Pta. Arenas | 4.0 | 4.0 | 5.0 | 2.2 | 6.2 | 5.5 | 5.3 | 5.2 | 5.0 | 3.0 | 5.0 | 6.0 | 5.0 | 4.0 | 1.0 | 3.4 | 2.0 | 26.67 | B |
| PUN-84 | Pta. Arenas | 4.0 | 2.5 | 6.4 | 1.8 | 6.6 | 3.5 | 4.0 | 5.2 | 3.0 | 4.2 | 5.0 | 6.0 | 5.0 | 4.0 | 1.0 | 3.5 | 2.5 | 26.67 | B |
| PUN-85 | Pta. Arenas | 4.0 | 5.0 | 7.5 | 2.0 | 4.8 | 2.0 | 3.0 | 3.5 | 2.0 | 5.0 | 5.0 | 6.0 | 5.0 | 4.0 | 1.0 | 3.5 | 2.0 | 26.67 | B |
| PUN-108 | Pta. Arenas | 4.0 | 3.2 | 5.0 | 3.0 | 6.5 | 4.2 | 5.0 | 5.2 | 3.5 | 4.0 | 5.0 | 6.0 | 5.0 | 4.0 | 1.0 | 4.0 | 2.5 | 26.85 | B |
| PUN-63 | Pta. Arenas | 4.0 | 4.2 | 3.4 | 2.2 | 3.8 | 3.0 | 3.5 | 3.5 | 2.2 | 5.0 | 5.0 | 6.0 | 5.0 | 4.0 | 1.0 | 4.0 | 4.4 | 27.17 | B |
| PUN-112 | Pta. Arenas | 4.0 | 3.0 | 5.0 | 3.0 | 4.0 | 2.5 | 3.5 | 3.8 | 3.8 | 6.2 | 5.0 | 6.0 | 5.0 | 4.0 | 1.0 | 6.0 | 5.5 | 27.18 | B |
| PUN-67 | Pta. Arenas | 4.0 | 2.0 | 4.8 | 4.5 | 4.4 | 3.5 | 3.5 | 5.0 | 4.0 | 5.6 | 5.0 | 6.0 | 5.0 | 4.0 | 1.0 | 5.5 | 5.5 | 27.22 | B |
| PUN-51 | Pta. Arenas | 4.0 | 4.5 | 7.0 | 2.6 | 5.4 | 3.2 | 3.5 | 4.5 | 4.0 | 4.5 | 5.0 | 6.0 | 5.0 | 4.0 | 1.0 | 3.4 | 3.0 | 27.3 | B |
| PUN-19 | Pta. Arenas | 4.0 | 1.5 | 6.0 | 3.2 | 5.0 | 2.0 | 3.0 | 4.5 | 3.5 | 6.5 | 5.0 | 6.0 | 5.0 | 4.0 | 1.0 | 6.4 | 6.0 | 27.43 | B |
| PUN-21 | Pta. Arenas | 4.0 | 2.4 | 5.0 | 1.5 | 5.2 | 3.0 | 3.0 | 4.5 | 3.5 | 4.0 | 5.0 | 6.0 | 5.0 | 4.0 | 1.0 | 6.0 | 4.5 | 27.46 | B |
| PUN-79 | Pta. Arenas | 4.0 | 4.2 | 7.0 | 3.0 | 4.2 | 3.0 | 3.0 | 3.4 | 3.0 | 4.8 | 5.0 | 6.0 | 5.0 | 4.0 | 1.0 | 3.4 | 2.0 | 27.57 | B |
| PUN-106 | Pta. Arenas | 4.0 | 3.5 | 6.0 | 2.7 | 5.3 | 3.5 | 5.0 | 4.5 | 3.5 | 4.4 | 5.0 | 6.0 | 5.0 | 4.0 | 1.0 | 3.0 | 2.0 | 27.89 | B |
| PUN-33 | Pta. Arenas | 4.0 | 3.2 | 2.4 | 3.2 | 4.2 | 3.5 | 4.3 | 5.0 | 4.0 | 4.5 | 5.0 | 6.0 | 5.0 | 4.0 | 1.0 | 5.4 | 4.0 | 27.98 | B |
| PUN-06 | Pta. Arenas | 4.0 | 3.0 | 5.0 | 3.0 | 5.0 | 2.0 | 3.0 | 4.5 | 4.0 | 6.0 | 5.0 | 6.0 | 5.0 | 4.0 | 1.0 | 6.0 | 6.0 | 28.00 | B |
| PUN-88 | Pta. Arenas | 4.0 | 3.0 | 4.5 | 2.3 | 4.8 | 3.2 | 3.5 | 4.8 | 4.5 | 3.8 | 5.0 | 6.0 | 5.0 | 4.0 | 1.0 | 5.0 | 3.5 | 28.19 | B |
| PUN-38 | Pta. Arenas | 4.0 | 3.0 | 4.3 | 1.6 | 5.4 | 2.5 | 3.5 | 4.0 | 4.0 | 4.0 | 5.0 | 6.0 | 5.0 | 4.0 | 1.0 | 6.0 | 6.0 | 28.28 | B |
| PUN-61 | Pta. Arenas | 4.0 | 4.5 | 4.5 | 2.5 | 3.5 | 3.0 | 4.5 | 3.0 | 2.0 | 5.5 | 5.0 | 6.0 | 5.0 | 4.0 | 1.0 | 2.5 | 2.8 | 28.28 | B |
| PUN-97 | Pta. Arenas | 4.0 | 3.2 | 4.5 | 2.4 | 4.6 | 3.5 | 4.5 | 3.5 | 3.0 | 3.8 | 5.0 | 6.0 | 5.0 | 4.0 | 1.0 | 3.0 | 2.5 | 28.28 | B |
| PUN-02 | Pta. Arenas | 4.0 | 5.0 | 3.5 | 2.0 | 3.3 | 2.0 | 3.5 | 5.0 | 3.8 | 4.0 | 5.0 | 6.0 | 5.0 | 4.0 | 1.0 | 4.6 | 5.0 | 28.60 | B |
| PUN-36 | Pta. Arenas | 4.0 | 4.0 | 5.0 | 5.0 | 4.0 | 2.5 | 3.5 | 3.0 | 2.5 | 5.0 | 5.0 | 6.0 | 5.0 | 4.0 | 1.0 | 4.0 | 2.5 | 28.68 | B |
| PUN-109 | Pta. Arenas | 4.0 | 4.2 | 4.0 | 4.0 | 3.8 | 2.5 | 3.0 | 4.5 | 3.0 | 5.0 | 5.0 | 6.0 | 5.0 | 4.0 | 1.0 | 5.5 | 5.5 | 28.72 | B |
| PUN-76 | Pta. Arenas | 4.0 | 4.5 | 5.0 | 2.8 | 4.0 | 3.5 | 4.4 | 3.0 | 2.0 | 4.0 | 5.0 | 6.0 | 5.0 | 4.0 | 1.0 | 2.0 | 2.0 | 28.74 | B |
| PUN-20 | Pta. Arenas | 4.0 | 2.5 | 3.0 | 2.0 | 6.5 | 2.0 | 3.5 | 4.0 | 4.0 | 3.5 | 5.0 | 6.0 | 5.0 | 4.0 | 1.0 | 4.0 | 3.0 | 28.86 | B |
| PUN-49 | Pta. Arenas | 4.0 | 4.2 | 6.5 | 2.2 | 5.4 | 1.5 | 3.0 | 4.0 | 2.5 | 5.0 | 5.0 | 6.0 | 5.0 | 4.0 | 1.0 | 3.0 | 2.0 | 28.98 | B |
| PUN-26 | Pta. Arenas | 4.0 | 3.0 | 4.3 | 2.0 | 5.0 | 3.5 | 4.0 | 4.0 | 4.0 | 3.8 | 5.0 | 6.0 | 5.0 | 4.0 | 1.0 | 4.3 | 3.5 | 29.22 | B |
| PUN-93 | Pta. Arenas | 4.0 | 4.2 | 6.5 | 2.2 | 5.3 | 1.5 | 3.0 | 4.0 | 2.5 | 5.0 | 5.0 | 6.0 | 5.0 | 4.0 | 1.0 | 3.0 | 2.0 | 29.49 | B |
| PUN-24 | Pta. Arenas | 4.0 | 4.5 | 6.2 | 2.5 | 3.0 | 3.0 | 4.0 | 3.5 | 3.5 | 5.5 | 5.0 | 6.0 | 5.0 | 4.0 | 1.0 | 5.5 | 3.5 | 30.02 | A |
| PUN-111 | Pta. Arenas | 4.0 | 3.0 | 5.0 | 2.6 | 4.0 | 3.0 | 3.0 | 5.0 | 3.5 | 4.2 | 5.0 | 6.0 | 5.0 | 4.0 | 1.0 | 3.4 | 3.5 | 30.18 | A |
| PUN-116 | Pta. Arenas | 4.0 | 2.2 | 4.4 | 3.0 | 4.4 | 2.5 | 3.5 | 5.0 | 3.5 | 5.0 | 5.0 | 6.0 | 5.0 | 4.0 | 1.0 | 6.0 | 6.0 | 30.36 | A |
| PUN-30 | Pta. Arenas | 4.0 | 3.2 | 4.6 | 2.4 | 4.2 | 2.5 | 3.5 | 5.0 | 4.0 | 6.0 | 5.0 | 6.0 | 5.0 | 4.0 | 1.0 | 5.5 | 5.5 | 30.52 | A |
| PUN-52 | Pta. Arenas | 4.0 | 3.0 | 3.2 | 2.2 | 5.0 | 2.2 | 3.5 | 4.0 | 4.0 | 3.0 | 5.0 | 6.0 | 5.0 | 4.0 | 1.0 | 4.5 | 5.0 | 30.54 | A |
| PUN-74 | Pta. Arenas | 4.0 | 3.3 | 4.5 | 2.2 | 5.0 | 3.0 | 3.0 | 4.8 | 3.2 | 3.6 | 5.0 | 6.0 | 5.0 | 4.0 | 1.0 | 3.0 | 2.5 | 30.78 | A |
| PUN-40 | Pta. Arenas | 4.0 | 5.0 | 4.4 | 2.0 | 3.0 | 2.0 | 3.5 | 4.5 | 3.5 | 4.2 | 5.0 | 6.0 | 5.0 | 4.0 | 1.0 | 5.0 | 4.5 | 30.79 | A |
| PUN-81 | Pta. Arenas | 4.0 | 3.0 | 3.5 | 2.2 | 4.5 | 2.0 | 3.5 | 5.0 | 4.0 | 5.5 | 5.0 | 6.0 | 5.0 | 4.0 | 1.0 | 5.0 | 4.5 | 31.55 | A |
| PUN-104 | Pta. Arenas | 4.0 | 4.0 | 4.5 | 1.5 | 3.5 | 2.0 | 3.5 | 5.0 | 3.5 | 4.5 | 5.0 | 6.0 | 5.0 | 4.0 | 1.0 | 5.5 | 5.0 | 31.61 | A |
| PUN-29 | Pta. Arenas | 4.0 | 3.2 | 4.5 | 2.0 | 3.5 | 5.0 | 4.0 | 4.0 | 2.2 | 4.0 | 5.0 | 6.0 | 5.0 | 4.0 | 1.0 | 3.5 | 3.0 | 31.62 | A |
| PUN-39 | Pta. Arenas | 4.0 | 4.3 | 3.0 | 3.4 | 3.5 | 3.0 | 3.5 | 3.5 | 2.4 | 2.4 | 5.0 | 6.0 | 5.0 | 4.0 | 1.0 | 3.0 | 2.5 | 31.67 | A |
| PUN-80 | Pta. Arenas | 4.0 | 2.0 | 4.5 | 3.0 | 3.2 | 3.0 | 3.5 | 3.5 | 3.5 | 5.0 | 5.0 | 6.0 | 5.0 | 4.0 | 1.0 | 5.0 | 3.5 | 31.80 | A |
| PUN-25 | Pta. Arenas | 4.0 | 5.0 | 4.5 | 2.0 | 2.5 | 2.0 | 3.0 | 3.0 | 2.0 | 4.0 | 5.0 | 6.0 | 5.0 | 4.0 | 1.0 | 3.5 | 4.0 | 33.05 | A |
| PUN-28 | Pta. Arenas | 4.0 | 2.5 | 3.8 | 3.0 | 3.5 | 2.0 | 3.5 | 5.0 | 4.0 | 4.0 | 5.0 | 6.0 | 5.0 | 4.0 | 1.0 | 5.0 | 5.0 | 33.18 | A |
| PUN-32 | Pta. Arenas | 4.0 | 3.2 | 5.4 | 2.8 | 3.4 | 3.4 | 5.0 | 3.6 | 2.2 | 4.0 | 5.0 | 6.0 | 5.0 | 4.0 | 1.0 | 3.0 | 2.0 | 33.23 | A |
| PUN-16 | Pta. Arenas | 4.0 | 4.2 | 3.5 | 2.4 | 2.5 | 3.5 | 3.0 | 3.5 | 1.5 | 3.5 | 5.0 | 6.0 | 5.0 | 4.0 | 1.0 | 3.5 | 3.0 | 34.24 | A |
| PUN-65 | Pta. Arenas | 4.0 | 2.5 | 5.5 | 2.0 | 3.5 | 2.0 | 3.0 | 3.5 | 2.0 | 4.0 | 5.0 | 6.0 | 5.0 | 4.0 | 1.0 | 4.5 | 2.5 | 34.70 | A |
| PUN-48 | Pta. Arenas | 4.0 | 5.0 | 3.5 | 2.2 | 4.6 | 3.5 | 3.5 | 3.6 | 2.6 | 3.2 | 5.0 | 6.0 | 5.0 | 4.0 | 1.0 | 3.4 | 2.4 | 34.80 | A |
| PUN-07 | Pta. Arenas | 4.0 | 3.0 | 4.5 | 3.2 | 3.5 | 2.0 | 2.5 | 3.5 | 4.0 | 5.5 | 5.0 | 6.0 | 5.0 | 4.0 | 1.0 | 5.0 | 5.5 | 35.27 | A |
| PUN-27 | Pta. Arenas | 4.0 | 2.5 | 5.0 | 1.8 | 3.5 | 2.0 | 3.0 | 3.5 | 2.5 | 4.5 | 5.0 | 6.0 | 5.0 | 4.0 | 1.0 | 3.0 | 2.5 | 36.22 | A |
| PUN-08 | Pta. Arenas | 4.0 | 3.2 | 5.2 | 2.0 | 2.8 | 2.0 | 2.8 | 4.5 | 4.0 | 3.5 | 5.0 | 6.0 | 5.0 | 4.0 | 1.0 | 5.5 | 5.5 | 39.54 | A |
| PUN-58 | Pta. Arenas | 4.0 | 3.2 | 3.4 | 2.8 | 2.2 | 3.4 | 5.0 | 3.0 | 2.0 | 3.5 | 5.0 | 6.0 | 5.0 | 4.0 | 1.0 | 3.5 | 2.5 | 44.44 | A |
| PUN-107 | Pta. Arenas | 4.0 | 4.3 | 7.0 | 3.0 | 1.5 | 2.5 | 3.0 | 3.0 | 1.5 | 4.5 | 5.0 | 6.0 | 5.0 | 4.0 | 1.0 | 2.4 | 2.3 | 44.77 | A |
| Ids | Location | Average Annual Temperature (°C) | Average Annual Precipitation (mm) | ||||
|---|---|---|---|---|---|---|---|
| 1985–2005 | 2020–2044 | 1985–2005 | 2020–2044 | ||||
| av. (st.dev.) | RCP2.6 av. (st.dev.) | RCP8.5 av. (st.dev.) | av. (st.dev.) | RCP2.6 av. (st.dev.) | RCP8.5 av. (st.dev.) | ||
| ARI | Arica | 19.1 (0.01) | 20.3 (0.45) | 20.5 (0.29) | 2.0 (0.03) | 1.84 (0.17) | 1.88 (0.12) |
| PUN | Punta Arenas | 6.2 (0.01) | 6.8 (0.07) | 6.9 (0.06) | 421.6 (2.2) | 425.5 (4.5) | 427.3 (4.2) |
| Ids | Functional Service Life | ||||
|---|---|---|---|---|---|
| 1985–2005 | 2020–2044 | ||||
| r12 = 1.0/r13 = 1.0 | Condition | r12 = 1.0/r13 = 1.0 | Condition | Δ FBSL2.0 | |
| ARI-27 | 19.38 | C | 19.38 | C | 0 |
| ARI-19 | 19.40 | C | 19.40 | C | 0 |
| ARI-28 | 22.84 | B | 22.84 | B | 0 |
| ARI-52 | 23.56 | B | 23.56 | B | 0 |
| ARI-50 | 24.40 | B | 24.40 | B | 0 |
| ARI-43 | 24.90 | B | 24.90 | B | 0 |
| ARI-35 | 26.30 | B | 26.30 | B | 0 |
| ARI-39 | 26.62 | B | 26.62 | B | 0 |
| ARI-38 | 26.64 | B | 26.64 | B | 0 |
| ARI-29 | 26.74 | B | 26.74 | B | 0 |
| ARI-44 | 26.97 | B | 26.97 | B | 0 |
| ARI-36 | 28.17 | B | 28.17 | B | 0 |
| ARI-22 | 28.78 | B | 28.78 | B | 0 |
| ARI-37 | 28.79 | B | 28.79 | B | 0 |
| ARI-45 | 29.13 | B | 29.13 | B | 0 |
| ARI-33 | 29.42 | B | 29.42 | B | 0 |
| ARI-51 | 30.81 | A | 30.81 | A | 0 |
| ARI-40 | 31.07 | A | 31.07 | A | 0 |
| ARI-47 | 31.21 | A | 31.21 | A | 0 |
| ARI-30 | 31.89 | A | 31.89 | A | 0 |
| ARI-49 | 33.52 | A | 33.52 | A | 0 |
| ARI-24 | 33.53 | A | 33.53 | A | 0 |
| ARI-31 | 34.01 | A | 34.01 | A | 0 |
| ARI-16 | 35.36 | A | 35.36 | A | 0 |
| ARI-26 | 35.42 | A | 35.42 | A | 0 |
| ARI-23 | 35.97 | A | 35.97 | A | 0 |
| ARI-41 | 36.77 | A | 36.77 | A | 0 |
| ARI-55 | 37.89 | A | 37.89 | A | 0 |
| ARI-11 | 38.13 | A | 38.13 | A | 0 |
| ARI-07 | 39.49 | A | 39.49 | A | 0 |
| ARI-56 | 39.61 | A | 39.61 | A | 0 |
| ARI-13 | 39.65 | A | 39.65 | A | 0 |
| ARI-53 | 39.69 | A | 39.69 | A | 0 |
| ARI-34 | 39.70 | A | 39.70 | A | 0 |
| ARI-10 | 39.78 | A | 39.78 | A | 0 |
| ARI-09 | 39.95 | A | 39.95 | A | 0 |
| ARI-54 | 39.97 | A | 39.97 | A | 0 |
| ARI-42 | 39.99 | A | 39.99 | A | 0 |
| ARI-57 | 40.12 | A | 40.12 | A | 0 |
| ARI-58 | 40.61 | A | 40.61 | A | 0 |
| ARI-05 | 40.77 | A | 40.77 | A | 0 |
| ARI-21 | 40.87 | A | 40.87 | A | 0 |
| ARI-06 | 40.92 | A | 40.92 | A | 0 |
| ARI-04 | 41.46 | A | 41.46 | A | 0 |
| ARI-12 | 41.55 | A | 41.55 | A | 0 |
| ARI-32 | 41.82 | A | 41.82 | A | 0 |
| ARI-03 | 41.99 | A | 41.99 | A | 0 |
| ARI-46 | 42.10 | A | 42.10 | A | 0 |
| ARI-18 | 42.51 | A | 42.51 | A | 0 |
| ARI-20 | 42.57 | A | 42.57 | A | 0 |
| ARI-01 | 42.61 | A | 42.61 | A | 0 |
| ARI-15 | 42.87 | A | 42.87 | A | 0 |
| ARI-17 | 42.94 | A | 42.94 | A | 0 |
| ARI-02 | 43.59 | A | 43.59 | A | 0 |
| ARI-61 | 44.70 | A | 44.70 | A | 0 |
| ARI-14 | 44.84 | A | 44.84 | A | 0 |
| ARI-08 | 44.85 | A | 44.85 | A | 0 |
| Ids | Functional Service Life | ||||
|---|---|---|---|---|---|
| 1985–2005 | 2020–2044 | ||||
| r12 = 3.2/r13 = 7.4 | Condition | r12 = 3.2/r13 = 7.1 | Condition | Δ FBSL2.0 | |
| PUN-33 | 15.69 | C | 15.46 | C | −0.23 |
| PUN-100 | 18.05 | C | 18.04 | C | −0.01 |
| PUN-70 | 18.90 | C | 18.99 | C | 0.09 |
| PUN-13 | 19.23 | C | 19.37 | C | 0.14 |
| PUN-102 | 19.38 | C | 19.54 | C | 0.16 |
| PUN-55 | 19.64 | C | 19.85 | C | 0.21 |
| PUN-110 | 20.20 | B | 20.49 | B | 0.29 |
| PUN-66 | 20.52 | B | 20.82 | B | 0.30 |
| PUN-54 | 20.95 | B | 21.29 | B | 0.34 |
| PUN-99 | 20.99 | B | 21.36 | B | 0.37 |
| PUN-103 | 21.08 | B | 21.45 | B | 0.37 |
| PUN-42 | 21.40 | B | 21.76 | B | 0.36 |
| PUN-78 | 21.87 | B | 22.33 | B | 0.46 |
| PUN-18 | 22.01 | B | 22.48 | B | 0.47 |
| PUN-14 | 22.05 | B | 22.51 | B | 0.46 |
| PUN-15 | 22.07 | B | 22.53 | B | 0.46 |
| PUN-60 | 22.29 | B | 22.76 | B | 0.47 |
| PUN-72 | 22.33 | B | 22.79 | B | 0.46 |
| PUN-86 | 22.34 | B | 22.86 | B | 0.52 |
| PUN-75 | 22.43 | B | 22.97 | B | 0.54 |
| PUN-73 | 22.47 | B | 22.96 | B | 0.49 |
| PUN-57 | 22.53 | B | 23.02 | B | 0.49 |
| PUN-94 | 22.53 | B | 22.53 | B | 0.00 |
| PUN-64 | 22.74 | B | 23.22 | B | 0.48 |
| PUN-41 | 22.77 | B | 23.31 | B | 0.54 |
| PUN-44 | 22.89 | B | 23.41 | B | 0.52 |
| PUN-62 | 22.97 | B | 23.47 | B | 0.50 |
| PUN-115 | 23.09 | B | 23.68 | B | 0.59 |
| PUN-77 | 23.34 | B | 23.85 | B | 0.51 |
| PUN-45 | 23.41 | B | 23.95 | B | 0.54 |
| PUN-105 | 23.45 | B | 24.05 | B | 0.60 |
| PUN-91 | 23.48 | B | 24.06 | B | 0.58 |
| PUN-12 | 23.67 | B | 24.26 | B | 0.59 |
| PUN-90 | 23.67 | B | 24.29 | B | 0.62 |
| PUN-47 | 23.70 | B | 24.23 | B | 0.53 |
| PUN-82 | 23.90 | B | 24.54 | B | 0.64 |
| PUN-101 | 24.05 | B | 24.62 | B | 0.57 |
| PUN-03 | 24.13 | B | 24.74 | B | 0.61 |
| PUN-35 | 24.19 | B | 24.76 | B | 0.57 |
| PUN-69 | 24.37 | B | 24.96 | B | 0.59 |
| PUN-34 | 24.62 | B | 25.23 | B | 0.61 |
| PUN-92 | 24.62 | B | 25.31 | B | 0.69 |
| PUN-98 | 25.11 | B | 25.83 | B | 0.72 |
| PUN-83 | 25.14 | B | 25.76 | B | 0.62 |
| PUN-114 | 25.36 | B | 26.10 | B | 0.74 |
| PUN-113 | 25.57 | B | 25.67 | B | 0.10 |
| PUN-89 | 25.74 | B | 26.38 | B | 0.64 |
| PUN-95 | 25.97 | B | 26.62 | B | 0.65 |
| PUN-68 | 26.05 | B | 26.78 | B | 0.73 |
| PUN-96 | 26.13 | B | 26.85 | B | 0.72 |
| PUN-71 | 26.22 | B | 26.98 | B | 0.76 |
| PUN-46 | 26.55 | B | 27.35 | B | 0.80 |
| PUN-17 | 26.67 | B | 27.35 | B | 0.68 |
| PUN-84 | 26.67 | B | 27.46 | B | 0.79 |
| PUN-85 | 26.67 | B | 27.46 | B | 0.79 |
| PUN-108 | 26.85 | B | 27.59 | B | 0.74 |
| PUN-63 | 27.17 | B | 27.93 | B | 0.76 |
| PUN-112 | 27.18 | B | 27.92 | B | 0.74 |
| PUN-67 | 27.22 | B | 27.99 | B | 0.77 |
| PUN-51 | 27.3 | B | 28.07 | B | 0.77 |
| PUN-19 | 27.43 | B | 28.22 | B | 0.79 |
| PUN-21 | 27.46 | B | 28.25 | B | 0.79 |
| PUN-79 | 27.57 | B | 28.34 | B | 0.77 |
| PUN-106 | 27.89 | B | 28.69 | B | 0.80 |
| PUN-31 | 27.98 | B | 28.79 | B | 0.81 |
| PUN-06 | 28.00 | B | 28.83 | B | 0.83 |
| PUN-88 | 28.19 | B | 29.05 | B | 0.86 |
| PUN-38 | 28.28 | B | 28.70 | B | 0.42 |
| PUN-61 | 28.28 | B | 28.94 | B | 0.66 |
| PUN-97 | 28.28 | B | 23.86 | B | -4.42 |
| PUN-02 | 28.60 | B | 29.44 | B | 0.84 |
| PUN-36 | 28.68 | B | 29.45 | B | 0.77 |
| PUN-109 | 28.72 | B | 29.56 | B | 0.84 |
| PUN-76 | 28.74 | B | 29.54 | B | 0.80 |
| PUN-20 | 28.86 | B | 29.71 | B | 0.85 |
| PUN-49 | 28.98 | B | 29.85 | B | 0.87 |
| PUN-26 | 29.22 | B | 30.10 | A | 0.88 |
| PUN-93 | 29.49 | B | 30.33 | A | 0.84 |
| PUN-24 | 30.02 | A | 30.91 | A | 0.89 |
| PUN-111 | 30.18 | A | 31.02 | A | 0.84 |
| PUN-116 | 30.36 | A | 31.24 | A | 0.88 |
| PUN-30 | 30.52 | A | 31.41 | A | 0.89 |
| PUN-52 | 30.54 | A | 31.43 | A | 0.89 |
| PUN-74 | 30.78 | A | 31.68 | A | 0.90 |
| PUN-40 | 30.79 | A | 31.67 | A | 0.88 |
| PUN-81 | 31.55 | A | 32.43 | A | 0.88 |
| PUN-104 | 31.61 | A | 32.50 | A | 0.89 |
| PUN-29 | 31.62 | A | 32.51 | A | 0.89 |
| PUN-39 | 31.67 | A | 32.57 | A | 0.90 |
| PUN-80 | 31.80 | A | 32.60 | A | 0.80 |
| PUN-25 | 33.05 | A | 33.92 | A | 0.87 |
| PUN-28 | 33.18 | A | 34.05 | A | 0.87 |
| PUN-32 | 33.23 | A | 34.09 | A | 0.86 |
| PUN-16 | 34.24 | A | 35.06 | A | 0.82 |
| PUN-65 | 34.70 | A | 35.51 | A | 0.81 |
| PUN-48 | 34.80 | A | 35.59 | A | 0.79 |
| PUN-07 | 35.27 | A | 36.05 | A | 0.78 |
| PUN-27 | 36.22 | A | 37.13 | A | 0.91 |
| PUN-08 | 39.54 | A | 39.37 | A | -0.17 |
| PUN-58 | 44.44 | A | 44.83 | A | 0.39 |
| PUN-107 | 44.77 | A | 45.67 | A | 0.90 |
| Ids | Location | Average Annual Temperature (°C) | Average Annual Precipitation (mm) | ||||
|---|---|---|---|---|---|---|---|
| 1985–2005 | 2045–2069 | 1985–2005 | 2045–2069 | ||||
| av. (st.dev.) | RCP2.6 av. (st.dev.) | RCP8.5 av. (st.dev.) | av. (st.dev.) | RCP2.6 av. (st.dev.) | RCP8.5 av. (st.dev.) | ||
| ARI | Arica | 19.1 (0.01) | 20.5 (0.43) | 21.6 (0.17) | 2.0 (0.03) | 1.87 (0.15) | 1.93 (0.14) |
| PUN | Punta Arenas | 6.2 (0.01) | 6.9 (0.10) | 7.6 (0.08) | 421.6 (2.2) | 430.0 (4.2) | 430.9 (5.0) |
| Ids | Functional Service Life | ||||
|---|---|---|---|---|---|
| 1985–2005 | 2045–2069 | ||||
| r12 = 3.2/r13 = 7.4 | Condition | r12 = 3.3/r13 = 6.7 | Condition | Δ FBSL2.0 | |
| PUN-33 | 15.69 | C | 14.98 | C | −0.71 |
| PUN-100 | 18.05 | C | 18.01 | C | −0.04 |
| PUN-70 | 18.90 | C | 19.20 | C | 0.30 |
| PUN-13 | 19.23 | C | 19.66 | C | 0.43 |
| PUN-102 | 19.38 | C | 19.88 | C | 0.50 |
| PUN-55 | 19.64 | C | 20.25 | B | 0.61 |
| PUN-110 | 20.20 | B | 21.09 | B | 0.89 |
| PUN-66 | 20.52 | B | 21.43 | B | 0.91 |
| PUN-54 | 20.95 | B | 21.96 | B | 1.01 |
| PUN-99 | 20.99 | B | 22.15 | B | 1.16 |
| PUN-103 | 21.08 | B | 22.18 | B | 1.10 |
| PUN-42 | 21.40 | B | 22.45 | B | 1.05 |
| PUN-78 | 21.87 | B | 23.24 | B | 1.37 |
| PUN-18 | 22.01 | B | 23.39 | B | 1.38 |
| PUN-14 | 22.05 | B | 23.42 | B | 1.37 |
| PUN-15 | 22.07 | B | 23.42 | B | 1.35 |
| PUN-60 | 22.29 | B | 23.67 | B | 1.38 |
| PUN-72 | 22.33 | B | 23.68 | B | 1.35 |
| PUN-86 | 22.34 | B | 23.91 | B | 1.57 |
| PUN-75 | 22.43 | B | 24.03 | B | 1.60 |
| PUN-73 | 22.47 | B | 23.90 | B | 1.43 |
| PUN-57 | 22.53 | B | 23.97 | B | 1.44 |
| PUN-94 | 22.53 | B | 23.28 | B | 0.75 |
| PUN-64 | 22.74 | B | 24.12 | B | 1.38 |
| PUN-41 | 22.77 | B | 24.36 | B | 1.59 |
| PUN-44 | 22.89 | B | 24.39 | B | 1.50 |
| PUN-62 | 22.97 | B | 24.41 | B | 1.44 |
| PUN-115 | 23.09 | B | 24.84 | B | 1.75 |
| PUN-77 | 23.34 | B | 24.81 | B | 1.47 |
| PUN-45 | 23.41 | B | 24.98 | B | 1.57 |
| PUN-105 | 23.45 | B | 25.20 | B | 1.75 |
| PUN-91 | 23.48 | B | 25.17 | B | 1.69 |
| PUN-12 | 23.67 | B | 25.38 | B | 1.71 |
| PUN-90 | 23.67 | B | 25.49 | B | 1.82 |
| PUN-47 | 23.70 | B | 25.21 | B | 1.51 |
| PUN-82 | 23.90 | B | 24.91 | B | 1.01 |
| PUN-101 | 24.05 | B | 25.67 | B | 1.62 |
| PUN-03 | 24.13 | B | 25.89 | B | 1.76 |
| PUN-35 | 24.19 | B | 25.80 | B | 1.61 |
| PUN-69 | 24.37 | B | 26.03 | B | 1.66 |
| PUN-34 | 24.62 | B | 26.35 | B | 1.73 |
| PUN-92 | 24.62 | B | 26.63 | B | 2.01 |
| PUN-98 | 25.11 | B | 27.21 | B | 2.10 |
| PUN-83 | 25.14 | B | 26.88 | B | 1.74 |
| PUN-114 | 25.36 | B | 27.48 | B | 2.12 |
| PUN-113 | 25.57 | B | 27.04 | B | 1.47 |
| PUN-89 | 25.74 | B | 27.52 | B | 1.78 |
| PUN-95 | 25.97 | B | 27.79 | B | 1.82 |
| PUN-68 | 26.05 | B | 28.09 | B | 2.04 |
| PUN-96 | 26.13 | B | 28.15 | B | 2.02 |
| PUN-71 | 26.22 | B | 28.09 | B | 1.87 |
| PUN-46 | 26.55 | B | 28.43 | B | 1.88 |
| PUN-17 | 26.67 | B | 28.58 | B | 1.91 |
| PUN-84 | 26.67 | B | 28.55 | B | 1.88 |
| PUN-85 | 26.67 | B | 28.55 | B | 1.88 |
| PUN-108 | 26.85 | B | 28.78 | B | 1.93 |
| PUN-63 | 27.17 | B | 28.95 | B | 1.78 |
| PUN-112 | 27.18 | B | 29.06 | B | 1.88 |
| PUN-67 | 27.22 | B | 28.95 | B | 1.73 |
| PUN-51 | 27.30 | B | 28.99 | B | 1.69 |
| PUN-19 | 27.43 | B | 29.17 | B | 1.74 |
| PUN-21 | 27.46 | B | 29.21 | B | 1.75 |
| PUN-79 | 27.57 | B | 29.29 | B | 1.72 |
| PUN-106 | 27.89 | B | 29.65 | B | 1.76 |
| PUN-31 | 27.98 | B | 29.76 | B | 1.78 |
| PUN-06 | 28,00 | B | 29.82 | B | 1.82 |
| PUN-88 | 28.19 | B | 30.08 | A | 1.89 |
| PUN-38 | 28.28 | B | 30.38 | A | 2.10 |
| PUN-61 | 28.28 | B | 30.20 | A | 1.92 |
| PUN-97 | 28.28 | B | 24.99 | A | -3.29 |
| PUN-02 | 28.60 | B | 30.45 | A | 1.85 |
| PUN-36 | 28.68 | B | 30.81 | A | 2.13 |
| PUN-109 | 28.72 | B | 30.58 | A | 1.86 |
| PUN-76 | 28.74 | B | 30.51 | A | 1.77 |
| PUN-20 | 28.86 | B | 30.74 | A | 1.88 |
| PUN-49 | 28.98 | B | 30.90 | A | 1.92 |
| PUN-26 | 29.22 | B | 31.16 | A | 1.94 |
| PUN-93 | 29.49 | B | 31.36 | A | 1.87 |
| PUN-24 | 30.02 | B | 31.99 | A | 1.97 |
| PUN-111 | 30.18 | A | 32.06 | A | 1.88 |
| PUN-116 | 30.36 | A | 32.33 | A | 1.97 |
| PUN-30 | 30.52 | A | 32.52 | A | 2.00 |
| PUN-52 | 30.54 | A | 32.53 | A | 1.99 |
| PUN-74 | 30.78 | A | 32.78 | A | 2.00 |
| PUN-40 | 30.79 | A | 32.76 | A | 1.97 |
| PUN-81 | 31.55 | A | 33.52 | A | 1.97 |
| PUN-104 | 31.61 | A | 33.60 | A | 1.99 |
| PUN-29 | 31.62 | A | 33.62 | A | 2.00 |
| PUN-39 | 31.67 | A | 33.68 | A | 2.01 |
| PUN-80 | 31.80 | A | 33.59 | A | 1.79 |
| PUN-25 | 33.05 | A | 35.01 | A | 1.96 |
| PUN-28 | 33.18 | A | 35.13 | A | 1.95 |
| PUN-32 | 33.23 | A | 35.18 | A | 1.95 |
| PUN-16 | 34.24 | A | 36.11 | A | 1.87 |
| PUN-65 | 34.70 | A | 36.53 | A | 1.83 |
| PUN-48 | 34.80 | A | 36.61 | A | 1.81 |
| PUN-07 | 35.27 | A | 37.04 | A | 1.77 |
| PUN-27 | 36.22 | A | 38.09 | A | 1.87 |
| PUN-08 | 39.54 | A | 39.68 | A | 0.14 |
| PUN-58 | 44.44 | A | 45.08 | A | 0.64 |
| PUN-107 | 44.77 | A | 46.78 | A | 2.01 |
Disclaimer/Publisher’s Note: The statements, opinions and data contained in all publications are solely those of the individual author(s) and contributor(s) and not of MDPI and/or the editor(s). MDPI and/or the editor(s) disclaim responsibility for any injury to people or property resulting from any ideas, methods, instructions or products referred to in the content. |
© 2025 by the authors. Licensee MDPI, Basel, Switzerland. This article is an open access article distributed under the terms and conditions of the Creative Commons Attribution (CC BY) license (https://creativecommons.org/licenses/by/4.0/).
Share and Cite
Palma, D.; Riveros, M.; Verichev, K.; Silva, A.; Prieto, A.J. Resilience and Functional Service Life of Modern Heritage Timber Buildings Amid Climate Change in Chile. Sustainability 2025, 17, 4553. https://doi.org/10.3390/su17104553
Palma D, Riveros M, Verichev K, Silva A, Prieto AJ. Resilience and Functional Service Life of Modern Heritage Timber Buildings Amid Climate Change in Chile. Sustainability. 2025; 17(10):4553. https://doi.org/10.3390/su17104553
Chicago/Turabian StylePalma, Diego, Martín Riveros, Konstantin Verichev, Ana Silva, and Andrés J. Prieto. 2025. "Resilience and Functional Service Life of Modern Heritage Timber Buildings Amid Climate Change in Chile" Sustainability 17, no. 10: 4553. https://doi.org/10.3390/su17104553
APA StylePalma, D., Riveros, M., Verichev, K., Silva, A., & Prieto, A. J. (2025). Resilience and Functional Service Life of Modern Heritage Timber Buildings Amid Climate Change in Chile. Sustainability, 17(10), 4553. https://doi.org/10.3390/su17104553