A State-Specific Approach for Visualizing Overburdened Communities: Lessons from the Connecticut Environmental Justice Screening Tool 2.0
Abstract
1. Introduction
2. Materials and Methods
2.1. Literature Review and Indicator Selection
- Dataset Collection: Data were collected on potential pollution exposure, potential pollution sources, socioeconomic factors, and health sensitivities (Table 1). CT EJScreen has 48 indicators that provide a broader range of information. Its sub-categories allow flexible analyses of overlapping burdens [15].
- Geospatial Assignment: Raw data were assigned to census tracts to balance geographic accuracy with statistical stability. Buffers were used around pollution source point locations to account for the impact of dispersion [13]. A standard 1 km (km) buffer radius was used, with the assumption that communities within this distance are most likely to be affected [4,9]. This 1 km radius was subdivided into four distance-based zones—250 m, 500 m, 750 m, and 1000 m—with decreasing weights (1, 0.5, 0.25, and 0.1, respectively) to reflect attenuated impacts over distance. Locations beyond 1 km were assigned a weight of zero. For pollution sources associated with odors or air quality complaints (e.g., landfills, incinerators), double buffer distances up to 2 km were applied with proportionally scaled weights (1, 0.5, 0.25, and 0.1) to reflect their broader community impact [4,9,17]. The weighted values were summed per census tract spatial intersection and then converted into percentiles and decile ranks. This structured approach ensures consistency in evaluating relative exposure potential across tracts while reflecting the spatial decay of pollution impact. Other indicator categories did not need buffering. A step-by-step calculation of each indicator is detailed in [13].
- Percentile Ranking and Normalization: Raw values were converted to percentiles (0–100) to enable comparisons and then normalized to a 0–10 scale for comparability. The linear normalization is performed by
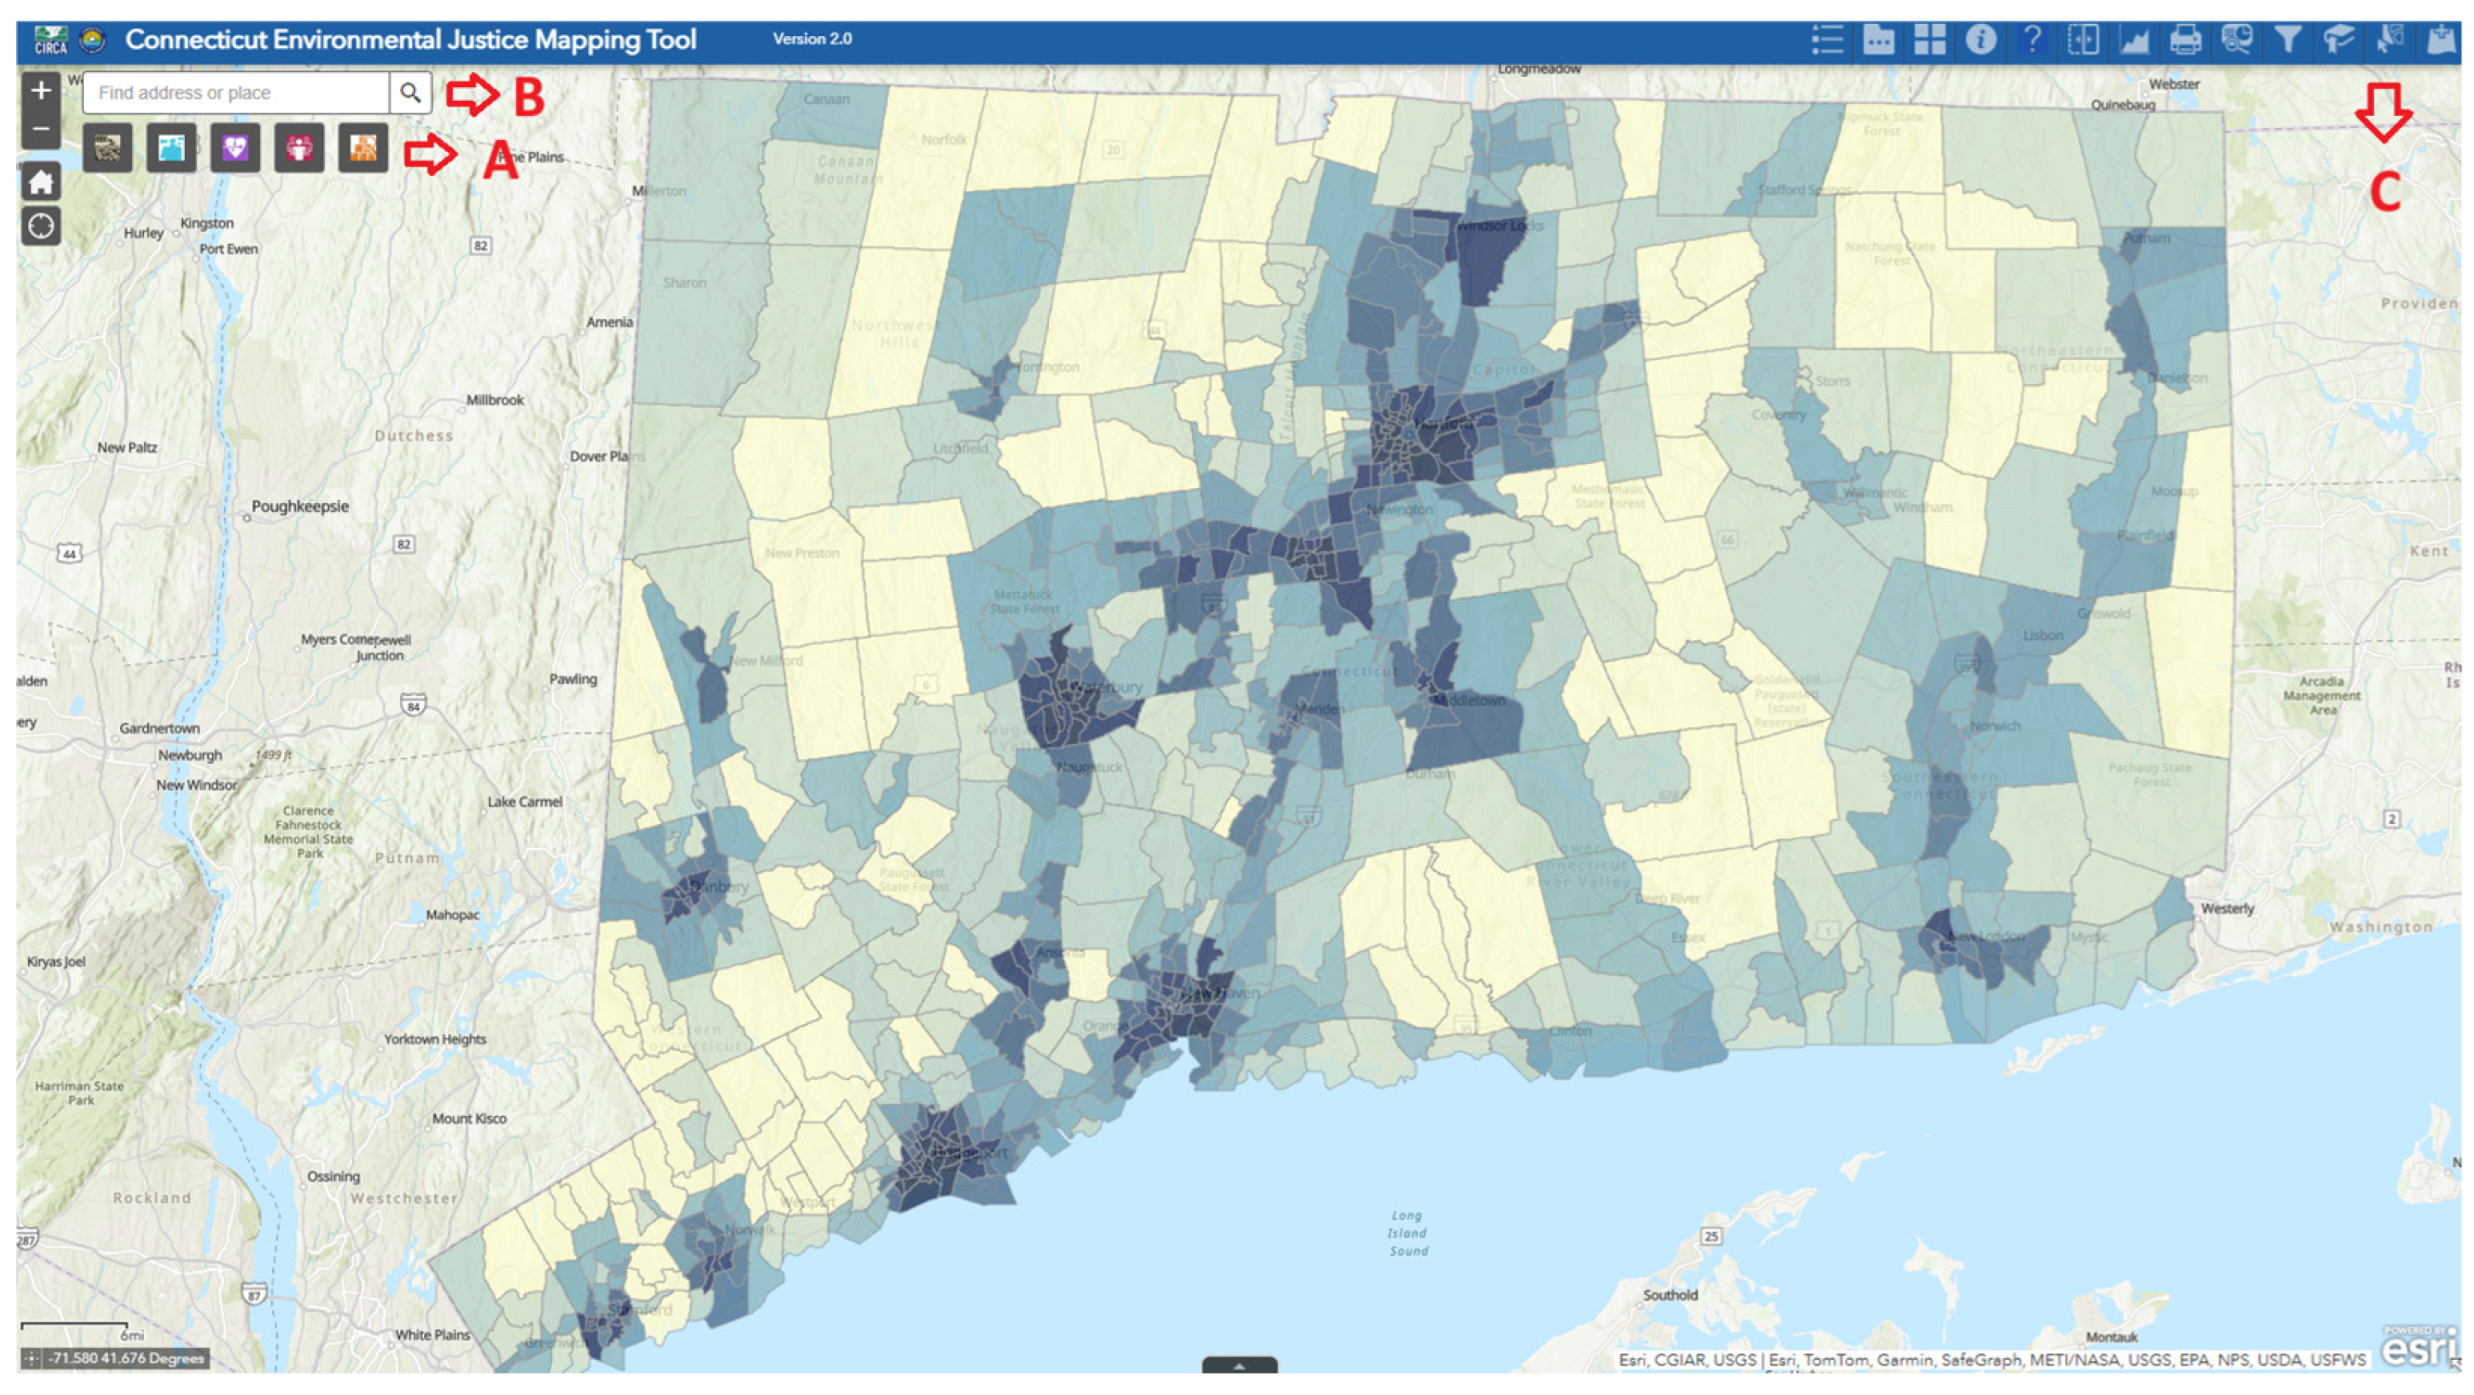
- Map Development: Processed indicators were integrated into an online Geographic Information System (GIS) web format, using the ArcGIS Online Web Application (https://www.arcgis.com/index.html, accessed 11 May 2025).
2.2. Developing Cumulative Impact Model
2.3. Stakeholder Engagement
2.3.1. Public Forums
2.3.2. Advisory Committees
- State Data Advisory Committee (SDAC): Representatives from state agencies, research institutions, and non-governmental organizations provided technical expertise on data sources, indicator inclusion, and methodological consistency. These included the Office of Policy & Management, Yale Center on Climate Change & Health, DataHaven, Department of Economic and Community Development, Department of Transportation, Department of Public Health, Department of Emergency Services and Public Protection, the Clean Air Association of the Northeast States, and the Connecticut Data Collaborative. This diverse coalition provided technical expertise, data insights, and policy alignment of the tool.
- Mapping Tool Advisory Committee (MTAC): This committee comprised community-based organizations and individuals with lived experience reflecting how environmental burdens manifest in local communities. MTAC members included representatives from Operation Fuel and Groundwork Bridgeport, as well as community members with lived environmental justice experiences from Bridgeport, Windsor, and New Haven. Operation Fuel provides energy assistance to low-income households, while Groundwork Bridgeport focuses on environmental sustainability and urban revitalization. This committee was established through a competitive grant application process in Fall 2022, after which all applications were reviewed by the Grant Advisory Committee and six applicants were selected. Participants were financially compensated through monthly stipends for the duration of the project to ensure broad representation and equitable participation.
- Grant Advisory Committee: This committee played a key role in selecting applicants for the MTAC and supporting broader grant-making efforts. Experts from state and federal agencies, universities, and advocacy organizations guided funding mechanisms to support environmental justice initiatives. Additionally, CIRCA meets with this committee to administer Climate and Equity Grants, which provide funding to nonprofit organizations working on environmental justice, climate resilience, and community engagement initiatives. These grant programs further align with CT EJScreen’s mission by directing resources to organizations that serve historically overburdened communities, reinforcing the tool’s role in equitable decision-making and capacity-building across the state.
2.3.3. Public Feedback
2.4. WebMap Features and User Resources
3. Results
3.1. Spearman Analysis
3.1.1. Spearman Analysis of Potential Pollution Exposure
3.1.2. Spearman Analysis of Potential Pollution Sources
3.1.3. Spearman Analysis of Health Sensitivity
3.1.4. Spearman Analysis of Socioeconomic Factors
3.1.5. Cross-Category Correlations of Spearman Analysis
3.1.6. Key Findings of Spearman Analysis
3.2. Principal Component Analysis (PCA)
3.2.1. PCA of Potential Pollution Exposure
3.2.2. PCA of Potential Pollution Sources
3.2.3. PCA of Health Sensitivity
3.2.4. PCA of Socioeconomic Factors
3.2.5. PCA of Pollution Burden
3.2.6. PCA of Sensitive Populations
3.2.7. PCA of Environmental Justice Index
3.2.8. Key Findings of PCA
4. Discussion
4.1. Importance in Planning and Policymaking
4.2. Challenges and Limitations of Creating a State-Specific EJScreen
4.2.1. Interpreting and Applying the Tool Correctly
4.2.2. Limitations of Mapping and Data Coverage
4.2.3. Data Accuracy, Timeliness, and Granularity
- Temporal Resolution: There is no standardized frequency of updates on every dataset, leading to potential discrepancies between current conditions and mapped data.
- Geographic Resolution Limitations: The tool operates at the census tract level, which may not accurately reflect smaller-scale discrepancies. Large tracts containing both high- and low-burden areas might receive a low-impact score, despite containing pockets of severe environmental burdens. The opposite case is also possible.
- Data Availability: Certain indicators, such as indoor air pollution, pesticide use, and water contamination, lack comprehensive statewide datasets and are thus excluded from the tool.
4.2.4. Balancing State and Community Priorities
4.2.5. Evolving State Goals and the Tool’s Future Development
4.3. Lessons Learned
4.3.1. Balancing Science and Public Needs
4.3.2. Refining Data Selection and Indicator Weighting
4.3.3. Ensuring Scientific Integrity Through Nonpartisan Research Facilities
4.4. Future Research and Policy Recommendations
4.4.1. Roadmap for CT EJScreen 3.0 and Beyond
4.4.2. Integrating CT EJScreen into Decision-Making
- Regulatory Integration: Use CT EJScreen in permitting and land use planning to address cumulative environmental impacts and enforce stricter reviews in high-impact areas. High-impact areas can be defined as those with EJ_Index scores between 6 and 10. At the same time, a broader review of all ranks should be encouraged to capture emerging or context-specific vulnerabilities.
- Resource Allocation: Prioritize funding for green infrastructure, renewable energy, resilience programs, and environmental remediation in overburdened communities.
- Community Engagement: Expand the integration of the tool and environmental justice into the education curriculum and improve data transparency to support public awareness and local advocacy efforts.
- Cross-Agency Collaboration: Establish an interagency task force to standardize tool use across sectors and collaborate with academic institutions to refine methodologies and datasets.
5. Conclusions
Author Contributions
Funding
Institutional Review Board Statement
Informed Consent Statement
Data Availability Statement
Acknowledgments
Conflicts of Interest
Abbreviations
| CEEJAC | Connecticut Equity and Environmental Justice Advisory Council |
| CEJST | Climate and Economic Justice Screening Tool |
| CERCLIS | Comprehensive Environmental Response, Compensation, and Liability Information System |
| CIRCA | Connecticut Institute for Resilience and Climate Adaptation |
| COPD | Chronic Obstructive Pulmonary Disease |
| CDC/ATSDR | Centers for Disease Control and Prevention and Agency for Toxic Substances and Disease Registry |
| CT DEEP | Connecticut Department of Energy and Environmental Protection |
| CT DPH | Connecticut Department of Public Health |
| CT EJScreen | Connecticut Environmental Justice Screening Tool |
| CT SERC | Connecticut State Emergency Response Commission |
| EJ | Environmental Justice |
| EPA | Environmental Protection Agency |
| EPCRA | Emergency Planning and Community Right-to-Know Act |
| ER | Emergency Room |
| GC3 | Governor’s Council on Climate Change |
| GIS | Geographic Information System |
| LEAD | Low-Income Energy Affordability Data |
| MRLC | Multi-Resolution Land Characteristics |
| MTAC | Mapping Tool Advisory Committee |
| NASA | National Aeronautics and Space Administration |
| PCA | Principal Component Analysis |
| PFAS | Per- and Polyfluoroalkyl Substances |
| PLACES | Population Level Analysis and Community EStimates |
| PM | Particulate Matter |
| SDAC | State Data Advisory Committee |
| SNAP | Supplemental Nutrition Assistance Program |
| TRI | Toxics Release Inventory |
| UHI | Urban Heat Index |
| UST | Underground Storage Tank |
Appendix A
Appendix A.1. Index Calculation Steps
- (1)
- Indicator Calculation.
- (2)
- Four Category Indices: includes categories for potential pollution sources, potential pollution exposure, health sensitivity, and socioeconomic indicators.
- (3)
- Composite Category Indices: includes pollution burden and sensitive populations.
- (4)
- Overall Score: Environmental Justice Index
Appendix A.1.1. Indicator Calculation
Appendix A.1.2. Category Index Calculation
Appendix A.1.3. Composite Category Index Calculation
Appendix A.1.4. Environmental Justice Index Calculation
Appendix A.1.5. Example Tract Calculation
| Indicator | Raw Value | Indicator Percentile | Indicator Rank |
|---|---|---|---|
| Brownfield (location proximity) | 3 (sum buffer weight) | 75.43 | 7.6 |
| EPCRA—Facilities Managing Hazardous Chemicals | 27.85 (sum buffer weight) | 96.25 | 9.6 |
| Superfund (average of block groups) | 0.06 (count/km) | 22.6 | 2.3 |
| Wastewater Discharge (average of block groups) | 0.09 (segment/km) | 91.92 | 9.2 |
| Impervious Surface | 91,111.79 (mean area) | 76.91 | 7.7 |
| Incinerators (location proximity) | 0 (Sum buffer weight) | 0 | 0 |
| Landfill (location proximity) | 0 (sum buffer weight) | 0 | 0 |
| Lead Risk (houses built prior to 1978) | 86.97 (% in tract) | 83.94 | 8.4 |
| Municipal Transfer Station (location proximity) | 1 (sum buffer weight) | 73.38 | 7.3 |
| Potentially Contaminated Site (location proximity) | 3 (sum buffer weight) | 92.04 | 9.2 |
| Recycling Facility (location proximity) | 2 (sum buffer weight) | 97.5 | 9.8 |
| Significant Environmental Hazards (location proximity) | 4 (sum buffer weight) | 79.41 | 7.9 |
| Underground Storage Tank (location proximity) | 77 (sum buffer weight) | 99.66 | 10 |
| Score | (average of indicator ranks) | - | 6.85 |
| Indicator | Raw Value | Indicator Percentile | Indicator Rank |
|---|---|---|---|
| Diesel Emission (average of block groups) | 0.23 (concentration) | 67.78 | 6.8 |
| Permitted Major Air Pollution Sources (location proximity) | 0 | 0 | 0 |
| Minor Facilities with Permit-Limited Emissions Potential (location proximity) | 8 (sum buffer weight) | 92.83 | 9.3 |
| Permitted Minor Air Pollution Sources/Equipment/Processes (location proximity) | 175 (sum buffer weight) | 90.10 | 9 |
| Nata Cancer Risk (average of block groups) | 30 (persons per million lifetime) | 65.83 | 10 |
| Noise | 4134.8 (decibel) | 84.74 | 8.50 |
| Ozone (EPA mean block) | 39.98 (ppbv) | 31.29 | 3.1 |
| Particulate Matter 2.5 (average of block group) | 6.73 (µg/m3) | 83.16 | 8.3 |
| Respiratory Hazard Risk Index (average of block groups) | 0.3 | 22.02 | 10 |
| Facilities Releasing Toxins (location proximity) | 48.25 (sum buffer weight) | 97.84 | 9.8 |
| Traffic Density (AADT) | 12,429.71 (vehicle/h) | 55.86 | 5.6 |
| Urban Heat Island (average over 30 m pixel) | 1.29 (%) | 2.2 | 0.2 |
| Score | (average of indicator ranks) | - | 8.6 |
| Indicator | Raw Value | Indicator Percentile | Indicator Rank |
|---|---|---|---|
| Population with Disability | 17.4 (%) | 80.82 | 8.1 |
| Energy Burden | 0.05678 (%) | 7.3 | 73.22 |
| Race/Ethnicity | 74.03(%) | 85.84 | 8.6 |
| Food Insecurity | 20.08 (%) | 79.24 | 7.9 |
| Housing Burden | 42.36 (%) | 80.5 | 8.1 |
| Linguistic Isolation | 25.63 (%) | 92.12 | 9.2 |
| Poverty | 30.46 (%) | 82 | 8.2 |
| Mobile Home | 0 | 0 | 0 |
| Multi-Unit Homes | 43.22 (%) | 65.94 | 6.6 |
| People with No High School Diploma | 10.71 (%) | 88.58 | 8.9 |
| Lack of Tree Canopy | 0.07 (%) | 91.35 | 9.1 |
| Single-Parent Household | 39.37 | 94.15 | 9.4 |
| Unemployment | 3.3 (%) | 15.38 | 1.5 |
| Elderly over 65 years | 15.05 (%) | 36.19 | 3.6 |
| No Health Insurance | 7.74 (%) | 80.07 | 8 |
| Median Income | 56,734 ($) | 78.71 | 7.9 |
| Rent–Ownership Ratio | 209 | 85.39 | 8.5 |
| 5 Years and Younger | 2.96 (%) | 21.58 | 2.2 |
| Score | (average of indicator ranks) | - | 7.8 |
| Indicatory | Raw Value | Indicator Percentile | Indicator Rank |
|---|---|---|---|
| Asthma-Related ER visits | 25.6 | 25.6–30.9 | 6 |
| Childhood Lead Exposure (lead rate) | 0.78 | 0.87 | 1.6 |
| Coronary Heart Disease | 4.9 (%) | 33.9 | 3.4 |
| COPD ER Visits | 9.64 (visits per 10,000 people) | 9.3 to 12.9 | 2 |
| Depression Rate | 22.10 (age-adjusted rate) | 64.66 | 6.5 |
| Diabetes | 12.1 (age-adjusted rate) | 83.84 | 8.4 |
| Low Birth Weight Rate | 130 (PctN) | 4.41–4.70 | 4 |
| Poor Mental Health | 17.4 (age-adjusted rate) | 80.82 | 8.1 |
| Score | (average of indicator ranks) | - | 4.4 |
| Pollution Burden | Sensitive Population | |||
|---|---|---|---|---|
| Potential Pollution Sources | Potential Pollution Exposure | Socioeconomic Factor | Health Sensitivity | |
| Score | 6.85 | 6.72 | 7.8 | 4.4 |
| Average Component Score | ||||
| Percentile | (6.76,|Pollution Burden all data|) = 94.15 The Pollution Burden percentile is scaled by the statewide maximum Pollution Burden scores (98.86). | (6.10,|Sensitive Population all data|) = 64.16 The Sensitive Population percentile is scaled by the statewide maximum Pollution Burden scores (99.89). | ||
| Rank | 9.5 | 6.4 | ||
| Score | 9.5 × 6.4 = 60.8 | |||
| Percentile | (60.8,|EJ_Index all data|) = 85.44 The EJ_Index percentile is scaled by the statewide maximum EJ_Index scores (99.89). | |||
| Final Rank | 8.6 | |||
References
- United States Environmental Protection Agency. How Was EJScreen Developed? Available online: https://19january2021snapshot.epa.gov/ejscreen/how-was-ejscreen-developed_.html#:~:text=Development%20of%20EJSCREEN%20began%20in,newest%20and%20best%20data%20available. (accessed on 10 May 2025).
- Centers for Disease Control and Prevention, Agency for Toxic Substances and Disease Registry. Environmental Justice Index. Available online: https://www.atsdr.cdc.gov/place-health/php/eji/?CDC_AAref_Val=https://www.atsdr.cdc.gov/placeandhealth/eji/index.html (accessed on 12 May 2025).
- Council on Environmental Quality Climate and Economic Justice Screening Tool. Available online: https://ndcpartnership.org/knowledge-portal/climate-toolbox/climate-and-economic-justice-screening-tool-cejst#:~:text=The%20tool%20has%20an%20interactive,that%20are%20experiencing%20these%20burdens (accessed on 10 May 2025).
- Meehan August, L.; Faust, J.B.; Cushing, L.; Zeise, L.; Alexeeff, G.V. Methodological Considerations in Screening for Cumulative Environmental Health Impacts: Lessons Learned from a Pilot Study in California. Int. J. Environ. Res. Public Health 2012, 9, 3069–3084. [Google Scholar] [CrossRef] [PubMed]
- United States Environmental Protection Agency. How Does EPA Use EJScreen? Available online: https://19january2017snapshot.epa.gov/ejscreen/how-does-epa-use-ejscreen_.html (accessed on 10 May 2025).
- Min, E.; Gruen, D.; Banerjee, D.; Echeverria, T.; Freelander, L.; Schmeltz, M.; Saganić, E.; Piazza, M.; Galaviz, V.E.; Yost, M.; et al. The Washington State Environmental Health Disparities Map: Development of a Community-Responsive Cumulative Impacts Assessment Tool. Int. J. Environ. Res. Public Health 2019, 16, 4470. [Google Scholar] [CrossRef] [PubMed]
- Konisky, D.; Gonzalez, D.; Leatherman, K. Mapping for Environmental Justice: An Analysis of State Level Tools; Environmental Resilience Institute at Indiana University: Bloomington, IN, USA, 2021. [Google Scholar]
- Colorado EnviroScreen 2.0 Team. Colorado EnviroScreen Tool Technical Document; Colorado EnviroScreen 2.0 Team: Denver, CO, USA, 2024. [Google Scholar]
- August, L.; Bangia, K.; Plummer, L.; Prasad, S.; Ranjbar, K.; Slocombe, A.; Wieland, W. Office of Environmental Health Hazard Assessment, CalEnviroScreen 4.0. 2021. Available online: https://oehha.ca.gov/media/downloads/calenviroscreen/report/calenviroscreen40reportf2021.pdf (accessed on 10 May 2025).
- Kruse, K.; Bunting, A.; Esch, J.; Goodwin, K.; Vandenberg, C.; Albright, D.; Allen, D.; Office of the Environmental Justice Public Advocate. MiEJScreen Michigan Environmental Justice Mapping and Screening Tool. 2022. Available online: https://www.michigan.gov/egle/-/media/Project/Websites/egle/Documents/Maps-Data/MiEJScreen/Report-2024-07-MiEJScreen-Technical.pdf (accessed on 10 May 2025).
- Department of Environmental; Occupational Health Sciences, University of Washington; Washington State Department of Health. Washington Environmental Health Disparities Map: Cumulative Impacts of Environmental Health Risk Factors Across Communities of Washington State; Washington State Department of Health: Washington, DC, USA, 2019. [Google Scholar]
- Sotolongo, M. Defining Environmental Justice Communities: Evaluating Digital Infrastructure in Southeastern States for Justice40 Benefits Allocation. Appl. Geogr. 2023, 158, 103057. [Google Scholar] [CrossRef]
- Onat, Y.; Buchanan, M.; Wozniak-Brown, J.; Massidda, C.; Duskin, L.; Alpdogan, D.; Morris, K.; Torres, A.; Peate, B.; Pimenta, M.; et al. CT Environmental Justice Screening Tool Report—Version 2.0; University of Connecticut: Groton, CT, USA, 2023. [Google Scholar] [CrossRef]
- United States Environmental Protection Agency. What Is EJSCREEN? | EJSCREEN: Environmental Justice Screening and Mapping Tool; US EPA: Washington, DC, USA, 2019; pp. 1–17. [Google Scholar]
- Besse, H.; Rojas-Rueda, D. Environmental Justice Mapping Tools in the United States: A Review of National and State Tools. Sci. Total Environ. 2025, 962, 178449. [Google Scholar] [CrossRef] [PubMed]
- del Fierro, S.; McInerney, E.; Musco, J.; Swab, E.; Teirstein, M.; Engelman-Lado, M. Scoping and Recommendations for the Development of a Connecticut Environmental Justice Mapping Tool; Yale University: New Haven, CT, USA, 2021. [Google Scholar]
- Heaney, C.D.; Wing, S.; Campbell, R.L.; Caldwell, D.; Hopkins, B.; Richardson, D.; Yeatts, K. Relation between Malodor, Ambient Hydrogen Sulfide, and Health in a Community Bordering a Landfill. Environ. Res. 2011, 111, 847–852. [Google Scholar] [CrossRef] [PubMed]
- Requia, W.J.; Di, Q.; Silvern, R.; Kelly, J.T.; Koutrakis, P.; Mickley, L.J.; Sulprizio, M.P.; Amini, H.; Shi, L.; Schwartz, J. An Ensemble Learning Approach for Estimating High Spatiotemporal Resolution of Ground-Level Ozone in the Contiguous United States. Environ. Sci. Technol. 2020, 54, 11037–11047. [Google Scholar] [CrossRef] [PubMed]
- Van Donkelaar, A.; Hammer, M.S.; Bindle, L.; Brauer, M.; Brook, J.R.; Garay, M.J.; Hsu, N.C.; Kalashnikova, O.V.; Kahn, R.A.; Lee, C.; et al. Monthly Global Estimates of Fine Particulate Matter and Their Uncertainty. Environ. Sci. Technol. 2021, 55, 15287–15300. [Google Scholar] [CrossRef] [PubMed]
- Alexeeff, G.V.; Faust, J.B.; August, L.M.; Milanes, C.; Randles, K.; Zeise, L.; Denton, J. A Screening Method for Assessing Cumulative Impacts. Int. J. Environ. Res. Public Health 2012, 9, 648–659. [Google Scholar] [CrossRef] [PubMed]
- Morello-Frosch, R.; Pastor, M.; Porras, C.; Sadd, J. Environmental Justice and Regional Inequality in Southern California: Implications for Future Research. Environ. Health Perspect. 2002, 110, 149–154. [Google Scholar] [CrossRef] [PubMed]
- Huang, H.; Wang, A.; Morello-Frosch, R.; Lam, J.; Sirota, M.; Padula, A.; Woodruff, T.J. Cumulative Risk and Impact Modeling on Environmental Chemical and Social Stressors. Curr. Environ. Health Rep. 2018, 5, 88–99. [Google Scholar] [CrossRef] [PubMed]
- Krieg, E.J.; Faber, D.R. Not so Black and White: Environmental Justice and Cumulative Impact Assessments. Environ. Impact Assess. Rev. 2004, 24, 667–694. [Google Scholar] [CrossRef]
- Murphy, S.R.; Prasad, S.B.; Faust, J.B.; Alexeeff, G.V. Community-Based Cumulative Impact Assessment: California’s Approach to Integrating Nonchemical Stressors into Environmental Assessment Practices. In Chemical Mixtures and Combined Chemical and Nonchemical Stressors; Springer: Cham, Switzerland, 2018; pp. 515–544. ISBN 9783319562322. [Google Scholar]
- Lee, C. A Game Changer in the Making? Lessons From Advancing Strategies, Environmental Justice through Mapping and Cumulative Impact Strategies. Environ. Law Inst. 2009, 50, 10203–10215. [Google Scholar]
- Brody, T.M.; Di Bianca, P.; Krysa, J. Analysis of Inland Crude Oil Spill Threats, Vulnerabilities, and Emergency Response in the Midwest United States. Risk Anal. 2012, 32, 1741–1749. [Google Scholar] [CrossRef] [PubMed]
- Morello-Frosch, R.; Jesdale, B.M. Separate and Unequal: Residential Segregation and Estimated Cancer Risks Associated with Ambient Air Toxins in U.S. Metropolitan Areas. Environ. Health Perspect. 2006, 114, 386–393. [Google Scholar] [CrossRef] [PubMed]
- Connecticut General Assembly. Connecticut General Statutes § 22a-20a—Environmental Justice; Connecticut General Assembly: Hartford, CT, USA, 2023; Sec.22a-20a. [Google Scholar]
- California Strategic Growth Council Transformative Climate Communities: Community-Led Transformation for a Sustainable California. Available online: https://sgc.ca.gov/programs/TCC/ (accessed on 6 November 2023).
- New Jersey Department of Environmental Protection Environmental Justice Law. Available online: https://dep.nj.gov/ej/law/ (accessed on 6 November 2023).
- Colorado Environmental Public Health Tracking Colorado EnviroScreen: An Environmental Justice Mapping Tool. Available online: https://coepht.colorado.gov/blog-post/colorado-enviroscreen-an-environmental-justice-mapping-tool (accessed on 6 November 2023).
- Connecticut Institute for Resilience and Climate Adaptation (CIRCA) Ideas for What to Do With the CT EJ Screening Tool. Available online: https://connecticut-environmental-justice.circa.uconn.edu/now-what-actions-after-ct-ej-screening-tool/ (accessed on 6 November 2023).
- Connecticut General Assembly. An Act Concerning the Environmental Justice Program of the Department of Energy and Environmental Protection; Connecticut General Assembly: Hartford, CT, USA, 2023; Substitute Senate Bill No. 1147. [Google Scholar]
- Kloog, I.; Chudnovsky, A.A.; Just, A.C.; Nordio, F.; Koutrakis, P.; Coull, B.A.; Lyapustin, A.; Wang, Y.; Schwartz, J. A New Hybrid Spatio-Temporal Model for Estimating Daily Multi-Year PM2.5 Concentrations across Northeastern USA Using High Resolution Aerosol Optical Depth Data. Atmos. Environ. 2014, 95, 581–590. [Google Scholar] [CrossRef] [PubMed]


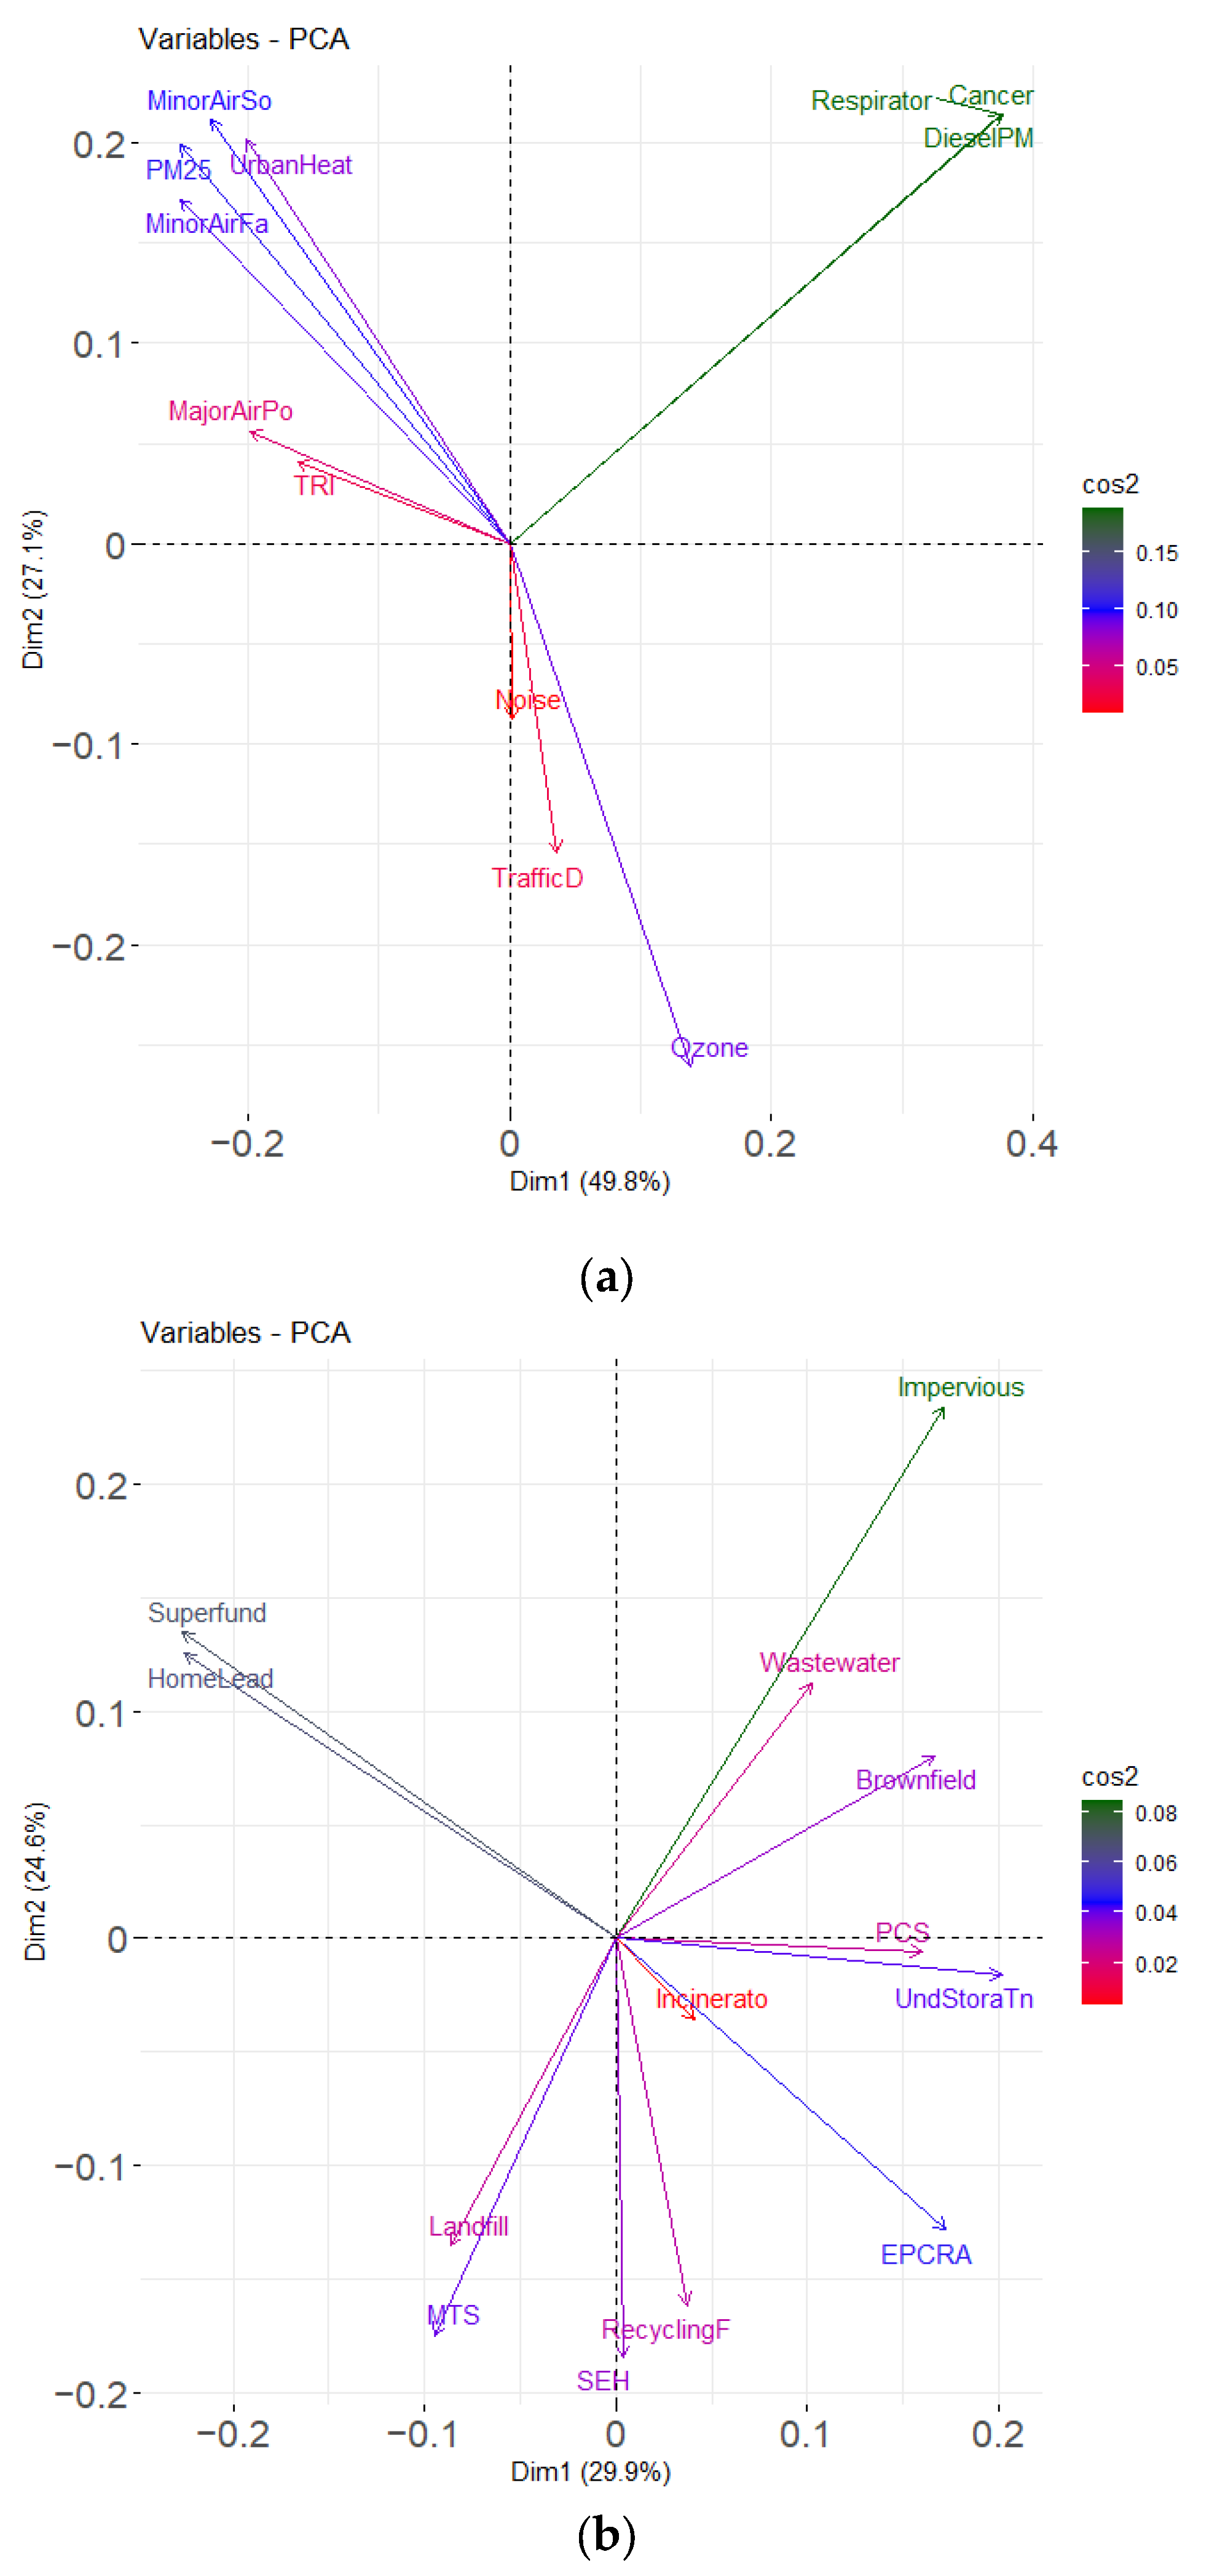
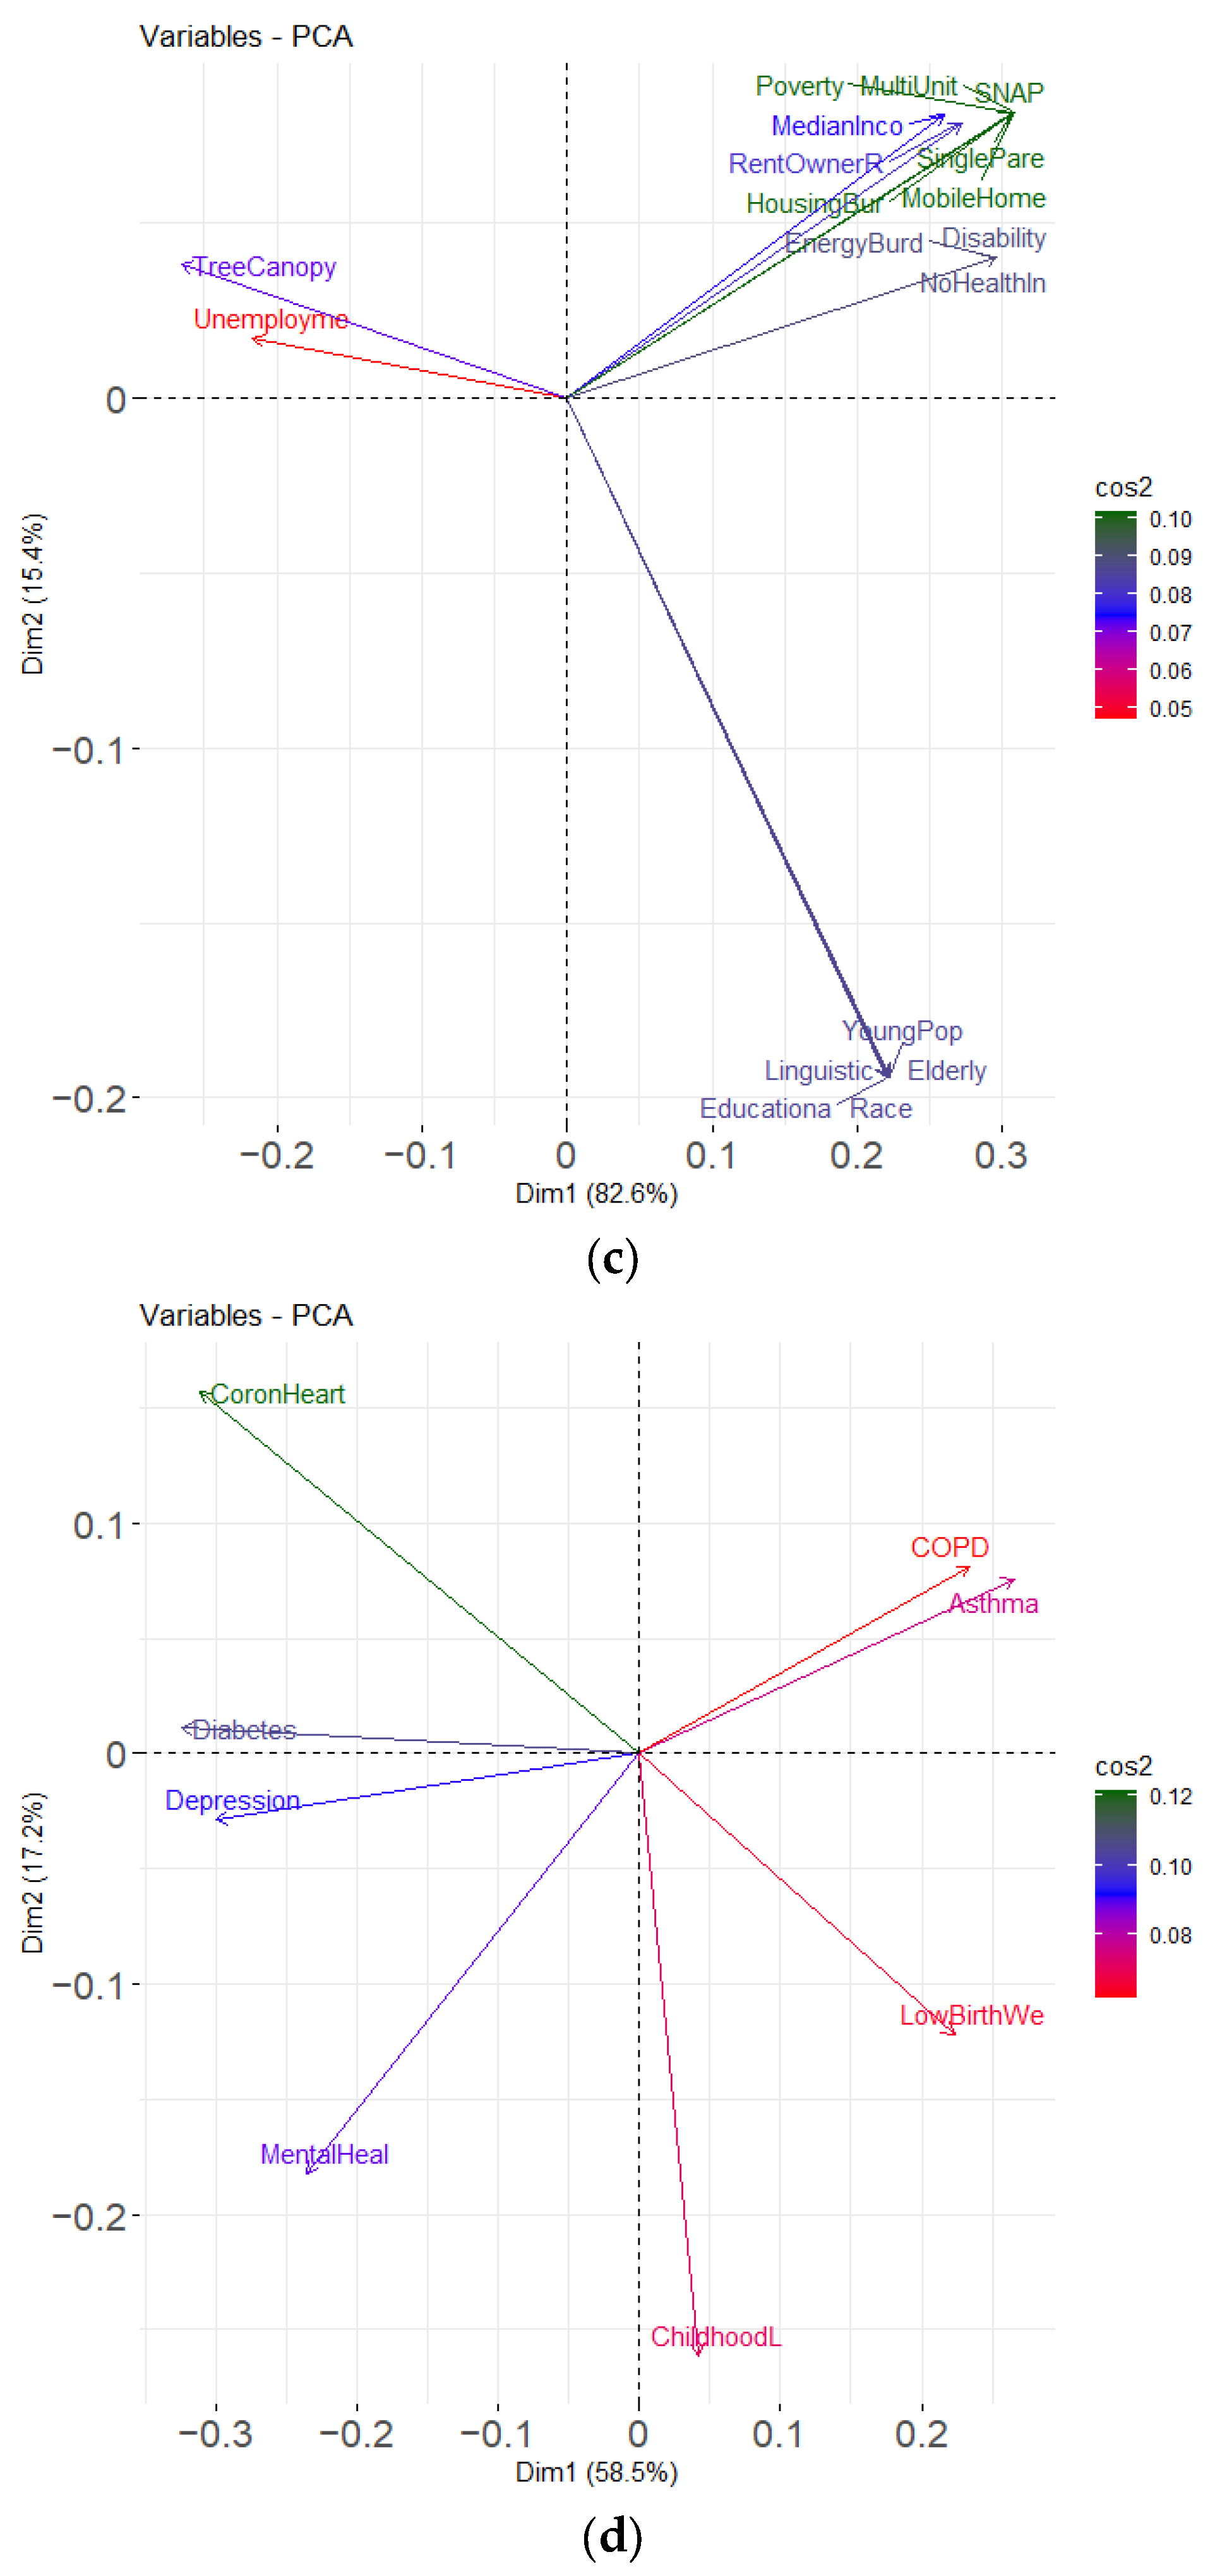
| Index | Total Variance | PC1 Variance (%) | PC2 Variance (%) | PC1 Dominant Indicators | PC2 Dominant Indicators | Highest cos2 Indicators |
|---|---|---|---|---|---|---|
| Pollution_Exposure | 76.90% | 49.80% | 27.10% | EPA Respiratory Risk, Diesel PM Emissions, EPA Cancer Risk, PM2.5 | Minor Air Sources, Urban Heat, Ozone | Diesel PM Emissions, EPA Respiratory Risk, PM2.5 |
| Pollution_Sources | 54.50% | 29.90% | 24.60% | Impervious Surfaces, Superfund Sites, Lead Risk in Housing, EPCRA Facilities | Wastewater Discharge, Landfills, Recycling Facilities | Impervious Surfaces, Superfund Sites, Lead Risk |
| Health_Sensitivity | 75.70% | 58.50% | 17.20% | Coronary Heart Disease, Diabetes, Mental Health, Depression | Asthma, COPD, Childhood Lead Exposure | Coronary Heart Disease, Diabetes, Asthma |
| Socioeconomic Factors | 98.00% | 82.60% | 15.40% | Mobile Homes, Single-Parent Households, Housing Burden, SNAP Enrollment, Multi-Unit Housing, Poverty | Linguistic Isolation, Race, Median Income, Rent–Ownership Ratio | Mobile Homes, Housing Burden, SNAP Enrollment |
| Pollution Burden | 66.10% | 42.50% | 23.60% | EPA Respiratory Risk, Diesel PM Emissions, EPA Cancer Risk, PM2.5, Impervious Surfaces | Wastewater Discharge, Landfills, Industrial Pollution | Diesel PM Emissions, EPA Respiratory Risk, PM2.5, Impervious Surfaces |
| Sensitive Populations | 88.90% | 83.10% | 5.80% | Mobile Homes, Housing Burden, Single-Parent Households, SNAP Enrollment, Multi-Unit Housing, Poverty | Diabetes, Asthma, Childhood Lead Exposure, Depression, COPD, Coronary Heart Disease | Mobile Homes, Housing Burden, Single-Parent Households, SNAP Enrollment, Poverty. |
| EJ Index | 81.90% | 71.80% | 10.10% | Mobile Homes, Housing Burden, SNAP Enrollment, Single-Parent Households, Multi-Unit Housing, Energy Burden, Poverty, No Health Insurance | EPA Respiratory Risk, Diesel PM Emissions, PM2.5, Superfund Sites, Lead Risk in Housing, Impervious Surfaces | Housing Burden, Diesel PM Emissions, SNAP Enrollment |
Disclaimer/Publisher’s Note: The statements, opinions and data contained in all publications are solely those of the individual author(s) and contributor(s) and not of MDPI and/or the editor(s). MDPI and/or the editor(s) disclaim responsibility for any injury to people or property resulting from any ideas, methods, instructions or products referred to in the content. |
© 2025 by the authors. Licensee MDPI, Basel, Switzerland. This article is an open access article distributed under the terms and conditions of the Creative Commons Attribution (CC BY) license (https://creativecommons.org/licenses/by/4.0/).
Share and Cite
Onat, Y.; Buchanan, M.; Duskin, L.; Massidda, C.; O’Donnell, J. A State-Specific Approach for Visualizing Overburdened Communities: Lessons from the Connecticut Environmental Justice Screening Tool 2.0. Sustainability 2025, 17, 4535. https://doi.org/10.3390/su17104535
Onat Y, Buchanan M, Duskin L, Massidda C, O’Donnell J. A State-Specific Approach for Visualizing Overburdened Communities: Lessons from the Connecticut Environmental Justice Screening Tool 2.0. Sustainability. 2025; 17(10):4535. https://doi.org/10.3390/su17104535
Chicago/Turabian StyleOnat, Yaprak, Mary Buchanan, Libbie Duskin, Caterina Massidda, and James O’Donnell. 2025. "A State-Specific Approach for Visualizing Overburdened Communities: Lessons from the Connecticut Environmental Justice Screening Tool 2.0" Sustainability 17, no. 10: 4535. https://doi.org/10.3390/su17104535
APA StyleOnat, Y., Buchanan, M., Duskin, L., Massidda, C., & O’Donnell, J. (2025). A State-Specific Approach for Visualizing Overburdened Communities: Lessons from the Connecticut Environmental Justice Screening Tool 2.0. Sustainability, 17(10), 4535. https://doi.org/10.3390/su17104535


