The Analysis of Goals, Results, and Trends in Global Climate Policy Through the Lens of Regulatory Documents and Macroeconomics
Abstract
1. Introduction
2. Literature Review
2.1. The Essence of the Carbon Neutrality
2.2. The Essence of Climate Policy
3. Materials and Methods
3.1. Selection of Data, According to PRISMA
3.2. Analyzed Data Structuring
3.3. Macroeconomics Indicators
3.4. Methodology
3.4.1. Correlation Analysis
3.4.2. Bayesian Tobit Model
3.5. Decomposition of LMDI Based on the Kaya Identity
4. Results
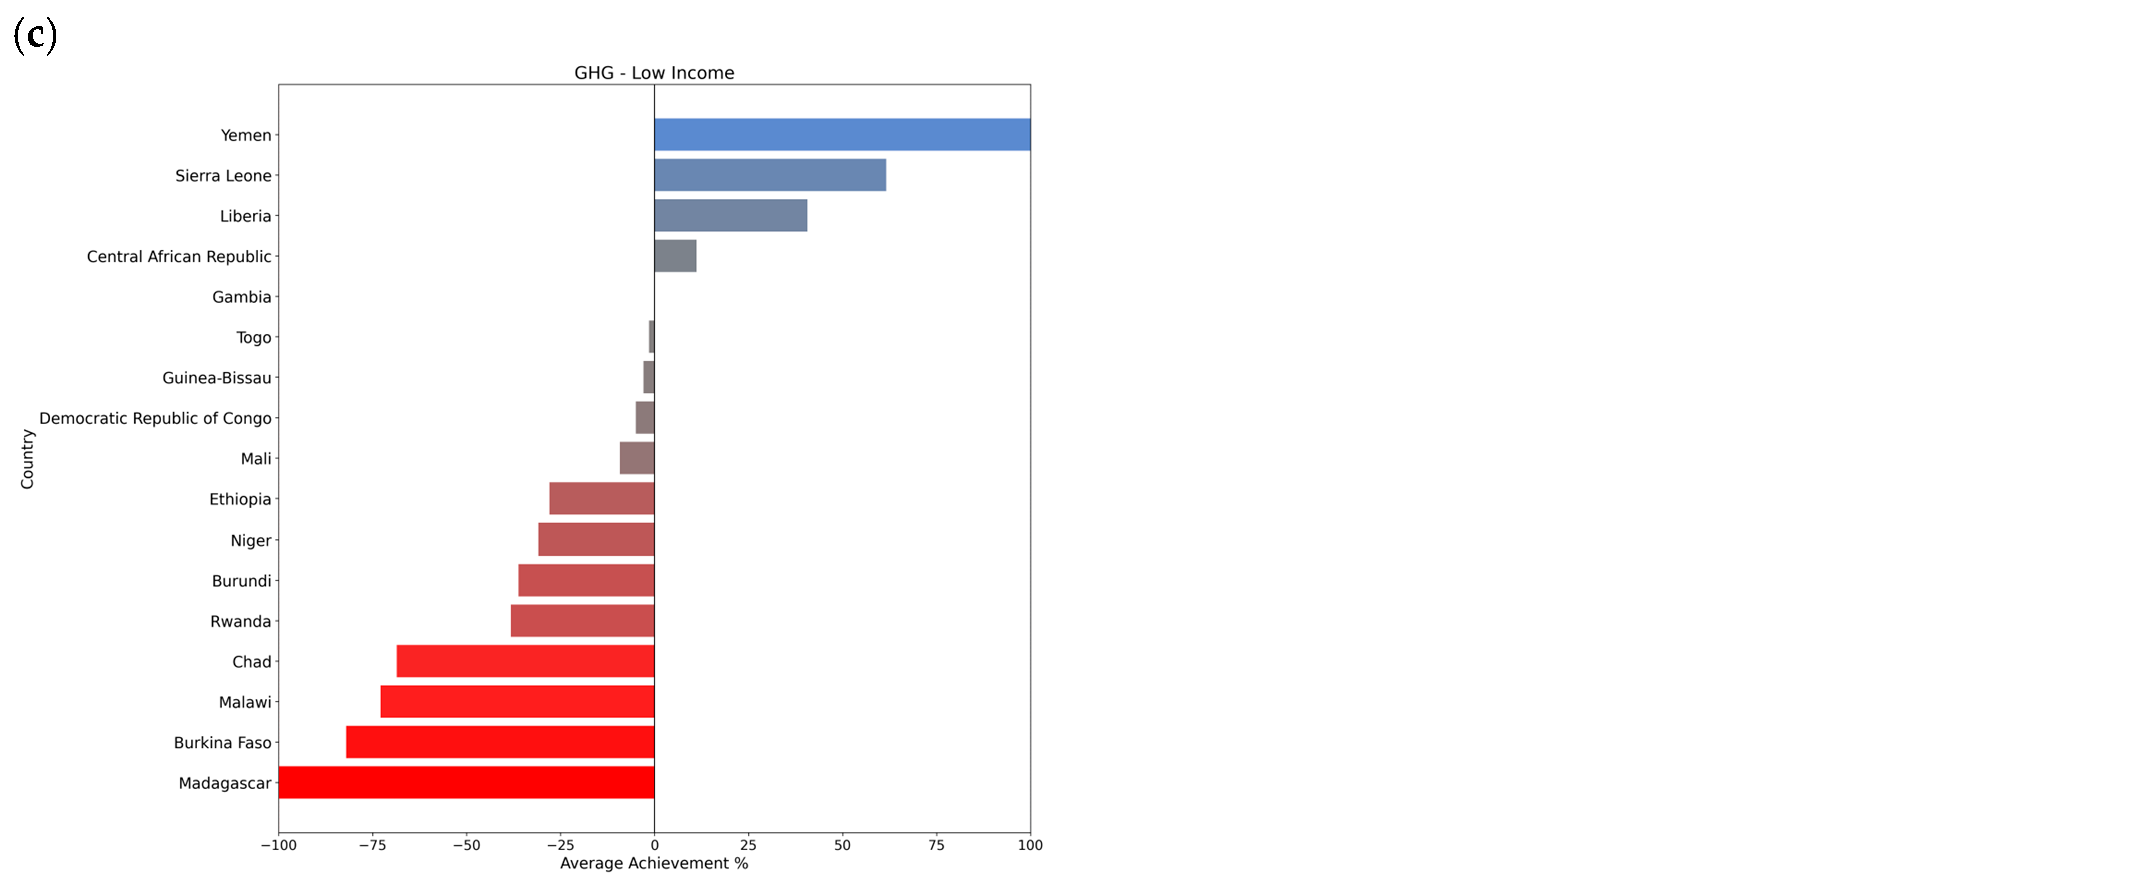
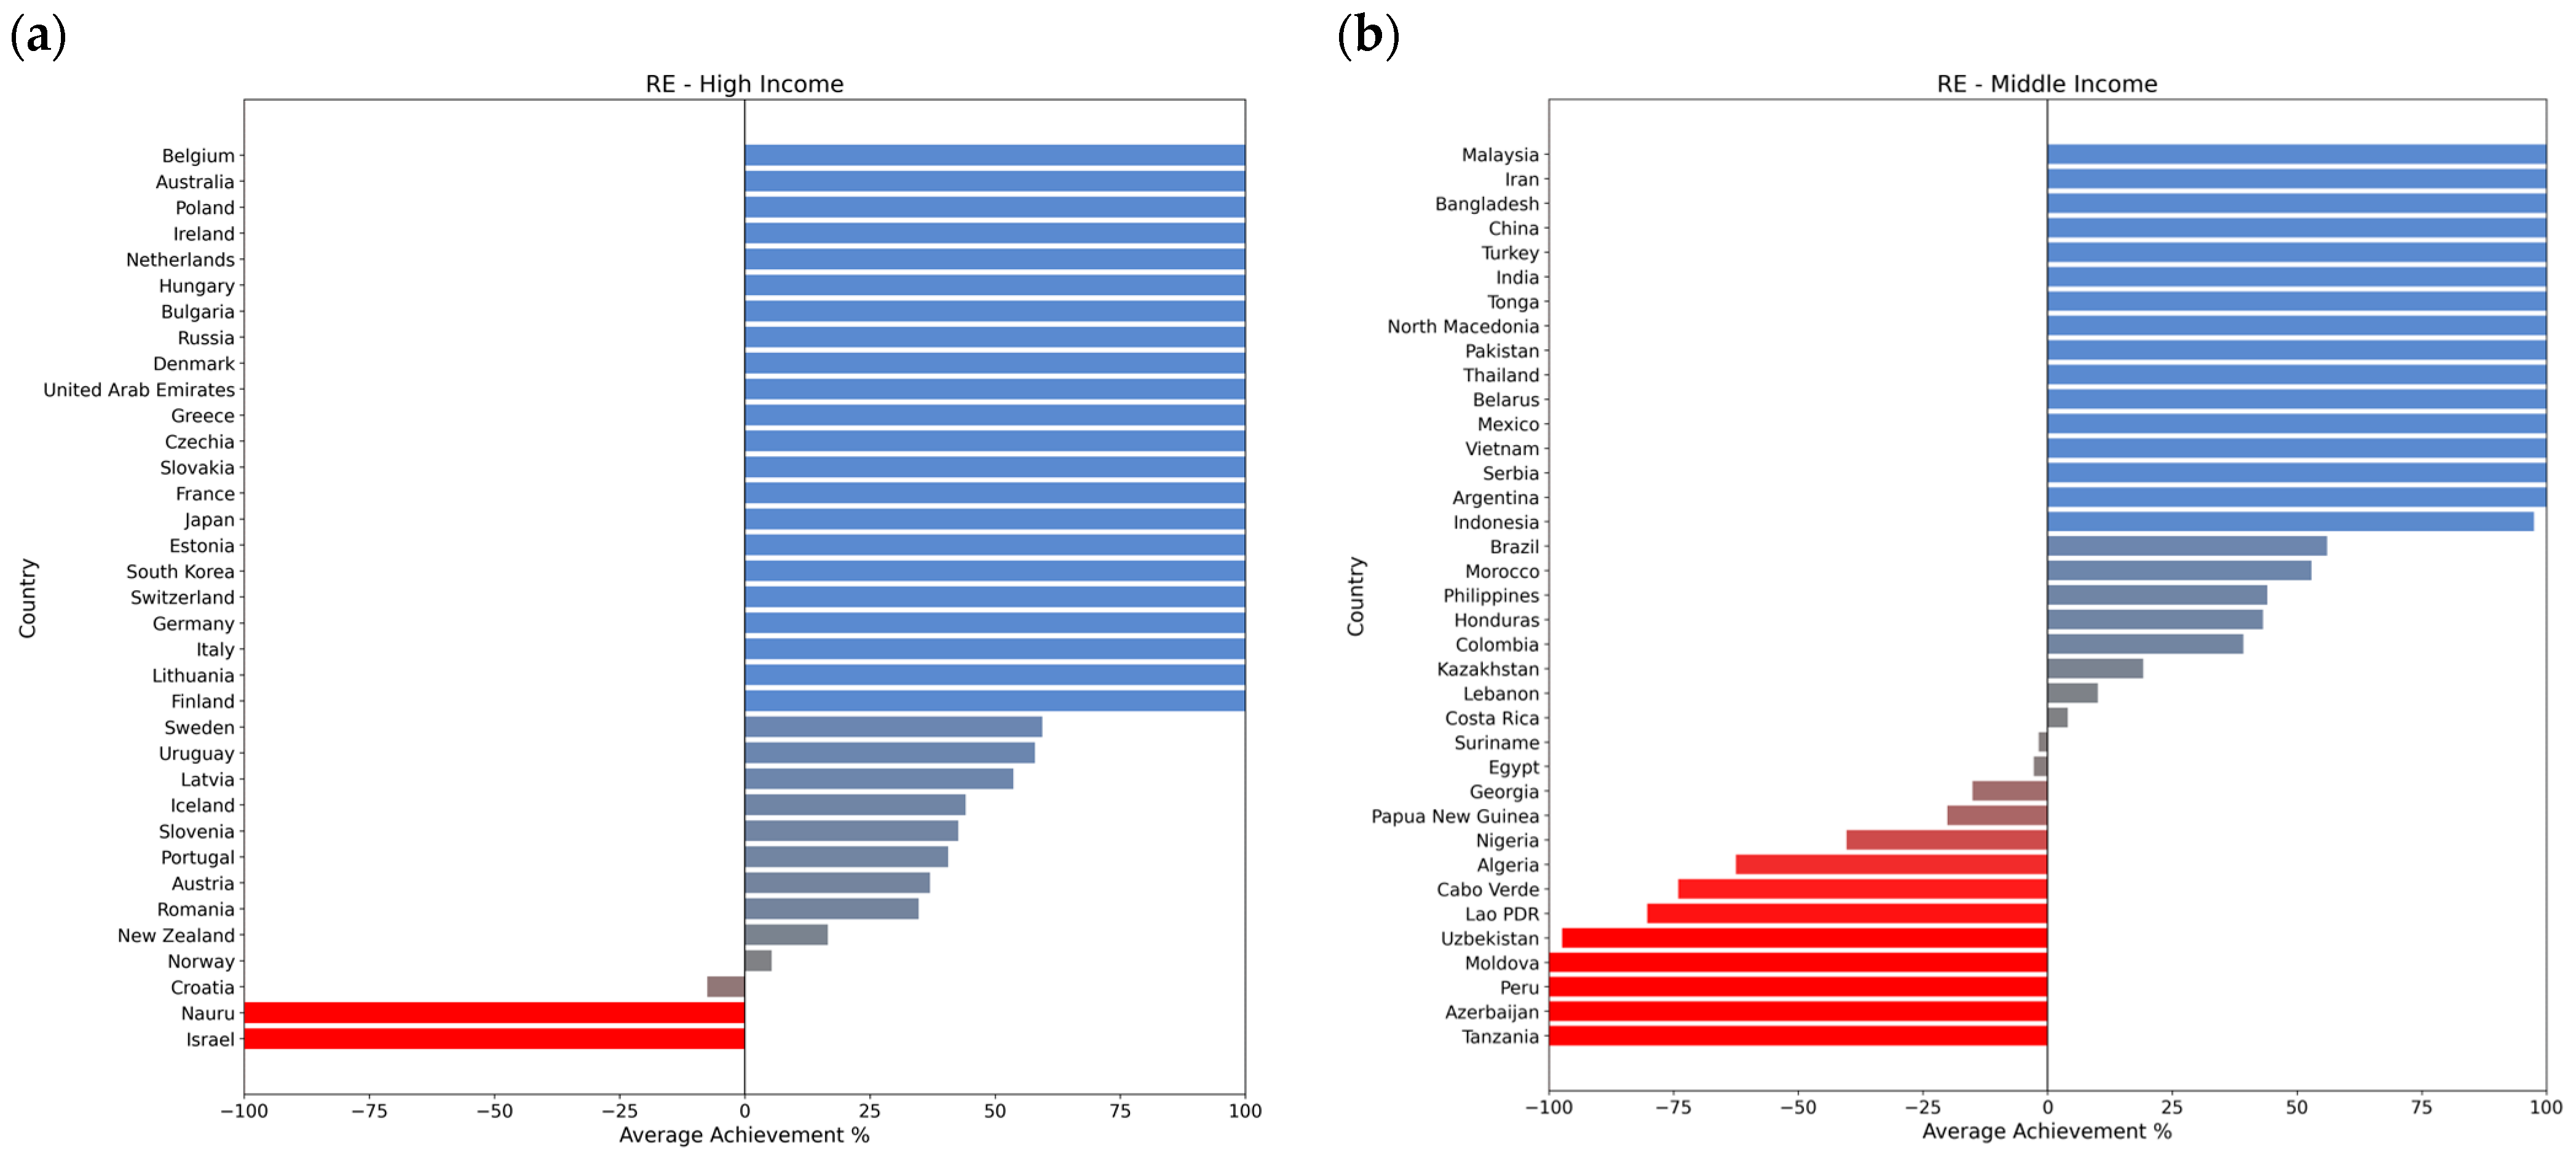
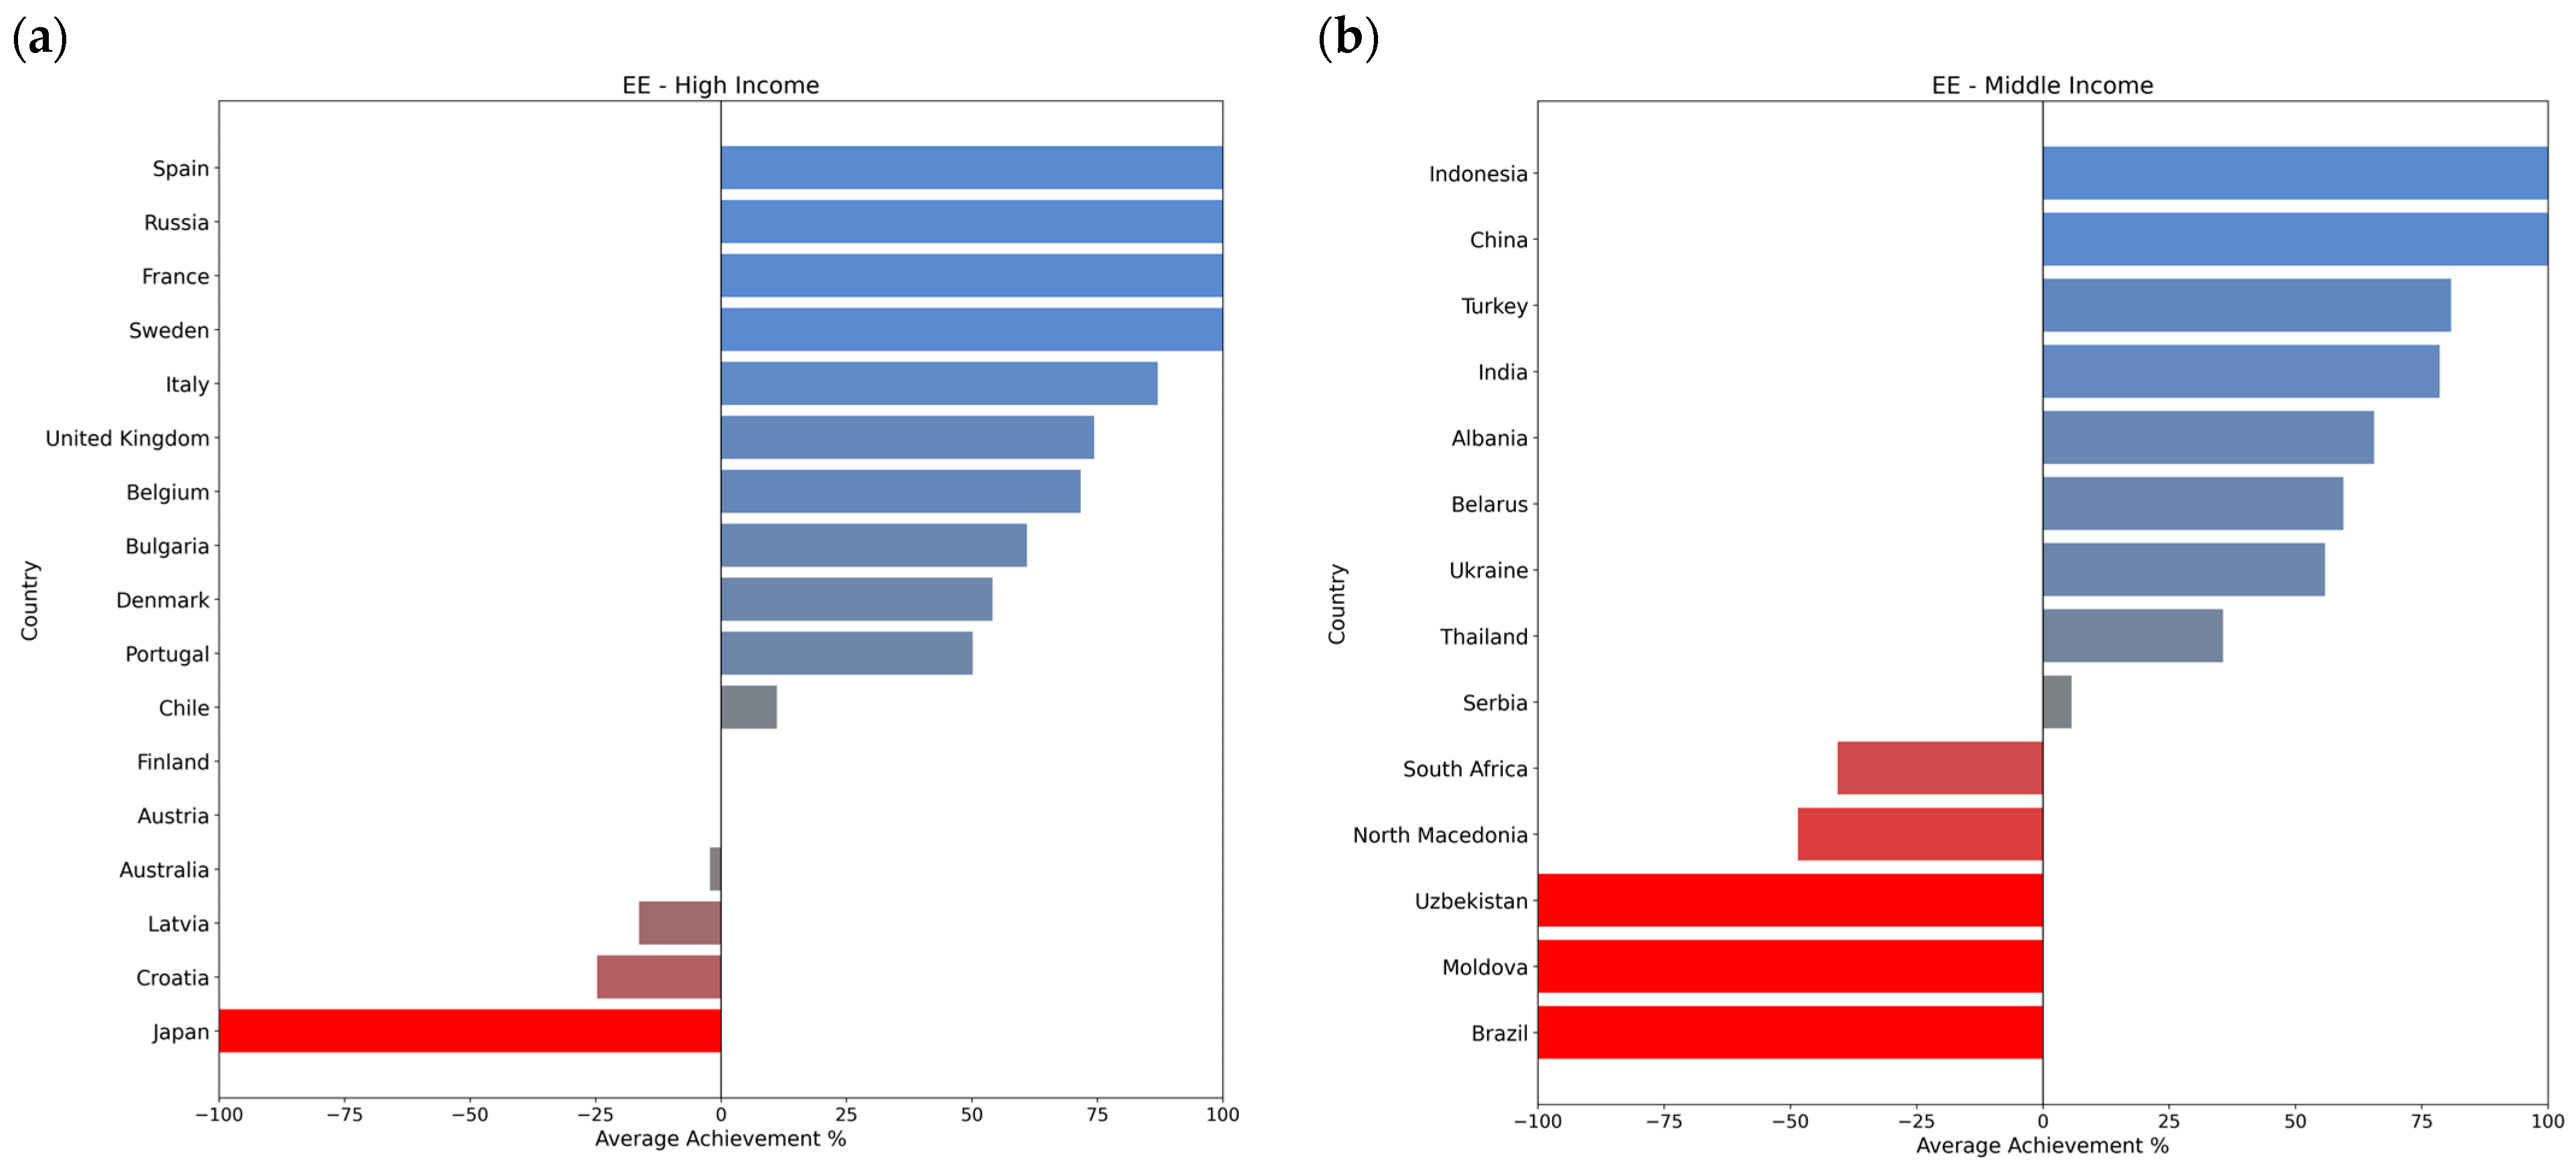
4.1. Achievement of Targets
4.2. Correlation Analysis
4.2.1. GHG Direction
4.2.2. RE Direction
4.2.3. EE Direction
4.3. Regression Analysis
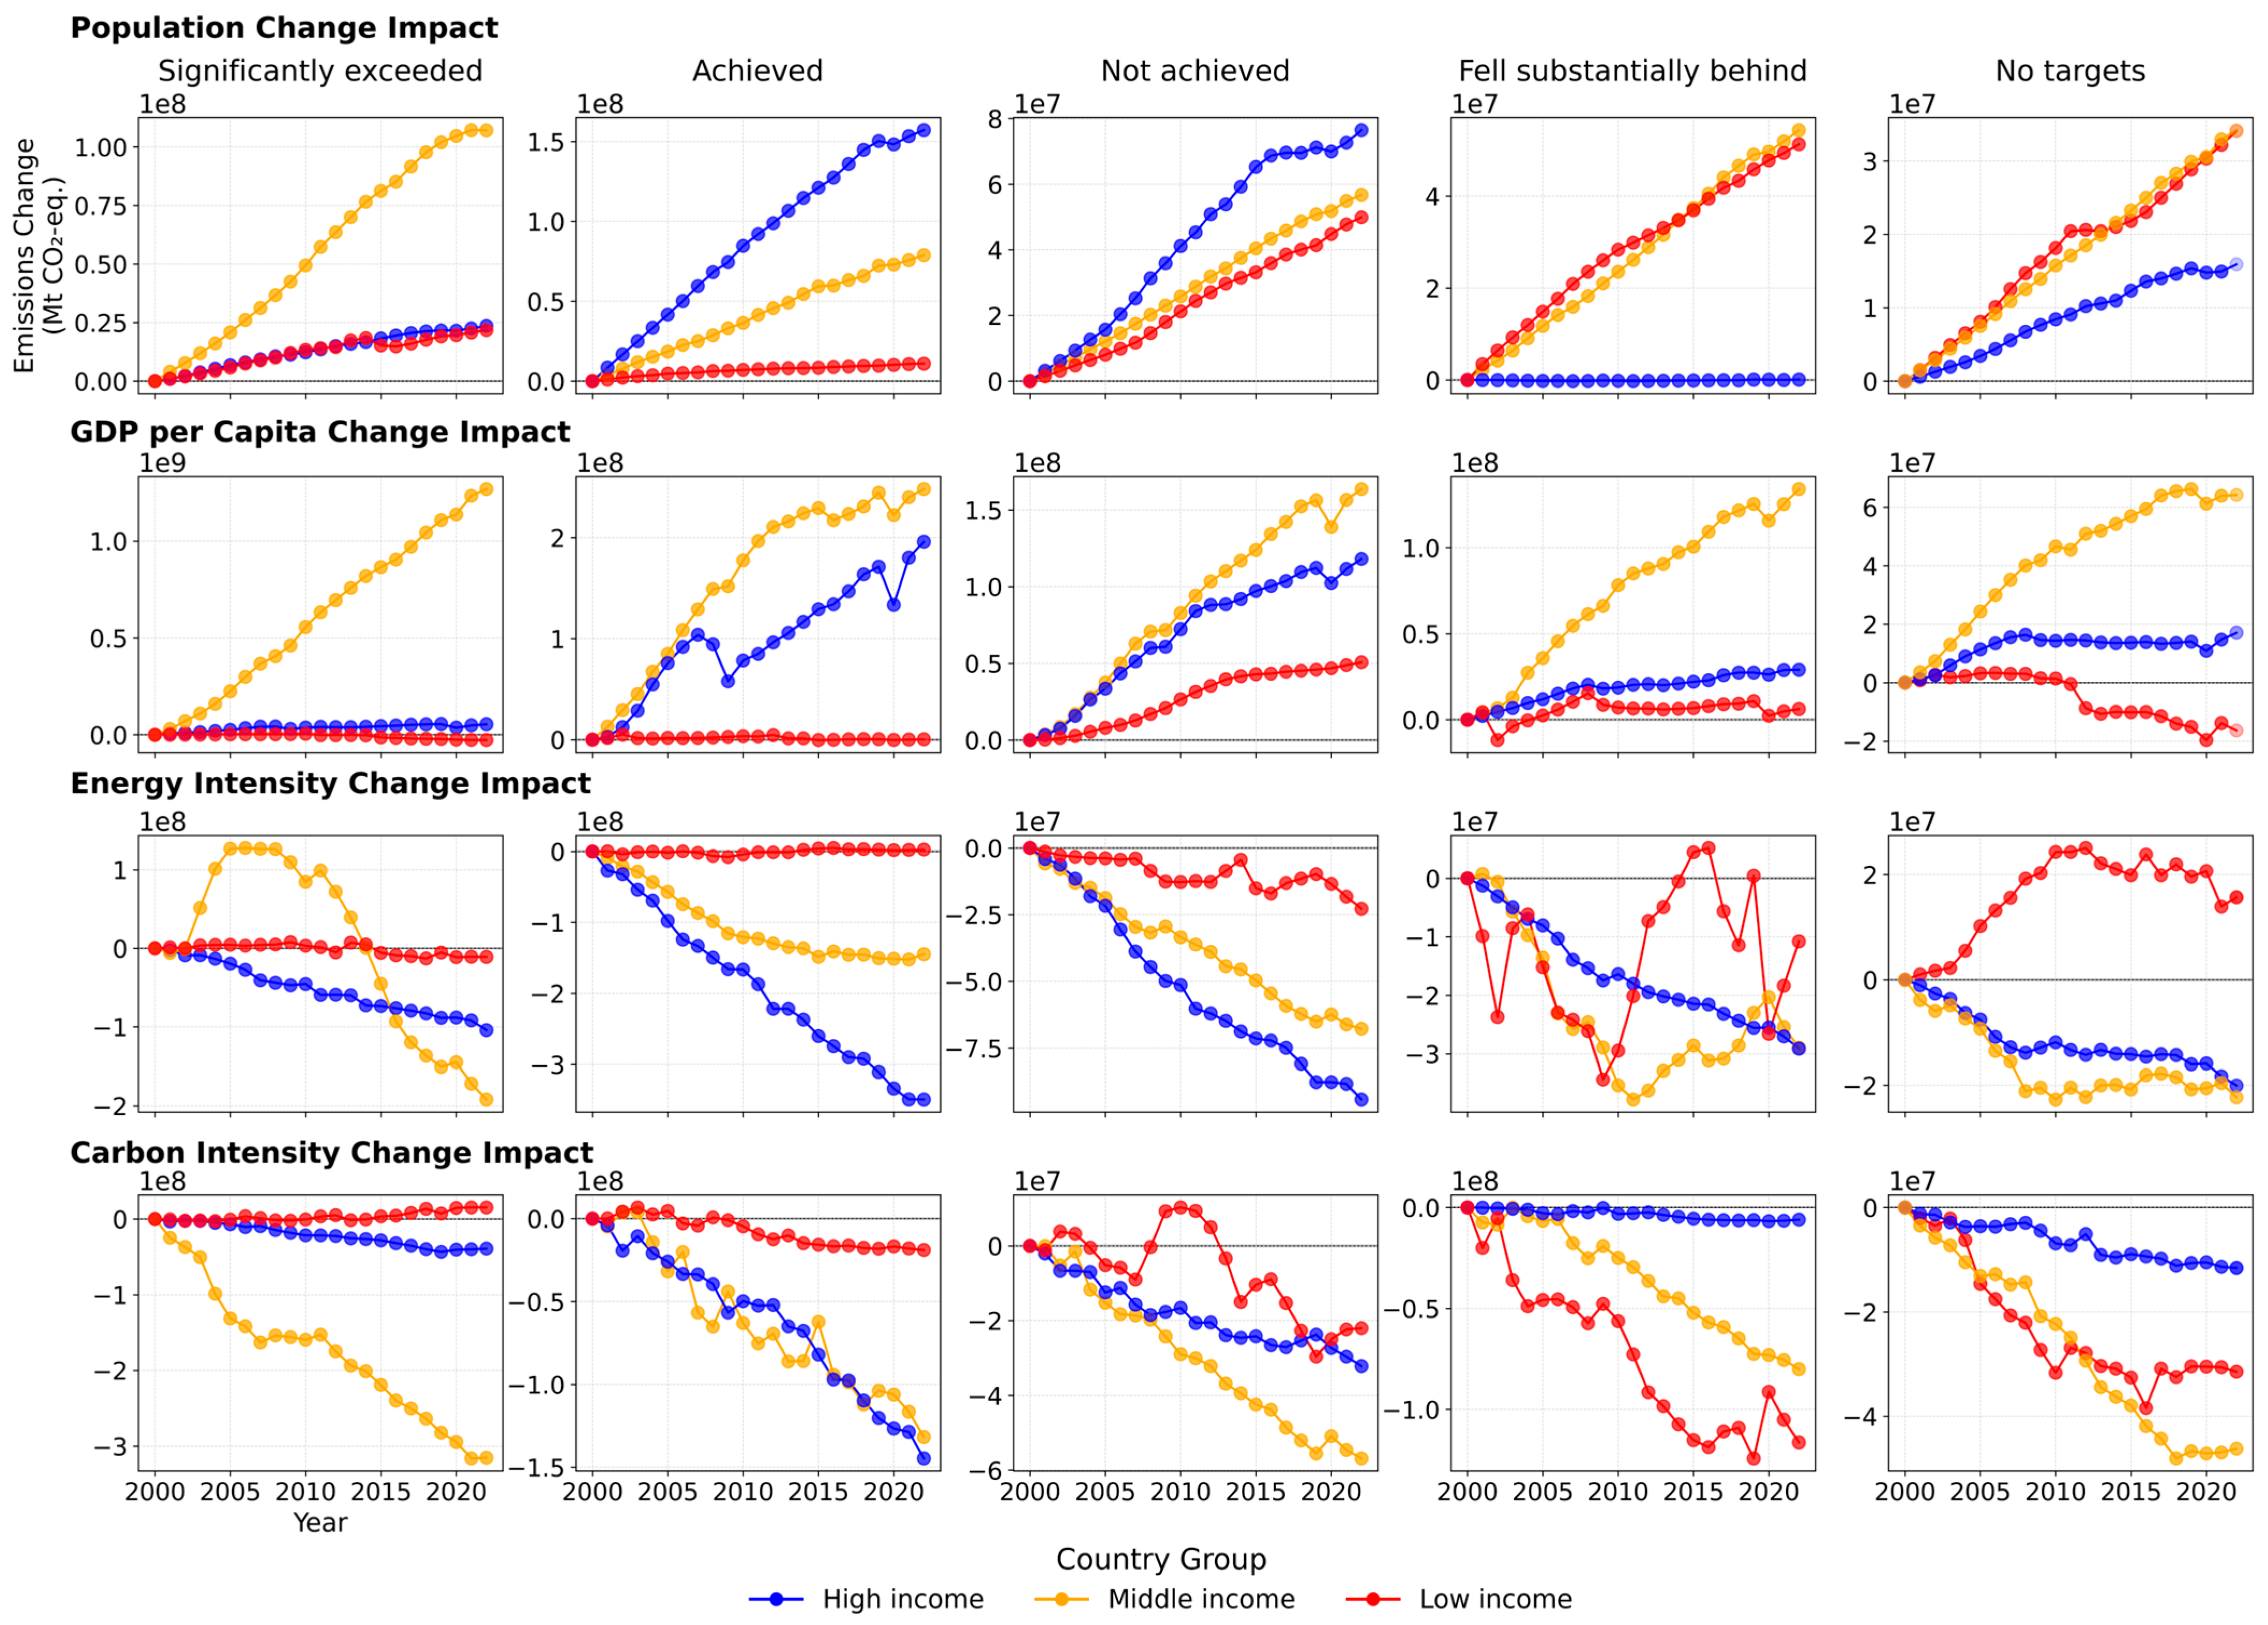
4.4. LMDI Decomposition of the Kaya Identity
4.4.1. GHG Direction
4.4.2. RE Direction
4.4.3. EE Direction
4.4.4. Summary
5. Conclusions
Author Contributions
Funding
Institutional Review Board Statement
Informed Consent Statement
Data Availability Statement
Conflicts of Interest
Appendix A

Appendix B
| Indicators | 1. Significantly Exceeded (>100%) | 2. Achieved (0–100%) | 3. Not Achieved (0–−100%) | 4. Fell Substantially Behind (< −100%) | 5. No Targets | ||||||||||
|---|---|---|---|---|---|---|---|---|---|---|---|---|---|---|---|
| High Income | Middle Income | Low Income | High Income | Middle Income | Low Income | High Income | Middle Income | Low Income | High Income | Middle Income | Low Income | High Income | Middle Income | Low Income | |
| Aims of GHG emissions reduction | |||||||||||||||
| Number of countries | 15 | 10 | 1 | 11 | 25 | 3 | 12 | 28 | 12 | 9 | 14 | 1 | 9 | 19 | 6 |
| Total emissions in 2000, Mt CO2e (% of global) | 3871.5 9.67 | 5617.3 14.02 | 33.3 0.08 | 10,434.8 26.05 | 8329.6 20.8 | 77.01 0.19 | 1769.5 4.42 | 4673.6 11.67 | 588.2 1.47 | 328.4 0.82 | 1889.04 4.72 | 123.5 0.31 | 377.6 0.94 | 1496.1 3.74 | 445.5 1.11 |
| Total emissions in 2022, Mt CO2e (% of global) | 2885.1 5.42 | 14,299.9 26.88 | 31.9 0.06 | 8885.5 16.7 | 9587.5 18.02 | 62.3 0.12 | 2587.7 4.86 | 7352.3 13.82 | 1257.5 2.36 | 273.9 0.51 | 3001.5 5.64 | 53.8 0.1 | 393.2 0.74 | 2064.8 3.88 | 457.1 0.86 |
| Change in GHG emissions from 2000 to 2022: | |||||||||||||||
| -in Mt CO2e | −986.4 | 8682.6 | −1.4 | −1549.3 | 1257.9 | −14.7 | 818.1 | 2678.6 | 669.2 | −54.5 | 1112.5 | −69.7 | 15.7 | 568.6 | 115.8 |
| -in % | −25.48 | 154.57 | −4.27 | −14.85 | 15.10 | −19.09 | 46.23 | 57.32 | 113.77 | −16.59 | 58.89 | −56.42 | 4.16 | 38.01 | 2.60 |
| Aims of RE implementation | |||||||||||||||
| Number of countries | 20 | 17 | 0 | 10 | 9 | 0 | 1 | 8 | 0 | 1 | 4 | 0 | 24 | 58 | 23 |
| Total electricity consumption in 2000, TWh (% of global) | 3578.88 24.46 | 3644.08 24.91 | 0 | 498.85 3.41 | 659.1 4.51 | 0 | 14.68 0.1 | 169.05 1.16 | 0 | 38.64 0.26 | 47.3 0.32 | 0 | 5299.66 36.23 | 614.36 4.2 | 64.47 0.44 |
| Total electricity consumption in 2022, TWh (% of global) | 4158.01 14.79 | 14,012.9 49.84 | 0 | 566.76 2.02 | 1440.62 5.12 | 0 | 18.81 0.07 | 409.84 1.46 | 0 | 67.75 0.24 | 104.55 0.37 | 0 | 6276.08 22.32 | 940.07 3.34 | 118.91 0.42 |
| Total RE consumption in 2000, TWh (% of global) | 432,542 17.12 | 376,261 14.9 | 0 | 178,972 7.09 | 790,952 31.31 | 0 | 47 0.002 | 743 0.03 | 0 | 24,949 0.99 | 2221 0.09 | 0 | 660,122 26.13 | 59,017 2.34 | 180 0.01 |
| Total RE consumption in 2022, TWh (% of global) | 3,013,529 17.27 | 7,182,474 41.16 | 0 | 785,020 4.5 | 2200 × 103 12.61 | 0 | 12,680 0.07 | 35,441 0.2 | 0 | 48,906 0.28 | 13,174 0.08 | 0 | 3,740,242 21.43 | 415,657 2.38 | 3569 0.02 |
| Change in RE consumption from 2000 to 2022: | |||||||||||||||
| -in TWh | 2,580,987 | 6,806,213 | 0 | 606,048 | 1409 × 103 | 0 | 12,633 | 34,698 | 0 | 23,957 | 10,953 | 0 | 3,080,120 | 356,640 | 3389 |
| -in % | 596.70 | 1,808.91 | N/A | 338.63 | 178.17 | N/A | 26,878.72 | 4,669.99 | N/A | 96.02 | 493.16 | N/A | 466.60 | 604.30 | 1882.78 |
| Aims of EE improvement | |||||||||||||||
| Number of countries | 3 | 3 | 0 | 7 | 8 | 0 | 4 | 2 | 0 | 1 | 3 | 0 | 41 | 80 | 23 |
| Total primary energy consumption in 2000, TWh (% of global) | 5274.42 4.87 | 20,177.95 18.64 | 0.00 | 6703.45 6.19 | 7632.76 7.05 | 0.00 | 1830.98 1.69 | 1216.23 1.12 | 0.00 | 6242.48 5.77 | 2989.26 2.76 | 0.00 | 45 × 103 41.85 | 10 × 103 9.38 | 728.33 0.67 |
| Total primary energy consumption in 2022, TWh (% of global) | 4560.79 2.76 | 55,016.55 33.31 | 0.00 | 5689.98 3.45 | 14,912.9 9.03 | 0.00 | 2177.03 1.32 | 1367.73 0.83 | 0.00 | 4956.2 3 | 4368.8 2.65 | 0.00 | 51 × 103 30.73 | 21 × 103 12.46 | 769.1 0.47 |
| Total GDP in 2000, Mln int-USD_2011 (% of global) | 3,430,132 5.8 | 8,638,040 14.6 | 0 | 49,486 × 103 8.37 | 4642 × 103 7.85 | 0 | 1057 × 103 1.79 | 372,380 0.63 | 0 | 4210 × 103 7.12 | 1869 × 103 3.16 | 0 | 21,989 × 109 37.17 | 7118 × 109 12.03 | 883 × 109 1.49 |
| Total GDP in 2022, Mln int-USD_2011 (% of global) | 4,790,925 3.72 | 34,197,530 26.53 | 0 | 6511 × 103 5.05 | 14,763 × 103 11.45 | 0 | 1897 × 103 1.47 | 752 × 103 0.58 | 0 | 4774 × 103 3.7 | 3605 × 103 2.8 | 0 | 37,254 × 109 28.9 | 19,010 × 109 14.75 | 1359 × 109 1.05 |
| Total population in 2000, Mln (% of global) | 109.4 1.8 | 1632.4 26.83 | 0 | 162.9 2.68 | 1264.8 20.78 | 0 | 33.8 0.56 | 49.2 0.81 | 0 | 127.02 2.09 | 203.04 3.34 | 0 | 627.5 10.31 | 1502.3 24.69 | 373 6.13 |
| Total population in 2022, Mln (% of global) | 124.6 1.58 | 1849.6 23.38 | 0 | 180.9 2.29 | 1650.9 20.87 | 0 | 41.1 0.52 | 64.2 0.81 | 0 | 125 1.58 | 248.3 3.14 | 0 | 744.7 9.41 | 2196.7 27.77 | 684.6 8.65 |
| Energy intensity of GDP in 2000, TWh/USD | 5.03 × 10⁻⁹ | 7.67 × 10⁻⁹ | 0 | 1.05 × 10⁻⁸ | 2.25 × 10⁻⁸ | 0 | 6.38 × 10⁻⁹ | 5.22 × 10⁻⁹ | 0 | 1.48 × 10⁻⁹ | 9.11 × 10⁻⁹ | 0 | 9.97 × 10⁻⁸ | 1.34 × 10⁻⁷ | 2.09 × 10⁻⁸ |
| Energy intensity of GDP in 2022, TWh/USD | 3.14 × 10⁻⁹ | 4.57 × 10⁻⁹ | 0 | 7.02 × 10⁻⁹ | 1.16 × 10⁻⁸ | 0 | 3.89 × 10⁻⁹ | 2.86 × 10⁻⁹ | 0 | 1.04 × 10⁻⁹ | 5.08 × 10⁻⁹ | 0 | 6.8182 × 10⁻⁸ | 1.10 × 10⁻⁷ | 1.7 × 10⁻⁸ |
| Energy consumption per capita in 2000, kWh/person | 164,059.89 | 63,897.39 | 0 | 316,772.64 | 148,130.01 | 0 | 155 × 103 | 40 × 103 | 0 | 49 × 103 | 45 × 103 | 0 | 2508 × 103 | 643 × 103 | 40 × 103 |
| Energy consumption per capita in 2022, kWh/person | 127,952.80 | 101,002.47 | 0 | 261,273.95 | 176,685.97 | 0 | 150 × 103 | 37 × 103 | 0 | 40 × 103 | 53 × 103 | 0 | 2596 × 103 | 891 × 103 | 27 × 103 |
| Change in energy efficiency from 2000 to 2022: | |||||||||||||||
| -energy intensity of GDP, % | −37.70 | −40.42 | N/A | −33.05 | −48.32 | N/A | −38.97 | −45.22 | N/A | −30.00 | −44.24 | N/A | −31.63 | −17.76 | −17.04 |
| -energy consumption per capita, % | −22.01 | 58.07 | N/A | −17.52 | 19.28 | N/A | −3.31 | −7.99 | N/A | −18.12 | 18.36 | N/A | 3.51 | 38.51 | −33.53 |
Appendix C

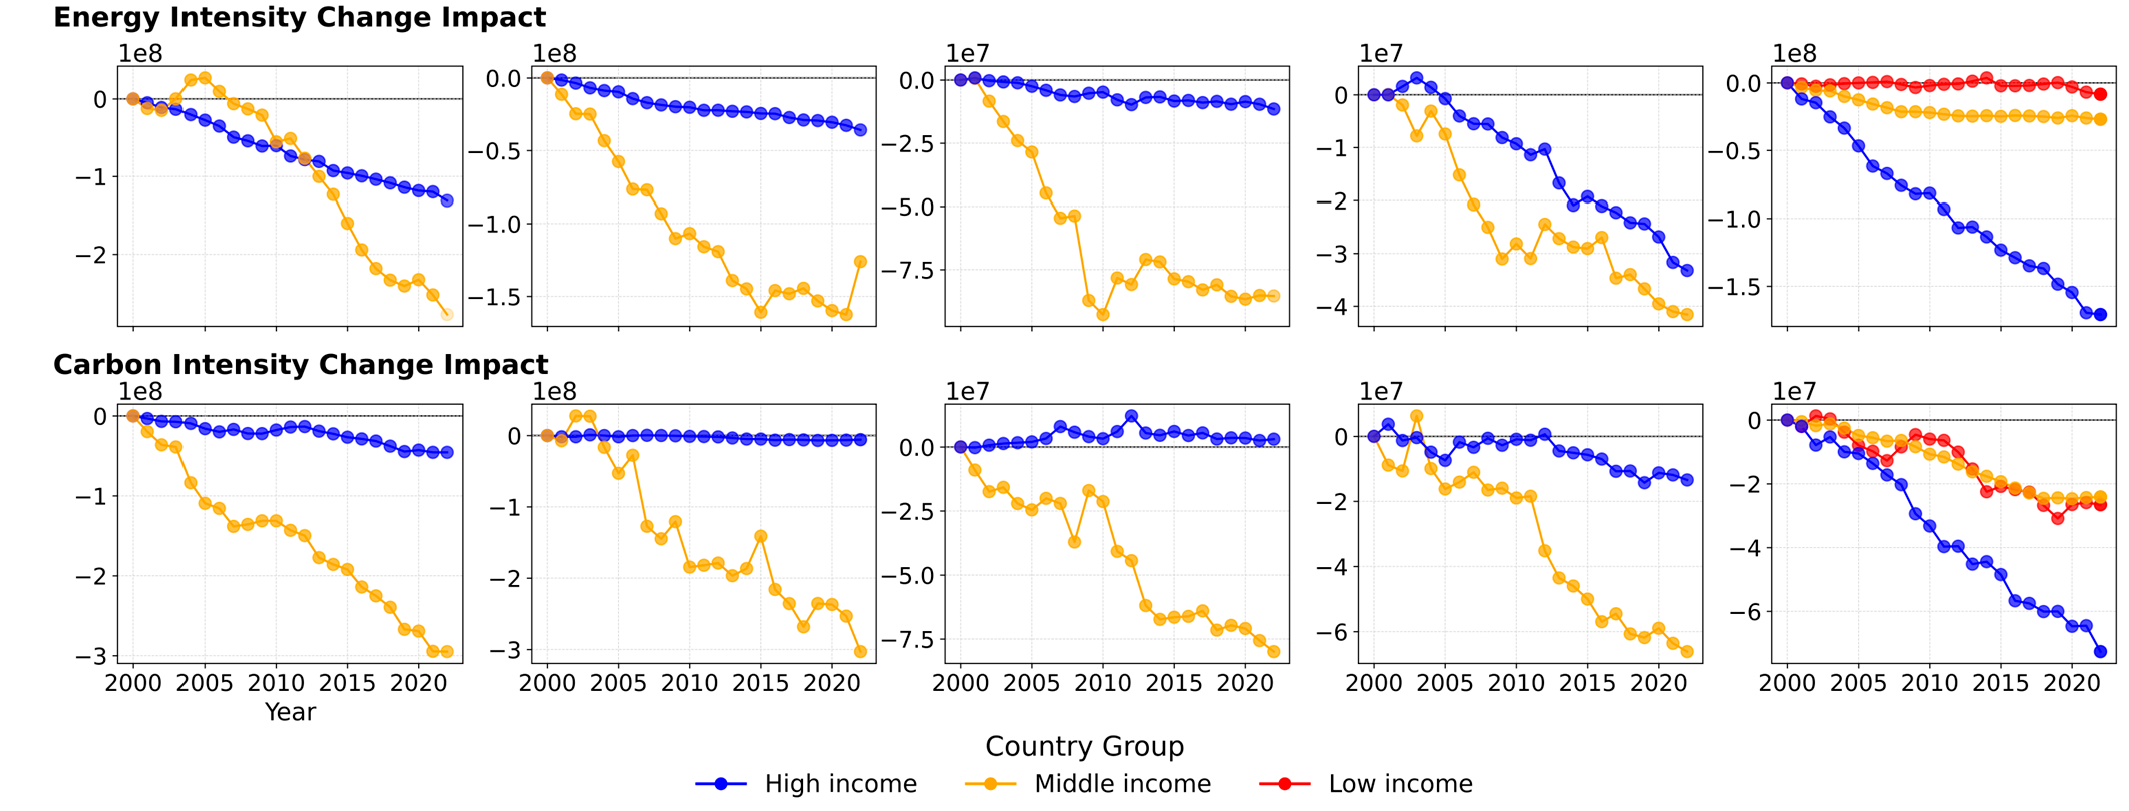
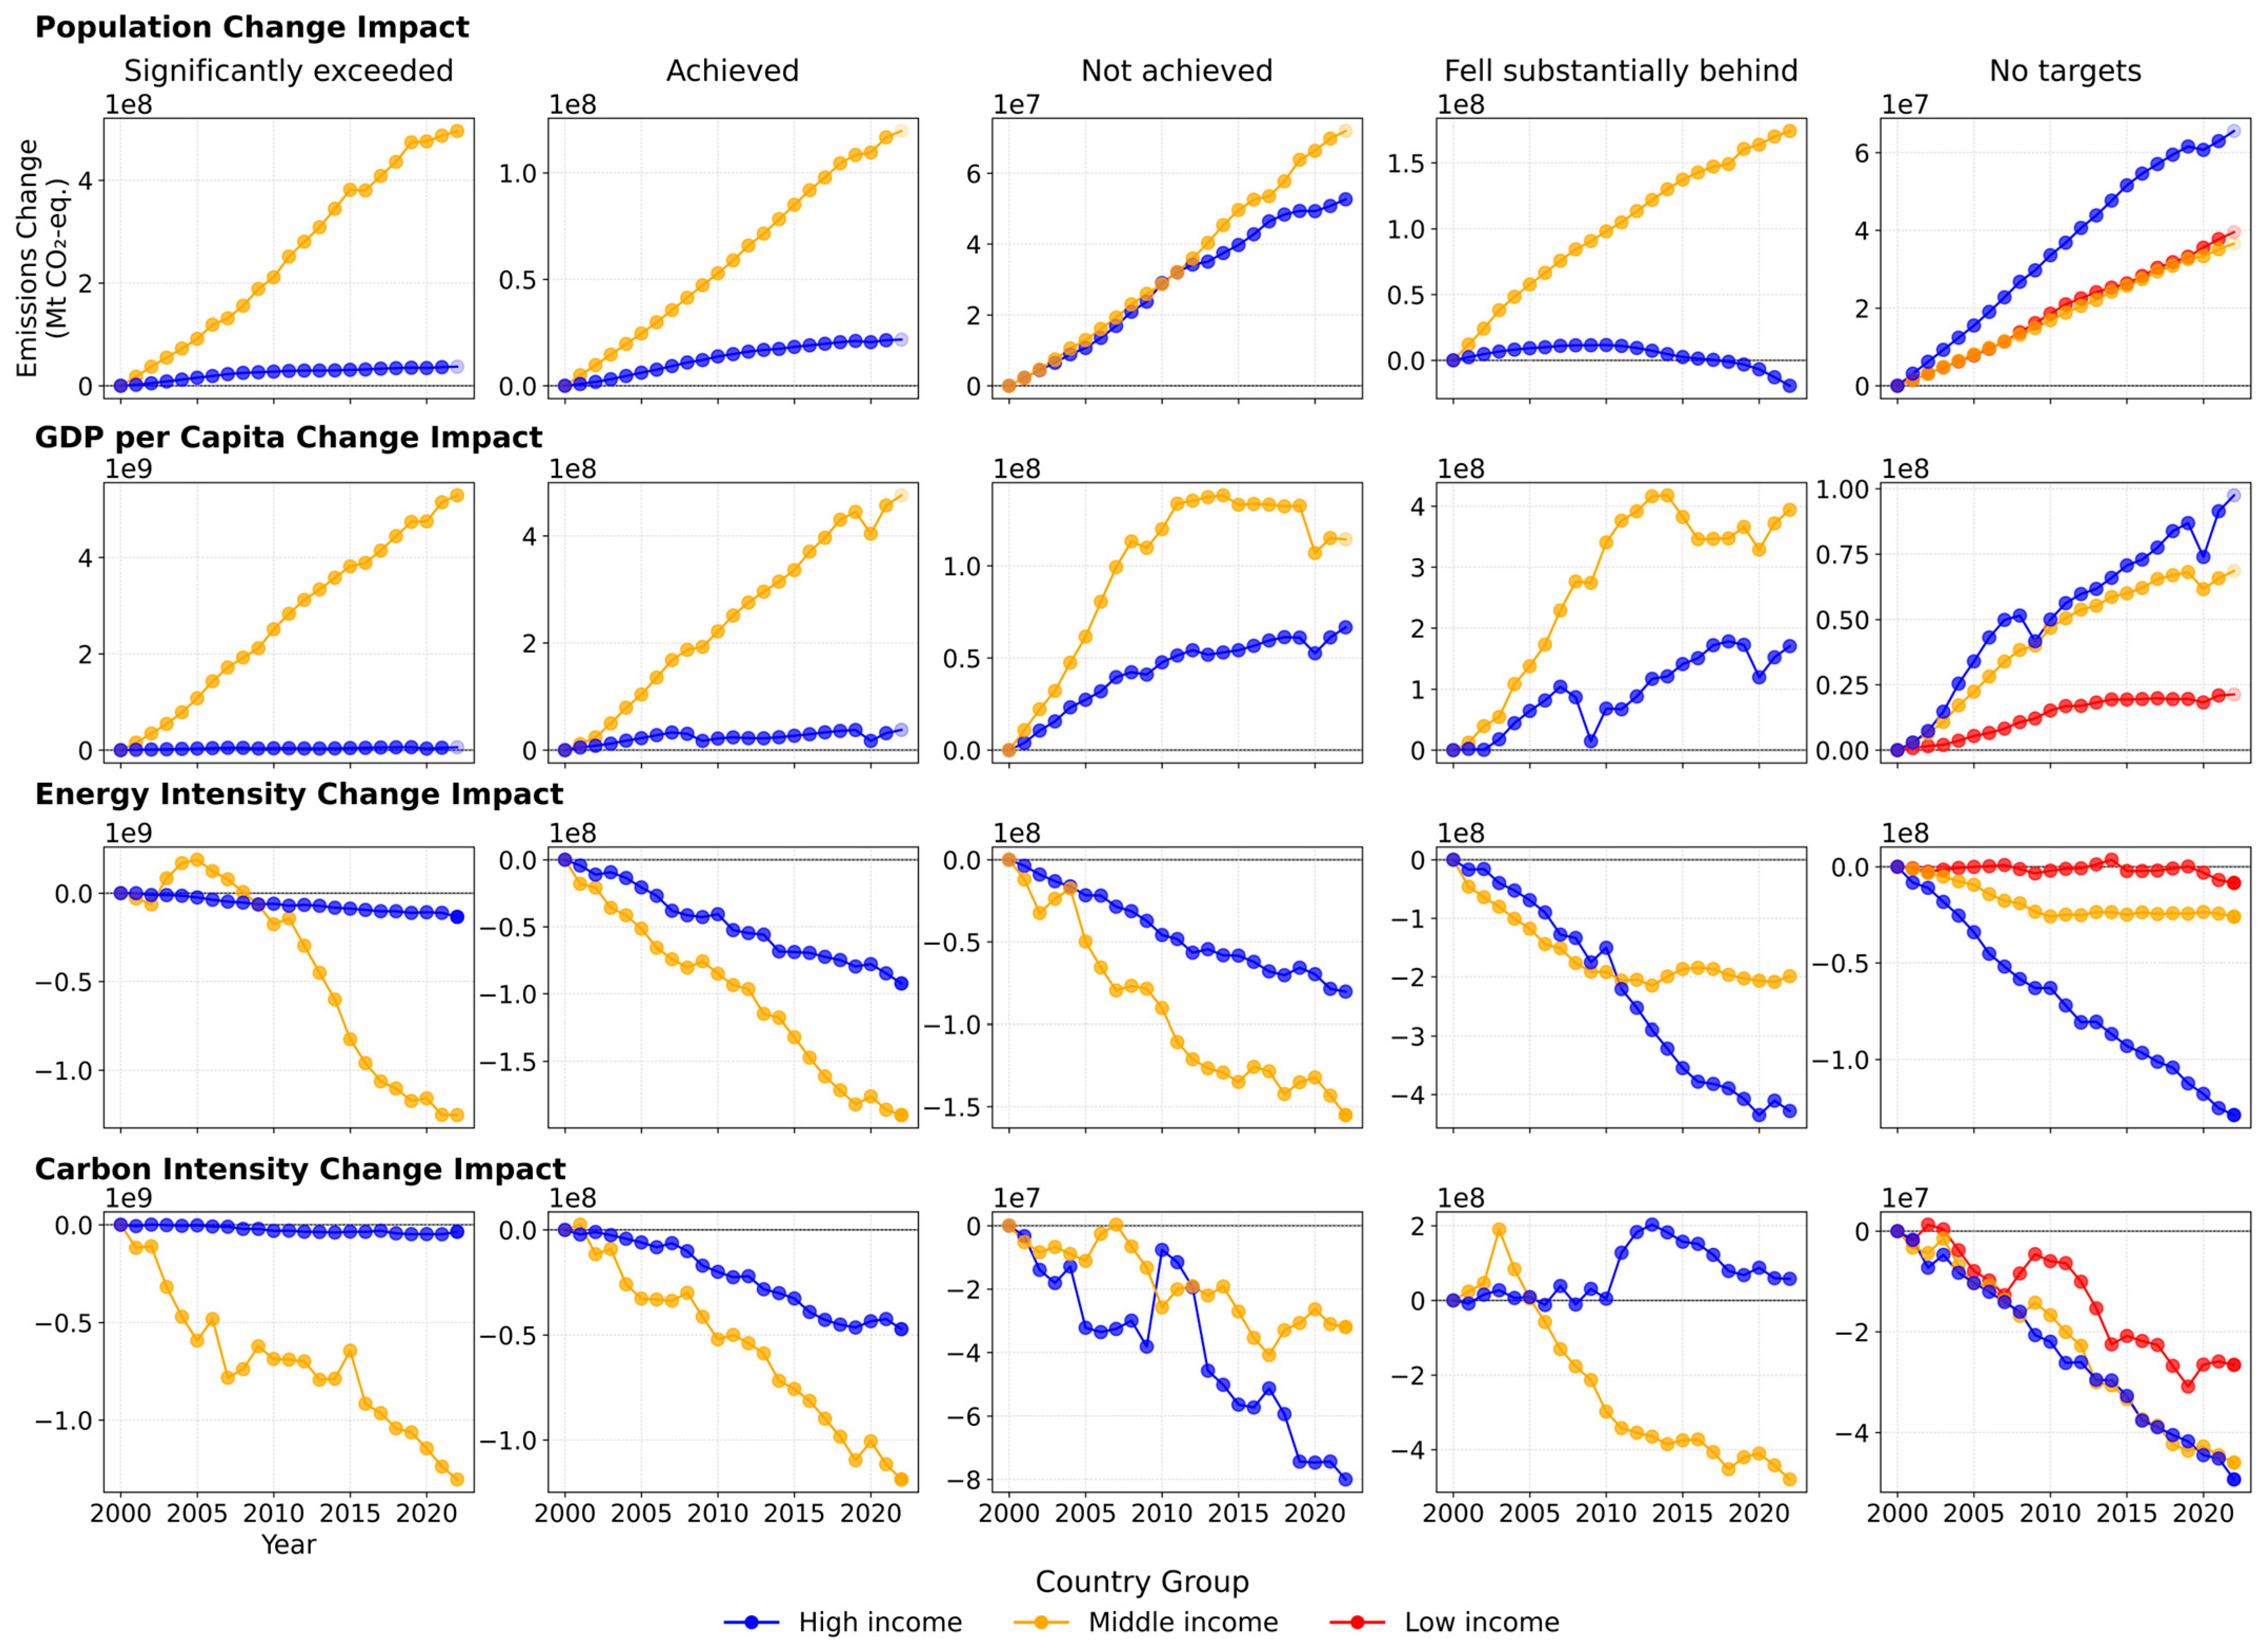
Appendix D

References
- Intergovernmental Panel on Climate Change (IPCC). Climate Change 2014: Synthesis Report; IPCC: Geneva, Switzerland, 2015. [Google Scholar]
- United Nations Climate Change (UNFCCC). The Kyoto Protocol. 1997. Available online: https://unfccc.int/kyoto_protocol (accessed on 9 May 2023).
- United Nations Climate Change (UNFCCC). The Paris Agreement. 2015. Available online: https://unfccc.int/process-and-meetings/the-paris-agreement/the-paris-agreement (accessed on 9 May 2023).
- COP26. COP21—The Glasgow Climate Pact. In Glasgow Climate Pact; UNFCCC: Glasgow, UK, 2021. [Google Scholar]
- Intergovernmental Panel on Climate Change (IPCC). Climate Change 2022: Mitigation of Climate Change. 2023. Available online: https://www.ipcc.ch/report/sixth-assessment-report-working-group-3/ (accessed on 14 October 2023).
- Hall, C.A.S.; Lambert, J.G.; Balogh, S.B. EROI of different fuels and the implications for society. Energy Policy 2014, 64, 141–152. [Google Scholar] [CrossRef]
- Smil, V. Energy and Civilization: A History; Reprint ed.; MIT Press: Cambridge, MA, USA, 2018. [Google Scholar]
- Epstein, A. Moral Case for Fossil Fuels; Portfolio Hardcover: New York, NY, USA, 2014. [Google Scholar]
- Gupta, J. The History of Global Climate Governance, 1st ed.; Cambridge University Press: Cambridge, UK, 2014. [Google Scholar]
- Fujimori, S.; Hasegawa, T.; Krey, V.; Riahi, K.; Bertram, C.; Bodirsky, B.L.; Bosetti, V.; Callen, J.; Després, J.; Doelman, J. A multi-model assessment of food security implications of climate change mitigation. Nat. Sustain. 2019, 2, 386–396. [Google Scholar] [CrossRef]
- Zheng, S.; Pu, Y.; Lu, H.; Zhang, J.J.; Wang, D.; Ma, X. Global climate policy effectiveness: A panel data analysis. J. Clean. Prod. 2023, 412, 137321. [Google Scholar] [CrossRef]
- Maslin, M.A.; Lang, J.; Harvey, F. A short history of the successes and failures of the international climate change negotiations. UCL Open Environ. 2023, 5, 8. [Google Scholar] [CrossRef]
- Meckling, J.; Allan, B.B. The evolution of ideas in global climate policy. Nat. Clim. Change 2020, 10, 434–438. [Google Scholar] [CrossRef]
- Climate Policy Initiative (CPI). Global Landscape of Climate Finance. A Decade of Data: 2011–2020. In Climate Policy Initiative; CPI: Durham, UK, 2022. [Google Scholar]
- Climate Policy Initiative (CPI). Global Landscape of Climate Finance 2023. 2023. Available online: https://www.climatepolicyinitiative.org/wp-content/uploads/2023/11/Global-Landscape-of-Climate-Finance-2023.pdf (accessed on 10 January 2024).
- IRENA and CPI. Global Landscape of Renewable Energy Finance; International Renewable Energy Agency: Abu Dhabi, United Arab Emirates, 2023. [Google Scholar]
- BloombergNEF. A Record $495 Billion Invested in Renewable Energy in 2022. 2023. Available online: https://about.bnef.com/blog/a-record-495-billion-invested-in-renewable-energy-in-2022/ (accessed on 14 April 2025).
- ÓhAiseadha, C.; Quinn, G.; Connolly, R.; Soon, W. An Evaluation of Global Climate Change Expenditure 2011–2018. Energy Clim. Policy 2020, 13, 4839. [Google Scholar]
- Gilmore, E.A.; Buhaug, H. Climate mitigation policies and the potential pathways to conflict: Outlining a research agenda. WIREs Clim. Change 2021, 12, e722. [Google Scholar] [CrossRef]
- Morenov, V.; Leusheva, E.; Buslaev, G.; Gudmestad, O.T. System of Comprehensive Energy-Efficient Utilization of Associated Petroleum Gas with Reduced Carbon Footprint in the Field Conditions. Energies 2020, 13, 4921. [Google Scholar] [CrossRef]
- Cherepovitsyn, A.; Kazanin, A.; Rutenko, E. Strategic Priorities for Green Diversification of Oil and Gas Companies. Energies 2023, 16, 4985. [Google Scholar] [CrossRef]
- Zhukovskiy, Y.; Koshenkova, A.; Vorobeva, V.; Rasputin, D.; Pozdnyakov, R. Assessment of the Impact of Technological Development and Scenario Forecasting of the Sustainable Development of the Fuel and Energy Complex. Energies 2023, 16, 3185. [Google Scholar] [CrossRef]
- Martirosyan, A.; Ilyushin, Y.; Afanaseva, O.; Kukharova, T.; Asadulagi, M.; Khloponina, V. Development of an Oil Field’s Conceptual Model. Int. J. Eng. 2025, 38, 381–388. [Google Scholar] [CrossRef]
- Intergovernmental Panel on Climate Change (IPCC). About the IPCC. 2024. Available online: https://www.ipcc.ch/about/ (accessed on 15 May 2024).
- International Energy Agency (IEA). About. 2024. Available online: https://www.iea.org/about (accessed on 15 May 2024).
- Climate Portal. MIT Climate. 2024. Available online: https://climate.mit.edu/ (accessed on 15 May 2024).
- Girardin, C.A.; Jenkins, S.; Seddon, N.; Allen, M.; Lewis, S.L.; Wheeler, C.E.; Griscom, B.W.; Malhi, Y. Nature-based solutions can help cool the planet—If we act now. Nature 2021, 593, 191–194. [Google Scholar] [CrossRef] [PubMed]
- Lewis, S.L.; Wheeler, C.E.; Mitchard, E.T.; Koch, A. Restoring natural forests is the best way to remove atmospheric carbon. Nature 2019, 568, 25–28. [Google Scholar] [CrossRef]
- Palmer, L. How trees and forests reduce risks from climate change. Nat. Clim. Change 2021, 11, 374–377. [Google Scholar] [CrossRef]
- Vivanco, D.; Kemp, R.; van der Voet, E. The Relativity of Eco-Innovation: Environmental Rebound Effects from Past Transport Innovations in Europe. J. Clean. Prod. 2015, 101, 71–85. [Google Scholar] [CrossRef]
- McCauley, D.; Heffron, R. Just Transition: Integrating Climate 2018, Energy and Environmental Justice. Energy Policy 2018, 117, 1–7. [Google Scholar] [CrossRef]
- Brook, B.W.; Blees, T.; Wigley, T.M.L.; Hong, S. Silver Buckshot or Bullet: Is a Future “Energy Mix” Necessary? Sustainability 2018, 10, 302. [Google Scholar] [CrossRef]
- Samarakoon, S.; Munro, P.; Zalengera, C.; Kearnes, M. The Afterlives of Off-Grid Solar: The Dynamics of Repair and E-Waste in Malawi. Environ. Innov. Soc. Transit. 2022, 42, 317–330. [Google Scholar] [CrossRef]
- Cava, E.; Padua, E.; Campaci, D.; Bernardi, M.; Muthanna, F.; Caprio, M.; Lombardo, M. Investigating the Health Implications of Whey Protein Consumption: A Narrative Review of Risks, Adverse Effects, and Associated Health Issues. Healthcare 2024, 12, 246. [Google Scholar] [CrossRef]
- van den Bergh, J.; Folke, C.; Polasky, S.; Scheffer, M.; Steffen, W. What If Solar Energy Becomes Really Cheap? A Thought Experiment on Environmental Problem Shifting. Curr. Opin. Environ. Sustain. 2015, 14, 170–179. [Google Scholar] [CrossRef]
- Connolly, M.; Connolly, R.; Soon, W.; Moore, P.; Connolly, I. Analysis of Greenpeace Business Model; Heartland Institute: Arlington Heights, IL, USA, 2018. [Google Scholar]
- Extinction Rebellion. His Is Not a Drill: An Extinction Rebellion Handbook, 1st ed.; Penguin: New York, NY, USA, 2019. [Google Scholar]
- Thunberg, G. No One Is Too Small to Make a Difference, 1st ed.; Penguin: London, UK, 2019. [Google Scholar]
- Friedman, L. What Is the Green New Deal? A Climate Proposal, Explained. 2019. Available online: https://www.nytimes.com/2019/02/21/climate/green-new-deal-questions-answers.html (accessed on 3 March 2024).
- UNEP. Towards a Green Economy: Pathways to Sustainable Development and Poverty Eradication; UNEP: Nairobi, Kenya, 2011. [Google Scholar]
- Carmack, M.; Dolšak, N.; Prakash, A. Electoral appeal of climate policies: The Green New Deal and the 2020 U.S. House of Representatives elections. PLoS Clim. 2020, 1, e0000043. [Google Scholar] [CrossRef]
- Esty, D.C. A Better Planet. In Forty Big Ideas for a Sustainable Future; Yale University Press: New Haven, CT, USA, 2020. [Google Scholar]
- Schneider, S.H. Encyclopedia of Climate and Weather; Oxford University Press: Oxford, UK, 1996; p. 929. [Google Scholar]
- Dryzek, J.S.; Norgaard, R.B.; Schlosberg, D. The Oxford Handbook of Climate Change and Society; Oxford University Press: Oxford, UK, 2013. [Google Scholar]
- Helm, D.; Hepburn, C. (Eds.) The Economics and Politics of Climate Change; Oxford University Press: Oxford, UK, 2009. [Google Scholar]
- Maslin, M. Climate Change: A Very Short Introduction; Oxford University Press: Oxford, UK, 2021; p. 160. [Google Scholar]
- Intergovernmental Panel on Climate Change (IPCC). Annex I: Glossary; Matthews, J.B.R., Ed.; Cambridge University Press: Cambridge, UK; New York, NY, USA, 2018. [Google Scholar]
- CANEECCA: Climate Action Network Eastern Europe, Caucasus and Central Asia (EECCA). Climate Policy. 2021. Available online: https://caneecca.org/en/activities/climate-policy/ (accessed on 1 June 2024).
- IEA. Climate Resilience Policy Indicator. 2022. Available online: https://www.iea.org/reports/climate-resilience-policy-indicator (accessed on 1 June 2024).
- Pielke, R.A. Misdefining “climate change”: Consequences for science and action. Environ. Sci. Policy 2005, 8, 548–561. [Google Scholar] [CrossRef]
- UNFCCC. Day 4: Putting Adaptation and Resilience at the Centre of COP27. 2022. Available online: https://climatechampions.unfccc.int/day-4-putting-adaptation-and-resilience-at-the-centre-of-cop27/ (accessed on 15 May 2024).
- Climate Policy Database. Climate Policy Database. 2023. Available online: https://climatepolicydatabase.org/ (accessed on 3 March 2024).
- UNEP. Emissions Gap Report 2023; UNEP: Nairobi, Kenya, 2023. [Google Scholar]
- International Energy Agency (IEA). CO2 Emissions in 2023; IEA: Paris, France, 2024. [Google Scholar]
- Tsvetkov, P.; Samuseva, P.; Nikolaychu, L. The research of the impact of energy efficiency on mitigating greenhouse gas emissions at the national level. Energy Convers. Manag. 2024, 314, 118671. [Google Scholar]
- Dada, M.; Popoola, P. Recent advances in solar photovoltaic materials and systems for energy storage applications: A review. Beni-Suef Univ. J. Basic Appl. Sci. 2023, 12, 66. [Google Scholar] [CrossRef]
- Solar Power World. Can your Solar Project Weather a Hailstorm? 2020. Available online: https://www.solarpowerworldonline.com/2020/12/can-your-solar-project-weather-a-hailstorm/ (accessed on 15 May 2024).
- Butler, P. Newfoundland Power Warns of ‘Elevated’ Supply Risk Given Problems Facing Hydro Grid. 2023. Available online: https://www.cbc.ca/news/canada/newfoundland-labrador/newfoundland-power-concerns-hydro-outages-1.7058994 (accessed on 15 May 2024).
- CSIRO. Solar Power and Extreme Weather in Australia. 2020. Available online: https://www.csiro.au/en/news/All/Articles/2020/March/solar-power-and-extreme-weather-in-australia (accessed on 15 May 2024).
- Sokołowski, M.M.; Heffron, R.J. Defining and conceptualising energy policy failure: The when, where, why, and how. Energy Policy 2022, 161, 112745. [Google Scholar] [CrossRef]
- NASA. Scientific Consensus. 2023. Available online: https://science.nasa.gov/climate-change/scientific-consensus/ (accessed on 14 April 2025).
- Jenkins, J.; Luke, M.; Thernstrom, S. Getting to Zero Carbon Emissions in the Electric Power Sector. Joule 2018, 2, 2498–2510. [Google Scholar] [CrossRef]
- Trifu, A.; Smîdu, E.; Badea, D.O.; Bulboacă, E.; Haralambie, V. Applying the PRISMA method for obtaining systematic reviews of occupational safety issues in literature search. MATEC Web Conf. 2022, 354, 00052. [Google Scholar] [CrossRef]
- OWD. Greenhouse Gas Emissions. 2024. Available online: https://ourworldindata.org/greenhouse-gas-emissions (accessed on 10 February 2025).
- OWD. Annual Greenhouse Gas Emissions from Fossil Fuels and Industry. 2024. Available online: https://ourworldindata.org/grapher/total-ghg-emissions-excluding-lufc (accessed on 10 February 2025).
- OWD. CO2 Emissions. 2024. Available online: https://ourworldindata.org/co2-emissions (accessed on 10 February 2025).
- OWD. Carbon Intensity: CO2 Emissions per Dollar of GDP | GCB. 2023. Available online: https://ourworldindata.org/grapher/co2-intensity?tab=table&time=1950..latest (accessed on 10 February 2025).
- OWD. Annual Methane Emissions Including Land Use. 2024. Available online: https://ourworldindata.org/grapher/methane-emissions. (accessed on 10 February 2025).
- OWD. Gross Domestic Product (GDP) | In Constant International-$. Historical Data—Maddison Project Database. 2023. Available online: https://ourworldindata.org/grapher/gdp-maddison-project-database?tab=table&time=1820.latest (accessed on 10 February 2025).
- OWD. Renewable Energy. 2024. Available online: https://ourworldindata.org/renewable-energy (accessed on 10 February 2025).
- Worldbank. Renewable Energy Consumption (% of Total Final Energy Consumption). 2023. Available online: https://data.worldbank.org/indicator/EG.FEC.RNEW.ZS (accessed on 10 February 2025).
- OWD. Share of Primary Energy Consumption That Comes from Renewables. 2024. Available online: https://ourworldindata.org/grapher/renewable-share-energy (accessed on 10 February 2025).
- OWD. Share of Electricity Generated by Renewables. 2024. Available online: https://ourworldindata.org/grapher/share-electricity-renewables (accessed on 10 February 2025).
- Eurostat. Complete Energy Balances. 2025. Available online: https://ec.europa.eu/eurostat/databrowser/view/nrg_bal_c__custom_12660696/default/table (accessed on 10 February 2025).
- EIA. Primary Energy. 2024. Available online: https://www.eia.gov/international/data/world/other-statistics/more-other-statistics-data?pd=44&p=000000001&u=3&f=A&v=mapbubble&a=-&i=none&vo=value&t=C&g=00000000000000000000000000000000000000000000000001&l=249-ruvvvvvfvtvnvv1vrvvvvfvvvvvvfvvvou20evvvvvvvv (accessed on 10 February 2025).
- OWD. Primary Energy Consumption per GDP. 2024. Available online: https://ourworldindata.org/grapher/energy-intensity (accessed on 10 February 2025).
- OWD. Nuclear Energy. 2024. Available online: https://ourworldindata.org/nuclear-energy (accessed on 10 February 2025).
- Trading Economics. Capacity Utilization. 2025. Available online: https://tradingeconomics.com/country-list/capacity-utilization (accessed on 10 February 2025).
- OWD. Population. 2024. Available online: https://ourworldindata.org/grapher/population (accessed on 10 February 2025).
- OWD. GDP per Capita in Constant International-$—World Bank. 2024. Available online: https://ourworldindata.org/grapher/gdp-per-capita-worldbank?tab=table#sources-and-processing (accessed on 10 February 2025).
- EIA. Electricity. 2024. Available online: https://www.eia.gov/international/data/world/other-statistics/more-other-statistics-data?pd=2&p=000000000000000000000000000008&u=1&f=A&v=mapbubble&a=-&i=none&vo=value&t=C&g=00000000000000000000000000000000000000000000000001&l=249-ruvvvvvfvtvnvv1vrvvvvfvvv (accessed on 10 February 2025).
- OWD. Per Capita Greenhouse Gas Emissions Including Land Use. 2024. Available online: https://ourworldindata.org/grapher/per-capita-ghg-emissions?time=latest (accessed on 10 February 2025).
- OWD. Carbon Intensity of Energy Production | GCB. 2024. Available online: https://ourworldindata.org/grapher/co2-per-unit-energy?tab=table (accessed on 10 February 2025).
- OWD. Carbon Intensity of Electricity Generation | Ember and Energy Institute. 2024. Available online: https://ourworldindata.org/grapher/carbon-intensity-electricity?tab=table (accessed on 10 February 2025).
- Our World in Data. Research and Data to Make Progress Against the World’s Largest Problems. 2025. Available online: https://ourworldindata.org/ (accessed on 10 February 2025).
- EIA. Environment. 2025. Available online: https://www.eia.gov/environment/reports.php#/T76 (accessed on 10 February 2025).
- Berner, A.; Bruns, S.; Moneta, A.; Stern, D. Do energy efficiency improvements reduce energy use? Empirical evidence on the economy-wide rebound effect in Europe and the United States. Energy Econ. 2022, 110, 105939. [Google Scholar] [CrossRef]
- Wang, Y.; Su, X.; Cai, X.; Yu, J. The Dual Carbon Emission Effects of Digital Economy: Evidence from China. Heliyon 2025, 11, e42554. [Google Scholar] [CrossRef]
- IEA. World Energy Outlook 2024. Paris. 2024. Available online: https://www.iea.org/reports/world-energy-outlook-2024 (accessed on 20 December 2024).
- Filonchyk, M.; Peterson, M.P.; Yan, H.; Gusev, A.; Zhang, L.; He, Y.; Yang, S. Greenhouse gas emissions and reduction strategies for the world’s largest greenhouse gas emitters. Sci. Total Environ. 2024, 944, 173895. [Google Scholar] [CrossRef]
- International Renewable Energy Agency (IRENA). World Energy Transitions Outlook 2024: 1.5 °C Pathway; IRENA: Abu Dhabi, United Arab Emirates, 2024. [Google Scholar]
- Aslanidis, N.; Iranzo, S. Environment and development: Is there a Kuznets curve for CO2 emissions? Appl. Econ. 2009, 41, 803–810. [Google Scholar] [CrossRef]
- Villar, J.; Meijide, B.; Penela, A.; Hidalgo, S. Carbonfeel Project: Calculation, Verification, Certification and Labeling of the Carbon Footprint. Low Carbon Econ. 2014, 5, 65–79. [Google Scholar] [CrossRef][Green Version]
- Obiora, S.; Zeng, Y.; Li, Q.; Asiedu-Ayeh, E.; Nneji, G.U.; Bamisile, O. The economic growth and environmental sustainability nexus: A metanalysis of three economic types. J. Environ. Plan. Manag. 2021, 65, 2556–2586. [Google Scholar] [CrossRef]
- Wang, X. Correlation analysis of energy consumption, carbon emissions and economic growth. Energy Inform. 2024, 7, 45. [Google Scholar] [CrossRef]
- Osobajo, O.; Otitoju, A.; Otitoju, M.; Oke, A. The Impact of Energy Consumption and Economic Growth on Carbon Dioxide Emissions. Sustainability 2020, 12, 7965. [Google Scholar] [CrossRef]
- Ma, D.; Xiao, Y.; Guo, Z. Environmental regulation, technological progress and carbon emission efficiency: An empirical analysis based on panel data of Chinese provinces. Oppor. Chall. Sustain. 2022, 1, 38–51. [Google Scholar] [CrossRef]
- Liu, M. Economic Development Efficiency Based on Tobit Model: Guided by Sustainable Development. Int. J. Adv. Comput. Sci. Appl. 2023, 14, 1006–1015. [Google Scholar] [CrossRef]
- Hoffman, M.; Gelman, A. The No-U-Turn Sampler: Adaptively Setting Path Lengths. J. Mach. Learn. Res. 2014, 15, 1593–1623. [Google Scholar]
- Kaya, Y.; Yokobori, K. Environment, Energy, and Economy: Strategies for Sustainability; United Nations University Press: Tokyo, Japan; New York, NY, USA; Paris, France, 1997. [Google Scholar]
- Ang, B.W. LMDI decomposition approach: A guide for implementation. Energy Policy 2015, 86, 233–238. [Google Scholar] [CrossRef]
- Metreau, E.; Young, K.; Eapen, S. World Bank Country Classifications by Income Level for 2024–2025. 2024. Available online: https://blogs.worldbank.org/en/opendata/world-bank-country-classifications-by-income-level-for-2024-2025 (accessed on 16 April 2025).
- United Nations. Climate Reports. 2024. Available online: https://www.un.org/en/climatechange/reports (accessed on 15 February 2025).
- Black, S.; Jaumotte, F.; Ananthakrishnan, P. World Needs More Policy Ambition, Private Funds, and Innovation to Meet Climate Goals. 2023. Available online: https://www.imf.org/en/Blogs/Articles/2023/11/27/world-needs-more-policy-ambition-private-funds-and-innovation-to-meet-climate-goals (accessed on 15 February 2025).
- Roscongress. The Climate Agenda as a New Regulatory Mechanism and the Basis for the Formation of a Multipolar Model of Global Development. 2024. Available online: https://roscongress.org/materials/klimaticheskaya-povestka-kak-novyy-mekhanizm-regulirovaniya-i-osnova-dlya-formirovaniya-mnogopolyarn/ (accessed on 15 February 2025).
- Garcia-Vega, S.; Hoepner, A.G.F.; Rogelj, J.; Schiemann, F. Abominable greenhouse gas bookkeeping casts serious doubts on climate intentions of oil and gas companies. arXiv 2023, arXiv:2305.11906. [Google Scholar]
- Bank of Russia. Consultation paper. In Climate Risks in Changing Economic Conditions; Central Bank of the Russian Federation: Moscow, Russia, 2022. [Google Scholar]
- Dong, B.; Ma, X.; Zhang, Z.; Zhang, H.; Chen, R.; Song, Y.; Shen, M.; Xiang, R. Carbon emissions, the industrial structure and economic growth: Evidence from heterogeneous industries in China. Environ. Pollut. 2020, 262, 114322. [Google Scholar] [CrossRef] [PubMed]
- Zhang, Z.; Sharifi, A. Analysis of decoupling between CO2 emissions and economic growth in China’s provincial capital cities: A Tapio model approach. Urban Clim. 2024, 55, 101885. [Google Scholar] [CrossRef]
- Seetharaman; Moorthy, K.; Patwa, N.; Saravanan; Gupta, Y. Breaking barriers in deployment of renewable energy. Heliyon 2019, 5, e01166. [Google Scholar] [CrossRef] [PubMed]
- Zhang, S.; Xu, G.; Shu, Y.; Zhu, J.; Cheng, W. Comparing developed and emerging nations’ Economic development with environmental footprint for low-carbon competitiveness. Heliyon 2024, 10, e34039. [Google Scholar] [CrossRef]
- Sener, S.; Karakas, A.T. The effect of economic growth on energy efficiency: Evidence from high, upper-middle and lower-middle income countries. Procedia Comput. Sci. 2019, 158, 523–532. [Google Scholar] [CrossRef]
- Waisman, C. Bayesian estimation of finite mixtures of Tobit models. arXiv 2024, arXiv:2411.09771. [Google Scholar]
- Febo, D.E.; Angelini, E.; Le, T. From Transition Risks to the Relationship between Carbon Emissions, Economic Growth, and Renewable Energy. Risks 2023, 11, 210. [Google Scholar] [CrossRef]
- Rzazade, U.; Deryabin, S.; Temkin, I.; Kondratev, E.; Ivannikov, A. On the issue of the creation and functioning of energy efficiency management systems for technological processes of mining enterprises. Energies 2023, 16, 4878. [Google Scholar] [CrossRef]
- Romasheva, N.V.; Babenko, M.A.; Nikolaichuk, L.A. Sustainable development of the Russian Arctic region: Environmental problems and ways to solve them. MIAB. Min. Inf. Anal. Bull. 2022, 10, 78–87. [Google Scholar] [CrossRef]
- The World Bank Group. World Bank Open Data. 2022. Available online: https://data.worldbank.org/?intcid=ecr_hp_BeltC_en_ext (accessed on 15 June 2024).
- Khajehpour; Saboohi, Y.; Tsatsaronis, G. On the fair accounting of carbon emissions in the global system using an exergy cost formation concept. J. Clean. Prod. 2021, 280, 124438. [Google Scholar] [CrossRef]
- Kulikova, A.A. A new approach to estimating emissions from mining enterprises, taking into account the carbon footprint. Sustain. Dev. Mt. Territ. 2023, 15, 825–832. [Google Scholar] [CrossRef]
- Mielke, J.; Steudle, G. Green Investment and Coordination Failure: An Investors’ Perspective. Ecol. Econ. 2018, 150, 88–95. [Google Scholar] [CrossRef]
- Iozzelli, L. Fostering transparency? Analysing information disclosure in transnational regulatory climate initiatives. Earth Syst. Gov. 2023, 18, 100189. [Google Scholar] [CrossRef]
- Hsu, A.; Höhne, N.; Kuramochi, T.; Roelfsema, M.; Weinfurter, A.; Xie, Y.; Widerberg, O. A research roadmap for quantifying non-state and subnational climate mitigation action. Nat. Clim. Change 2019, 9, 11–17. [Google Scholar] [CrossRef]
- Ulanov, V.L.; Skorobogatko, O.N. Impact of EU carbon border adjustment mechanismon the economic efficiency of Russian oil refining. J. Min. Inst. 2022, 257, 865–876. [Google Scholar]
- Hale, T.N.; Chan, S.; Hsu, A.; Clapper, A.; Elliott, C.; Faria, P.; Kuramochi, T.; McDaniel, S.; Morgado, M.; Roelfsema, M.; et al. Sub- and non-state climate action: A framework to assess progress, implementation and impact. Clim. Policy 2021, 21, 406–420. [Google Scholar] [CrossRef]
- Litvinenko, V.S.; Petrov, E.I.; Vasilevskaya, D.V.; Yakovenko, A.V.; Naumov, I.A.; Ratnikov, M.A. Assessment of the role of the state in the management of mineral resources. J. Min. Inst. 2023, 259, 95–111. [Google Scholar] [CrossRef]
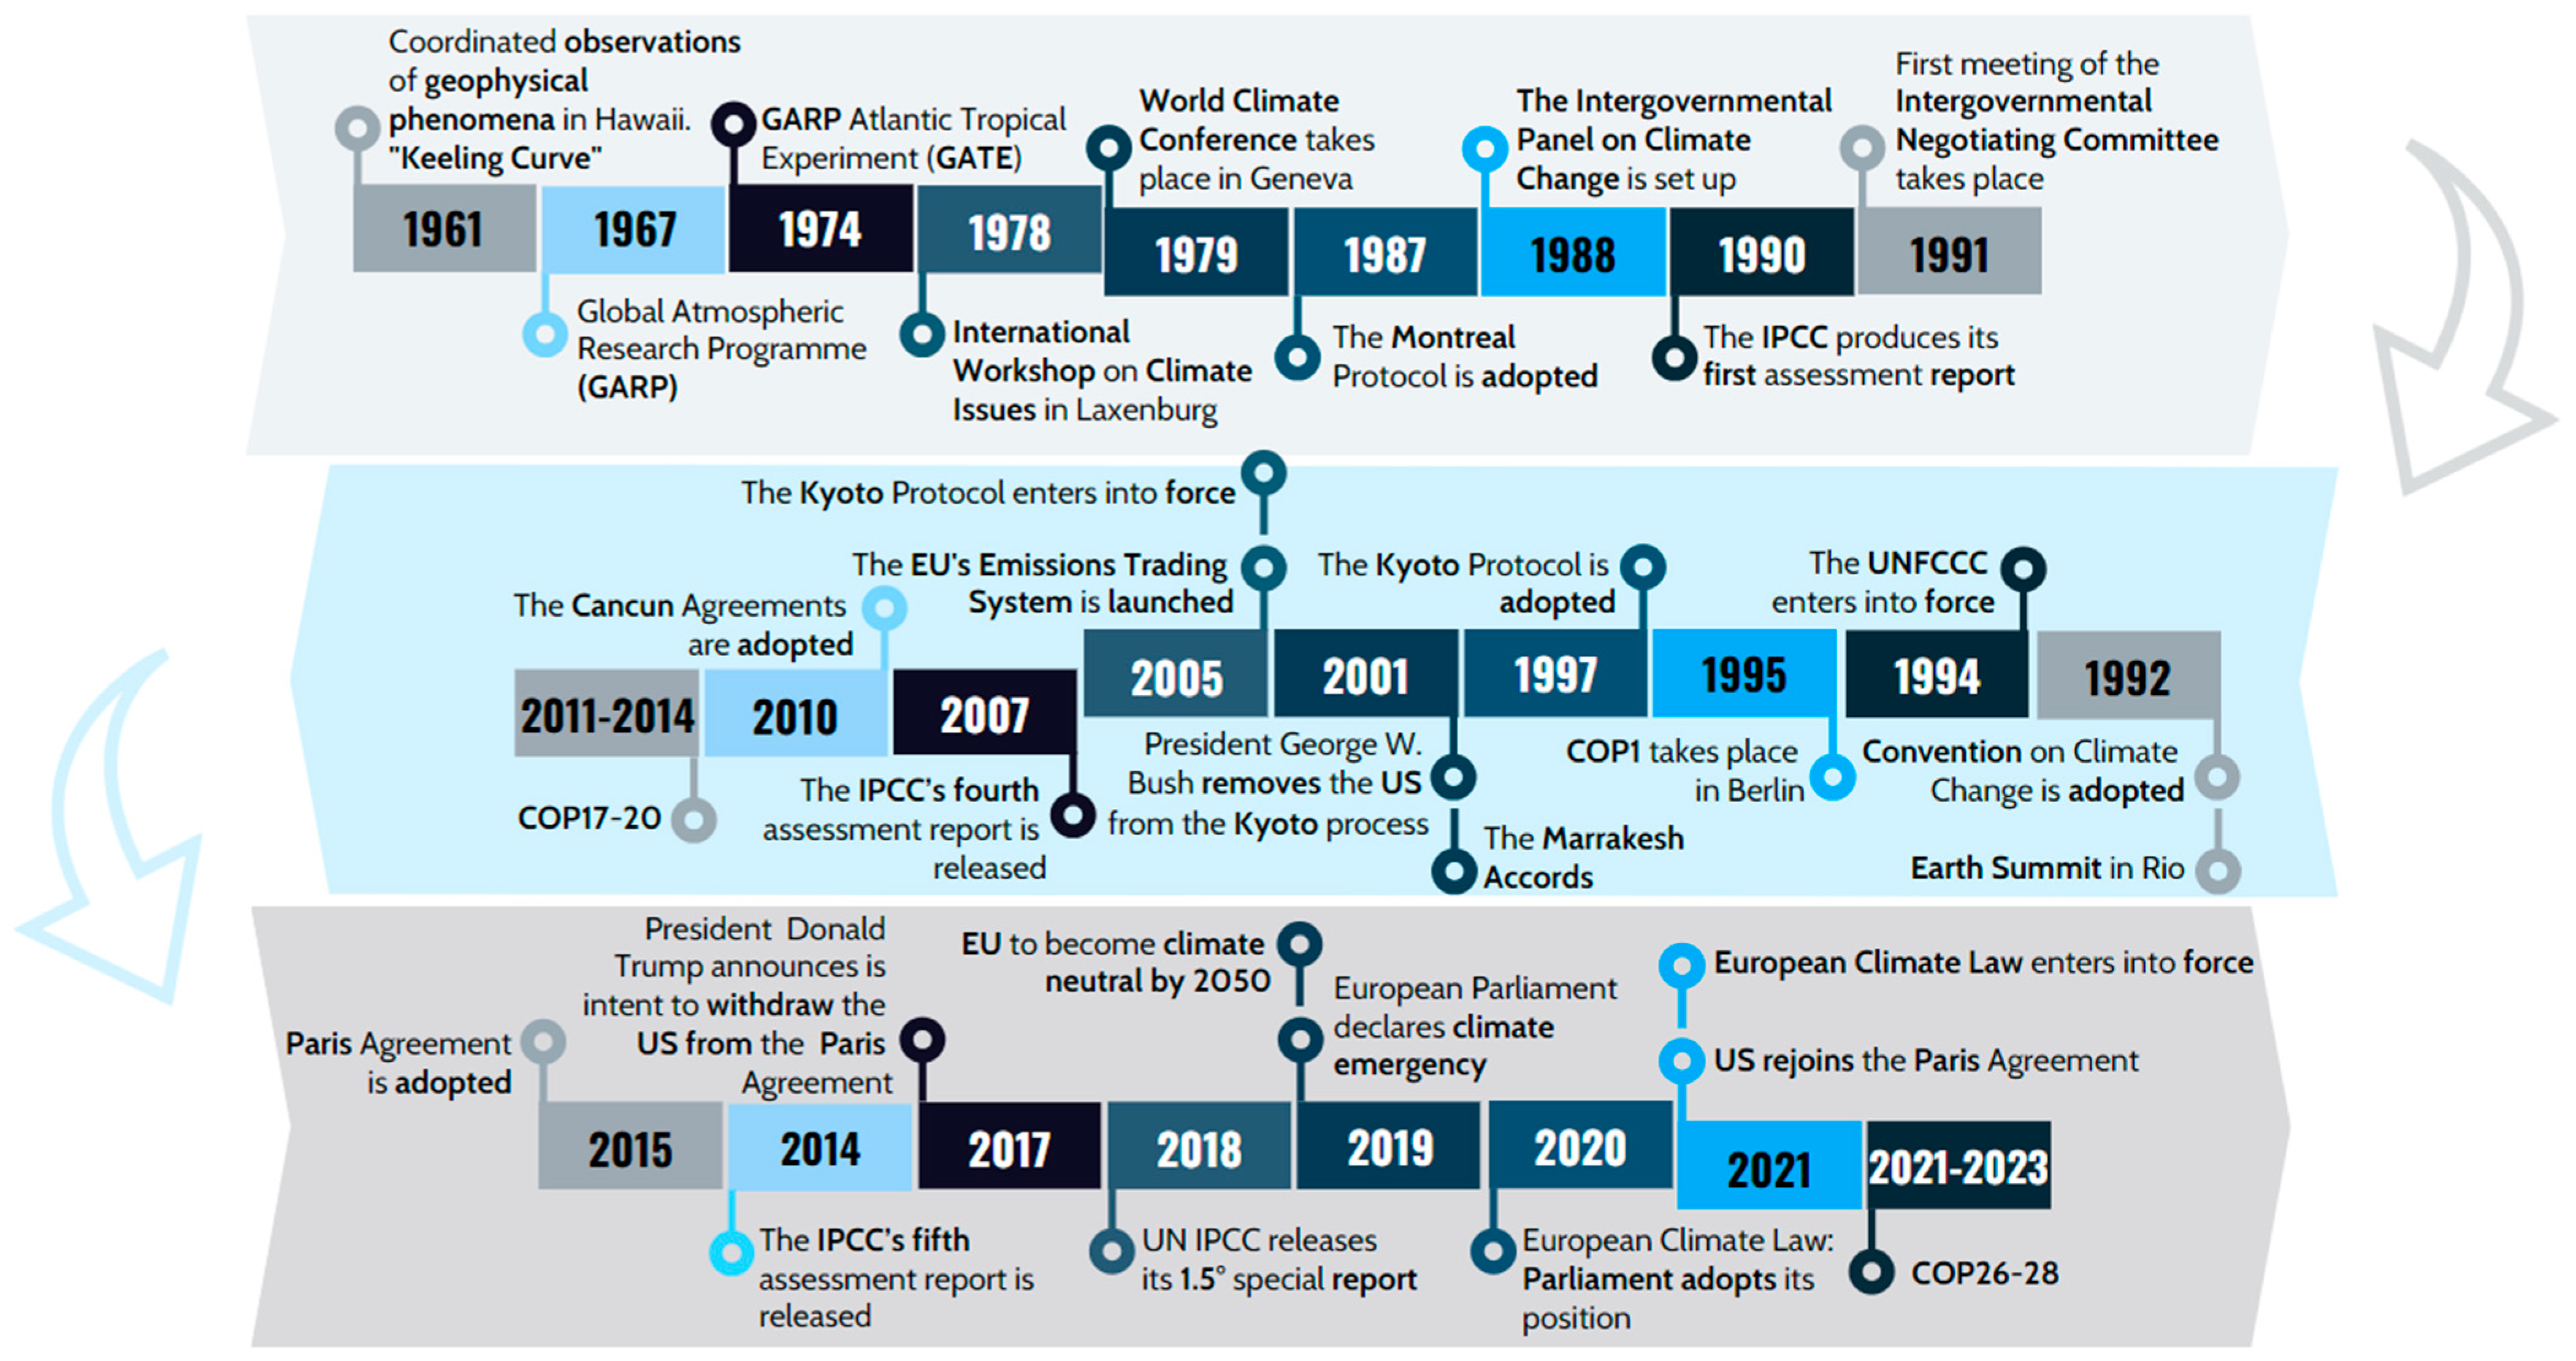
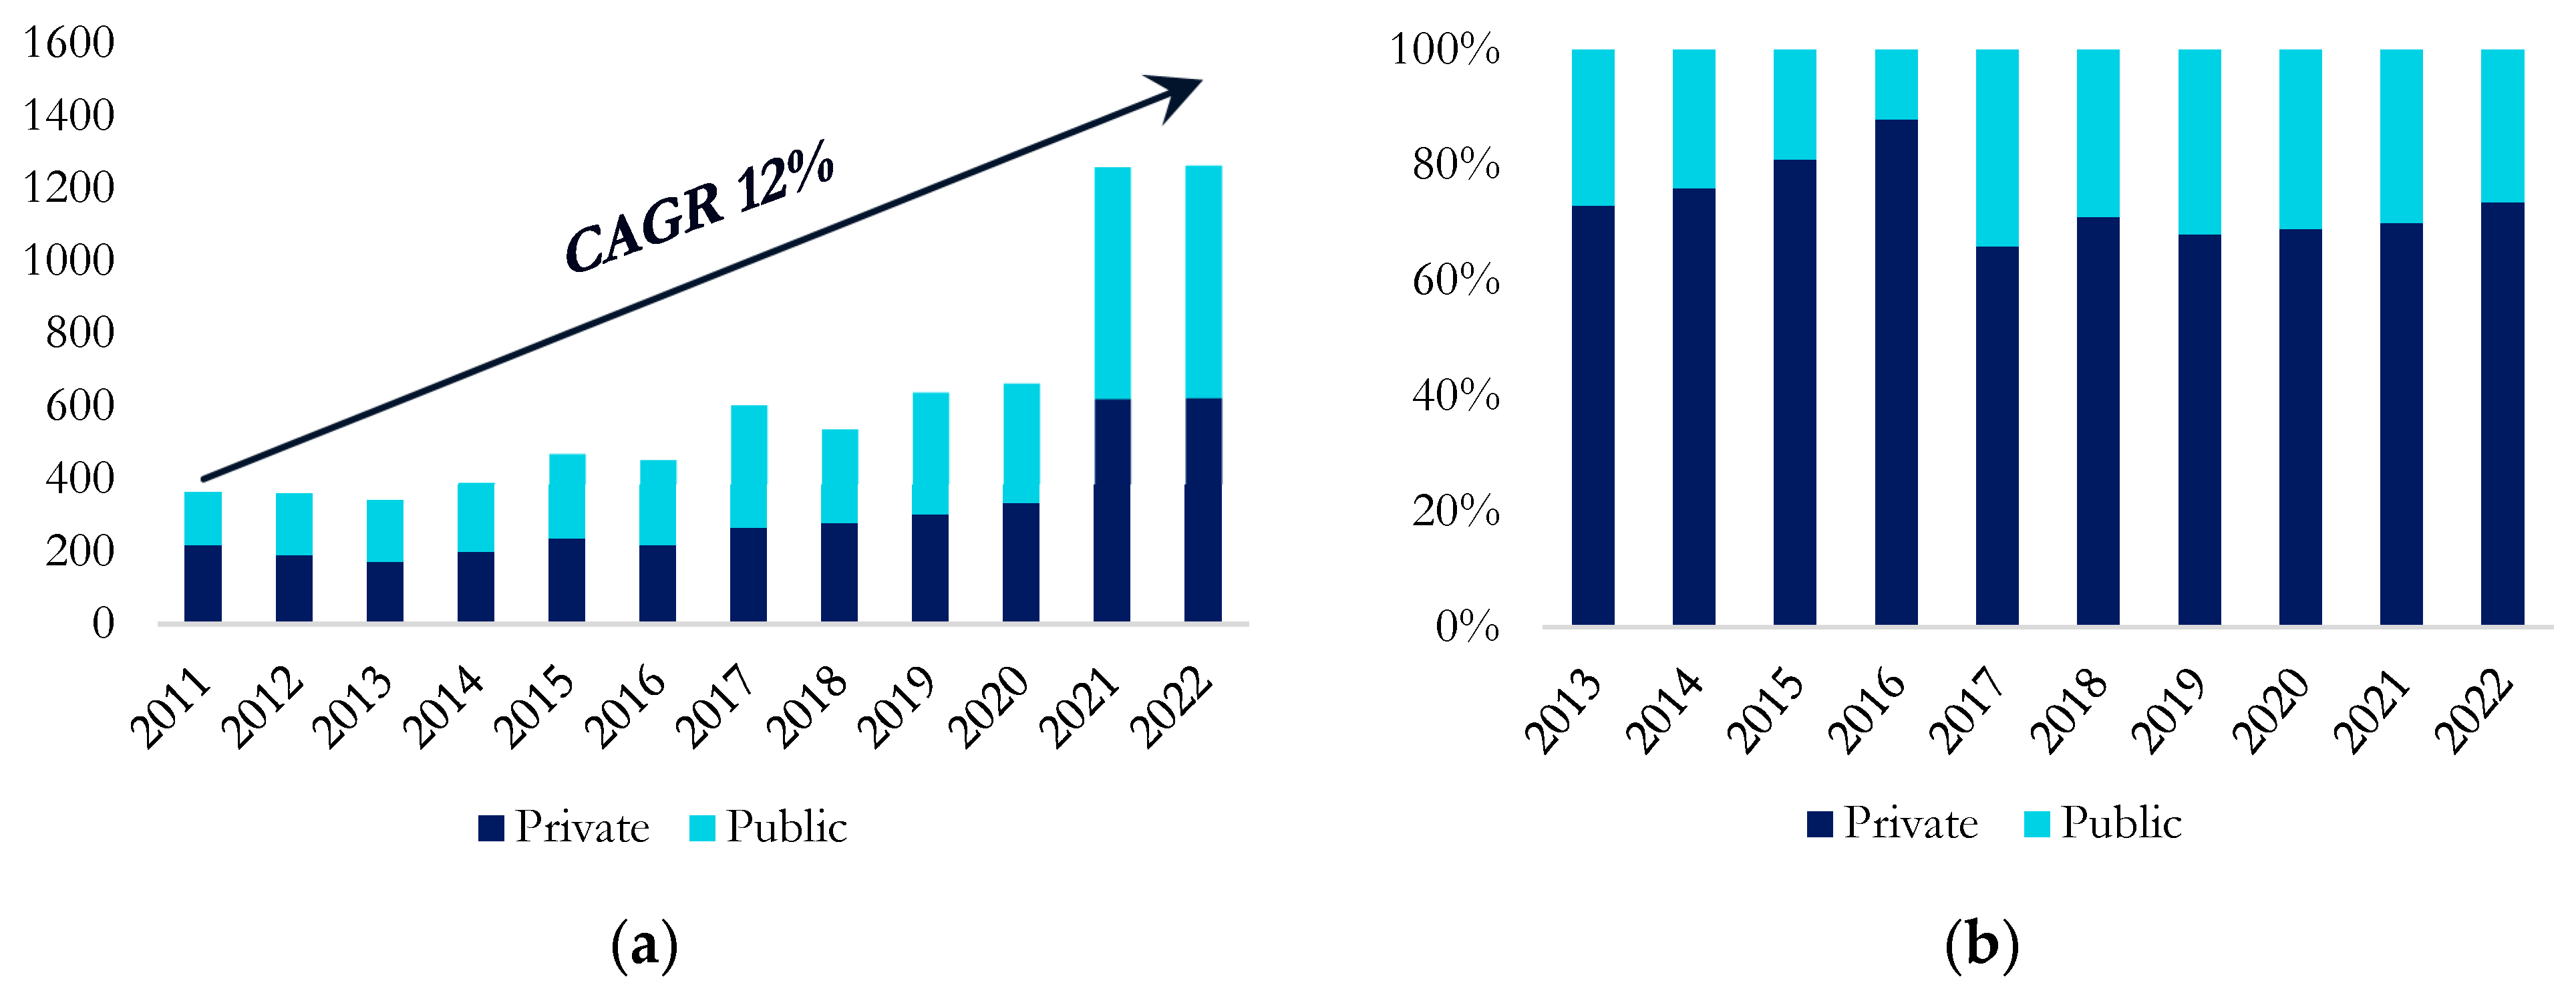

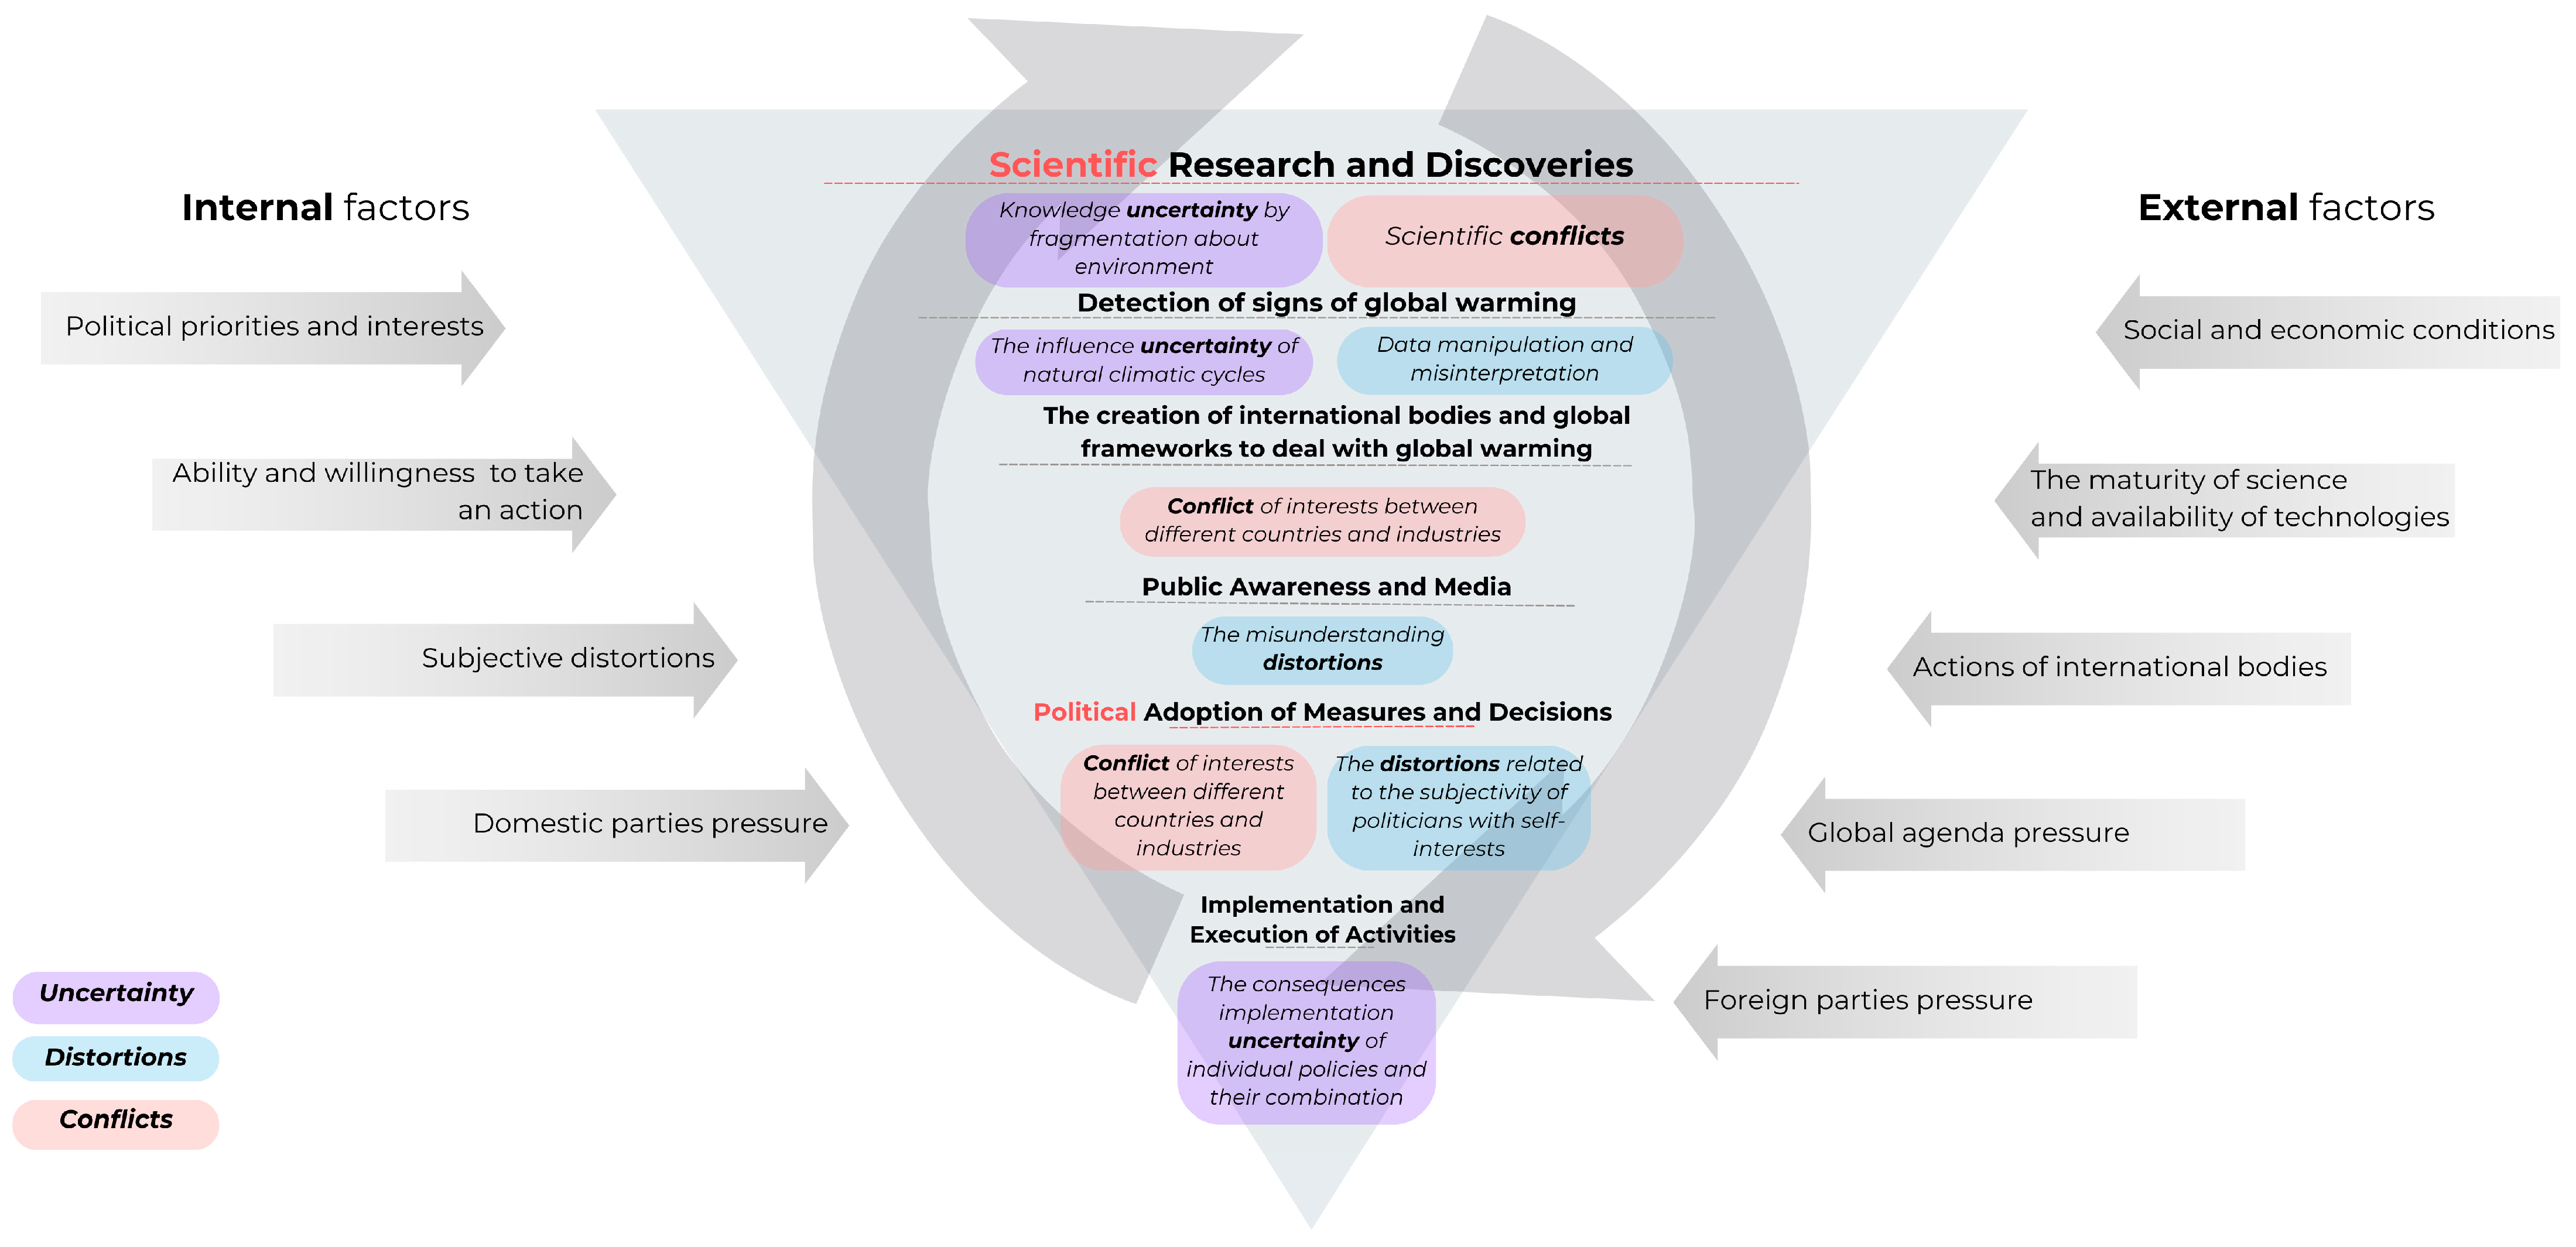
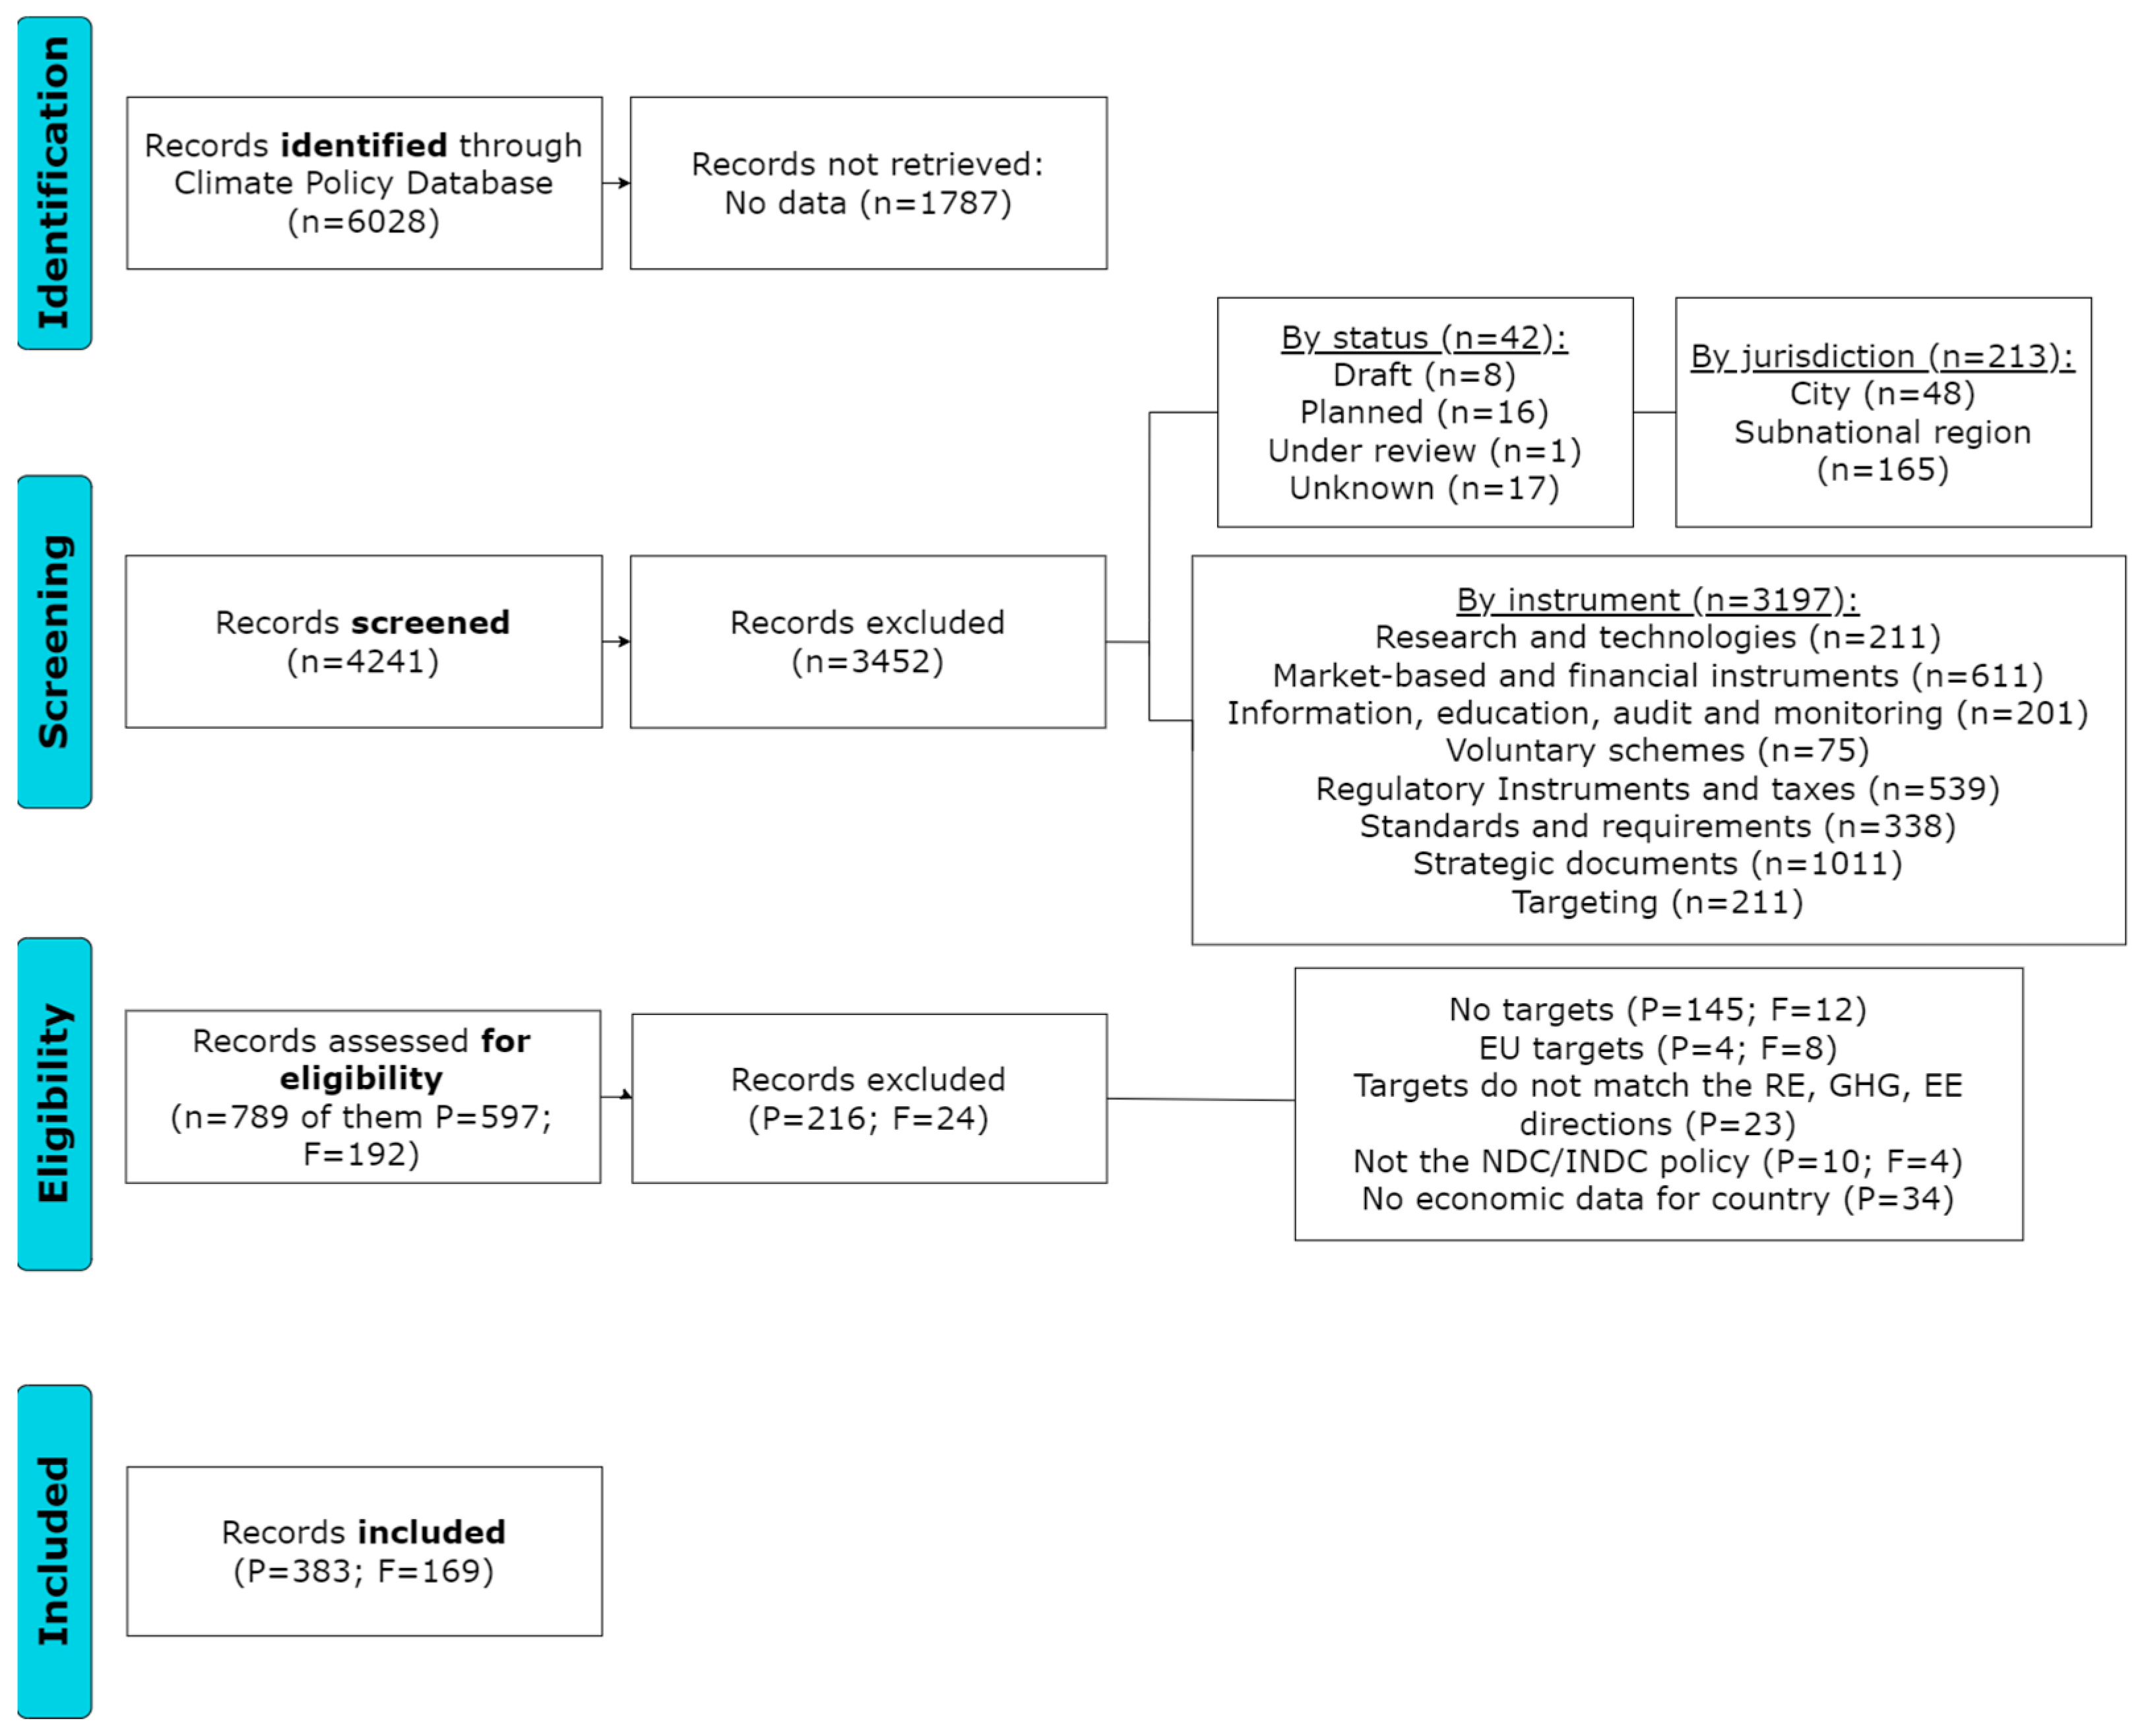
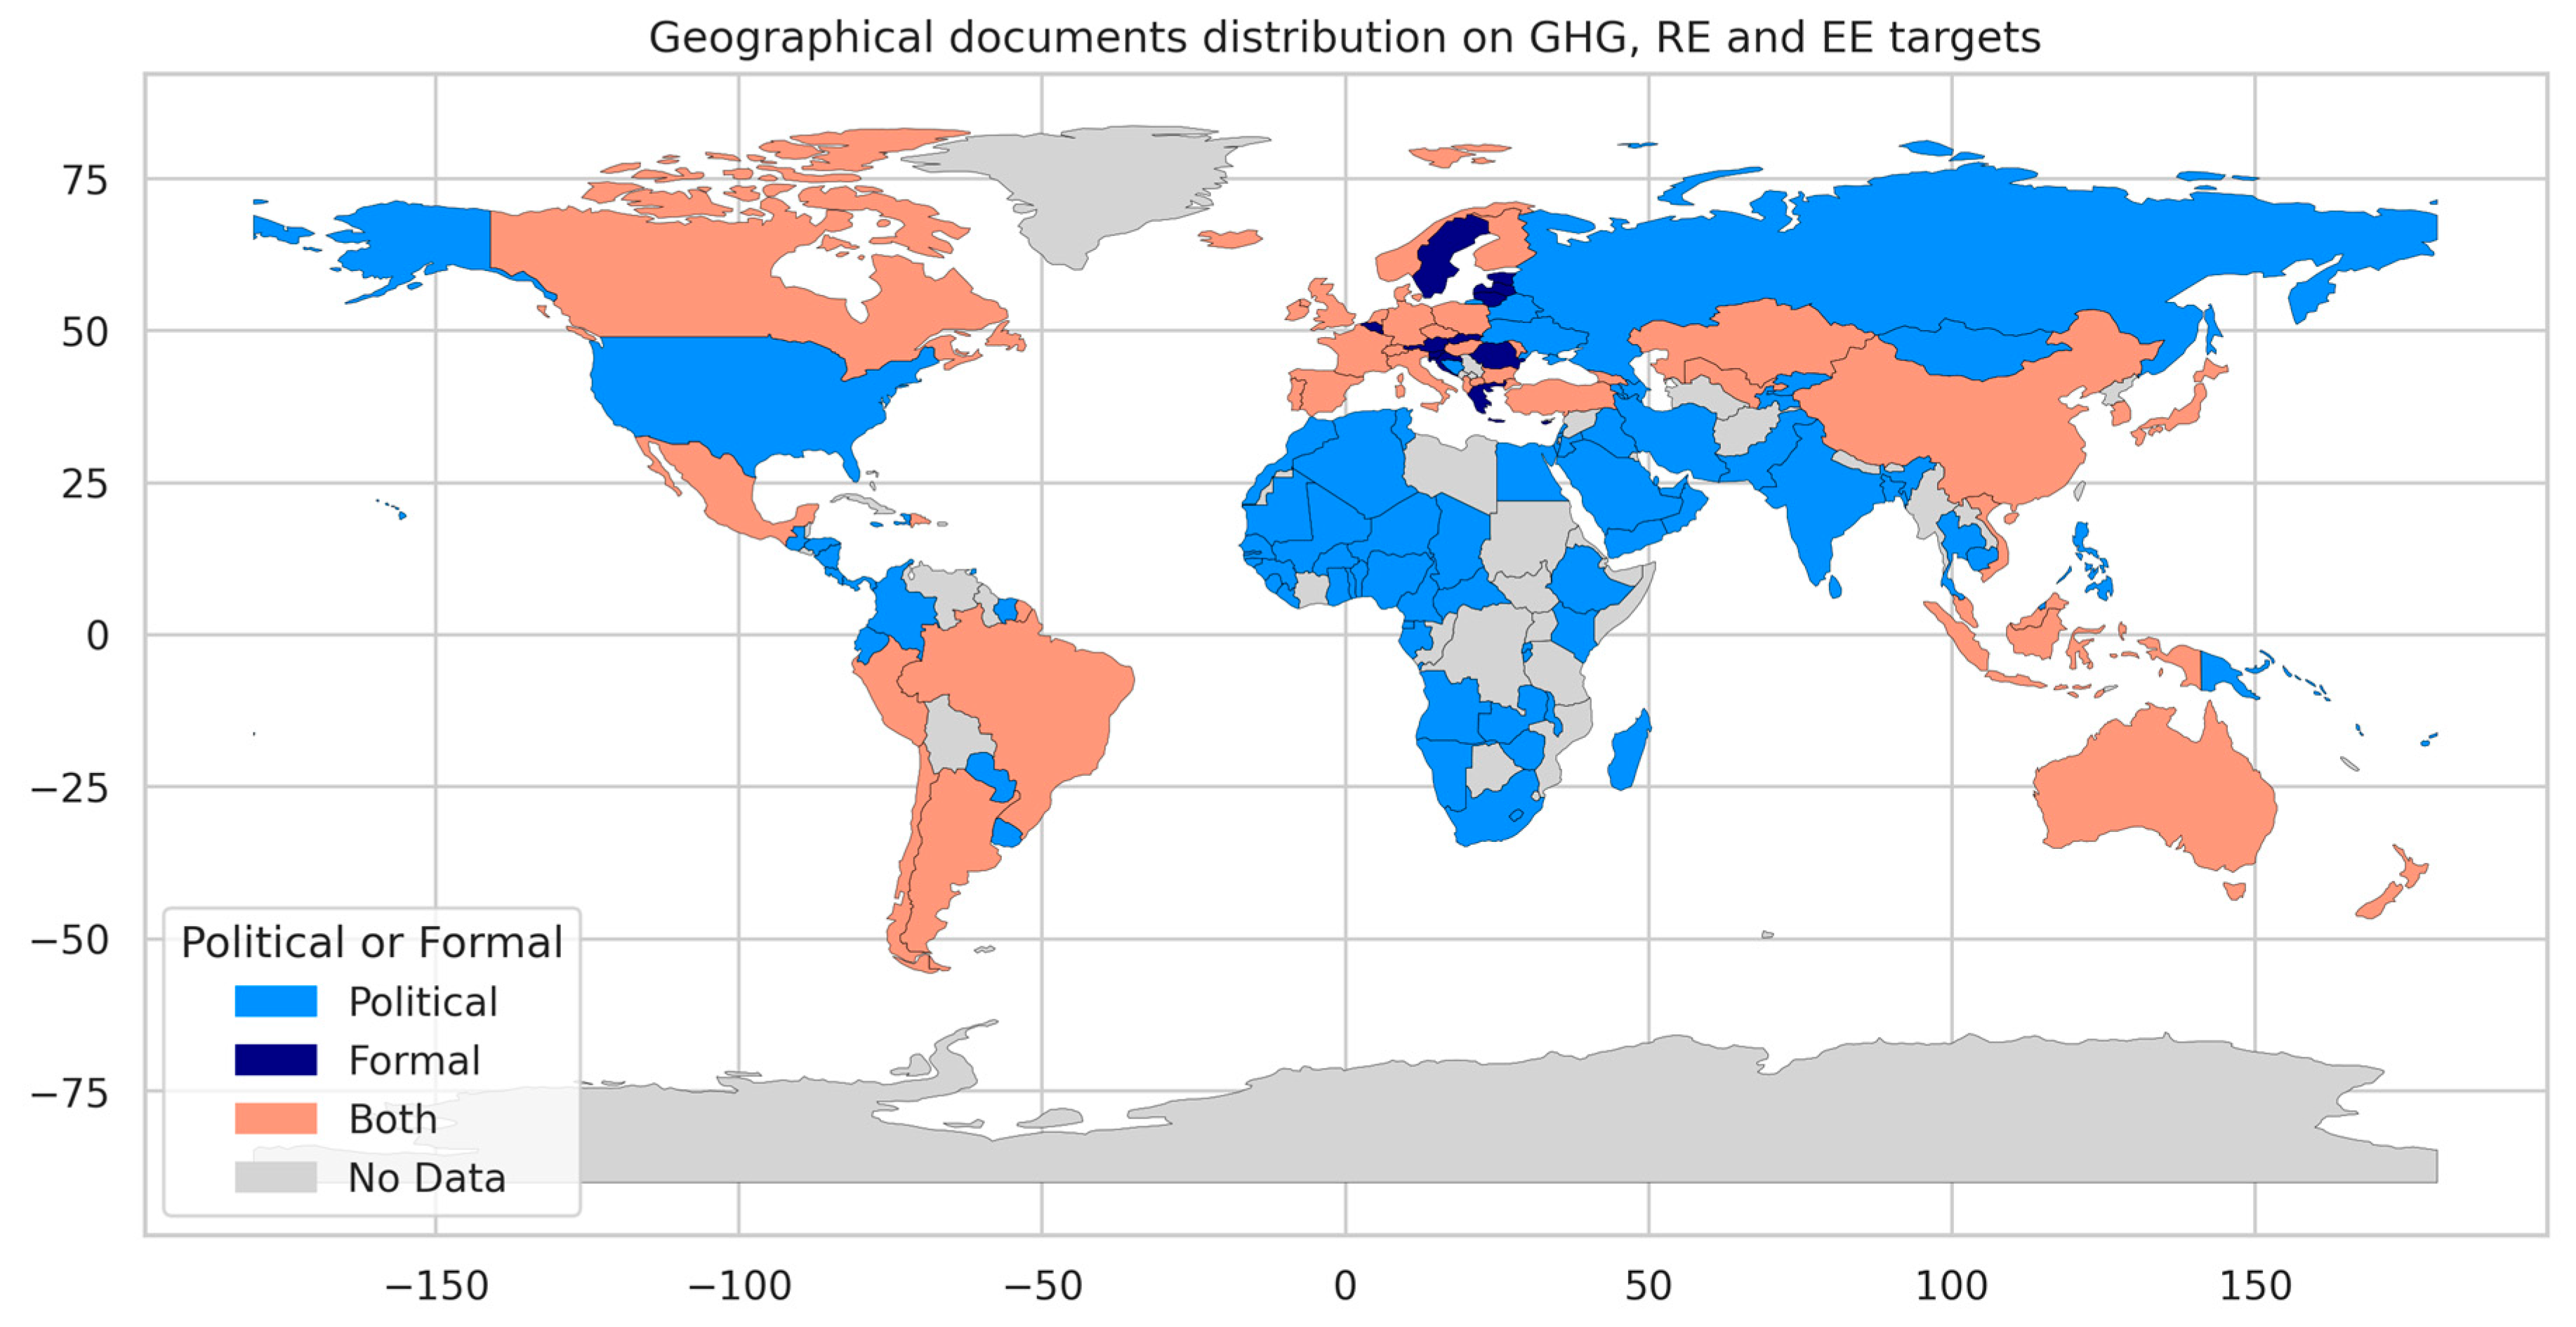
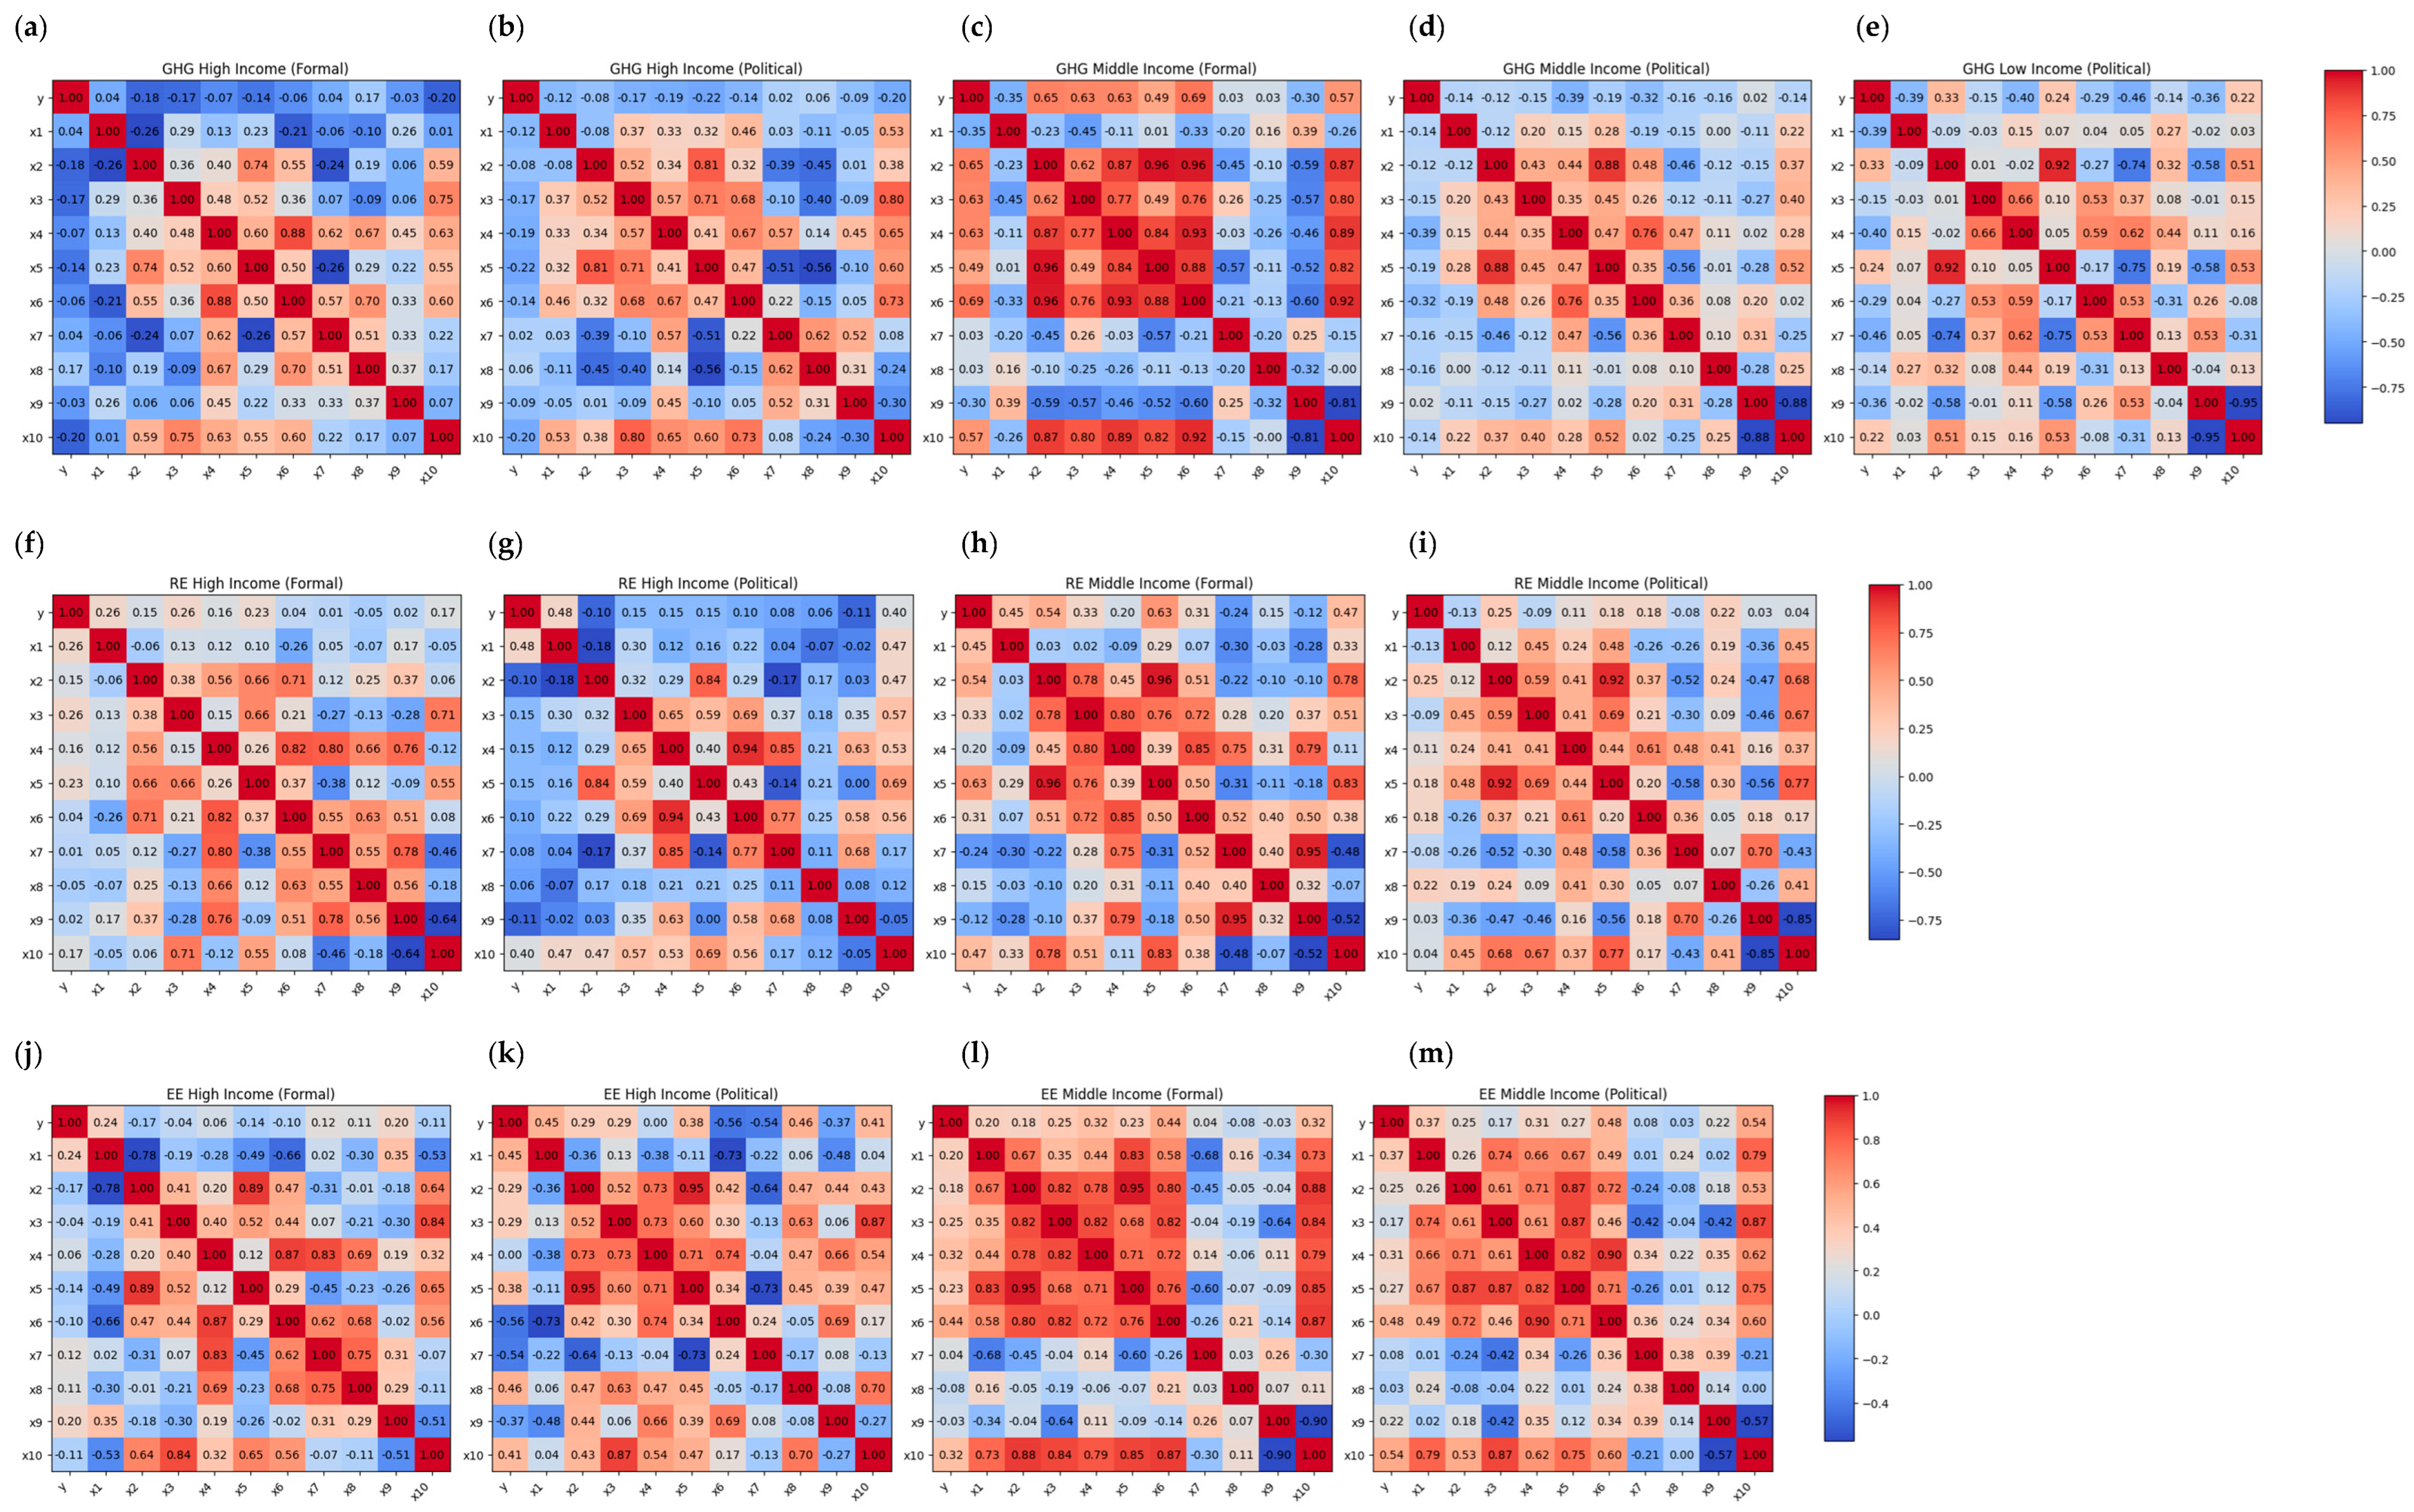

| № | Definition | Source |
|---|---|---|
| 1. | Climate policies are strategies and actions taken by governments and organizations to mitigate the effects of climate change and adapt to its impacts. They involve integrating climate considerations into a wide range of policy areas, from environmental protection to economic development. | [43] |
| 2. | Climate policy encompasses the public and governmental measures taken to reduce GHG emissions and adapt to the impacts of climate change. It includes regulatory, economic, and technological strategies to ensure fostering sustainable development and resilience. | [44] |
| 3. | Climate policy is a set of measures aimed at mitigating the effects of climate change and facilitating adaptation. This includes economic instruments such as carbon trading, regulatory frameworks, and support for RE technologies. | [45] |
| 4. | Climate policy includes urgent and coordinated global action to reduce GHG emissions and prepare society to cope with the impacts of climate change. It emphasizes the integration of scientific evidence into policy-making process. | [46] |
| 5. | Climate policies are adopted and/or mandated by government—often in conjunction with business and industry within one country or with other countries—to accelerate climate change mitigation and adaptation measures. | [47] |
| 6. | Climate policies are the decisions that determine what actions will be taken to combat climate change. Like politics in any other field, they range from the global level, where countries negotiate with each other, to the national, urban or even rural level. | [48] |
| 7. | Climate policy is a set of measures and strategies aimed at addressing and mitigating the effects of climate change on the energy sector. These policies aim to ensure reliable and sustainable energy supply, promote the transition to clean energy, increase EE, and support the development and deployment of RE technologies. Climate policy also includes preparing for and adapting to long-term changes in climate patterns and immediate shocks caused by extreme weather events. | [49] |
| Status | Jurisdiction | Policy Objective | Mitigation Area | Sector | Policy Instrument |
|---|---|---|---|---|---|
| Ended (17.7%) | City (0.8%) | Adaptation (4.7%) | Energy efficiency (37.2%) | Agriculture and forestry (7.2%) | Barrier removal (1.3%) |
| In force (73.8%) | Country (94.5%) | Air pollution (1.3%) | Energy service demand reduction and resource efficiency (25.2%) | Buildings (14.3%) | Climate strategy (9.7%) |
| Planned (0.6%) | Subnational level (4.7%) | Economic development (0.9%) | Non-energy use (6.4%) | Electricity and heat (29.1%) | Economic instruments (6.1%) |
| Superseded (8.3%) | Energy access (0.2%) | Other low-carbon technologies and fuel switch (8.2%) | General (24.4%) | Information and education (6.5%) | |
| Under review (0.1%) | Energy security (0.4%) | Renewables (23%) | Industry (9.4%) | Policy support (37.95%) | |
| Draft (0.1%) | Food security (0.1%) | Transport (15.6%) | Regulatory Instruments (16%) | ||
| Unknown (0.4%) | Land use (0.6%) | Research & Development and Deployment (RD&D) (1.7%) | |||
| Mitigation (91.9%) | Target (19%) | ||||
| Water (0.01%) | Voluntary approaches (1.7%) |
| Area | Content | Target Description | Economic Indicator | Source |
|---|---|---|---|---|
| GHG | GHG emissions | Reducing/increasing GHG emissions | GHG emissions | [64] |
| GHG emissions excluding LULUCF | Reducing GHG emissions excluding LULUCF | GHG emissions excluding LULUCF | [65] | |
| CO2 emissions | CO2 emissions reduction | CO2 emissions | [66] | |
| CO2 intensity of GDP | Decreasing/reducing/increasing CO2 intensity | CO2 intensity of GDP | [67] | |
| Methane emissions | Methane emissions reduction | Methane emissions | [68] | |
| GDP increasing | GDP increasing | GDP | [69] | |
| RE | RE mix | RE in the energy mix | RE generation | [70] |
| RE final consumption | RE share in total final consumption | RE % of total final energy consumption | [71] | |
| RE primary consumption | RE share in primary consumption | Share of primary energy consumption from RE | [72] | |
| RE electricity consumption | RE share in electricity generation | Share of electricity production from RE | [73] | |
| EE | Final energy consumption | Reduction in final energy consumption | Final energy consumption | [74] |
| Primary energy consumption | Reduction in primary energy consumption | Primary energy consumption | [75] | |
| Energy intensity of GDP | Energy intensity reduction | Primary energy consumption per unit of GDP | [76] | |
| Energy savings | Energy savings | Final energy consumption | [74] | |
| Nuclear energy generation | Nuclear energy generation growth | Nuclear energy generation | [77] |
| Indicator | Variable | Measure | Source |
|---|---|---|---|
| Population | x1 | people | [79] |
| GDP per capita PPP | x2 | 2021 USD | [80] |
| Primary energy consumption | x3 | TWh | [81] |
| GHG emissions | x4 | CO2 eq | [64] |
| GDP | x5 | 2021 USD | [69] |
| Per-capita GHG emissions | x6 | CO2 eq | [82] |
| GHG emissions per GDP | x7 | kg 2021 USD | [67] |
| GHG emissions per unit energy | x8 | kg per kWh | [83] |
| GHG intensity of electricity | x9 | gCO2/kWh | [84] |
| Electricity consumption | x10 | TWh | [75] |
| Variable | VIF |
|---|---|
| y | 3.675398 |
| x1 | 4.138842 |
| x2 | 11.714378 |
| x3 | 1.744677 |
| x4 | 680.530770 |
| x5 | 1198.295191 |
| x6 | 3.412330 |
| x7 | 1461.098623 |
| x8 | 1.087580 |
| x9 | 5.416158 |
| x10 | 7.634015 |
| Parameter | GHG_High Income | GHG_Middle Income | GHG_Low Income | RE_High Income | RE_Middle Income | EE_High Income | EE_Middle Income |
|---|---|---|---|---|---|---|---|
| Estimate | Estimate | Estimate | Estimate | Estimate | Estimate | Estimate | |
| y | 6.388 | 3.95 | 5.609 | 2.269 | 7.498 | 4.708 | 0.589 |
| x1 | 3.119 | 3.123 | 14.755 | 3.307 | 7.084 | 3.51 | 0.306 |
| x2 | 3.326 | 5.542 | −8.144 | 2.927 | 21.15 | 8.577 | 3.164 |
| x3 | −5.419 | −0.364 | −2.146 | 2.223 | 8.853 | −1.813 | 1.31 |
| x6 | −12.508 | −0.967 | −18.019 | −1.725 | 2.228 | −18.422 | 0.878 |
| x8 | −0.223 | −4.805 | −1.983 | −2.669 | −3.382 | 4.955 | −0.793 |
| x9 | −10.51 | −0.169 | 6.219 | −5.272 | −10.526 | −9.337 | −2.588 |
| x10 | 2.408 | 5.21 | 1.011 | 5.355 | 19.316 | 5.024 | 3.525 |
| Sigma | 143.196 | 141.836 | 34.318 | 1222.178 | 261.625 | 133.886 | 1874.369 |
| Log_Likelihood | −4262.44 | −2583.32 | −2165.35 | −7259.76 | −4483.5 | – | – |
| WAIC | 126.54 | 157.4 | 31.1 | 91.62 | 94.81 | – | – |
| BIC | 8560.26 | 5207.9 | 4350.46 | 14,547.35 | 8999.74 | – | – |
| R2 | 0.39 | 0.49 | 0.55 | 0.06 | 0.2 | 0.15 | 0.21 |
| Income Group | Number of Countries | Total GVA of Industry in 2000, Bln USD_2011 | Total GVA of Industry in 2020, Bln USD_2011 | Change in GVA, % | Total Energy Consumption of Industry in 2000, Mln TJ | Total Energy Consumption of Industry in 2020, Mln TJ | Change in Energy Consumption, % |
|---|---|---|---|---|---|---|---|
| High-income industrial economies | 33 | 8137.07 | 9504.86 | 16.81 | 97.31 | 80.50 | −17.27 |
| High-income industrializing economies | 10 | 653.36 | 1331.01 | 103.72 | 5.76 | 9.67 | 67.88 |
| Middle-income industrial economies | 30 | 6228.67 | 16,225.16 | 160.49 | 67.23 | 160.84 | 139.25 |
| Middle-income industrializing economies | 41 | 1484.33 | 4136.80 | 178.70 | 19.38 | 34.63 | 78.73 |
| Low-income economies | 9 | 154.54 | 237.33 | 53.58 | 1.14 | 1.88 | 65.42 |
Disclaimer/Publisher’s Note: The statements, opinions and data contained in all publications are solely those of the individual author(s) and contributor(s) and not of MDPI and/or the editor(s). MDPI and/or the editor(s) disclaim responsibility for any injury to people or property resulting from any ideas, methods, instructions or products referred to in the content. |
© 2025 by the authors. Licensee MDPI, Basel, Switzerland. This article is an open access article distributed under the terms and conditions of the Creative Commons Attribution (CC BY) license (https://creativecommons.org/licenses/by/4.0/).
Share and Cite
Tsvetkov, P.; Andreichyk, A. The Analysis of Goals, Results, and Trends in Global Climate Policy Through the Lens of Regulatory Documents and Macroeconomics. Sustainability 2025, 17, 4532. https://doi.org/10.3390/su17104532
Tsvetkov P, Andreichyk A. The Analysis of Goals, Results, and Trends in Global Climate Policy Through the Lens of Regulatory Documents and Macroeconomics. Sustainability. 2025; 17(10):4532. https://doi.org/10.3390/su17104532
Chicago/Turabian StyleTsvetkov, Pavel, and Amina Andreichyk. 2025. "The Analysis of Goals, Results, and Trends in Global Climate Policy Through the Lens of Regulatory Documents and Macroeconomics" Sustainability 17, no. 10: 4532. https://doi.org/10.3390/su17104532
APA StyleTsvetkov, P., & Andreichyk, A. (2025). The Analysis of Goals, Results, and Trends in Global Climate Policy Through the Lens of Regulatory Documents and Macroeconomics. Sustainability, 17(10), 4532. https://doi.org/10.3390/su17104532


