Systematic Review

Methods for Assessing the Ecosystem Service of Honey Provisioning by the European Honey Bee (Apis mellifera L.): A Systematic Review

by
Ildikó Arany
1,2,*,† and
Bálint Czúcz
3,*,†
1
HUN-REN Centre for Ecological Research, Karolina Str. 29, H-1113 Budapest, Hungary
2
Bükk National Park Directorate, Sánc Str. 6, H-3304 Eger, Hungary
3
Norwegian Institute for Nature Research (NINA), 7485 Trondheim, Norway
*
Authors to whom correspondence should be addressed.
These authors contributed equally to this work.
Sustainability 2025, 17(10), 4533; https://doi.org/10.3390/su17104533
Submission received: 26 February 2025 / Revised: 17 April 2025 / Accepted: 8 May 2025 / Published: 15 May 2025
(This article belongs to the Section Environmental Sustainability and Applications)

Abstract

:
Honey bees (Apis mellifera L.) provide several valuable ecosystem services, including honey provisioning. While pollination by honey bees is well-studied, the scientific assessment of honey-provisioning capacity (HPC) has received less attention. In this study, we performed a qualitative systematic review (critical interpretive synthesis) to identify the main types of models that can be used to map and assess honey provision as an ecosystem service, together with the background and implications of the use of these methodological approaches in the scientific literature (WOS, Scopus, search date: 5 July 2022. resulting in an initial pool of 281 studies). From the initial list, we retained only those studies that presented concrete case studies modelling the capacity of specific sites, landscapes or regions for provisioning honey by A. mellifera (17 studies). We identified three main model types in the reviewed studies: (A) simple rule-based models (“matrix” models), (B) extended rule-based models (incorporating bee foraging-range simulations), and (C) predictive statistical models. The vast majority of studies used rule-based approaches, with varying levels of complexity in their input data and output metrics. Key decision points in the modeling process, including the treatment of seasonality, spatial variability in floral resources, and bee foraging behavior, were identified. We also identified possible sources of methodological uncertainties and suggested potential approaches by which to improve the accuracy and robustness of HPC assessments. Our findings underscore the need for more standardized methodologies, transparent documentation, and integration of local beekeeping knowledge to advance scientific understanding and the practical application of HPC assessments. Furthermore, our experiences also suggest that critical interpretive synthesis has a wide range of applicability in the study of ecosystem services, with great potential for advancing the interoperability of assessment methodologies.

1. Introduction

Ecosystem services (ES) are the contributions of ecosystems to economic, social, cultural and other types of benefits that underpin the maintenance and enhancement of human societal and individual wellbeing [1,2,3]. Pollinators are key ecosystem-service providers, and the European honey bee (Apis mellifera L.) has a prominent role among them. While in most parts of the world, honey bees are primarily domestic animals, they still have a significant role in the “delivery” of several ecosystem services. One such service is the provisioning ES of beekeeping products such as food (honey), raw material (beeswax) or medicinal materials (propolis, pollen, royal jelly [4]). Furthermore, honey bees’ primary ES contribution is pollination, which is one of the most-studied regulating ES worldwide [5,6,7], and they can also contribute to cultural ES [7], the third major class of ES [8], through, e.g., location-specific traditional products contributing to local identity. Good examples of this are manuka honey from New Zealand [9], heather honey from the French Pyrenees [10] or black locust honey from Hungary [11]. Honey bees have served as religious or cultural symbols on many occasions throughout history [12,13] and still represent important aesthetic, recreational and scientific values today [14].
While pollination is well covered in recent ES research, as well as in ES mapping and assessment guidance (including comprehensive synthesis reports such as [7]), most of the other ES that are also tightly connected to honey bees have received much less attention in ES science, despite the large body of traditional and practical knowledge that has accumulated over thousands of years of beekeeping. In this paper, we would like to address this gap and discuss honey provisioning from an ecosystem-services perspective. As a conceptual framework, we apply the ES cascade model [15,16,17] to interpret and measure the flow of services from nature towards society. This ‘ES flow’ is split into four distinct domains: (1) the extent and condition of ecosystems, (2) the capacity of ecosystems to provide a certain ES in a sustainable way (a.k.a. “potential supply”), (3) the “actual use”, i.e., the quantity of the ES that is actually produced/used/extracted/delivered, and (4) the benefits (value) generated for humans by the ES (Figure 1).
Honey is basically derived from sugar-rich liquids (nectar) produced by melliferous resources such as the flowers of wild and cultivated plants or (more rarely) by extrafloral nectaries or sugary insect secretions (honeydew, usually produced by aphids). The nectar is collected by the worker bees and then matures into honey in the hive [18]. The amount of honey that can be produced in a given landscape—in this context, a bee pasture—is basically determined by the area and quality of melliferous resources present, i.e., the composition of the plant community (cascade level 1). In a simple approximation, the capacity of a bee pasture to provide honey depends on the amounts of the melliferous resources (most importantly, floral nectar) produced in a certain area over a certain period (cascade level 2). However, nectar production is not a stable attribute of plant communities, as it varies widely both in space and time—a fact that had already been described a hundred years ago [19]. The spatial variability in flowering success, nectar production and nectar sugar content are influenced by several geographic, climatic and ecosystem attributes [20], while their temporal diversity is basically determined by plant phenological patterns that are largely influenced by weather variations [21,22,23]. The calculation of honey-production capacity from nectar potential is further complicated by the fact that the sugar content of nectar is variable between plant species, as well as within a single species, depending on the habitat and weather (humidity, temperature) constraints [24]. Consequently, the weight of honey that can be produced in a unit area is highly resource-, location- and time-specific. Moreover, as the location of a domesticated honey bee nest is determined by beekeepers instead of by the bees’ natural preferences, the relative position of the colonies (hives) with respect to the bee pastures is also a critical factor for the production of honey. The distance that the bees are willing to travel for a resource depends on the quality and quantity of the ‘reward’: honey bees perform complex optimization calculations, identifying the pastures that provide a reward greater than the energy consumed during their travel over certain distances or potentially difficult terrains [25,26]. Additionally, they flexibly adapt their preferences according to the availability and status of resources, as well as the demands of the colony [27,28].
The extent to which honey bees (and thus beekeepers) can utilize the theoretical honey-production capacity of a given area and turn it into “real honey production” (i.e., actual use, cascade level 3, see Figure 1) is also influenced by a number of internal factors on the bees’ side, for example, the number and strength of bee colonies present in an area (and thus, the extent of intraspecific competition) and the effect of weather on bees (windy, rainy and cold weather hinders worker bees’ flying) as well as those of other stressors (e.g., parasites or exposure to chemicals of agricultural origin). Excessive hive density in a given area can limit the yields of individual colonies, and under such conditions, a bee pasture can be said to be overused. The production capacity of a colony is largely determined by its strength and health because a large number of worker bees is needed to exploit a given nectar supply [29,30]. The production capacity of bees is also affected by a number of other stress factors such as diseases, parasites, agricultural poisoning or extreme weather events [30,31].
Although honey is considered a completely natural product [32], modern beekeeping practices involve a number of human interventions that can significantly increase the amount of honey produced. Beekeepers naturally aim to maximize their economic output through interventions and technologies that ensure a maximal flow of marketable honey. From an ES-assessment perspective, these interventions can be seen as human inputs that should, in principle, be subtracted from the total value (gross flow of benefits) in order to get an unbiased estimate of the net ecosystem contributions (the ES itself, see [33]). These interventions include, for example, the creation and maintenance of hives, veterinary treatments, complementary feeding, and transhumance.
We define honey-provisioning capacity (HPC) as the ability of the ecosystems to supply melliferous resources to honey bees (cf. Figure 1). From an ES perspective, the HPC of a location corresponds to the annual honey “surplus” of a stationary hive positioned there that is subject to natural (a.k.a. ‘Darwinian’) beekeeping [13]. Under such circumstances, there is very little “excess” honey (stocks collected during nectar-rich periods are needed by the colony to survive the nectar-scarce periods) and the size of colonies is adapted to the periods of ‘dearth’. This, however, also means that such (relatively small and weak) natural colonies might not be able to fully exploit the nectar-rich periods, at least not as much as colonies that are kept large and healthy during periods of nectar scarcity by supplementary feeding. The more stable and continuous the resources a landscape offers to the bees that live in it, the less it forces them to use up their honey stores in the vegetation season (and the more honey surplus is available to the beekeeper for extracting); such conditions thus enhance the development and health of the colony and the chances it will survive the winter [34]. The evenness and diversity of the landscape is often also highlighted as essential for the health of bee colonies [35].
Modern landscapes offer many relatively homogeneous stands dominated by a small number of plant species, as in arable fields or forest plantations [36] or homogeneous stands of nectar-producing invasive species [37]. Such stands often allow high honey production in short periods of peak flowering, with serious pollen shortages and nectar scarcity outside these periods [38,39,40]. To adapt to this situation, beekeepers developed another major strategy, migration (a.k.a. transhumance), which, together with supplementary feeding, essentially determines the success of beekeeping. Migratory beekeepers visit several different sites within a beekeeping season, making use of the most favorable peak-flow period at each location [41]. Non-migratory (a.k.a. stationary) beekeepers, on the other hand, need to rely on the resources provided by a fixed location throughout the year, which makes them more dependent on the evenness of nectar and pollen sources throughout the year [35].
There is a wealth of complex traditional, practical knowledge about honey production and the floral resources needed to sustain it which has accumulated over generations of beekeeping [42,43,44]. Nevertheless, knowledge of honey as an ES is under-represented in the ES literature, both in comparison with other provisioning services and in comparison with the other important service provided by bees, pollination.
In this paper, we would like to provide a detailed overview of the different approaches that have been used in the scientific literature to assess and quantify the honey-provisioning capacity (HPC) of the ecosystems. To this end, we performed a targeted systematic review with the following questions:
  • What kind of models and methodologies are used in the literature to map or assess the HPCs of specific sites, landscapes or regions?
  • What are the main methodological choices underlying the different models? How are these choices influenced by the availability of information (input data)?
  • How do these choices influence the model outputs (the resulting HPC indicator)?
  • How do the different approaches identify, describe and resolve uncertainties?
  • How well are the different options aligned with the best practices and recommendations for ecosystem-service (ES) assessment studies?
After reviewing these questions, we conclude by giving recommendations for future HPC modelling (mapping and assessment) studies. Through this work, we hope to contribute to the integration of scientific knowledge on ES with practical, empirical knowledge on beekeeping.

2. Materials and Methods

2.1. Literature Search

To obtain a broad overview of the state of the art in HPC modelling, we systematically identified and reviewed those studies from the literature that produced a spatial assessment (mapping) of honey provision. In the design, implementation and documentation of the systematic review, we followed the Preferred Reporting Items for Systematic Reviews and Meta-Analyses (PRISMA) guidelines (Table S3) [45]. The review itself was not pre-registered.
To perform the literature searches, we relied on two major scientific publication databases, Scopus and Web of Science (WoS), assuming that all relevant types of models (methodological innovations) will eventually find their way to the peer-reviewed scientific literature. We used the following search expressions (Box 1):
Box 1. Expressions used for the literature search of the scientific publication databases of Scopus and Web of Science.
Scopus:
 TITLE-ABS-KEY: (((nectar W/2 assessment*) OR (ecosystem W/2 assessment*) OR (ecosystem W/2 potential) OR (ecosystem W/2 map*) OR (resource* W/2 map*) OR (map* W/2 assess*) OR (suitability W/2 map*) OR (land* W/2 suitability) OR (habitat* W/2 suitability) OR (forage W/2 availability) OR (forage W/2 potential) OR (forage W/2 value) OR “melliferous potential”) AND (“floral resource*” OR “nectar” OR “honey” OR “honeybee*” OR “beekeep*” OR “apiculture”))
Web of Science:
 TS = (((nectar NEAR/2 assessment*) OR (ecosystem NEAR/2 assessment*) OR (ecosystem NEAR/2 potential) OR (ecosystem NEAR/2 map*) OR (resource* NEAR/2 map*) OR (map* NEAR/2 assess*) OR (suitability NEAR/2 map*) OR (land* NEAR/2 suitability) OR (habitat* NEAR/2 suitability) OR (forage NEAR/2 availability) OR (forage NEAR/2 potential) OR (forage NEAR/2 value) OR “melliferous potential”) AND (“floral resource*” OR “nectar” OR “honey” OR “honeybee*” OR “beekeep*” OR “apiculture”))
These composite search expressions consist of two main groups of terms. The terms in the first set describe the ES in question (and/or the underlying economic activities): “honey”, “beekeeping”, “beekeeper”, “nectar”, etc.; while the terms in the second group identify the method (and purpose) of the study as “mapping”, “assessment” of ecosystem/habitat “suitability”, “capacity”, etc. The search was conducted on 5 July 2022.
The two searches returned a total of 428 articles, of which 147 were found in both databases. The elimination of duplications resulted in a pool of 281 records.

2.2. Selection Criteria

The resulting pool of studies was then subjected to a two-step screening process (Figure 2). We aimed to identify studies that applied a ‘model’ to produce an ‘indicator’ characterizing the HPCs of specific locations (e.g., sites, landscapes, or regions) based on available (input) data characterizing the same locations. The terms model and indicator were applied in a very broad sense: we considered an HPC indicator to be any metric that the authors used to compare the suitability of the different locations for beekeeping/honey production, and we considered a model to be the algorithm that was used to calculate the indicator. To decide whether to include a paper, we checked for the presence of a relevant “HPC indicator” and the underlying model. More concretely, the following criteria were used to evaluate the indicator and the model on which it was based:
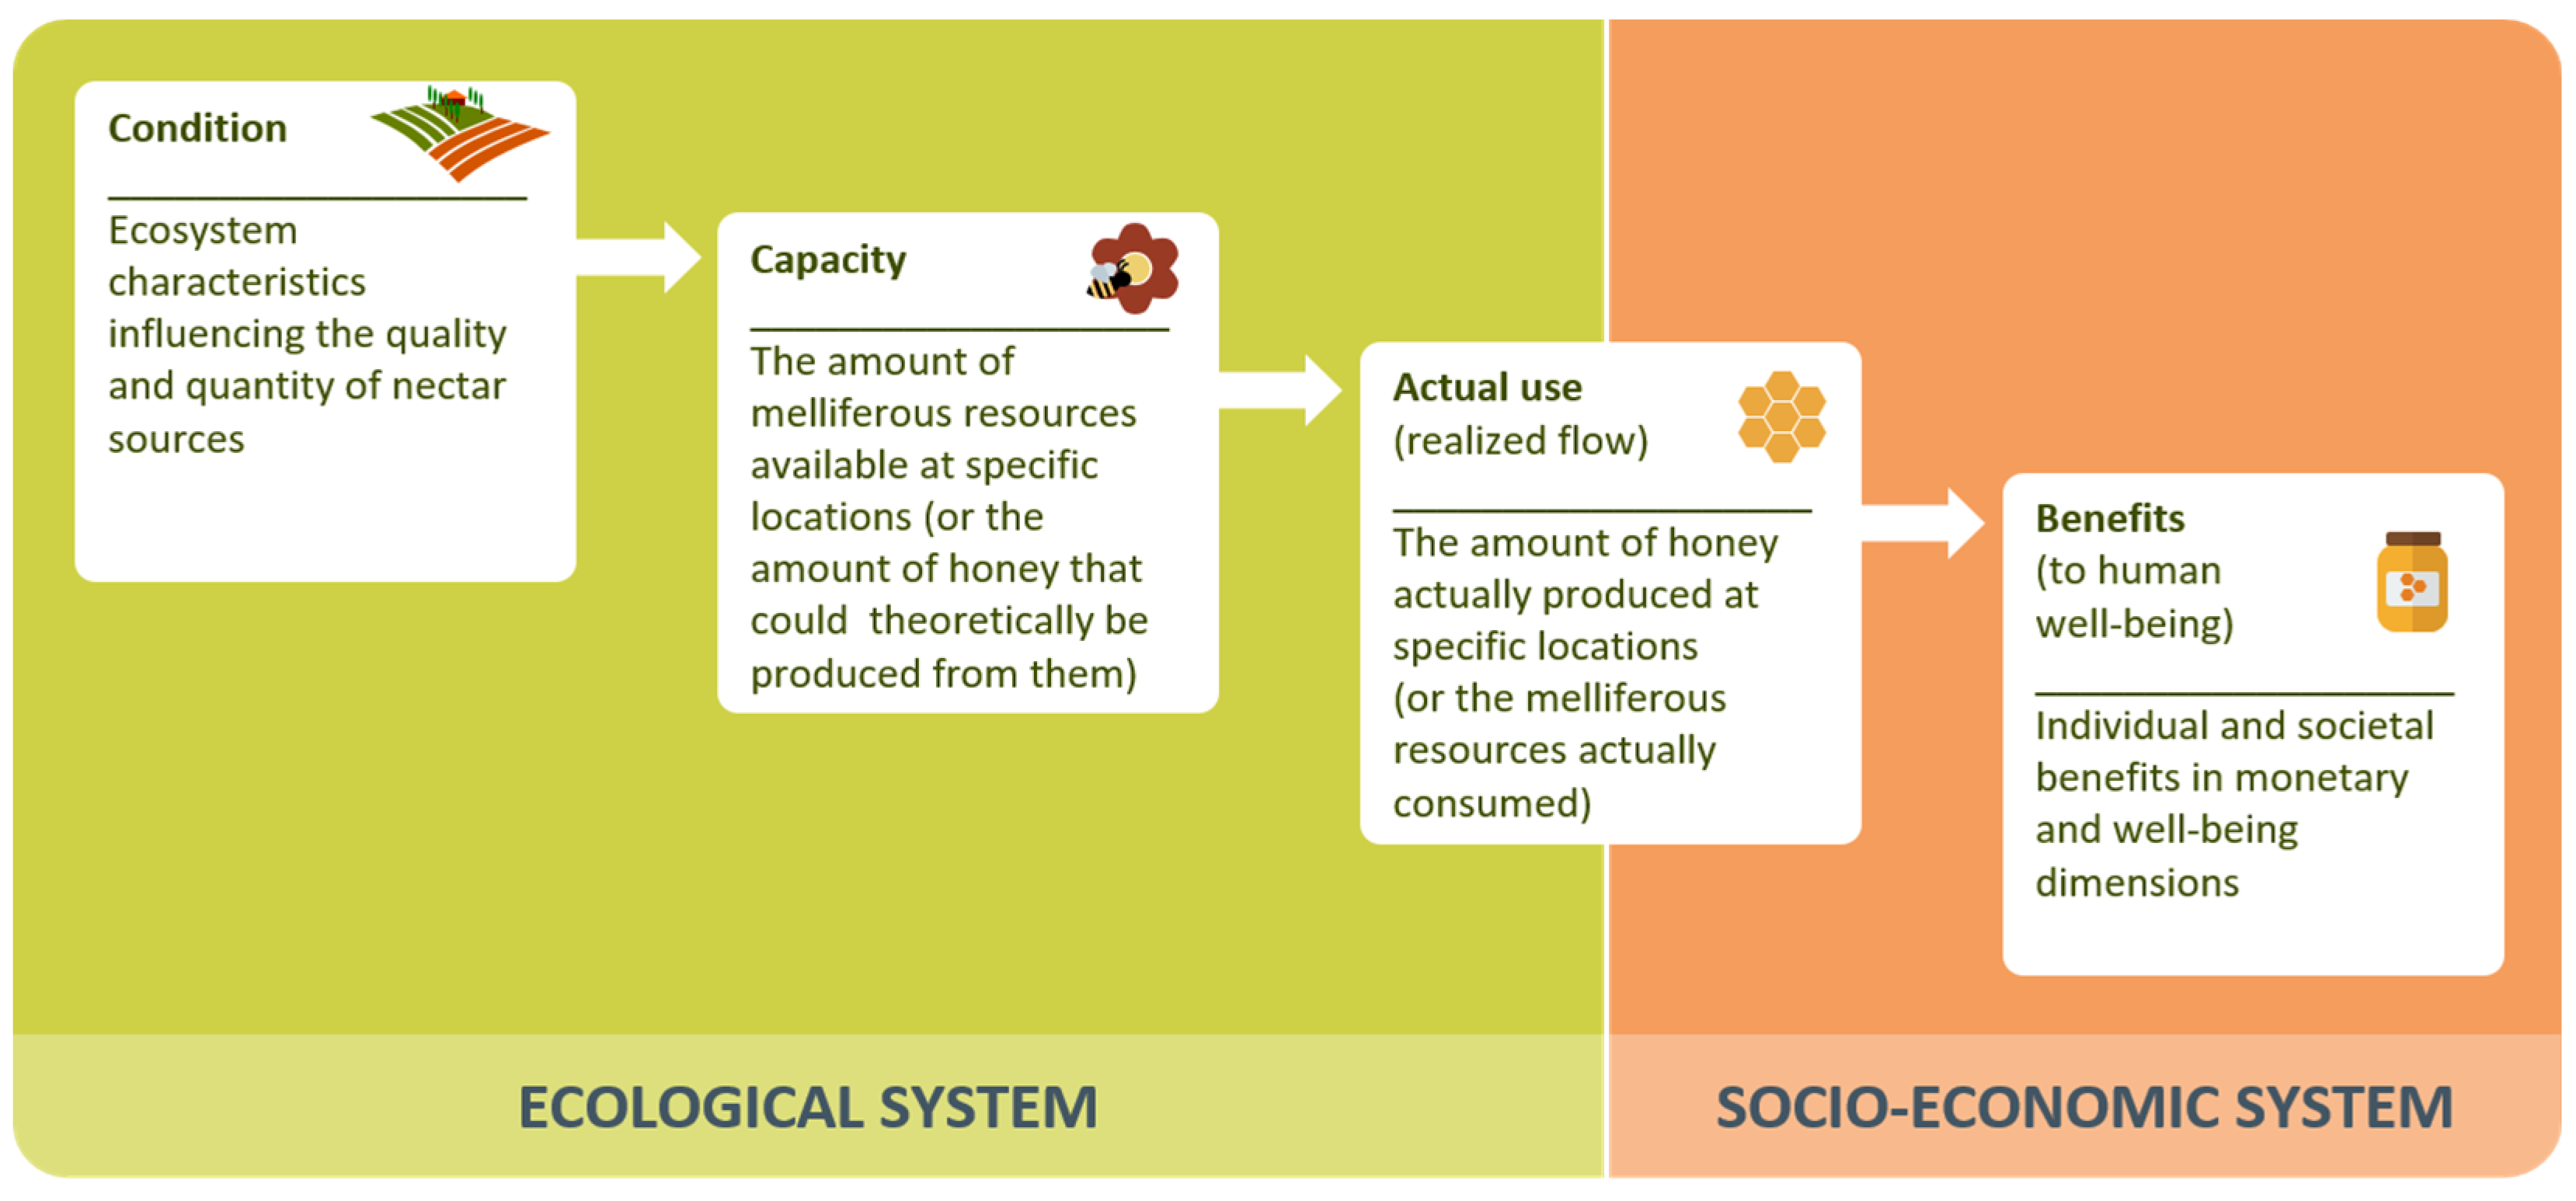
  • The indicator characterizes the capacity of ecosystems to provide honey (level 1 or 2 of the ES cascade), quantifying one of the following:
    • the potential supply (estimated multiannual mean or maximum ‘flow’) of honey or its main ‘ingredients’ (i.e., nectar or honeydew),
    • the availability of melliferous resources (flowers, specific plant species or ecosystems) as ’proxy’ indicators for nectar potential, or
    • the overall suitability of spatial locations for beekeeping.
  • The study/indicator either focuses specifically on European honey bees (A. mellifera) or describes the landscape (availability of resources) from the perspective of a group of pollinators that explicitly includes honey bees.
  • The study makes spatial predictions (to evaluate and compare different sites) in a specific case-study area based on the model/indicator.
All studies that did not describe a clear model for assessing honey-provisioning capacity or that did not use it for spatial predictions were discarded. The methodology for this had to be sufficiently detailed to allow the underlying model to be analyzed and evaluated. The scale/extent of the case-study areas did not matter, but we discarded all articles that did not include some spatial analysis on a specific study area (e.g., review articles, or studies analyzing the impact of weather on a honey-production time series). We also excluded all studies that focused exclusively either on wild bees or on Apis species other than A. mellifera.
We applied the criteria in two successive phases: a title–abstract phase and a full-text phase. Work in the first (title–abstract) phase was performed by the first author, who looked only at the title and the abstract of each article; if they provided enough information to support discarding the paper, then the paper was discarded. Otherwise, the study proceeded to the second phase, in which we procured a full-text version; this was carefully read and analyzed by both authors, who reached a consensus in ambiguous cases. In this phase, we also applied an additional criterion to prevent “double counting”:
4.
Exclusion of ‘pseudo-replications’: if two or more studies by the same authors presented the same model in different study areas, only one study was kept.
Of the 281 articles found in the keyword search, 200 were filtered out at the title–abstract stage and 57 were filtered out at the full-text stage. A further seven articles were excluded due to pseudo-replication. The flow chart of the search-and-screening process is shown in Figure 2. The list of the 281 search hits and the decisions reached for each with regard to matching the criteria are given in Supplementary Table S1.
Figure 2. Search-and-screening process employed in the systematic literature review according to the PRISMA [45] criteria. * Several articles failed to meet more than one criterion.
Sustainability 17 04533 g002

2.3. Data Extraction and Analysis

The studies reviewed came from diverse disciplinary backgrounds and thus used inconsistent terminologies to describe similar modelling steps and techniques. Accordingly, to extract information from the studies, we followed an interpretative approach [46,47], i.e., we identified specific elements of the studies based on their ‘roles’ (the way they were defined and used in the study) and not based on what they were called. This interpretative aspect can efficiently overcome complex terminological differences, enabling new interdisciplinary insights and conceptual ‘syntheses’ [47]. This interpretation was also performed by both authors collaboratively.
To compare and evaluate the modelling approaches, in each of the selected studies, we identified the HPC model(s) and their final output (HPC indicator) during the full-text screening phase. If there were multiple possible ‘candidates’ for the role of HPC indicator in a single modelling study (i.e., the model produced several outputs), then we selected the one that could be most closely associated with the concept of honey-provisioning capacity (HPC), in line with the principles of ecosystem-service mapping and assessment studies (typically the one that was presented on maps as the main result of the study). More concretely, this meant that the selected HPC model/indicator had to
  • be spatially explicit (predicted values are assigned to concrete locations, describing the spatial variability of honey pastures)
  • characterize the capacity of each location to provide honey, regardless of whether this capacity was eventually harvested (turned into “actual use”) or not.
In other words, a suitable HPC indicator depends only on the characteristics of ecosystems and their mosaic. Some studies also collected data at the actual use level (cascade level 3) [48,49,50], often extracted from official statistics (e.g., mass of honey produced, density of beehives), and in some cases, these data were used for the calibration or validation of the HPC model produced. However, we never considered such honey-production (‘actual use’) data as an HPC indicator.
The selected HPC models and indicators were then evaluated in a spreadsheet against the questions (reporting variables) listed in Table 1. These questions aim to characterize the modelling approaches according to the way they address the diverse “idiosyncrasies” of HPC assessment that stem from the complexities of honey bee ecology, and beekeeping practices. In line with the principles of critical interpretive synthesis studies [46,47], the response categories were iteratively refined during a testing phase with the aim of producing well-defined and specific categories that reliably capture and describe the diversity of modelling methods. Accordingly, the (final) response categories, as presented in Table 1 (and Supplementary Table S2), already reflect an expert interpretation of the main ‘groupings’ in the literature and can be seen as an elementary outcome of this study.
Data extraction was followed by an additional synthesis step in which we aimed to classify the studies from a methodological perspective, identifying distinct ‘model types’ among the HPC models. The model types identified as a result of the synthesis can be considered as one of the main results of the literature review.

3. Results

Altogether, 17 relevant studies were identified, describing 18 different HPC model applications (one study, [52], described two different HPC models developed in two different case studies; the complete list of the studies reviewed is provided in Supplementary Table S1). The vast majority of the models analyzed investigate HPC for A. mellifera specifically, with only two models covering a wider group of pollinators, including honey bees. Most models (n = 11) were developed on a regional-national medium scale (100–100,000 km2). This is followed by regional-national large scale (>100,000 km2) sample areas (n = 6), and only one case was local scale (1–100 km2). In terms of global regions, Europe (n = 8), North America (n = 3) and Asia (n = 4) were dominant, with 1 model representing the Middle East, South America and Oceania, respectively. The geographical distribution of the case studies and the spatial scale of the sample areas is illustrated in Figure 3.

3.1. Model Types

We identified three main types of models that were applied in the studies.
Type A: simple rule-based models: The majority of the models (n = 13) applied a workflow in a geographic information system (GIS) tool, combining spatial datasets mapping the geographic space into relevant ecological categories (e.g., ecosystem types) with non-spatial datasets linking these categories to a dedicated HPC metric (e.g., a ‘suitability score’ or an estimated ‘nectar-provisioning capacity’; Figure 4). The model output is a GIS map of the predicted ‘HPC metric’ covering the study area, characterizing the melliferous output of each pixel (how much ‘food’ could honey bees potentially find at that location).
Type B: extended rule-based models with bee foraging-range simulation: Some of the models (n = 4) included an additional step simulating bee foraging behavior at the “end” of their GIS workflow (e.g., as a moving-window operation; Figure 5). This type of model thus evaluates the landscape from a fundamentally different perspective: it evaluates each pixel as a potential hive location, aggregating the contributions of the surrounding landscape into a “hive input” metric.
Type C: predictive statistical models: This approach is often used in the context of ecosystem-service assessments and relies on identifying a statistical relationship between several predictor variables and “measured” values of the HPC indicator over a sample, then projecting this relationship into the geographical space [53]. In our review we only found one such study that met all the selection criteria—this concrete study applied generalized additive mixed models (GAMM) to estimate the “nectar species plant richness” over a 1 km2 grid covering the UK.
While all rule-based matrix models (Type A) are built from the same limited set of components (a combination of simple GIS operations including overlay, ‘crosswalking’ and classification), their input datasets and output metrics show great diversity. The most advanced ones follow a mechanistic pathway of calculations closely reflecting the way individual floral resources are combined into an overall provisioning capacity; such models connect ecosystem type maps to species lists and to quantitative nectar/pollen-flow estimations via representative phytosociological surveys and nectar flow measurement studies (Figure 4b) [54,55]. If either of these is not available, it is still possible to apply a general ES modelling approach and involve beekeepers to assign qualitative scores to all major ecosystem types in the study area (e.g., [52,56], Figure 4c). Another direction is inspired by multicriteria decision analysis (MCDA) techniques, wherein maps of several potentially relevant factors are collected in a GIS system and then weighted based on inputs from experts (beekeepers), typically in an analytical hierarchy process (AHP, e.g., [48,49,57], Figure 4d).
While extended rule-based models (Type B; Figure 5) might seem similar to type A models, the additional calculation step leads to a conceptually different final output metric: potential “hive input” (vs. the potential “floral output” maps achievable with Type A models). This type of model therefore essentially evaluates the landscape from the perspective of a hypothetical bee colony: it quantifies the resources available to the colony at a given location. We found two main subtypes of this model among the articles analyzed. Two studies simply extend the simple rule-based model scheme with an additional ‘moving window’ operation: [9] provides a spatial extension to a model similar to that of [54,55] (Figure 4b), whereas [50] extends a model similar to that of [52] (Figure 4c), with a moving-window focal-aggregation step to model the effect of bee foraging ranges. In addition, there are two studies from the US that follow a less straightforward approach for the spatial calculation steps (Figure 5b). These models first specify a number of binary criteria (quantitative thresholds, e.g., a minimum share of grasslands) that need to be met within foraging range of a “good apiary site”, then they evaluate these thresholds in a moving-window operation (often just for a number of prespecified “potential apiary sites”, which introduces other types of criteria, e.g., accessibility, into the calculation) and finally, they present the remaining suitable apiary sites (or just their density) on maps [58,59].
While there was only one study in the review that applied a statistical model to make spatial HPC predictions [60], there were some studies that applied statistical modelling techniques for hypothesis testing, typically to correlate spatial/temporal patterns of HPC changes with related patterns in honey provision and land-use changes [59]. Nevertheless, as the way these statistical models were created and used did not meet our criteria for HPC models/indicators, we did not consider them in this review.
It is important to mention that besides the above-described model types, there were also some very fine-scale mechanistic models such as BEEHAVE [61,62] or BEESCOUT [63] in the pool of studies resulting from our literature search, but none of these models were used for HPC modelling, so they were excluded from our review during the two-step screening process.

3.2. Model Assumptions

The models selected among several assumptions for use in their indicator development. Table 2 summarizes these assumptions, indicating the number of models considering each.
First, we were interested in whether there are model assumptions related to the colonies’ own honey consumption and whether supplementary feeding was declared/discussed. Our results show that out of the 18 models, only three clarified this point, either by explicitly considering the bees’ own consumption in the model [9] or by assuming that there were no additional human inputs (i.e., there is no additional feeding and thus that the bees sustain themselves from the honey they produce, such that the indicator represents the “surplus” [52]).
Another type of potentially hidden assumption in the HPC models is related to interannual fluctuations. The majority of models avoided this question by estimating the capacities on an ordinal scale or estimating the (potential) availability of plant resources. There were three models that declared that they assumed an optimal year enabling high plant performance [9,54,55], while the rest of the papers might have assumed an average year.
Fluctuations in honey flow can occur within the growing season, too, with nectar-rich “honey flow” periods followed by nectar-poor “dearth” periods. This temporal pattern was approached in two different ways by the models. Most of them (n = 15) estimated an aggregated HPC value for the whole growing season. Three models [9,50,55] distinguished separate subseasons (flow periods) and estimated individual HPC values for each (which may be aggregated as a final step).
Incorporating the foraging behavior of honey bees into the HPC calculations was performed by the four extended rule-based (type B) models. All of these studies assumed isotropic circular foraging ranges, which were implemented as a moving-window calculation to assess the potential “hive inputs” achievable at specified locations. The radii of the assumed foraging ranges were 2; 2.5; 3.2 and 3.2 km, respectively. The rest of the HPC models characterized the “local nectar output”.
The models also differed in terms of the floral-resource values they assigned to individual plant species during their HPC calculations. Six models assigned one value per (group of) melliferous species (possibly because only nectar capacity was considered), while four models [9,49,54,55] assigned separate values (nectar, pollen) to each (group of) melliferous species. In eight models, however, melliferous species were simply counted, each of them being considered with the same weight (flat-rate scoring).

3.3. Model Input Data

Table 3 summarizes the types of data incorporated in the HPC models. Considering spatially explicit input datasets, a categorical dataset (map) delineating an “ecosystem type” (ET) of some kind (including maps of, e.g., land use, land cover, or habitat type) was incorporated by all 18 models. Elevation (altitude above sea level), distance to surface water (representing water availability) and distance to roads (representing accessibility) were also frequently used as spatial input data, with seven models considering each. Soil characteristics (typically categorical types or other soil variables) [52,54,64], temperature (any annual or seasonal, mean or extreme climatic value) [60,64,65] and precipitation (any annual or seasonal, mean or extreme climatic value) [48,57,60] were considered by three models each. Two models [50,52] relied on the spatial distribution of agricultural crops (assigning the dominant crop species to each location within agricultural ETs) as spatial input data, and there were also two models that incorporated the distance to urban zones [57,66]. The spatial distribution of major melliferous plants (based on species-level occurrence data) [64], the spatial distribution of trees (assigning the dominant tree species to each location, typically only within forested ETs) [54], or the vegetation cover (defined as the coverage of any vegetation layer/canopy level) [64] were incorporated by only one model each.
The models relied on several types of non-spatial data sources, as well. These data sources were typically used as weighting factors or look-up tables during the GIS operations associated with the first two model types. The first main type of such non-spatial data sources was used to link the “ecosystem types” (as used in the model) to something more closely connected to honey. For example, seven models applied data sources describing the typical/expected floristic composition of each ET to transform the ecosystem-type maps into species maps. One of the models linked the ETs to successional stages [54], and one model used the ET map to map the length of the flowering season (duration of the availability of resources) [64].
The other main type of non-spatial input data was “species-level characteristics”, i.e., numbers that assign some sort of “resource value” to the individual plant species. In most cases, however, these species-level data were just qualitative estimations of the “relative usefulness” of the plant species assessed on a non-dimensional scale (e.g., as “expert scores”, [50,52,64]). There were a further three models that assigned more precise, biophysical-capacity-based values to the plant species. This was typically done by reusing previous nectar-capacity measurements published in the scientific literature [9,54], but the authors of one study actually performed their own original biophysical measurements in order to estimate the honey-provisioning capacities of the most relevant plant species [55].

4. Discussion

4.1. Discussion of the Findings of the Systematic Review

4.1.1. Key Decision Points in the Modelling Process

The ability of bees to collect nectar and pollen from a given source is largely determined by the availability of floral resources, but it is also influenced by a number of other spatial and temporal factors. The main objective of the literature review was to capture the diversity of models developed to quantify HPC. A detailed review of 17 studies helped to outline the typical model schemes and to explore the diversity of approaches used to input data and spatial and temporal variables. In the following paragraphs, we highlight the main decision points in the modelling process, as well as their inherent uncertainties and possible solutions.
Seasonality is important in beekeeping, as most floral resources are available for limited periods of time. In some habitat types (typically arable fields and species-poor plantations), a small number of nectar-producing species are present in high abundance, creating a massive but short nectar-flow period. These habitats are essential for the production of honey for the market. In other habitats, typically those that are more natural and diverse, there is a continuous, but not overwhelming, supply of flowers over a prolonged period of time. Sustainability in this context means that floral resources are available to bees throughout the growing season. The model schemes described above may not provide information on sustainability. This aspect can be incorporated into the models in several ways. One possibility involves carrying out separate assessments for specific periods (nectar-flow periods, seasons, months), as shown, e.g., in the articles by Ausseil et al. [9], Baude et al. [55] and Smith et al. [50]. An alternative is to incorporate the length of the flow periods in each habitat as a rule in the model, as in work by Amiri et al. [64]. A third option was chosen by Arany et al. [52], who estimated the values of ETs throughout the whole season by expert scoring, assuming stationary beekeeping. Incorporating sustainability into the model avoids overestimation of habitats with short, massive flow periods and underestimation of habitats offering moderate but persistent and steady supply to bees.
The flowering success, nectar production and nectar sugar content (and hence honey/nectar ratio) of a plant species varies across space and time. Spatial variation depends primarily on site conditions (e.g., soil type, slope and altitude, water availability), while temporal variation depends largely on weather conditions (precipitation, temperature). Temporal variability in nectar flow occurs both within a single season and between instances of the same season in consecutive years. Variations in site and weather conditions affect not only the species-level nectar-production capacity, but also the actual species composition of ecosystems.
In three of the papers included in the synthesis, the final indicator was expressed as the mass of nectar or honey (or sugar contained in these), projected per unit time and area. These values were determined in several steps and based on the authors’ own measurements [55] or on measured yields published in the literature [9,54]. However, published nectar-yield numbers based on measurements often overestimate the yield because they refer mostly to measured data from healthy plants grown under optimal site conditions (sometimes under targeted experimental conditions). This overestimation can be avoided by direct measurements on the site or by adjusting the values with rules for site and/or meteorological variables. Examples of the latter include the integration of soil type [54] and distance to surface water [9]. The uncertainty arising from biophysical nectar estimation can also be reduced by using an indicator at the first level of the ES cascade that expresses only the availability of relevant floral resources. This can be done by quantifying the number and/or abundance of nectar-producing plant species or by scoring ETs on a relative scale. Such indicators can also be refined with reference to site conditions or weather data, as was done in several articles in the synthesis database [48,49,52,57,58,60,64,65,66].
In reality, the nectar yield of habitats can only be optimally exploited by bee colonies of sufficient strength, since the population and health of a colony largely determine its honey-production capacity. Bees can be damaged by many diseases, pests and environmental stressors. Although specific bee pests and diseases cannot be considered as factors influencing the HPC of an ecosystem (they are not directly related to the bee pastures), ecosystem characteristics can indirectly influence the health and disease resistance of bees, and thus influence the honey yield achieved. One of the most important ecosystem characteristics for bee health is the availability of diverse pollen sources [34,67,68,69]. This justifies an assessment of habitat pollen capacity in addition to HPC. Among the papers reviewed, four studies conducted independent assessments of habitat pollen availability.

4.1.2. Methodological Uncertainties

With regard to the decision points discussed above, the most relevant sources of uncertainty in HPC assessment were identified during the systematic review. These uncertainties, along with our recommendations for mitigating them, are presented in Table 4.

4.1.3. Applicability of HPC Model Outputs in Apicultural Practice

The honey-provisioning-capacity models and the maps produced from them can have direct practical use, as they can help to select future beekeeping sites and plan seasonal migration by predicting the expected yield. However, for any model, practical applicability is determined by the usefulness of the outputs (HPC maps), which in turn depends to a large extent on the spatial resolution and accuracy of the input data. In addition, the accuracy of capacity estimations is also determined by the level of detail and sophistication of the rules integrated into the models and the degree to which they are able to capture the key factors (e.g., species distributions, climate, or land use) underlying the spatial variation in nectar production.
At coarse spatial resolution, maps are suitable for large-scale planning (e.g., comparison of broader landscapes or regions), but not so suitable for fine-scale planning (e.g., selecting actual apiary sites for, e.g., migration). However, models fed by fine-scale spatial data can potentially help in the selection of concrete sites as well. This is particularly true for extended rule-based (type B) models, as hive input maps provide information in a highly “user-friendly” way, directly addressing the beekeeper’s needs related to identification of the best apiary sites. Overlaying HPC maps with information on the accessibility of the potential sites (distance from roads, settlements) and the availability of water sources (an additional resource needed by honey bees, although it can be more easily substituted by human inputs compared to nectar) can provide further useful information for practical apiary-siting applications.
Models (especially type B models) that assess each honey-flow season separately can provide critically important planning information for migratory apiaries. Models that do not distinguish separate nectar-flow periods, but instead provide only an aggregated estimate of HPC over the whole growing season, can be most useful for stationary apiaries or more generally for landscape planning. From an applicability point of view, it is also worth highlighting the potential apiary-suitability maps, in which thresholds are assigned to specific uses (e.g., the number of bee colonies to be supplied), allowing the model to be directly adapted to the apiarists’ needs. Incorporating minimum thresholds of melliferous resources that are necessary to sustain a certain number of colonies can also help avoid intraspecific competition for the limited nectar resources. A map produced in this way can be used directly in the planning process, as opposed to, for example, relative scoring methods, which require thinking about where the relative scale of a given assessment lies on the full spectrum of real possibilities.

4.2. Reflections About the Methodology Used for the Systematic Review

In this study, we followed a qualitative methodology for systematic review, critical interpretive synthesis (CIS), to identify and characterize the main types of methodologies used by published studies to assess a rarely addressed “minor” ecosystem service: honey provision. In contrast with traditional (a.k.a. aggregative) systematic-review methodologies, which aim at summarizing data for clear and well-specified concepts (categories or variables), interpretive methodologies aim to understand the relationships among heterogeneous and often poorly specified concepts and to identify or develop new theories (frameworks) that connect them [46]. CIS can be straightforwardly combined with ‘innovative’ literature-search techniques like snowballing [70] and sampling until saturation [71], which also facilitate work across disciplinary boundaries, and can produce practically useful “mid-range synthesis of (…) existing theories that is neither so abstract that it lacks empirical applicability, nor so specific that its explanatory scope is limited” [47]. Nevertheless, CIS has only just begun to gain momentum in the fields of ecology and conservation biology and their peripheries (see e.g., [72,73,74,75,76,77], all of which are after 2020, cf. [78]), and to our knowledge, this is the first instance in which such a methodology has been used to synthesize different ecosystem-service modelling approaches applied by different disciplinary communities. In the future, CIS may have a very broad applicability in ecosystem-services science, which is a highly fragmented field building on a high number of well-established disciplines [79,80,81]. We hope that our pioneering application of the CIS methodology can also contribute to the long-term goal of improving the interoperability of ecosystem-service assessments [82].
Nevertheless, our application of the CIS methodology in this study still comes with several noteworthy limitations. For example, our choice of literature databases (Scopus, WoS) could have led us to miss many primarily non-scientific assessments of “bee-pastures”. Local–regional-scale studies applying simple qualitative methodologies (scores) in non-English-speaking countries may have been affected disproportionately by database bias, which means that the map presented in Figure 3 probably does not represent the real geographic distribution of efforts at HPC modelling (which is, of course, even more unrelated to the actual HPC capacities of the different regions). Similarly, the distribution of model types in Section 3.1 may in reality be even more skewed towards the simplest (type A) model types. Nevertheless, as the development of complex and innovative modelling approaches requires the involvement of scientists, who are rewarded for scientific publications, we still think that our results are comprehensive from the perspective of capturing the entire spectrum of HPC modelling approaches. We also think that the conclusions we drew about the different elements of the models can provide useful guidance for future modelling studies.

5. Conclusions

In order to ensure that the assessment of honey-provisioning capacity as an ES indicator is consistent and that different assessments are comparable, the definitions and methodological details need to be carefully considered and the steps and components of the indicator-development methodology need to be clearly and traceably documented and communicated. Below, we summarize the most important decisions that should be made at the research-design stage, depending on the purpose and scale of the survey and the data available.

5.1. Clear Definitions

A clear definition of the indicator should be established; this definition should allow no confusion between potential nectar production of plants and the potential honey yield achievable from bee colonies, as the latter involves assumptions not only about the nectar supply of plants but also about the efficiency with which bees can use them. In line with this, it should always be clear whether we want to map/model the ‘supply map’ of floral resources or the ‘input map’ of the colony (the resources available to bees from a given area).

5.2. Clear Methodology

Methodological decisions should be consciously managed and communicated, and all assumptions should be clear and transparent. As a general rule, it makes sense to choose methodologies that are less sensitive to uncertainties. If an accurate data source for biophysical assessment is available, it is advisable to incorporate the following aspects:
-
spatial variability in nectar sources
-
temporal dynamics of nectar flow, including seasonal fluctuations within growing seasons, with a special emphasis on the dynamics of nectar shortage and flowering peak periods
-
effects of climatic conditions on nectar provision
If accurate data for the above variables are not available, it is still possible to choose a more approximative or qualitative indicator (e.g., based on expert scores linked to the expected presence/abundance of key plant species).
It is important to identify a ‘reference beekeeping’ practice from the perspective of which the capacities can be evaluated. This is particularly important for studies providing quantitative estimations in terms of potential honey yield and can be seen as an important aspect of scientific integrity for modelling studies [83,84]. Several practices (like transhumance or supplementary feeding), as well as beehive density (which is related to intraspecific competition pressure) exert a huge influence on the amount and interpretation of achievable honey flows, so an explicit declaration of these assumptions and a discussion of the model’s limitations would significantly benefit the transparency of HPC assessment studies. Furthermore, such estimations should preferably be validated with actual yield data for honey.

5.3. Involvement of Beekeepers

In all cases, it is recommended that participatory methods be used at least at some stages of the indicator development. This essentially means consulting and working with local beekeepers, who have gained knowledge about honey-provisioning capacity through many years of experience in a given area. Even in the case of a fully biophysical model, it is worth validating the results by interviewing local beekeepers as experts and using data on their yields.

5.4. Impacts of Land Use on Pollinator Health

In order to maintain the nectar- and pollen-production capacity of habitats, it is important to manage them with conservation in mind. This protects both honey bees and wild bees, as advocated by several international and EU policies. In agricultural areas, careful planning and timing of potentially damaging interventions, especially pesticide applications, is necessary to minimize adverse impacts on bees. There is also a need for collaboration between beekeepers, farmers, foresters and conservationists to optimize benefits from food, feed, timber and honey production while ensuring favorable conservation status of habitats. The different ES maps can provide important information for such intersectoral discussions, help to coordinate land use and even serve as a tool for conflict resolution between sectors.
Land use has far-reaching impacts not only honey bees, but also wild pollinators in general and biodiversity. Therefore, in view of the worrying trends in the latter, assessment of a complex ES such as honey can contribute to land-use decisions that benefit honey bees, their wild relatives and wild pollinator species in general.

Supplementary Materials

The following supporting information can be downloaded at: https://www.mdpi.com/article/10.3390/su17104533/s1, Table S1: The studies processed in the systematic review, and the reviewers’ decisions about the individual inclusion criteria; Table S2: The data extracted from the reviewed studies. Table S3: PRISMA 2020 checklist.

Author Contributions

Conceptualization, I.A. and B.C.; methodology, B.C.; data extraction: I.A. and B.C.; data curation, B.C.; writing—original draft preparation, I.A. and B.C.; writing—review and editing, I.A. and B.C.; visualization, I.A. and B.C.; supervision, B.C.; project administration, I.A. and B.C.; funding acquisition, B.C. All authors have read and agreed to the published version of the manuscript.

Funding

This research was funded by the Hungarian National Research Development and Innovation Office (NKFIH OTKA, Grant K 128606 and Grant K 134329).

Data Availability Statement

The original contributions presented in this study are included in the article/Supplementary Materials. Further inquiries can be directed to the corresponding authors.

Acknowledgments

The authors thank Márton Kiss, Ágnes Vári, András Báldi, Eszter Tormáné Kovács, Edina Török, Edit Zajácz and Miklós Sárospataki for their useful comments and suggestions.

Conflicts of Interest

The authors declare no conflicts of interest. The funders had no role in the design of the study; in the collection, analyses, or interpretation of data; in the writing of the manuscript; or in the decision to publish the results.

Abbreviations

The following abbreviations are used in this manuscript:
ESecosystem services
ETecosystem type
HPChoney provisioning capacity

References

  1. Daily, G.C. Nature’s Services: Societal Dependence on Natural Ecosystems (1997). In The Future of Nature; Robin, L., Sörlin, S., Warde, P., Eds.; Yale University Press: New Haven, CT, USA, 2017; pp. 454–464. ISBN 978-0-300-18847-9. [Google Scholar]
  2. Reid, W.V.; Mooney, H.A.; Cropper, A.; Capistrano, D.; Carpenter, S.R.; Chopra, K.; Dasgupta, P.; Dietz, T.; Duraiappah, A.K.; Hassan, R.; et al. Ecosystems and Human Well-Being: Synthesis; The Millennium Ecosystem Assessment Series; Island Press: Washington, DC, USA, 2005; ISBN 978-1-59726-040-4. [Google Scholar]
  3. Díaz, S.; Demissew, S.; Carabias, J.; Joly, C.; Lonsdale, M.; Ash, N.; Larigauderie, A.; Adhikari, J.R.; Arico, S.; Báldi, A.; et al. The IPBES Conceptual Framework—Connecting Nature and People. Curr. Opin. Environ. Sustain. 2015, 14, 1–16. [Google Scholar] [CrossRef]
  4. Papa, G.; Maier, R.; Durazzo, A.; Lucarini, M.; Karabagias, I.K.; Plutino, M.; Bianchetto, E.; Aromolo, R.; Pignatti, G.; Ambrogio, A.; et al. The Honey Bee Apis mellifera: An Insect at the Interface between Human and Ecosystem Health. Biology 2022, 11, 233. [Google Scholar] [CrossRef] [PubMed]
  5. Aizen, M.A.; Harder, L.D. The Global Stock of Domesticated Honey Bees Is Growing Slower Than Agricultural Demand for Pollination. Curr. Biol. 2009, 19, 915–918. [Google Scholar] [CrossRef] [PubMed]
  6. Brittain, C.; Potts, S.G. The Potential Impacts of Insecticides on the Life-History Traits of Bees and the Consequences for Pollination. Basic Appl. Ecol. 2011, 12, 321–331. [Google Scholar] [CrossRef]
  7. IPBES. The Assessment Report of the Intergovernmental Science-Policy Platform on Biodiversity and Ecosystem Services on Pollinators, Pollination and Food Production; Potts, S.G., Imperatriz-Fonseca, V.L., Ngo, H.T., Eds.; Secretariat of the Intergovernmental Science-Policy Platform on Biodiversity and Ecosystem Services: Bonn, Germany, 2016. [Google Scholar] [CrossRef]
  8. Haines-Young, R.; Potschin, M.B. Common International Classification of Ecosystem Services (CICES) V5.2 and Guidance on the Application of the Revised Structure. Available online: https://cices.eu/ (accessed on 30 January 2025).
  9. Ausseil, A.E.; Dymond, J.R.; Newstrom, L. Mapping Floral Resources for Honey Bees in New Zealand at the Catchment Scale. Ecol. Appl. 2018, 28, 1182–1196. [Google Scholar] [CrossRef]
  10. Lehébel-Péron, A.; Sidawy, P.; Dounias, E.; Schatz, B. Attuning Local and Scientific Knowledge in the Context of Global Change: The Case of Heather Honey Production in Southern France. J. Rural Stud. 2016, 44, 132–142. [Google Scholar] [CrossRef]
  11. Keresztesi, B. Breeding and Cultivation of Black Locust, Robinia Pseudoacacia, in Hungary. For. Ecol. Manag. 1983, 6, 217–244. [Google Scholar] [CrossRef]
  12. Southwood, T.R.E. Entomology and Mankind: Insects over the Ages Have Greatly Affected Man’s Health and Food Supply and Have Played an Important Role as Religious and Cultural Symbols. Am. Sci. 1977, 65, 30–39. [Google Scholar]
  13. Seeley, T.D. The Lives of Bees: The Untold Story of the Honey Bee in the Wild; Princeton University Press: Princeton, NJ, USA, 2019; ISBN 978-0-691-16676-6. [Google Scholar]
  14. Klein, A.-M.; Boreux, V.; Fornoff, F.; Mupepele, A.-C.; Pufal, G. Relevance of Wild and Managed Bees for Human Well-Being. Curr. Opin. Insect Sci. 2018, 26, 82–88. [Google Scholar] [CrossRef]
  15. Potschin, M.B.; Haines-Young, R.H. Ecosystem Services: Exploring a Geographical Perspective. Prog. Phys. Geogr. Earth Environ. 2011, 35, 575–594. [Google Scholar] [CrossRef]
  16. Heink, U.; Jax, K. Going Upstream—How the Purpose of a Conceptual Framework for Ecosystem Services Determines Its Structure. Ecol. Econ. 2019, 156, 264–271. [Google Scholar] [CrossRef]
  17. Czúcz, B.; Haines-Young, R.; Kiss, M.; Bereczki, K.; Kertész, M.; Vári, Á.; Potschin-Young, M.; Arany, I. Ecosystem Service Indicators along the Cascade: How Do Assessment and Mapping Studies Position Their Indicators? Ecol. Indic. 2020, 118, 106729. [Google Scholar] [CrossRef]
  18. Wright, G.A.; Nicolson, S.W.; Shafir, S. Nutritional Physiology and Ecology of Honey Bees. Annu. Rev. Entomol. 2018, 63, 327–344. [Google Scholar] [CrossRef] [PubMed]
  19. Munro, J.A. A Study of the Factors Influencing the Yield of Honey during the Main Nectar Flow. J. Econ. Entomol. 1929, 22, 518–521. [Google Scholar] [CrossRef]
  20. Wielgolaski, F.E. Phenological Modifications in Plants by Various Edaphic Factors. Int. J. Biometeorol. 2001, 45, 196–202. [Google Scholar] [CrossRef]
  21. Dahlgren, J.P.; Von Zeipel, H.; Ehrlén, J. Variation in Vegetative and Flowering Phenology in a Forest Herb Caused by Environmental Heterogeneity. Am. J. Bot. 2007, 94, 1570–1576. [Google Scholar] [CrossRef]
  22. Holmes, W. The Influence of Weather on Annual Yields of Honey. J. Agric. Sci. 2002, 139, 95–102. [Google Scholar] [CrossRef]
  23. Corbet, S.A.; Willmer, P.G.; Beament, J.W.L.; Unwin, D.M.; Prŷs-Jones, O.E. Post-secretory Determinants of Sugar Concentration in Nectar. Plant Cell Environ. 1979, 2, 293–308. [Google Scholar] [CrossRef]
  24. Park, W. The Storing and Ripening of Honey by Honeybees. J. Econ. Entomol. 1925, 18, 405–410. [Google Scholar] [CrossRef]
  25. Lee, W.R. Relation of Distance to Foraging Intensity of Honey Bees (Apis mellifera) on Natural Food Sources1. Ann. Entomol. Soc. Am. 1965, 58, 94–100. [Google Scholar] [CrossRef]
  26. Robinson, S.V.J.; Hoover, S.E.; Pernal, S.F.; Cartar, R.V. Optimal Distributions of Central-Place Foragers: Honey Bee Foraging in a Mass Flowering Crop. Behav. Ecol. 2022, 33, 386–397. [Google Scholar] [CrossRef]
  27. Couvillon, M.J.; Riddell Pearce, F.C.; Accleton, C.; Fensome, K.A.; Quah, S.K.L.; Taylor, E.L.; Ratnieks, F.L.W. Honey Bee Foraging Distance Depends on Month and Forage Type. Apidologie 2015, 46, 61–70. [Google Scholar] [CrossRef]
  28. Schmickl, T.; Karsai, I. How Regulation Based on a Common Stomach Leads to Economic Optimization of Honeybee Foraging. J. Theor. Biol. 2016, 389, 274–286. [Google Scholar] [CrossRef]
  29. Örösi, P.Z. Méhek Között; Mezőgazdasági Kiadó: Budapest, Hungary, 1955. [Google Scholar]
  30. Ludányi, I.; Csaba, G. Méhész Leszek; Herman Ottó Intézet Nonprofit Kft.: Budapest, Hungary, 2020; Volume 1, ISBN 978-963-309-121-0. [Google Scholar]
  31. Woodcock, B.A.; Bullock, J.M.; Shore, R.F.; Heard, M.S.; Pereira, M.G.; Redhead, J.; Ridding, L.; Dean, H.; Sleep, D.; Henrys, P.; et al. Country-Specific Effects of Neonicotinoid Pesticides on Honey Bees and Wild Bees. Science 2017, 356, 1393–1395. [Google Scholar] [CrossRef]
  32. Molan, P.C. Authenticity of Honey. In Food Authentication; Ashurst, P.R., Dennis, M.J., Eds.; Springer: Boston, MA, USA, 1996; pp. 259–303. ISBN 978-1-4612-8426-0. [Google Scholar]
  33. La Notte, A. Ecologically Intermediate and Economically Final: The Role of the Ecosystem Services Framework in Measuring Sustainability in Agri-Food Systems. Land 2022, 11, 84. [Google Scholar] [CrossRef]
  34. Decourtye, A.; Mader, E.; Desneux, N. Landscape Enhancement of Floral Resources for Honey Bees in Agro-Ecosystems. Apidologie 2010, 41, 264–277. [Google Scholar] [CrossRef]
  35. Vaudo, A.D.; Tooker, J.F.; Grozinger, C.M.; Patch, H.M. Bee Nutrition and Floral Resource Restoration. Curr. Opin. Insect Sci. 2015, 10, 133–141. [Google Scholar] [CrossRef]
  36. Halmágyi, L.; Keresztesi, B.; Bujtás, Z. A Méhlegelő, 2nd ed.; Akadémiai Kiadó: Budapest, Hungary, 1991; ISBN 978-963-05-6017-7. [Google Scholar]
  37. Kovács-Hostyánszki, A.; Szigeti, V.; Miholcsa, Z.; Sándor, D.; Soltész, Z.; Török, E.; Fenesi, A. Threats and Benefits of Invasive Alien Plant Species on Pollinators. Basic Appl. Ecol. 2022, 64, 89–102. [Google Scholar] [CrossRef]
  38. Rollin, O.; Bretagnolle, V.; Decourtye, A.; Aptel, J.; Michel, N.; Vaissière, B.E.; Henry, M. Differences of Floral Resource Use between Honey Bees and Wild Bees in an Intensive Farming System. Agric. Ecosyst. Environ. 2013, 179, 78–86. [Google Scholar] [CrossRef]
  39. Requier, F.; Odoux, J.-F.; Tamic, T.; Moreau, N.; Henry, M.; Decourtye, A.; Bretagnolle, V. Honey Bee Diet in Intensive Farmland Habitats Reveals an Unexpectedly High Flower Richness and a Major Role of Weeds. Ecol. Appl. 2015, 25, 881–890. [Google Scholar] [CrossRef]
  40. Garbuzov, M.; Balfour, N.J.; Shackleton, K.; Al Toufailia, H.; Scandian, L.; Ratnieks, F.L.W. Multiple Methods of Assessing Nectar Foraging Conditions Indicate Peak Foraging Difficulty in Late Season. Insect Conserv. Divers. 2020, 13, 532–542. [Google Scholar] [CrossRef]
  41. Pilati, L.; Daris, R.; Prestamburgo, M.; Sgroi, F. Modeling Sequential Production: The Migratory Beekeeper Case. Qual. Access Success 2018, 19, 146–154. [Google Scholar]
  42. Crane, E. A Short History of Knowledge about Honey Bees (Apis) up to 1800. Bee World 2004, 85, 6–11. [Google Scholar] [CrossRef]
  43. Phillips, C. Telling Times: More-than-Human Temporalities in Beekeeping. Geoforum 2020, 108, 315–324. [Google Scholar] [CrossRef]
  44. Maderson, S. There’s More Than One Way To Know A Bee: Beekeepers’ Environmental Knowledge, and Its Potential Role in Governing for Sustainability. Geoforum 2023, 139, 103690. [Google Scholar] [CrossRef]
  45. Page, M.J.; McKenzie, J.E.; Bossuyt, P.M.; Boutron, I.; Hoffmann, T.C.; Mulrow, C.D.; Shamseer, L.; Tetzlaff, J.M.; Akl, E.A.; Brennan, S.E.; et al. The PRISMA 2020 Statement: An Updated Guideline for Reporting Systematic Reviews. BMJ 2021, 372, n71. [Google Scholar] [CrossRef]
  46. Dixon-Woods, M.; Bonas, S.; Booth, A.; Jones, D.R.; Miller, T.; Sutton, A.J.; Shaw, R.L.; Smith, J.A.; Young, B. How Can Systematic Reviews Incorporate Qualitative Research? A Critical Perspective. Qual. Res. 2006, 6, 27–44. [Google Scholar] [CrossRef]
  47. Dixon-Woods, M.; Cavers, D.; Agarwal, S.; Annandale, E.; Arthur, A.; Harvey, J.; Hsu, R.; Katbamna, S.; Olsen, R.; Smith, L.; et al. Conducting a Critical Interpretive Synthesis of the Literature on Access to Healthcare by Vulnerable Groups. BMC Med. Res. Methodol. 2006, 6, 35. [Google Scholar] [CrossRef]
  48. Estoque, R.C.; Murayama, Y. Suitability Analysis for Beekeeping Sites in La Union, Philippines, Using GIS and Multi-Criteria Evaluation Techniques. Res. J. Appl. Sci. 2010, 5, 242–253. [Google Scholar] [CrossRef]
  49. Maris, N.M.N.; Mansor, S.; Shafri, H.Z.M. Apicultural Site Zonation Using GIS and Multi-Criteria Decision Analysis. Pertanika J. Trop. Agric. Sci. 2008, 31, 147–162. [Google Scholar]
  50. Smith, D.; Davis, A.; Hitaj, C.; Hellerstein, D.; Preslicka, A.; Kogge, E.; Mushet, D.; Lonsdorf, E. The Contribution of Land Cover Change to the Decline of Honey Yields in the Northern Great Plains. Environ. Res. Lett. 2021, 16, 064050. [Google Scholar] [CrossRef]
  51. ISO 3166-1:2020(en); Codes for the Representation of Names of Countries and Their Subdivisions. International Organization for Standardization: Geneva, Switzerland, 2020.
  52. Arany, I.; Vari, A.; Aszalos, R.; Kelemen, K.; Kelemen, M.A.; Bone, G.; Lellei-Kovacz, E.; Czusz, B. Diversity of Flower-Rich Habitats as a Persistent Source of Healthy Diet for Honey Bees. Eur. J. Geogr. 2019, 10, 89–106. [Google Scholar]
  53. Tredennick, A.T.; Hooker, G.; Ellner, S.P.; Adler, P.B. A Practical Guide to Selecting Models for Exploration, Inference, and Prediction in Ecology. Ecology 2021, 102, e03336. [Google Scholar] [CrossRef] [PubMed]
  54. Affek, A.N. Indicators of Ecosystem Potential for Pollination and Honey Production. Ecol. Indic. 2018, 94, 33–45. [Google Scholar] [CrossRef]
  55. Baude, M.; Kunin, W.E.; Boatman, N.D.; Conyers, S.; Davies, N.; Gillespie, M.A.K.; Morton, R.D.; Smart, S.M.; Memmott, J. Historical Nectar Assessment Reveals the Fall and Rise of Floral Resources in Britain. Nature 2016, 530, 85–88. [Google Scholar] [CrossRef]
  56. Balzan, M.V.; Caruana, J.; Zammit, A. Assessing the Capacity and Flow of Ecosystem Services in Multifunctional Landscapes: Evidence of a Rural-Urban Gradient in a Mediterranean Small Island State. Land Use Policy 2018, 75, 711–725. [Google Scholar] [CrossRef]
  57. Sari, F.; Kandemir, İ.; Ceylan, D.A.; Gül, A. Using AHP and PROMETHEE Multi-Criteria Decision Making Methods to Define Suitable Apiary Locations. J. Apic. Res. 2020, 59, 546–557. [Google Scholar] [CrossRef]
  58. Gallant, A.L.; Euliss, N.H.; Browning, Z. Mapping Large-Area Landscape Suitability for Honey Bees to Assess the Influence of Land-Use Change on Sustainability of National Pollination Services. PLoS ONE 2014, 9, e99268. [Google Scholar] [CrossRef]
  59. Otto, C.R.V.; Zheng, H.; Gallant, A.L.; Iovanna, R.; Carlson, B.L.; Smart, M.D.; Hyberg, S. Past Role and Future Outlook of the Conservation Reserve Program for Supporting Honey Bees in the Great Plains. Proc. Natl. Acad. Sci. USA 2018, 115, 7629–7634. [Google Scholar] [CrossRef]
  60. Norton, L.R.; Smart, S.M.; Maskell, L.C.; Henrys, P.A.; Wood, C.M.; Keith, A.M.; Emmett, B.A.; Cosby, B.J.; Thomas, A.; Scholefield, P.A.; et al. Identifying Effective Approaches for Monitoring National Natural Capital for Policy Use. Ecosyst. Serv. 2018, 30, 98–106. [Google Scholar] [CrossRef]
  61. Becher, M.A.; Grimm, V.; Thorbek, P.; Horn, J.; Kennedy, P.J.; Osborne, J.L. BEEHAVE: A Systems Model of Honeybee Colony Dynamics and Foraging to Explore Multifactorial Causes of Colony Failure. J. Appl. Ecol. 2014, 51, 470–482. [Google Scholar] [CrossRef] [PubMed]
  62. Horn, J.; Becher, M.A.; Kennedy, P.J.; Osborne, J.L.; Grimm, V. Multiple Stressors: Using the Honeybee Model BEEHAVE to Explore How Spatial and Temporal Forage Stress Affects Colony Resilience. Oikos 2016, 125, 1001–1016. [Google Scholar] [CrossRef]
  63. Becher, M.A.; Grimm, V.; Knapp, J.; Horn, J.; Twiston-Davies, G.; Osborne, J.L. BEESCOUT: A Model of Bee Scouting Behaviour and a Software Tool for Characterizing Nectar/Pollen Landscapes for BEEHAVE. Ecol. Model. 2016, 340, 126–133. [Google Scholar] [CrossRef] [PubMed]
  64. Amiri, F.; Mohamed Shariff, A.R.B.; Arekhi, S. An Approach for Rangeland Suitability Analysis to Apiculture Planning in Gharah Aghach Region, Isfahan-Iran. World Appl. Sci. J. 2011, 12, 962–972. [Google Scholar]
  65. Zoccali, P.; Malacrinò, A.; Campolo, O.; Laudani, F.; Algeri, G.M.; Giunti, G.; Strano, C.P.; Benelli, G.; Palmeri, V. A Novel GIS-Based Approach to Assess Beekeeping Suitability of Mediterranean Lands. Saudi J. Biol. Sci. 2017, 24, 1045–1050. [Google Scholar] [CrossRef]
  66. Campana, C.; Peralta, C.; Cecconello, J.C.; Pons, D.H.; Uranga, J.; Scavuzzo, M.C.; Ferral, A. Geospatial Tools Applied to the Generation of an Aptitude Map for the Development of Beekeeping Activity in San Javier, Córdoba, Argentina. In Proceedings of the 2019 XVIII Workshop on Information Processing and Control (RPIC), Bahía Blanca, Argentina, 18–20 September 2019; pp. 298–302. [Google Scholar]
  67. Vanbergen, A.J. The Insect Pollinators Initiative Threats to an Ecosystem Service: Pressures on Pollinators. Front. Ecol. Environ. 2013, 11, 251–259. [Google Scholar] [CrossRef]
  68. Pettis, J.S.; Lichtenberg, E.M.; Andree, M.; Stitzinger, J.; Rose, R.; van Engelsdorp, D. Crop Pollination Exposes Honey Bees to Pesticides Which Alters Their Susceptibility to the Gut Pathogen Nosema ceranae. PLoS ONE 2013, 8, e70182. [Google Scholar] [CrossRef]
  69. Sánchez-Bayo, F.; Goulson, D.; Pennacchio, F.; Nazzi, F.; Goka, K.; Desneux, N. Are Bee Diseases Linked to Pesticides?—A Brief Review. Environ. Int. 2016, 89–90, 7–11. [Google Scholar] [CrossRef]
  70. Greenhalgh, T.; Peacock, R. Effectiveness and Efficiency of Search Methods in Systematic Reviews of Complex Evidence: Audit of Primary Sources. BMJ 2005, 331, 1064–1065. [Google Scholar] [CrossRef]
  71. Saunders, B.; Sim, J.; Kingstone, T.; Baker, S.; Waterfield, J.; Bartlam, B.; Burroughs, H.; Jinks, C. Saturation in Qualitative Research: Exploring Its Conceptualization and Operationalization. Qual. Quant. 2018, 52, 1893–1907. [Google Scholar] [CrossRef]
  72. Davis, L.F.; Ramírez-Andreotta, M.D. Participatory Research for Environmental Justice: A Critical Interpretive Synthesis. Environ. Health Perspect. 2021, 129, 026001. [Google Scholar] [CrossRef] [PubMed]
  73. Hemmelgarn, H.L.; Munsell, J.F. Exploring ‘beyond-Food’ Opportunities for Biocultural Conservation in Urban Forest Gardens. Urban Agric. Reg. Food Syst. 2021, 6, e20009. [Google Scholar] [CrossRef]
  74. Perevochtchikova, M.; Castro-Díaz, R.; Langle-Flores, A.; Von Thaden Ugalde, J.J. A Systematic Review of Scientific Publications on the Effects of Payments for Ecosystem Services in Latin America, 2000–2020. Ecosyst. Serv. 2021, 49, 101270. [Google Scholar] [CrossRef]
  75. House, J.; Kleiber, D.; Steenbergen, D.J.; Stacey, N. Participatory Monitoring in Community-Based Fisheries Management through a Gender Lens. Ambio 2023, 52, 300–318. [Google Scholar] [CrossRef]
  76. Himes, A.; Muraca, B.; Anderson, C.B.; Athayde, S.; Beery, T.; Cantú-Fernández, M.; González-Jiménez, D.; Gould, R.K.; Hejnowicz, A.P.; Kenter, J.; et al. Why Nature Matters: A Systematic Review of Intrinsic, Instrumental, and Relational Values. BioScience 2024, 74, 25–43. [Google Scholar] [CrossRef]
  77. Muller, J.; McEwan, K.; Gorczynski, P.; Weston, N. Defining Contemporary Outdoor Physical Activity: A Critical Interpretive Synthesis. J. Outdoor Recreat. Tour. 2024, 47, 100799. [Google Scholar] [CrossRef]
  78. Macura, B.; Suškevičs, M.; Garside, R.; Hannes, K.; Rees, R.; Rodela, R. Systematic Reviews of Qualitative Evidence for Environmental Policy and Management: An Overview of Different Methodological Options. Environ. Evid. 2019, 8, 24. [Google Scholar] [CrossRef]
  79. Chen, H.; Sloggy, M.R.; Dhiaulhaq, A.; Escobedo, F.J.; Rasheed, A.R.; Sánchez, J.J.; Yang, W.; Yu, F.; Meng, Z. Boundary of Ecosystem Services: Guiding Future Development and Application of the Ecosystem Service Concepts. J. Environ. Manag. 2023, 344, 118752. [Google Scholar] [CrossRef]
  80. Schutter, M.S.; Hicks, C.C. Speaking across Boundaries to Explore the Potential for Interdisciplinarity in Ecosystem Services Knowledge Production. Conserv. Biol. 2021, 35, 1198–1209. [Google Scholar] [CrossRef]
  81. Steger, C.; Hirsch, S.; Evers, C.; Branoff, B.; Petrova, M.; Nielsen-Pincus, M.; Wardropper, C.; Van Riper, C.J. Ecosystem Services as Boundary Objects for Transdisciplinary Collaboration. Ecol. Econ. 2018, 143, 153–160. [Google Scholar] [CrossRef]
  82. Bagstad, K.J.; Balbi, S.; Adamo, G.; Athanasiadis, I.N.; Affinito, F.; Willcock, S.; Magrach, A.; Hayashi, K.; Harmáčková, Z.V.; Niamir, A.; et al. Interoperability for Ecosystem Service Assessments: Why, How, Who, and for Whom? Ecosyst. Serv. 2025, 72, 101705. [Google Scholar] [CrossRef]
  83. Polasky, S.; Tallis, H.; Reyers, B. Setting the Bar: Standards for Ecosystem Services. Proc. Natl. Acad. Sci. USA 2015, 112, 7356–7361. [Google Scholar] [CrossRef] [PubMed]
  84. Bistline, J.; Budolfson, M.; Francis, B. Deepening Transparency about Value-Laden Assumptions in Energy and Environmental Modelling: Improving Best Practices for Both Modellers and Non-Modellers. Clim. Policy 2021, 21, 1–15. [Google Scholar] [CrossRef]
Figure 1. The cascade conceptual framework of ecosystem services and the definition of the four main stages (cascade levels) of honey provision, as used in this paper.
Sustainability 17 04533 g001
Figure 3. Spatial extent and geographical distribution of the case-study areas reviewed. Local-scale studies (blue dots): 1–100 km2, medium-scale studies (red dots): 100–100,000 km2, large-scale studies (green dots): >100,000 km2.
Sustainability 17 04533 g003
Figure 4. Simple rule-based GIS models (model type A) are commonly used for mapping/assessing the local output of floral resources (how much of a resource is “offered” by the local ecosystem at each location). (a) the complete modelling workflow (covering all possible types of input data). (bd) depending on the availability of the different data sources, type A models may also follow simpler workflows.
Sustainability 17 04533 g004
Figure 5. Extended rule-based GIS models (model type B) map/assess “potential hive inputs” (how much of a resource could potentially be reached from a hive placed at each of the studied locations). Such models rely on components similar to those used in type A models, but they combine these with an additional spatial analysis simulating bee flight ranges. (a,b) the two main subtypes of such models.
Sustainability 17 04533 g005
Table 1. List of variables assessed during data analysis. Corresponding information extracted from the reviewed studies is available in Supplementary Table S2.
A: Case Study Area
A1Country
(The country of the study)
  • ISO 3166-1 alpha-2 code [51]
A2Spatial scale
(The spatial extent of the study area expressed in size classes)
  • 1: 1–100 km2 (local & landscape-scale studies)
  • 2: 100–100,000 km2 (medium-scale regional or national studies)
  • 3: >100,000 km2 (large-scale regional or national studies)
A2.1Spatial location
(Geographic location of the study area)
  • free text
A2.2Spatial extent
(Size of the study area in km2)
  • number
B: Model Assumptions
B1Human inputs
(Are model assumptions related to the colonies’ own honey consumption, and is supplementary feeding declared/discussed?)
  • X: no assumptions declared (the authors don’t mention/discuss this question)
  • B: the bees’ own consumption is discussed/considered in the model
  • H: assumptions about human inputs (e.g., “without feeding”) declared
  • U: unclear
B2Interannual fluctuations
(Are such fluctuations considered? If yes, how?)
  • O: the model assumes/assesses an optimal year
  • X: question avoided (capacity estimated on an ordinal scale or at a more stable level of plant-resource availability)
B3Seasonal fluctuations
(Are such fluctuations considered? If yes, how?)
  • A: aggregate capacity value for the whole year is modelled
  • S: multiple honey seasons are distinguished (modelled separately, but may be aggregated as a final step)
B4Foraging behaviour
(Are the foraging ranges/movements of the bees considered? If yes, how?)
  • 0: movements not considered (HPC indicator characterises the “local nectar output”)
  • 1: foraging considered with isotropic foraging ranges and a moving window
B5Foraging distance
(Radius of the foraging ranges used in the model in km)
  • number
B6Floral resource types
(Which floral resource types (pollen, nectar, honeydew) are considered/distinguished?)
  • S: Separate values (nectar, pollen) are assigned to each (group of) melliferous species
  • J: a single joint value is assigned to each (group of) melliferous species (possibly because only nectar capacity considered)
  • F: species counting; melliferous species are simply counted and each of them is considered with the same weight (flat-rate scoring)
C: Model Input Data
C1Spatial data
(Spatially explicit input datasets, multiple selection)
et: ecosystem type (ET), including land use, land cover, habitat type, or other categorical variable assigned to each location reflecting the distinct combinations of abiotic and biotic environmental parameters
hs: spatial distribution of honey species (based on species level occurrence data)
cr: spatial distribution of agricultural crops (assigning the dominant crop species to each location within agricultural ETs)
tr: spatial distribution of trees (assigning the dominant tree species to each location, typically only within forested ETs)
vc: vegetation cover (of any vegetation layer/canopy level, typically in %);
so: soil types (typically categorical) or other soil variables
el: elevation: altitude above sea level (possibly as categories)
dw: distance to surface water (water availability)
dr: distance to roads (accessibility)
dc: distance to urban zones
ct: temperature (any annual or seasonal, mean or extreme climatic value)
cp: precipitation (any annual or seasonal, mean or extreme climatic value)
C2Ecosystem type-level data
(Non-spatial input data assigned to ETs, multiple selection)
  • hp: occurrence of honey plants based on floristic composition: “typical” species-composition profiles (including crop types and forest types)
  • su: successional stage
  • sl: length of flowering season: time duration of the availability of resources
C3Species-level characteristics
(Non-spatial input data assigned to plant species, multiple selection)
mo: original biophysical measurements
ml: values/measurements from literature
sc: estimated scores
D: Model Output (HPC Indicator)
D1Indicator name
(The name of the HPC indicator (model output) as used in the original study)
  • free text
D2Indicator type
(What kind of units is the final HPC indicator expressed in?)
NH: nectar or honey yield (expressed in mass/area/time “flow” units)
FP: density of relevant plant species
XX: dimensionless score
D2.1Measurement scale
(A concise textual description of the measurement scale/units)
  • free text
D3Validation
(Were the model outputs validated in some way? If yes, how?)
  • X: no validation
  • E: “look and feel” validation with external experts
  • V: visual comparison with apiary location data or regional statistics
  • Y: comparison with actual yield data from local apiaries
  • U: unclear
E: Model Type
MTModel types
(The model type identified in this study, synthetic construct)
  • A: simple rule-based (matrix) model
  • B: extended rule-based model (with flight ranges)
  • C: predictive statistical/correlative models
Table 2. Numbers of HPC models that make assumptions about certain variables.
Variables ConsideredNo. of HPC Models
B1 Human Inputs
X: no assumptions declared13
B: the bees’ own consumption considered1
H: assumptions about human inputs2
U: unclear2
B2 Interannual Fluctuations
O: optimal year assumed3
X: question avoided15
B3 Seasonal Fluctuations
A: aggregated for the whole year15
S: honey seasons are distinguished3
B4 Foraging Behavior
0: movements not considered14
1: foraging ranges considered4
B6 Floral Resource Types
S: separate values for nectar and pollen4
J: a single joint value6
F: flat rate; melliferous species are counted8
Table 3. Types of data incorporated into the HPC models.
Data Incorporated in the HPC ModelNo. of HPC Models
Spatially Explicit Data Sets
et: ecosystem type18
hs: honey species locations1
cr: agricultural crop map2
tr: forest/tree map1
vc: vegetation cover1
so: soil variables3
el: elevation7
dw: distance to water7
dr: distance to roads7
dc: distance to settlements2
ct: temperature3
cp: precipitation3
ET-Level Data
hp: floristic composition7
su: successional stage classes1
sl: length of flowering season1
Species-Level Data
mo: original measurements1
ml: literature data2
sc: estimated scores4
Table 4. Suggested methodological approaches to address the uncertainties identified.
Source of UncertaintySuggestion to Manage Uncertainty
Variation in species composition within ETsMake direct use of species-distribution data
Refine the species composition of ETs using species-distribution models
The nectar yield of certain plant species is unknownCarry out a biophysical estimate of nectar yield based on field measurements in the sample area
Uncertainty of the sugar content of nectar (honey/nectar ratio)Carefully select the honey/nectar ratio and accurately document the calculation
Calibrate/validate the model with actual honey yields
High seasonality of nectar yieldAssume low-input stationary beekeeping when estimating honey-provisioning capacity for the whole growing season or define a reference beekeeping practice
Separately assess each nectar-flow period
Variation in nectar yield due to weather variabilityModify biophysical nectar-yield estimates with weather variables
Calibrate/validate the model with actual honey yields
Variation in nectar yield due to site conditionsModify the value of biophysical nectar-yield estimates with site variables
Calibrate/validate the model with actual honey yields
Effects of ecosystem type and land use on bee healthIntegrate variables describing plant communities and management practices that can affect (support or harm) bee health in the model
Disclaimer/Publisher’s Note: The statements, opinions and data contained in all publications are solely those of the individual author(s) and contributor(s) and not of MDPI and/or the editor(s). MDPI and/or the editor(s) disclaim responsibility for any injury to people or property resulting from any ideas, methods, instructions or products referred to in the content.

