Article

Investigating Threshold Distances and Behavioral Factors Affecting Railway Station Accessibility: A Case Study of the Seoul Metropolitan Area, South Korea

by
Kyujin Lee
1,
Tae-Wan Kim
1,
Jaeho Kwak
2 and
Gyoseok Jeon
1,*
1
Department of Transportation Engineering, Ajou University, Suwon 16499, Republic of Korea
2
Korea Railroad Research Institute, Suwon 16105, Republic of Korea
*
Author to whom correspondence should be addressed.
Sustainability 2025, 17(10), 4501; https://doi.org/10.3390/su17104501
Submission received: 25 March 2025 / Revised: 8 May 2025 / Accepted: 9 May 2025 / Published: 15 May 2025

Abstract

:
This study aimed to analyze the characteristics and influencing factors of the access trips of railway users in the Seoul Metropolitan Area, South Korea. A total of 11 metropolitan railway stations and 4 urban railway stations were selected, and data on users’ travel characteristics—including access modes, travel purposes, demographic attributes, and whether they were accompanied by infants—were collected through one-on-one interviews. Based on 1683 collected cases, the data were analyzed using a multivariate analysis of variance (MANOVA). The results showed a statistically significant difference between bus access distances, which were 1.78 km for metropolitan railways and 1.59 km for urban railways. In contrast, the walking access distances were approximately 620 m for both, showing a minimal difference. The further analysis of factors influencing the access distance revealed that apartment ownership, users’ income level, the presence of accompanying travelers, the distance between stations, the number of transfer routes, and whether users were traveling with infants had significant effects.

1. Introduction

Railways contribute to addressing urban traffic issues associated with urban expansion, traffic congestion, and air pollution [1]. In terms of urban development, they also play an important role in policy measures to increase the utilization rate of public transportation, such as Transit-Oriented Development (TOD) [2]. In a study by Chen [3], an imbalance was confirmed through the calculation of the TOD convenience index of the subway in China. Through this, it was found that it is necessary to improve the pedestrian environment and accessibility around subway stations and reduce the access distance through linkages with public transportation.
Previous studies on railway systems have mostly focused on high-speed inter-regional accessibility and advanced systems. In terms of urban transportation, however, the connections between railway systems and the walking access distance involved in using railway systems are important. Understanding these factors requires research at microscopic spatial levels, such as on the characteristics of rail users [4]. Yang et al. [5] analyzed important conditions for passengers to use railway systems. They reported that the access distance had an importance of approximately 70%, while other conditions had an importance of approximately 10%, supporting the need for research at more microscopic spatial levels. This indicates that ensuring accessibility to railway systems is important even though an improvement in the overall service quality of railway systems is essential. In addition, Li [6] also emphasized that the accessibility of railways is an important indicator for evaluating a railway’s efficiency. This can vary depending on the scale of the station and is a more important indicator in small stations in particular.
To increase the railway utilization rate and public transportation mode share, it is necessary to improve railway accessibility for passengers. Specifically, access to stations near origins or destinations such as workplaces and schools should be facilitated. In this regard, basic research on the threshold for the access distance is essential. Of course, research on the access distance/egress distance has been conducted in studies related to measures and railway policies to improve the railway utilization rate for addressing urban traffic issues. Despite differences depending on the country, region, and demographic characteristics, however, the thresholds for the access distance presented in previous studies, such as walking access distances of 500 and 800 m, have been commonly applied [7].
Seoul, in Korea, has an area of 605 km2, and the length of the urban rail network operated in the city amounts to 343 km. This is similar to a road length of approximately 380 km in New York. Additionally, Seoul has 589 bus routes, and the number of bus routes per square kilometer (0.97) ranks first globally. Compared to 0.64 in London and 0.62 in Paris, it presents a density approximately 50% higher. In Seoul, with a high public transportation density compared to other cities in the world, accessing the subway using bicycles instead of walking may increase the service coverage by 30% to 93.6% [8]. Despite the high density of public transportation systems in Seoul and the surrounding metropolitan area, relevant empirical research remains scarce, thereby reinforcing the critical need for this study.
This study investigated the access modes, access travel characteristics, and demographic characteristics of the passengers at 15 rail stations, including 11 metropolitan rail stations and 4 urban rail stations in the Seoul Metropolitan Area (SMA) of Korea. The interview survey was designed to secure a sample of approximately 100 individuals per station, and a total of 1683 interview surveys were conducted. Finally, the analysis focused on the relationships between the obtained survey data and the characteristics of the surveyed routes (e.g., distance between stations), as well as the relationships between the location characteristics of each station and the access modes and access distance characteristics of passengers. A multivariate analysis of variance (MANOVA) and a multi-level regression model were utilized as analysis methodologies.

2. Literature Review
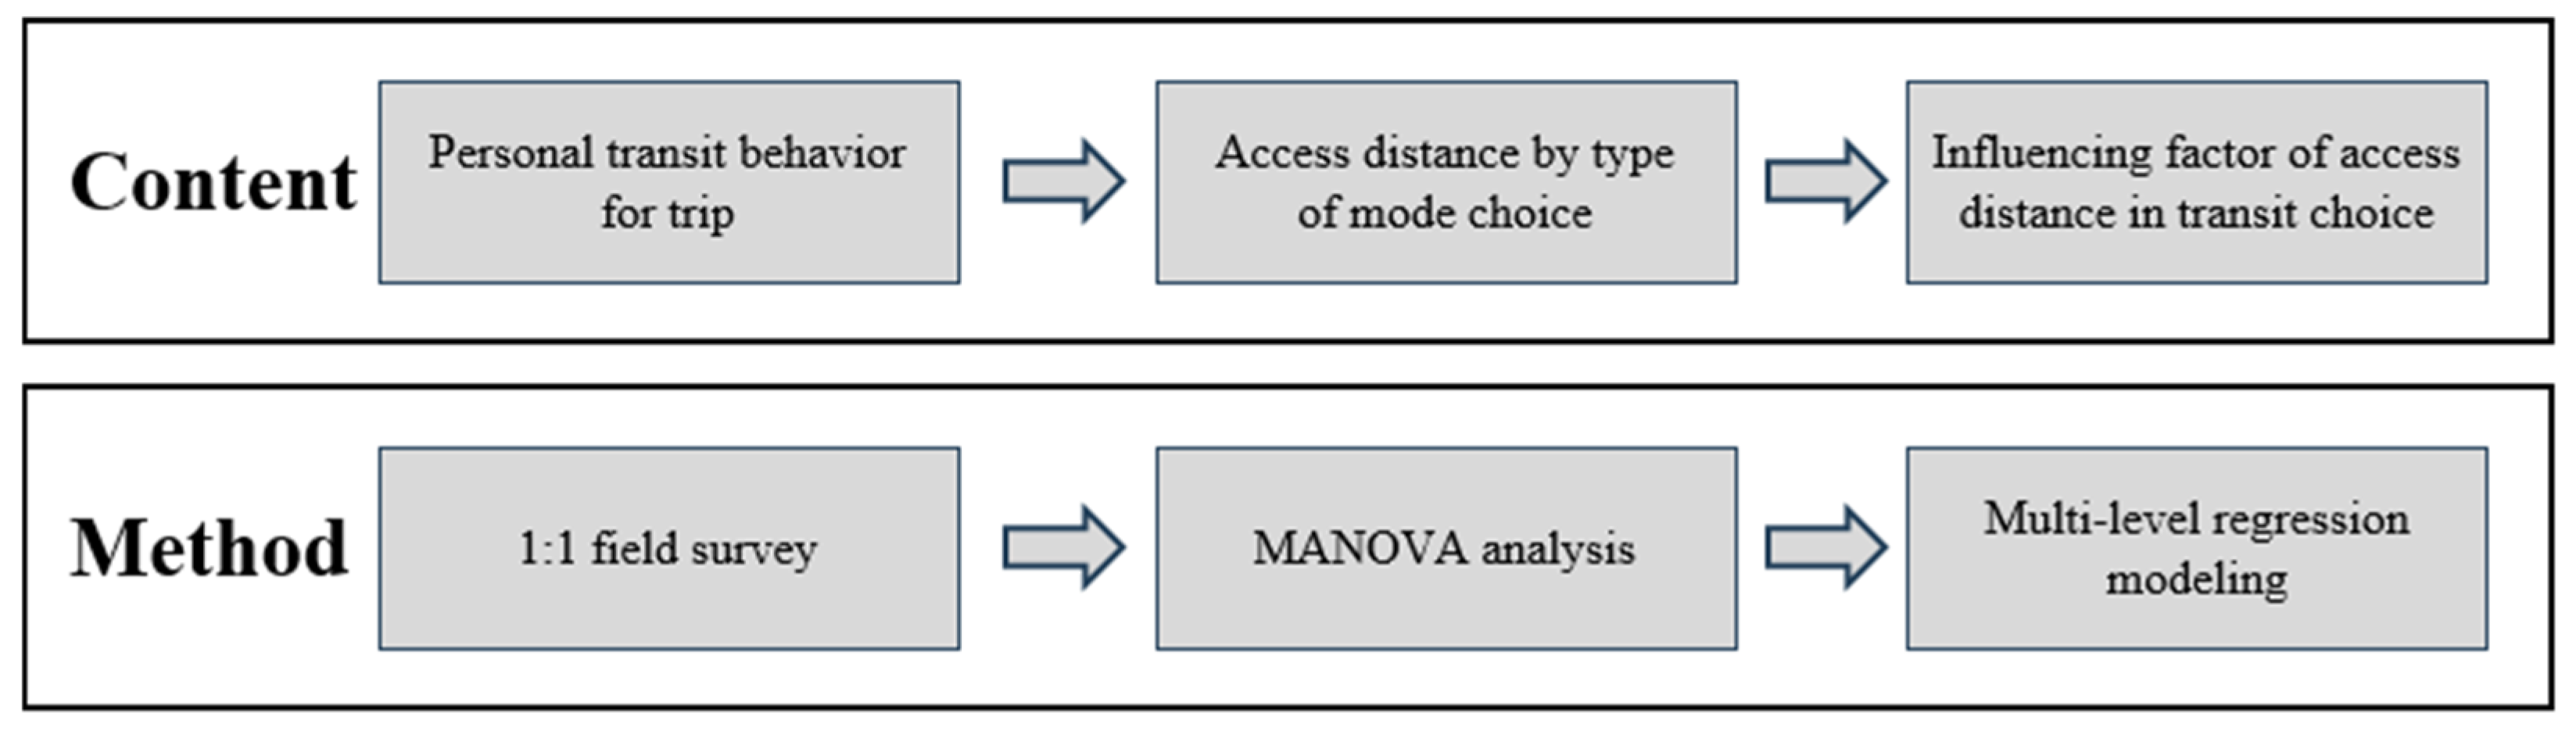
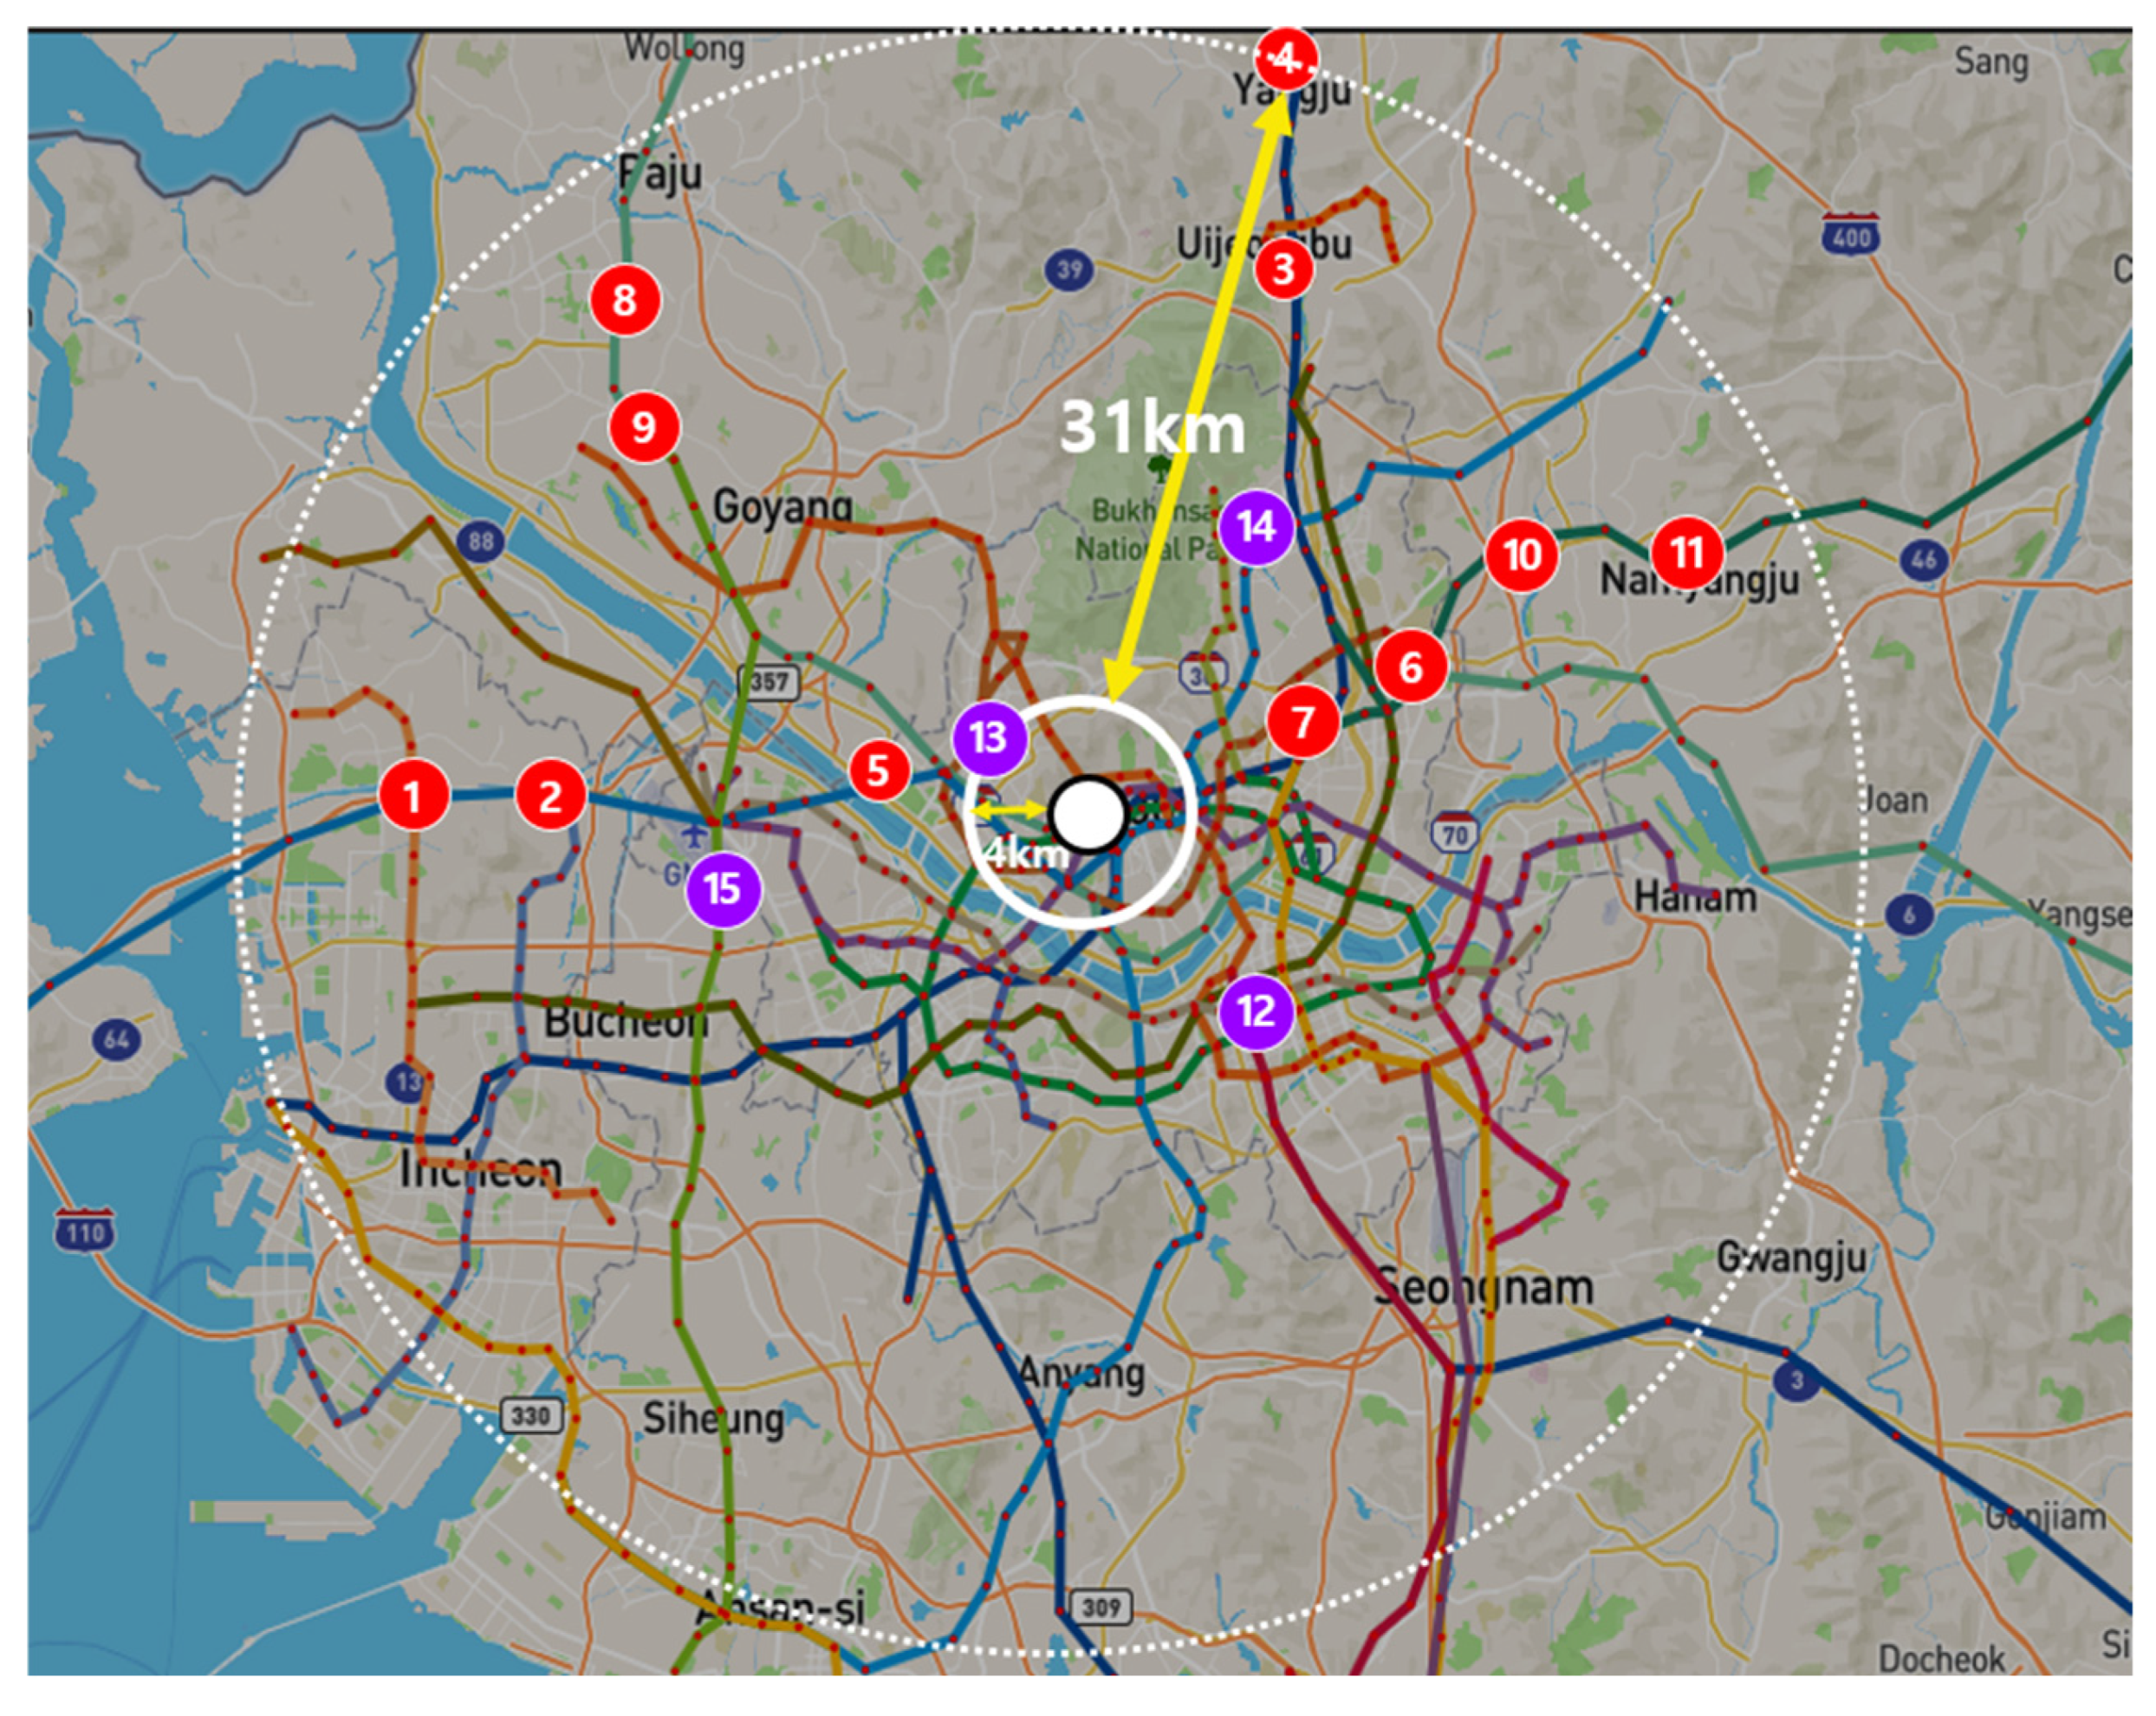
Studies related to the establishment of the concept of a metropolitan pedestrian catchment area have been conducted since the mid-1990s. Cervero [9] conducted an initial study on users’ walking access distance and rail use. Cevero examined the correlations between three major variables (density, land use type and diversity, and transit provision) and rail use and reported that the land use diversity had the largest impact. Alshalalfah and Shalaby researched the walking distance of passengers and its influencing factors [10]. They found that demographic characteristics had very sensitive impacts on the walking distance, which varied depending on the characteristics of passengers (e.g., age and disabilities). Zhao and Deng conducted research on the threshold distance based on such personal characteristics and modes of transport [11]. They mentioned that the threshold for the access distance may increase for access by bus during peak hours as the age of the passengers decreases. They found that the threshold increased by 200 to 300 m for access by bus compared to access by walking and that the threshold was 100 m longer when there was an overpass and it was used. He et al. classified the passengers of Nanjing Subway Line 2 into six groups based on statistical characteristics and examined the difference in their walking access distances [12]. They mentioned that the middle class, in terms of their income, were highly dependent on the subway, and they tended to walk longer distances than other groups. In addition, the passengers’ education level and occupation were found to be valid indicators of the distance walked to stations, but there was no correlation between gender and the walking access distance.
Similar results were found in Witchayaphong’s study [13]. The study was conducted on Thailand, and the study also found that passengers’ income level was the most influential factor in subway use. However, the study also found that gender was an influential factor, and women were found to be more dependent on the subway.
Daniels and Mulley analyzed the correlations between the access distance required to use public transportation and demographic characteristics (e.g., gender, age, and income), as well as travel characteristics (e.g., travel purpose, travel time, and fare) [7]. They found that the total travel distance was a significant factor influencing the choice of subway use among passengers and mentioned that passengers tended to use the subway when the total travel distance was approximately 19 km. In terms of demographic characteristics, they found that the threshold walking distance required to use the subway was high for young people aged between 19 and 49 years and that the threshold was higher for people with a driver’s license compared to those without. They presented 400 m as the threshold for the walking distance but mentioned that the subway utilization rate increased when passengers’ residences were closer to stations. Meanwhile, a study by Ronda found that passengers tended to use the subway when the total travel distance was 19 km, likely owing to the characteristics of the study area.
The threshold for the access distance also varies depending on the region. In a study by Olszewski and Wibowo conducted in Singapore, it was found that approximately 60% of passengers walk 600 m to access the subway [14]. In a study by Jiang and Mehndiratta [15] conducted on Mumbai rail users, however, the threshold for the access distance was found to be 1.50 m for 86% of passengers. There was also a difference in the threshold for the access distance between the United States and Canada, as the results were 300 to 900 m for the United States and 400 to 800 m for Canada.
As for studies conducted in Korea, Lee et al. analyzed the effects of socioeconomic conditions (e.g., personal income and workplace location) and key factors (e.g., access time and distance) on the public transportation accessibility using logistics models and found two major thresholds for the walking access distance (700 and 1100 m) [16]. Conversely, Lee et al. calculated the threshold walking distance for the use of public transportation using the socioeconomic indicators of individuals and households as well as logistic models, and the result was 440 to 460 m [17]. There was a difference in the threshold for the walking distance between the two studies, indicating a difference in regional characteristics even within the same country. Considering that personal mobility (PM) was introduced in mid-2010 and has been popular since 2020 in Korea, it can be said that this difference is affected by access to infrastructure, despite being found within the same area. In a study by Jun et al. [18] in Korea, it was found that the number of passengers and catchment area for each station varied depending on various elements, such as the population, employment density, land use diversity, and connectivity between transportation modes. They examined the land use characteristics of the pedestrian catchment area (PCA) based on the TOD principle. Based on their study using the population density and the commercial land use ratio, they suggested that a radius of 600 m should be used as the PCA in the public transportation environment of cities with high business, commercial, and population densities, such as Seoul.
Li et al. [19] calculated the walking time of passengers in relation to the characteristics of passengers, the time of day, the number of passengers according to the station, and facility sizes using transportation card data. They found that there was a difference in the walking time of passengers depending on peak/non-peak hour characteristics and that the walking time was short during peak hours. In addition, Viggiano et al. calculated the average walking distance for passengers and the maximum access distance traveled by bicycle using card data for London. They found that the average walking distance varied depending on the number of transfers and the number of stops and that the walking distance category of 0 to 2 miles (3219 m) exhibited the highest proportion on average. In addition, the number of transit stops was not significant. In the case of transfers, there were some differences depending on the number of individual journeys, but the walking distance category of 0 to 2 miles invariably accounted for the highest proportion of the variance. A comparative study of the access distance for walking and cycling using card data in Nanjing, China, found that while both modes had the same access travel time of 8 min, the travel distance differed by about 1.3 times due to the difference in modes [20].
Jun et al. [18] divided factors that affect the access distance to rail stations into four main categories: land use and the built environment, socioeconomic variables, transit-related variables, and the location/accessibility/neighbpleporhood [21].
Through various studies, it was possible to identify various factors that affect the threshold for the walking distance to rail stations. It was found that the threshold is closely related to geographic factors that vary depending on the country and city, as well as demographic characteristics.
The studies reviewed in this study can be found in Table 1. The studies indicated that the population density, employment density, land use diversity, and the intermodal connectivity estimated using the number of bus stops showed a positive correlation with the subway utilization rate. Chia [22] distinguished eight groups using various demographic indicators and analyzed their sensitivity to the walking access time. Regarding the results, part-time workers, high-income earners, and the elderly were the most sensitive to the walking time, while students and office workers were the least sensitive. Based on the various studies examined above, it was found that public transportation accessibility is significantly different depending on personal characteristics.
This study set itself apart from previous studies in the following ways: First, it attempted to comprehensively consider the accessibility of rail stations, transportation characteristics, and the characteristics of railway routes, including the number of trunk lines, feeder lines, and metropolitan bus routes that are connected to rail stations as well as rail station sizes, in addition to the demographic characteristics of rail users. Second, based on this, various influencing factors were identified, and their relative influence was quantitatively presented. Third, an attempt was made to present rich insights into the walking access distances required for rail use, even though the scope was limited to the SMA.

3. Data and Methods

As for the routes and stations to be surveyed, 11 metropolitan rail stations, including Geomam, Gyeyang, Nogyang, Deokgye, Digital Media City, and Sangbong stations, and 4 urban rail stations, including Seolleung and Hongje stations, were selected. For selecting survey targets (routes and stops), stations included in the route across Seoul that had a similar land use and residential population density near the station and were sufficiently distant (approximately 10 km or more) from other survey stations were selected. The survey method was a one-on-one interview method designed to provide a sample of approximately 100 for each rail station in the Figure 1. Table 2 displays the number of samples collected for each rail station and location of the rail station is displayed in Figure 2. The survey items included individual and household characteristics, such as gender, income, and the number of household members, and rail station use and access characteristics, such as the travel purpose, travel mode, and travel time. Data collection was carried out across both peak and off-peak times on weekdays, including typical morning and evening commute times.
To minimize bias in the data due to the sample design, stratified sampling was performed regarding the gender and access mode of survey subjects for each rail station. Accordingly, the survey was designed to ensure that 50% of the subjects were males and 50% were females and that 50% of the subjects had used a bus access mode and 50% had used a walking access mode.

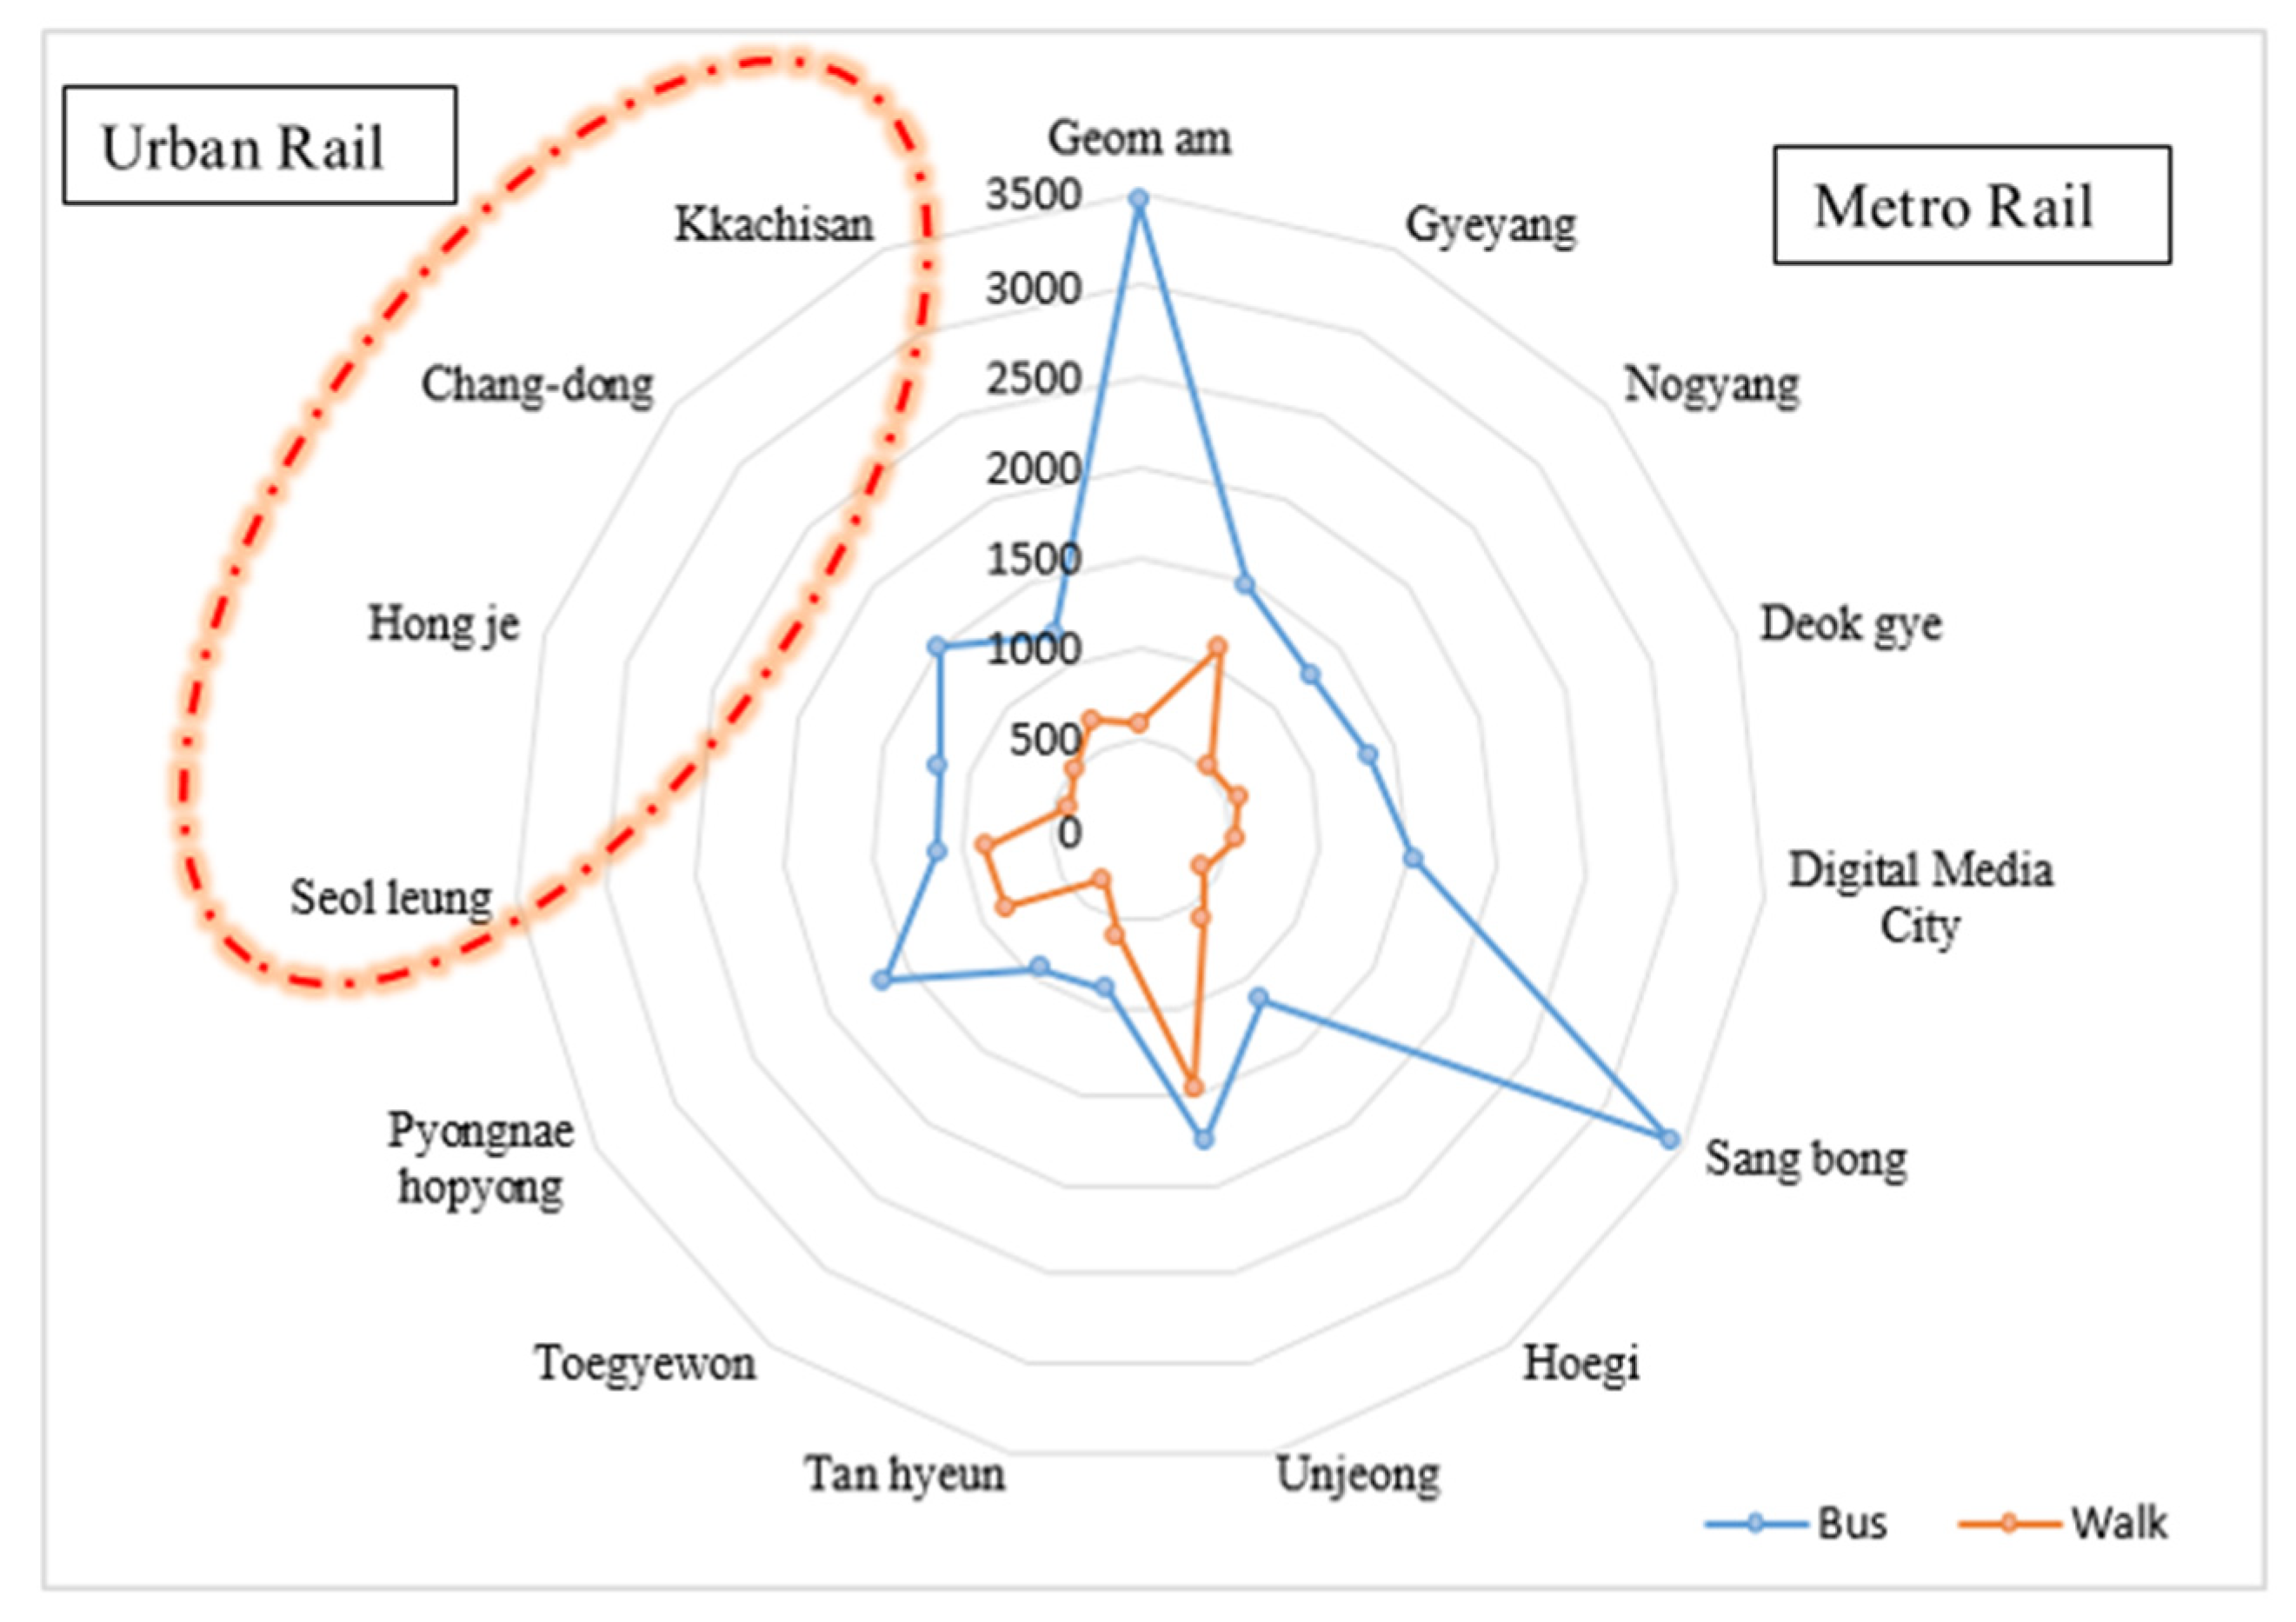
4. Descriptive Analyses

The rail stations under survey had an average daily passenger count of 14,285. The number of connected bus routes was eighteen, and the number of transfer routes was one. When the passenger characteristics for the 11 target stations were analyzed, apartment residents represented 76% of the sample, office workers 55%, and vehicle owners 39%. The average number of transfers was 1.1, and 76% of the passengers used the rail stations for commuting to work. Specific figures can be found in Table 3.

5. Results

5.1. Verification of Differences in Access Distance by Rail Station

Upon analyzing the access distances of passengers who reached the rail stations by bus, it was found that there was a difference in the access distance depending on the type of rail service, as the results were 1.78 km for the metropolitan rail stations and 1.59 km for the urban rail stations. Moreover, there were differences in the bus access distance even between the metropolitan rail stations. For example, there was a large difference in the access distance between the Geomam and Tanhyeun stations, as the results were 3.5 km and 0.9 km, respectively. These data indicate that the choice of residential location and the resulting bus access distance varied depending on the type of rail service and the attractiveness of the rail stations.
When the access distances of passengers who reached the rail stations on foot were analyzed, they were found to be similar between the metropolitan and urban rail stations, as the results were 626 and 629 m, respectively, as shown in Table 4. There were, however, significant differences in the walking access distance by the rail station as shown in Figure 3. For example, the walking access distance to Unjeong station was 1.5 km, while the walking access distance to Toegyewon station was 341 m. These results for other stations can be seen numerically in Table 4, and these differences can be seen graphically in Figure 4. This appears to have been because the residential location characteristics were different depending on the location and type of the rail stations.
A review of previous studies conducted in South Korea revealed that Lee et al. [16] proposed pedestrian access thresholds of 700 m and 1100 m, while Jun et al. [18] suggested a 600 m pedestrian catchment area. In the present study, the pedestrian access distances were found to be within a comparable range. Furthermore, the variations in the walking access distances across individual stations were also observed to fall within the ranges reported in the aforementioned studies.
For the statistical verification of the difference in the access distance depending on the rail station and access mode, the MANOVA technique was utilized by setting the access distance as a dependent variable. A MANOVA is used to compare the vectors of group means when there are multiple dependent variables. If the correlations among the dependent variables are high, this demonstrates that conducting a MANOVA is desirable instead of conducting an analysis of variance (ANOVA) several times. This is because a repeated ANOVA may increase the probability of type 1 errors. Therefore, a MANOVA was conducted after setting “the average vectors of all rail station groups are the same” as a null hypothesis.
The analysis results revealed that the significance level was less than 0.05 for all four statistics, as illustrated in Table 5, indicating that there was a significant difference in the access distance depending on the rail station. The squared value of the bus access distance was found to be the highest among the access modes, indicating that bus service access management is important in promoting the use of the rail stations, as shown in Table 6. There was, however, no significant difference in the walking access distance depending on the type of rail service (significance level: 0.188).

5.2. Comparison of Access Distance Estimation Models

It was found that there were statistically significant differences in the access distance depending on the rail station and access mode. To analyze factors that affected the access distance, a multi-level regression model was constructed using the access distance as the dependent variable and the individual, household, and rail station characteristics as independent variables, as shown in Table 7. The coefficients for each influencing factor were estimated. The model was constructed by using logarithms to normalize the distribution of the access distance, which was a positive value.
It was found that the access distance to the rail stations was long for non-apartment residents, high-income residents, and rail stations with many passengers, routes with long distances between stations, and routes with many transfers. This appears to have been because multi-family houses and row houses are usually the closest to rail stations in Korea, and high-income residents mostly live in eco-friendly areas rather than relatively crowded commercial districts due to their high share of passenger cars. The access distance for passengers was relatively long for rail stations with many passengers and routes with long distances between stations. As shown in Table 7, the station spacing was found to have a statistically significant positive effect on the access distance (Coef. = 0.009, t = 3.028). This suggests that as the distance between stations increased, users tended to travel farther to access rail stations. Furthermore, the number of subway transfer lines (Coef. = 0.143, t = 2.252) and the number of local bus routes (Coef. = 0.051, t = 3.064) were also positively associated with longer access distances, implying that greater station connectivity and accessibility enhance the attractiveness of stations, thereby influencing residential location choices and travel behavior.
In the case of the bus access distance to the rail stations, it was found that the access distance decreased as the number of children in a family increased. This appears to have been because people traveling with children are highly resistant to transfers, especially between public transportation modes. The bus access distance flexibly increased for the rail stations with many connected bus routes. This finding confirms the significance of connected transportation systems in promoting the use of rail stations. In particular, the bus access distance to the metropolitan rail stations was found to be significantly longer than that to the urban rail stations. This confirms that the job–housing proximity range is different depending on the type of rail service and that it is necessary to connect differentiated transportation and urban facilities.
In the case of the walking access distance to the rail stations, the access distance when commuting to work flexibly increased. Unlike the bus access distance, the walking access distance became longer as the number of children increased. This variation appears to have been due to the fares associated with the access modes and the inconvenience of transfers. As with the bus access distance, the walking access distance grew longer as the distance between stations and the number of transfer routes increased. It was found that the bus access distance to the above-ground stations was longer than that to the underground stations. This appears to have been because underground stations are generally located in residential or commercial areas, whereas aboveground stations are constructed in areas with a low land use density.

6. Conclusions and Discussion

In this study, eleven metropolitan rail stations and four urban rail stations were selected, and data on demographic and travel characteristics (e.g., rail access characteristics, gender, household characteristics, and access modes) were collected using a one-on-one interview method. Upon analyzing the access distance for rail use, the bus access distances were found to be 1.78 km for the metropolitan rail stations and 1.59 km for the urban rail stations, showing a statistically significant difference. This evidence indicates that bus connections are important in improving the railway utilization rate. When the walking access distance for rail use was analyzed, the results were 636 m for the metropolitan rail stations and 629 m for the urban rail stations, showing similar levels for the two and no statistically significant difference. When the factors influencing the access distance were examined, it was found that the access distance to the rail stations was long for non-apartment residents, high-income residents, rail stations with many passengers, routes with long distances between stations, and routes with many transfers. The observation that non-apartment residents tended to have longer walking access distances compared to apartment residents suggests a meaningful association with the spatial distribution of high-density apartment complexes near railway stations. This finding supports the rationale of Transit-Oriented Development (TOD), which advocates for the strategic placement of high-density residential developments and the integration of feeder bus networks around stations (transit hubs).
Especially in the case of the bus access distance, the access distance decreased as the number of children in a family increased. These data indicates that travelers with children are highly resistant to transfers. The walking access distance was found to be long for commuting to work and traveling with children.
This study reviewed previous studies on the rail access distance and derived conclusions using a more microscopic approach by obtaining data through in-depth interviews. Metropolitan and urban rail stations were distinguished in this approach, and both bus and walking access distances were covered, with comprehensive discussions on the factors influencing them. Unlike in previous studies, the residential and household characteristics of rail users were considered. Based on the analysis of these factors, policy measures to improve the railway utilization rate were discussed. These factors differentiate this study from previous studies.
Finally, this study is expected to contribute to the development of policies for improving railway utilization rates in Korea and other countries.

Author Contributions

Conceptualization and methodology, K.L. and G.J.; software, K.L.; validation, K.L.; investigation, K.L. and T.-W.K.; writing—original draft preparation, G.J. and J.K.; writing—review and editing; T.-W.K. and J.K.; supervision, G.J.; funding acquisition, G.J. All authors have read and agreed to the published version of the manuscript.

Funding

This research was supported by the Korea Agency for Infrastructure Technology Advancement (KAIA) grant funded by the Ministry of Land, Infrastructure and Transport (Grant RS-2022-00143574).

Institutional Review Board Statement

Ethical review and approval were waived for this study due to Guidelines for IRB Review of Research in the Humanities and Social Sciences (National Research Foundation of Korea).

Informed Consent Statement

Informed consent was obtained from all subjects involved in the study.

Data Availability Statement

The datasets used and/or analyzed during the current study available from the corresponding author on reasonable request.

Conflicts of Interest

The authors declare no conflicts of interest.

References

  1. Gan, Z.; Yang, M.; Feng, T.; Timmermans, H.J. Examining the relationship between built environment and metro ridership at station-to-station level. Transp. Res. Part D Transp. Environ. 2020, 82, 102332. [Google Scholar] [CrossRef]
  2. Zhao, J.; Deng, W.; Song, Y.; Zhu, Y. What influences Metro station ridership in China? Insights from Nanjing. Cities 2013, 35, 114–124. [Google Scholar] [CrossRef]
  3. Chen, Z.; Wu, T.; Gao, L.; Zhou, Y. Comparative Analysis of Transit-Oriented Development (TOD) Types in the Metropolitan Region Along the Middle Reaches of the Yangtze River. Sustainability 2024, 16, 9884. [Google Scholar] [CrossRef]
  4. Jin, F.; Wang, C.; Cao, Y.; Cao, X.; Wang, J.; Dai, T.; Jiao, J. Progress of research on transportation geography in China. J. Geogr. Sci. 2016, 26, 1067–1080. [Google Scholar] [CrossRef]
  5. Yang, R.; Yan, H.; Xiong, W.; Liu, T. The study of pedestrian accessibility to rail transit stations based on KLP model. Procedia-Soc. Behav. Sci. 2013, 96, 714–722. [Google Scholar] [CrossRef]
  6. Li, X.; Liu, Z.; Ma, X. Measuring access and egress distance and catchment area of multiple feeding modes for metro transferring using survey data. Sustainability 2022, 14, 2841. [Google Scholar] [CrossRef]
  7. Daniels, R.; Mulley, C. Explaining walking distance to public transport: The dominance of public transport supply. J. Transp. Land Use 2013, 6, 5–20. [Google Scholar] [CrossRef]
  8. Lee, J.; Choi, K.; Leem, Y. Bicycle-based transit-oriented development as an alternative to overcome the criticisms of the conventional transit-oriented development. Int. J. Sustain. Transp. 2015, 10, 975–984. [Google Scholar] [CrossRef]
  9. Cervero, R. Walk-and-ride: Factors influencing pedestrian access to transit. J. Public Transp. 2001, 3, 1–23. [Google Scholar] [CrossRef]
  10. Alshalalfah, B.W.; Shalaby, A.S. Case study: Relationship of walk access distance to transit with service, travel, and personal characteristics. J. Urban Plan. Dev. 2007, 133, 114–118. [Google Scholar] [CrossRef]
  11. Zhao, J.; Deng, W. Relationship of walk access distance to rapid rail transit stations with personal characteristics and station context. J. Urban Plan. Dev. 2013, 139, 311–321. [Google Scholar] [CrossRef]
  12. He, J.; Zhang, R.; Huang, X.; Xi, G. Walking access distance of metro passengers and relationship with demographic characteristics: A case study of Nanjing metro. Chin. Geogr. Sci. 2018, 28, 612–623. [Google Scholar] [CrossRef]
  13. Witchayaphong, P.; Pravinvongvuth, S.; Kanitpong, K.; Sano, K.; Horpibulsuk, S. Influential factors affecting travelers’ mode choice behavior on mass transit in Bangkok, Thailand. Sustainability 2020, 12, 9522. [Google Scholar] [CrossRef]
  14. Olszewski, P.; Wibowo, S.S. Using equivalent walking distance to assess pedestrian accessibility to transit stations in Singapore. Transp. Res. Rec. 2005, 1927, 38–45. [Google Scholar] [CrossRef]
  15. Jiang, Y.; Zegras, P.C.; Mehndiratta, S. Walk the line: Station context, corridor type and bus rapid transit walk access in Jinan, China. J. Transp. Geogr. 2012, 20, 1–14. [Google Scholar] [CrossRef]
  16. Lee, K.-I.; Kim, K.-J.; Kwon, S.-J. A Study on Characteristics of Subway Utilization and Pedestrians’ Accessibility at New Towns in Korea. J. Asian Arch. Build. Eng. 2005, 4, 85–95. [Google Scholar] [CrossRef]
  17. Lee, E.H.; Kim, K.; Kho, S.-Y.; Kim, D.-K.; Cho, S.-H. Exploring for route preferences of subway passengers using smart card and train log data. J. Adv. Transp. 2022, 2022, 6657486. [Google Scholar] [CrossRef]
  18. Jun, M.-J.; Choi, K.; Jeong, J.-E.; Kwon, K.-H.; Kim, H.-J. Land use characteristics of subway catchment areas and their influence on subway ridership in Seoul. J. Transp. Geogr. 2015, 48, 30–40. [Google Scholar] [CrossRef]
  19. Li, W.; Yan, X.; Li, X.; Yang, J. Estimate passengers’ walking and waiting time in metro station using smart card data (SCD). IEEE Access 2020, 8, 11074–11083. [Google Scholar] [CrossRef]
  20. Li, D.; Zang, H.; He, Q. Assessing Rail Station Accessibility Based on Improved Two-Step Floating Catchment Area Method and Map Service API. Sustainability 2022, 14, 1528. [Google Scholar] [CrossRef]
  21. Viggiano, C.; Koutsopoulos, H.N.; Attanucci, J.; Wilson, N.H.M. Inferring public transport access distance from smart card registration and transaction data. Transp. Res. Rec. 2016, 2544, 55–62. [Google Scholar] [CrossRef]
  22. Chia, J.; Lee, J.; Kamruzzaman, M.D. Walking to public transit: Exploring variations by socioeconomic status. Int. J. Sustain. Transp. 2016, 10, 805–814. [Google Scholar] [CrossRef]
Figure 1. Research method.
Sustainability 17 04501 g001
Figure 2. Location of surveyed stations.
Sustainability 17 04501 g002
Figure 3. Differences in access distance by type of rail service and mode choice.
Sustainability 17 04501 g003
Figure 4. Differences in access distance by type of mode choice.
Sustainability 17 04501 g004
Table 1. Summary of review.
Author (Year)Target AreaMethodDependent VariablePCAFindings
Cevero [9]MD, USAOLSBoarding at
34 stations
N/AEmployment density; residential density; land use diversity; residential orientation; terminal
Lee et al. [17]New towns, Republic of KoreaANOVAWalking distance700 mAnnual incomes under 50 million won; middle class; possession of vehicles; age
Olszewski and Wobowo [14]SingaporeOLSBoarding at
11 stations
608 mNumber of road crossings; traffic conflicts; number of ascending steps
Alshalalfah and Shalaby [10]Toronto, ON, CanadaOLSMorning peak boarding300 mDwelling type of the household; number of vehicles in the household; transit service frequency
Jiang et al. [15]Jinan, ChinaOLSBoarding at
3 stations
1350 mTransfer station; shaded corridors; peak time
Zhao et al. [11]Nanjing, ChinaOLSAverage boarding200–300 mMorning peak time; younger commuters; increasing household income; accessibility
Daniels and Mulley [7]Sydney, AustraliaGWRWalking distance to buses and trains400 mWalking trips to train station were longer than those to bus stop; walking distance in sub-urban areas was longer; trip purpose; age
Jun et al. [18]Seoul, Republic of KoreaGWRAverage boarding600 mLevel of mixed-use land; population and employment densities; land use diversity; intermodal connectivity
Viggiano et al. [21]Oyster, LondonANOVACard data on a.m. peak0–2 mileNumber of journeys; number of stops
Chia et al. [22]Brisbane, AustraliaANOVAHousehold travel survey400 mAge; income; labor force
He et al. [12]Nanjing, ChinaANOVAWalking distanceN/AAge; middle-class household income; travel frequency; travel purpose; education; exchange station; spatial factors
Li et al. [19]Nanjing, ChinaMLESmart card dataN/ATravel time; time of day (travel at peak time took longer); elderly or disabled passengers had longer walking distances
Lee et al. [17]Seoul, Republic of KoreaECDFAverage boarding600 mNumber of transfers; total distance of trip; access walking distance
Table 2. Sample size for each station surveyed.
TypeRail StationCodeNTypeRail StationCodeN
Metropolitan
rail
Geom am1113Metropolitan
rail
Toegyewon10116
Gyeyang2147Pyongnae hopyong11117
Nogyang3107Sub-total-1302
Deok gye4150Urban
rail
Seol leung1292
Digital Media City5143Hong je1395
Sang bong6111Chang-dong14100
Hoegi7114Kkachisan1594
Unjeong881Sub-total-381
Tan hyeun9103 1683
Table 3. Descriptive statistics for survey data.
VariableTypeN.Ave.Std.
Dependent variablesDistanceLD1Continuous16832.910.32
(all modes)LD2Continuous5393.130.24
Distance by busLD3Continuous8982.720.26
Walking distanceLD4Continuous2463.100.27
Distance traveled via multiple modesD51: bus or multiple; 0: walking16860.50
Independent variablesPersonal/
household characteristics
GenderI11: male; 0: female16830.49
Residence typeI21: apartment; 0: other16830.76
JobI31: worker; 0: other16830.55
Marital statusI41: married; 0: not married16830.60
Number of people in the householdI5Continuous16833.521.06
Number of childrenI6Continuous16830.200.50
Number of workersI7Continuous16831.760.71
Driver’s licenseI81: yes; 0: no16660.64
Vehicle ownershipI91: yes; 0: no16830.39
Housing tenureI101: owner occupancy; 0: other16830.530.50
Income (per year)I111: over KRW 500 million; 0: other16830.47
AgeI12Discrete16832.101.08
Trip purposeI131: commute to work/school;
0: shopping/leisure
16830.76
Number of transfersI14Continuous16831.100.31
Station characteristicsAverage passengers (per day)I15Continuous1514,28515,735
Station spacing (m)I16Continuous1527962767
Number of bus routesI17Continuous1518.5313.24
Number of rapid bus routesI18Continuous153.173.85
Number of trunk line bus routesI19Continuous154.786.00
Number of feeder bus routesI20Continuous155.576.36
Number of local bus routesI21Continuous151.141.80
Number of subway transfer linesI22Continuous150.981.21
Number of exitsI23Continuous153.502.90
Station structureI241: ground-level;
0: underground
150.83
Route characteristicsType of rail serviceI251: metropolitan; 0: urban110.77
Table 4. Differences in access distance by type of mode choice.
TypeRail StationBus (m)Walking (m)
Ave.Std.Ave.Std.
Metropolitan railGeom am34631302587290
Gyeyang14676051100388
Nogyang1279473525261
Deok gye1340453583252
Digital Media City1539459534181
Sang bong3422243405171
Hoegi1154283603321
Unjeong17526201446565
Tan hyeun893334587393
Toegyewon943137341170
Pyongnae hopyong1650878861441
Sub-total17801143626422
Urban railSeol leung1131271868444
Hong je1173815410172
Chang-dong1510541489241
Kkachisan1174527668202
Sub-total1185660637356
Total15971055629409
Table 5. Multivariate analysis of variance results.
EffectValueFHypothesis dfError dfSig.Partial Eta SquaredObserved Power
InterceptPillai’s Trace0.98949,9943.0001679.0000.000 **0.9891.000
Wilks’ Lambda0.01149,9943.0001679.0000.000 **0.9891.000
Hotelling’s Trace89.3349,9943.0001679.0000.000 **0.9891.000
Roy’s Largest Root89.3349,9943.0001679.0000.000 **0.9891.000
Type of rail servicePillai’s Trace0.03117.993.0001679.0000.000 **0.0311.000
Wilks’ Lambda0.96917.9943.0001679.0000.000 **0.0311.000
Hotelling’s Trace0.03217.9943.0001679.0000.000 **0.0311.000
Roy’s Largest Root0.03217.9943.0001679.0000.000 **0.0311.000
** = p < 0.05.
Table 6. Results from tests of between-subjects effects.
SourceType III Sum of SquaresdfMean SquareFSig.Partial Eta SquaredObserved Power
Corrected ModelDistance
(all modes)
0.42010.4204.0160.0450.0020.517
Distance by bus48.604148.60422.8560.000 **0.0130.998
Walking distance3.25313.2531.7320.1880.0010.260
InterceptDistance
(All modes)
9892.36819892.36894,633.470.000 **0.9831.000
Distance by bus1462.90611462.906687.9220.000 **0.2901.000
Walking distance2387.30212387.3021270.9690.000 **0.4311.000
Type of Rail ServiceDistance
(All modes)
0.42010.4204.0160.0450.0020.517
Distance by bus48.604148.60422.8560.000 **0.0130.998
Walking distance3.25313.2531.7320.1880.0010.260
ErrorDistance
(All modes)
175.72116810.105
Distance by bus3574.74116812.127
Walking distance3157.47716811.878
TotalDistance
(All modes)
14,398.2281683
Distance by bus5315.7991683
Walking distance6707.6531683
Corrected TotalDistance
(All modes)
176.1411682
Distance by bus3623.3461682
Walking distance3160.7301682
** = p < 0.05.
Table 7. Comparison of models estimating access distance by mode.
Access Distance
(All Modes)
Distance by BusWalking Distance
Coef.tCoef.tCoef.t
Personal/household characteristicsAccess modeD5−0.347−25.180 ***
GenderI1−0.018−1.548−0.018−1.121−0.015−0.907
Residence typeI2−0.058−4.088 ***−0.046−2.399 **−0.045−2.306 **
JobI30.0140.992−0.020−1.0350.0442.294 **
Marital statusI40.0941.6190.1351.061
Number of people in the householdI50.0091.4440.0141.6180.0020.218
Number of childrenI60.0131.165−0.040−2.448 **0.0302.044 **
Number of workersI70.0030.280−0.004−0.2620.0131.084
Driver’s licenseI80.0090.642−0.016−0.8160.0150.831
Vehicle ownershipI9−0.003−0.2200.0261.317−0.016−0.871
Housing tenureI10−0.000−0.0060.0010.071−0.010−0.580
IncomeI110.0272.139 **0.0341.8640.0281.622
AgeI12−0.007−1.122−0.007−0.763−0.003−0.382
Trip purposeI130.0070.4970.0040.2030.0120.557
Number of transfersI14−0.103−1.841
Station characteristicsAverage passengers per dayI150.0072.131 **−0.000−0.1250.0122.314 **
Station spacingI160.0093.028 **0.0104.457 ***0.0112.244 **
Number of bus routesI17 −0.015−2.282 **
Number of rapid bus routesI18−0.006−0.570 −0.009−0.481
Number of trunk line bus routesI19−0.025−1.864 −0.053−2.487 **
Number of feeder bus routesI200.0030.4120.0252.447 **0.0020.202
Number of local bus routesI210.0513.064 **0.0502.867 **0.0602.268 **
Number of subway transfer linesI220.1432.252 **0.2043.425 ***0.2482.412 **
Number of exitsI230.0050.3320.0181.180−0.005−0.212
Station structureI24−0.108−0.818−0.448−3.130 **−0.135−0.637
Route characteristicsType of rail serviceI25−0.145−0.9920.3832.438 **−0.315−1.356
Model statisticsAIC−141.608−194.385−8.698
BIC−130.789−185.9170.836
** = p < 0.05, *** = p < 0.01.
Disclaimer/Publisher’s Note: The statements, opinions and data contained in all publications are solely those of the individual author(s) and contributor(s) and not of MDPI and/or the editor(s). MDPI and/or the editor(s) disclaim responsibility for any injury to people or property resulting from any ideas, methods, instructions or products referred to in the content.

