Abstract
Purple phototrophic bacteria (PPB) have great potential in treating nitrogen-contaminated wastewater. Unlike conventional heterotrophic denitrification, PPB-driven denitrification utilizes light-driven metabolism, concurrently improving nitrogen removal and carbon management efficiency. This work aimed to develop a PPB denitrification process for nitrogen removal, carbon emission mitigation, and resource recovery. The PPB growth was first optimized and the most desirable light and carbon sources (i.e., incandescent light and sodium acetate) were pinpointed. PPB denitrification could reach a nitrate removal rate of 0.68 mg N/L/h, while no nitrite was detected during the process, regardless of the amount of external electron donors. This was attributed to the fact that the true reduction rate of nitrite (4.42 mg N/gVSS/h) was significantly higher than that of nitrate (1.51 mg N/gVSS/h). In the presence of a sufficient carbon source, PPB denitrification was found to be a low-carbon process, with only ~0.17% of converted nitrate being emitted as nitrous oxide. Meanwhile, PPB biomass for denitrification was rich in value-added products (e.g., protein and pigment), which potentially generated additional benefits over the biomass valued at USD 17 kg−1. These results provide a theoretical basis for implementing PPB denitrification for carbon-neutral and resource-efficient wastewater treatment.
1. Introduction
Currently, nitrate (NO3−) and nitrite (NO2−) contamination in aquatic ecosystems has emerged as a significant global environmental concern [1,2]. This could be attributed to excess application of inorganic nitrogenous fertilizers, excessive discharge of sewage, and oxidation of nitrogenous waste products in human and animal excreta [3]. High concentrations of NO3− and NO2− in water bodies not only cause eutrophication, toxic algal blooms and hypoxia, but also increase the risk of developing methemoglobinemia and gastrointestinal cancer [4]. According to the World Health Organization (WHO), the maximum allowable concentrations of NO3− and NO2− in drinking water are set at 11.3 mg N/L and 0.91 mg N/L, respectively [5]. The NO3− concentration in nitrogen fertilizer plant wastewater exceeds ~67.74 mg N/L [6], while nitrogen source concentrations in food processing wastewater, such as brewery wastewater, are more than 100 mg N/L [7]. They necessitate further treatment to meet the discharge standards.
The biological processes for NO3− and NO2− removal are primarily driven by microbial-mediated nitrogen cycle reactions, including denitrification, anaerobic ammonia oxidation, aerobic denitrification, assimilation, and other related synergistic processes [8]. Biological denitrification is a metabolic process involving four steps, each catalyzed by specific enzymes: a nitrate reductase (NAR), a nitrite reductase (NIR), a nitric oxide reductase (NOR) and a nitrous oxide reductase (N2OR) [9]. Due to the ability of heterotrophic denitrifying bacteria to utilize multiple carbon sources and achieve a rapid denitrification rate, they have been widely applied in wastewater treatment processes [10]. However, the implementation of heterotrophic denitrification processes is often limited by factors such as inadequate carbon sources, high operational costs, excessive sludge generation, and the potential for secondary pollution post-treatment [11]. The development and implementation of novel heterotrophic denitrification technologies for zero carbon emissions and efficient resource recovery attract intensive attention.
PPB are widely distributed prokaryotes that are capable of carrying out photosynthesis, including purple sulfur bacteria (PSB) and purple non-sulfur bacteria (PNSB) [12]. Due to their multiple pathways for energy and substance metabolism, PPB can effectively utilize various substrates, such as organic matter, ammonia, NO3− and NO2−, for metabolism under the conditions of light or oxygen [13,14]. PPB can tolerate high concentrations of inhibitory substances in wastewater. For example, Hao, et al. [15] found that PPB were able to grow at higher salinities (60 g NaCl/L) without experiencing cellular lysis due to osmotic pressure imbalance. PPB cells are rich in value-added substances such as protein, carotenoid, bacteriochlorin, and polyhydroxyalkanoates (PHA) [16,17]. Recycling the residual PPB biomass can reduce the cost of residual sludge disposal and generate additional benefits by producing the above-mentioned value-added substances. Therefore, PPB-based wastewater treatment processes are expected to fulfil pollutant removal and resource recovery at the same time, which deserve a systematical and in-depth investigation.
PPB showed great potential in treating wastewater containing NO3− and NO2−. According to Idi, et al. [18], PPB successfully removed 60–70% of nitrates from synthetic wastewater containing different gradient concentrations of nitrate. Zhu, et al. [8] isolated a PPB strain and observed that it could completely eliminate NO2− (about 60 mg N/L). The genome sequencing results also suggested the presence of a denitrification pathway. Meanwhile, Yang, et al. [14] and Yang, et al. [19] found that nitrite was not detected during the efficient removal of nitrate by PPB. In these studies on denitrification by PPB, the light source and carbon source are two essential conditions. Different wavelengths of light may influence the photosynthetic efficiency of PPB, as well as the activity of relevant intracellular enzymes [20], indirectly affecting their capacity to carry out denitrification. Furthermore, the carbon source not only provides building blocks for the cells but also serves as an electron donor participating in the denitrification process [21]. Given the above, the PPB denitrification process can be a carbon-neutral and cost-effective nitrogen removal technology, which holds the promise of achieving nitrate elimination and resource recovery simultaneously. However, the metabolic kinetics of PPB denitrification under varying conditions remain poorly characterized, hindering its further implementation in wastewater treatment.
This study investigates the denitrification metabolic mechanisms of PPB, providing key insights into their potential application in large-scale microbial denitrification, with a focus on their effectiveness in enhancing nitrogen removal and supporting sustainable wastewater treatment processes. In this regard, the relevant parameters affecting PPB denitrification and the denitrification removal rate kinetics have been examined. The objectives of the present research are as follows: (1) optimize the light and carbon sources for the growth of PPB; (2) investigate the effects of different C/N ratios on the performance of PPB denitrification; (3) analyze kinetic rate at each step of the PPB denitrification process; and (4) evaluate implications for the PPB denitrification process.
2. Materials and Methods
2.1. PPB Enrichment
The PPB culture in this research was enriched from the anaerobic sludge of an industrial park in Wuhan, China. The collected sludge samples were inoculated into 500 mL Schott bottles for incubation. The details of the enrichment medium are shown in Table S1. The enrichment was performed on a stirrer at 150 rpm in duplicate, with each Schott bottle containing 400 mL of inoculum culture (10%, v/v). The system was sparged with N2 for 7 min to establish and maintain an anaerobic environment. An amount of 10 mL of sterile liquid paraffin was layered on top of the solution, and the bottle was sealed with a screw cap equipped with a silicone rubber septum to ensure anaerobic conditions. The culture was subjected to five distinct light sources, including an incandescent lamp (IL) (40 W, Beineng Lighting Co., Ltd., China), infrared light (IFL) (consisting of an incandescent lamp with an infrared filter) and light-emitting diodes (LEDs) in blue, green and yellow (20 W, Forward Lighting Technology Co., Ltd., Rizhao, China). The temperature, pH and light intensity were set to 30 ± 1 °C, 7.0 ± 0.2 and 3000 ± 100 lux, respectively, and were kept constant across all experiments.
COD and NH4+ in the medium were monitored at 24 h intervals under different light sources. The absorbance between 300 and 1000 nm was measured using a UV–vis spectrophotometer (UV–5500PC, Shanghai Metash Instruments Co., Ltd., Shanghai, China) when the enrichment culture turned reddish (Figure S1) to detect the presence of pigment absorption peaks. The enrichment cultures with the possible presence of PPB were identified by high-throughput 16S rRNA sequencing (see Section 3.1). The culture enriched under an incandescent lamp was used for further growth experiments.
2.2. Growth Tests
Five carbon sources (sodium acetate, glucose, sucrose, sodium citrate and sodium malate), which are five small-molecule organic carbon compounds listed in ascending order of molecular weight, were tested at an equal COD concentration of 3 g/L based on the growth medium (Table S1) for the mixed PPB culture. The growth medium was pre-autoclaved at 121 °C for 20 min prior to inoculation. The light source was an incandescent lamp. The other conditions were the same as in the enrichment experiment. The optical density (OD) at 660 nm was monitored on a daily basis. COD was monitored at the beginning and end states of the samples during the tests. Two parallels were made for each carbon source condition. The growth tests lasted six days.
2.3. Batch Denitrification Experiments
Synthetic wastewater was used as the growth substrate for PPB in batch experiments, which contained NaHCO3 (0.8 g/L), CaCl2·2H2O (0.012 g/L), MgCl2·6H2O (0.18 g/L), NaCl (0.5 g/L), KCl (0.78 g/L) and trace elements (Table S1). Sodium acetate and incandescent lamps were chosen as carbon and light sources, respectively. NaNO3, NaNO2 and N2O were selected as nitrogen sources. NaOH solution was used to adjust the pH to 7.0 ± 0.1. For these experiments, 500 mL Schott bottles were employed as bioreactors, containing a working volume of 400 mL. The PPB were inoculated into synthetic wastewater in the Schott bottle at 30 ± 1 °C with an initial inoculation ratio of 25% (v/v). The Microbial Live Volatile Suspended Solids (MLVSS) concentration was about 180~200 mg/L. Each test lasted for 3 days, after which PPB tended to cease growing due to the limitation of the growth substrate. Light plays a crucial role in influencing the energy metabolic pathways in PPB. Therefore, while maintaining the anaerobic conditions of light, a dark-anaerobic experimental group was set up to eliminate the interference of other factors. The C/N ratio is set based on the requirements for complete microbial response of heterotrophic denitrifying microorganisms to different nitrogen sources, corresponding to sufficient, theoretical and deficient ratios. The nitrogen sources and their associated conditions were established as follows:
- (a)
- NaNO3 was used as the sole nitrogen source (50 mg N/L). C/N was set to 10:1, 2.86:1, 1:1;
- (b)
- NaNO2 was as the sole nitrogen source (50 mg N/L). C/N was set to 10:1, 1.71:1, 1:1;
- (c)
- N2O was as the sole nitrogen source (0.38 ± 0.02 mg N/L). C/N was set to 10:1, 0.57:1, 0.1:1 (to minimize the potential hazards to experimental personnel due to the toxicity and low solubility of nitrous oxide, a low concentration of N2O was used for nitrogen source exploration. Meanwhile, experimental conditions such as biomass and reaction volume were scaled down accordingly).
Two light conditions were applied in all three experiments with single nitrogen sources to investigate the effect of light on the experimental process. Light-anaerobic condition: the light intensity was maintained at 3000 ± 100 lux by regulating the distance between the fluorescent lamps and the bioreactors; dark-anaerobic condition: the light intensity was kept below 2 lux by covering the bioreactors with tinfoil. This anaerobic condition was kept by flushing with nitrogen and sealing the bioreactors with a rubber plug. The MLVSS concentration was measured in triplicate at the end of each experiment. Samples were collected at multiple time points to monitor changes in NO3−, NO2− and N2O levels in the experiment. The variations in protein and pigment content in the samples were assessed both at the onset and at the termination of the experiment.
In addition, the PPB strain Rhodobacter sphaeroides (Rb. sphaeroides), which was present in the laboratory and isolated from a local pond in Wuhan, China, was also compared and investigated [22]. Its denitrification performance experimental design was consistent with that of the above strains.
2.4. Analytical Methods
The OD at 660 nm was monitored by taking 5 mL of samples under different carbon sources at regular intervals throughout the day. The pH was measured using an FE20 pH meter (FE20 pH meter, Mettler Toledo, Shanghai, China) with a resolution of 0.01 pH units [23]. Light intensity was determined with a lux meter (TES 1330A, TES Electrical Electronic Corp., Taiwan, China). Samples were harvested from the bioreactors and centrifuged at 11,000 rpm for 10 min to separate the supernatant, which was subsequently analyzed for NO3−, NO2− and COD. The NO3−, NO2− and COD were tested according to APHA standard methods [24] (detection limit: 0.1 mg/L), with calibration curves validated daily. Protein content was measured using the modified Lowry method as outlined by Hulsen, et al. [25] (detection limit: 1 µg/L). Carotenoids and bacteriochlorophylls were determined by Spectrophotometry according to Peng, et al. [22]. The N2O concentration was analyzed following the method reported, using a gas chromatograph (7890 plus GC, Lunan Ruihong Chemical Instrument, Shandong, China) [26].
The maximum consumption rates of NO3−, NO2− and N2O were calculated by performing linear regression on their respective concentration profiles, with accumulation indicated as negative consumption. The apparent biomass-specific NO3−, NO2− and N2O consumption rates (R1,a, R2,a, R4,a) were determined by dividing the rate data determined above by the MLVSS concentration measured. The true reduction rate of each nitrogen oxide was calculated using the following formula [27,28]:
where R1,a, R2,a, R3,a and R4,a (mg N/gVSS/h) are the true reduction rates of nitrate, nitrite, NO and N2O, respectively. The apparent rate of reduction is a macroscopic measurement that may be affected by a variety of factors and may not accurately reflect the intrinsic rate of interaction between reactant molecules [29]. Compared to the apparent reduction rate, the true rate of reduction is the rate at which the reduction reaction proceeds based solely on the intrinsic mechanism of the chemical reaction itself, which is a more accurate representation of the rate of reaction at each step in biological denitrification [28].
To ensure data accuracy, all tests were performed in triplicate, and the final values reported represent the averages. The error bars indicate the standard deviations.
2.5. Microbial Community Analysis
Sampling for microbial community analysis was conducted when the OD of the culture remained stable during the enrichment process. Genomic DNA from the enriched culture was extracted using the DNA extraction kit (DL2000, Magigene Biotechnology, Shanghai, China) and the 16S rRNA gene was amplified using a pair of universal bacterial primers, 338F and 806R. The detailed operational procedure was adapted from Yu, et al. [30]. The polymerase chain reaction (PCR) products were analyzed by electrophoresis on agarose gel (1%, w/v), followed by purification and sequencing (Magigene Biotechnology, China). Based on these findings, the microorganisms enriched under both the incandescent lamp and infrared light were classified into genus of PNSB Rhodopseudomonas palustris (Rps. palustris).
3. Results and Discussion
3.1. PPB Enrichment and Growth Performance
Figure S1 shows that the mediums under the incandescent lamp and infrared light turned red after five days, while the color of the mediums under the other light sources were visually unchanged (pale yellow). Consistently, the distinct carotenoid and bacteriorhodopsin characteristic peaks were detected in samples under IL and IFL (Figure S2), which are typical features of purple non-sulfur bacteria, but not in those under other light sources [18]. The COD removal efficiency was about 90% under IL and IFL after five days, which was almost twice as high as the other experimental groups. The Rps. palustris contained carotenoids such as lycopene and rhodopin [31], which displayed a reddish color when present in large numbers. The infrared region is one of the major pigment absorption peaks of PPB [32], while about 90~95% of the input energy of incandescent lamps will be released in the form of heat, including a large amount of infrared radiation [33]. It is clearly shown that IFL and IL would favor PPB growth over other microbes. More evidence from the microbial community analyses is shown in Figure 1. It was confirmed that Rps. palustris was the dominant genus under IFL and IL, the abundance of which accounted for 68.5% and 67.7%, respectively. Other microorganisms, such as Streptococcus and Lactobacillus, accounted for less than 5% of the total number of microorganisms and were not part of the photosynthetic bacterial population.
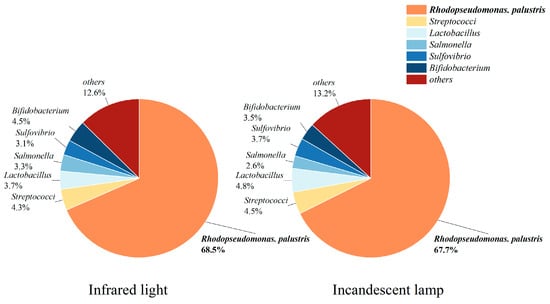
Figure 1.
The microbial communities under infrared light and an incandescent lamp (others refers to low-abundance taxa, defined as the sum of microbial communities with a relative abundance of less than 1% and no significant effect on the experimental investigation).
The species composition and abundance of the mixed cultures obtained under both IL and IFL were similar in the experiment. However, IFL (USD 0.81 unit−1) in engineering applications requires higher initial costs and sometimes necessitates specialized optical equipment for light adjustment, while IL (USD 0.32 unit−1) is not only cost-effective but also easier to replace and maintain [34]. Thus, IL was chosen as the light source in the subsequent experimental investigation.
Compared to small-molecule carbon sources, the uptake of large-molecule organic matter by PPB is much slower. Wastewater containing highly polymerized or structurally complex organic matter is generally subjected to pretreatment such as fermentation before further treatment [35]. Thus, only small-molecule carbon sources are discussed in this Section 3.1. Figure 2 shows the growth curves of PPB supplied with sodium acetate, glucose, sucrose, sodium citrate and sodium malate. The PPB grown with all carbon sources showed a similar growth trend over 24 h, presumably due to the fact that PPB were still acclimating to their environment and were in a period of stabilization. However, when sodium acetate was used as the carbon source, the growth of PPB was much superior to that of the other groups after 24 h. Volatile fatty acids (VFAs) can stimulate the glyoxylate cycle pathway in PPB and enhance the metabolism of organic matter and the synthesis of more biomass in PPB [36,37], which could explain the variability in the PPB growth curves after 24 h described above. And methanogenic archaea that may be present in the bacterial solution could convert acetate [38], produced by the glyoxylate cycle and not assimilated by PPB, into methane, reducing the inhibitory effects of substrate accumulation on PPB. The released H2 provides reducing equivalents for PPB’s photosynthetic electron transport chain [39], contributing to the rapid growth of PPB. Moreover, smaller molecules of sodium acetate were more readily absorbed by PPB compared to other carbon sources.
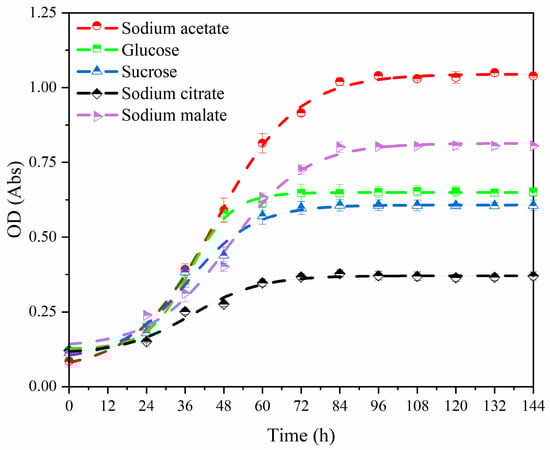
Figure 2.
The growth curve of PPB supplied with different carbon sources.
Among the aforementioned carbon sources, sodium acetate (USD 7.44 kg−1), glucose (USD 7.34 kg−1), and sucrose (USD 8.59 kg−1) have similar prices, while the prices of sodium citrate and sodium malate are comparatively higher, recorded at USD 36.48 kg−1 and USD 67.35 kg−1, respectively [40]. The promoting effect of sucrose and glucose on the growth of PPB was less significant than that of sodium acetate (Figure 2), resulting in lower nitrogen removal that may not meet the requirement of treating high-load wastewater. Sodium acetate can be derived from the anaerobic fermentation of organic wastewater [41]. Therefore, sodium acetate was chosen as the sole organic carbon source in subsequent denitrification experimental studies.
3.2. The Impact of Varying Nitrogen Sources and C/N Ratios on PPB Denitrification
The essential conditions for PPB to perform heterotrophic denitrification include a light source, an organic carbon source, and an anaerobic environment [8]. The nitrogen removal was not observed under dark-anaerobic conditions for all three nitrogen sources (Figure S3). Non-purple photosynthetic bacteria that could denitrify were not detected in the PPB enrichments (Figure 1). These could exclude the interference from other heterotrophic denitrifying strains during the experiment. The utilization of different nitrogen sources by PPB under light-anaerobic conditions with different C/N applied is shown in Figure 3. When C/N was set at 1:1 or 0.1:1, none of the three nitrogen source contents changed significantly. This suggested that the denitrification performance of PPB was inhibited due to a lack of electron donors. The theoretical C/N ratio for NO3−, NO2− and N2O to be removed completely was 2.86:1, 1.71:1 and 0.57:1, respectively. However, under these conditions, only ~30% of the three nitrogen sources was reduced. This was because the experimental conditions were set to be suitable for the survival of PPB, but did not completely inhibit the activities of other microorganisms, such as Lactobacillus. Therefore, some of the carbon source would be utilized by these microorganisms as well, which made PPB denitrification incomplete. The removal efficiencies for NO3−, NO2− and N2O were then enhanced to 100%, 100% and 71%, respectively, under sufficient carbon sources (C/N:10:1). Under carbon-sufficient conditions that are inherently conducive to PPB growth, PPB would compete for much more electron donors compared to those in the carbon-insufficient groups. Nitrogen removal is enhanced when there are enough electron donors present [42].
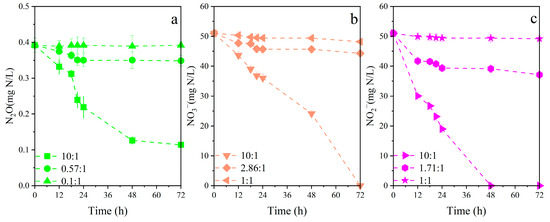
Figure 3.
The removal of varying nitrogen sources at different C/N. (a) N2O as a sole nitrogen source; (b) NO3− as a sole nitrogen source; (c) NO2− as a sole nitrogen source.
The pollutant reduction rate reflects the metabolic activity of microorganisms from a kinetic perspective [19]. Figure 4 shows the apparent rate of reduction and true rate of reduction for different nitrogen sources during denitrification. The true reduction rate of NO2− was 4.42 mg N/gVSS/h, while the true reduction rate of NO3− was only 1.51 mg N/gVSS/h. It explained the fact that in three sets of experiments, where NO3− was used as the nitrogen source, no NO2− was detected during the experiments regardless of the amount of external electron donors. NO2− accumulation is one of the main challenges for NO3− conversion during denitrification, which could inhibit cell growth and increase the denitrification time [43]. Thus, the PPB denitrification overcomes the problem of nitrite accumulation, which facilitates efficient biological nitrate removal. Poh, et al. [44] reported that the true reduction rates of NO3− and NO2− by traditional heterotrophic denitrifying microorganisms exceed ~5.8 mg N/gVSS/h and ~7.2 mg N/gVSS/h, respectively, significantly higher than the reduction rates of nitrogen sources by PPB. This difference may be attributed to the fact that the activity, specificity and substrate affinity of the relevant nitrogen source reductases could vary among microbial species and may also be influenced by experimental environmental conditions.
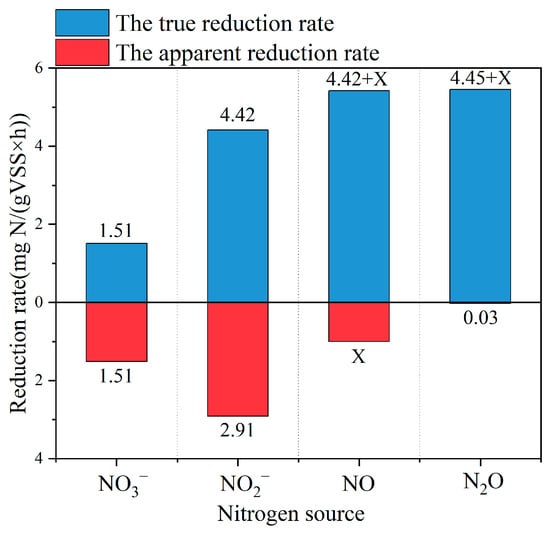
Figure 4.
The apparent and true reduction rates of different nitrogen sources in the presence of sufficient carbon sources. (Due to the toxicity, low aqueous solubility and high reactivity of NO, direct experimental utilization as a nitrogen source proved difficult. Therefore, the apparent rate of reduction of nitric oxide in the graph is replaced by X.)
The change in N2O content in the experiments with NO3− and NO2− as nitrogen sources is shown in Figure 5a. It can be observed that the accumulation of N2O decreased gradually as the reaction progressed, due to the fact that the amount of N2O consumed by PPB during the denitrification process is greater than the amount of N2O produced by PPB. The N2O emission factor is the ratio of N2O produced during denitrification to the total amount of nitrogen source consumed. Regardless of the C/N ratio, the N2O emission factor using NO2- as the nitrogen source was higher than that using NO3− as the sole nitrogen source (as shown in Figure 5b). This may be due to the fact that nitrite can reduce the expression of the N2O reductase (NosZ) gene by influencing the activity of transcription factors and inhibiting the NosZ activity [45]. Under such conditions, NosZ is unable to fully utilize adequate electron donors to completely reduce all nitrous oxide, resulting in N2O accumulation.
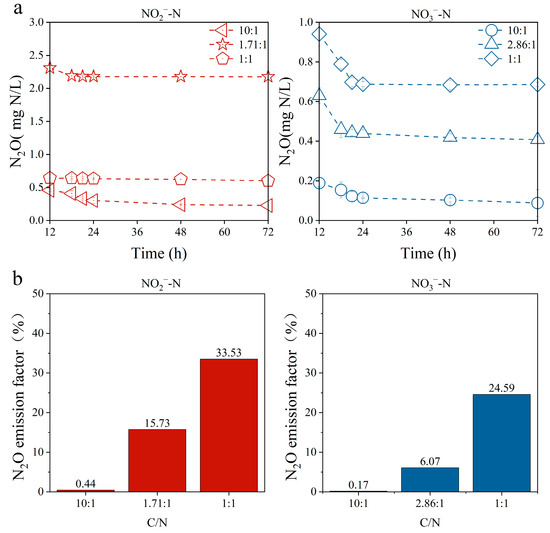
Figure 5.
The N2O concentration varies with time under nitrate and nitrite nitrogen sources, respectively (a); the N2O emission factor under different C/N ratios (b).
3.3. Implications for Theory and Practice
Previous studies have shown that some PPBs have multiple nitrogen metabolism pathways, such as complete reduction of nitrate through assimilation and through nitrogen fixation [46,47]. This paper explored the denitrification kinetic rates of Rps. palustris under different C/N and nitrogen source conditions, which helps to provide some references regarding the possible industrial application of PPB denitrification technology in the future. In addition, Rb. sphaeroides and Rps. palustris are both PNSBs but differ significantly in their denitrification capabilities. Figure S3 shows that the removal efficiencies of another PPB strain, Rb. sphaeroides, on three nitrogen sources under the same experimental conditions were all zero, suggesting that Rb. sphaeroides is unable to remove nitrogen via the denitrification pathway. According to Zhu, et al. [8], some PPB strains lack the genes encoding NAR, NIR, NOR and N2OR, which prevents them from carrying out denitrification metabolism. Therefore, it is important to the select desirable PPB strains in the future industrial application of PPB denitrification technology.
At present, the need for greenhouse gas emission reduction in the wastewater treatment process is increasingly urgent. The N2O emission factor in conventional denitrification could fluctuate between 1% and 90% in practice [48,49,50]. Under conditions of sufficient carbon, the N2O emission factor by PPB remains at a low level when utilizing different nitrogen sources. For example, the N2O emission factor was ~0.17% in the NO3− removal process by PPB in the presence of a sufficient carbon source (Figure 5b), which can reduce the carbon emissions by about a factor of 4 compared to conventional heterotrophic denitrification [51,52]. When the carbon source was insufficient, the N2O emission factor in the denitrification process of PPB significantly increased, which was similar to the N2O emission factor (between 20% and 30%) observed in some traditional heterotrophic denitrifying microorganisms under the same conditions [53,54]. It is important to control the carbon source during the denitrification process in PPB to prevent the excessive production of N2O. Furthermore, PPB has been extensively examined due to its high concentration of value-added compounds such as proteins and pigments in comparison to other bacteria [13]. Table S2 shows the changes in the content of value-added substances in PPB biomass before and after the removal of nitrogen sources. It can be seen that intracellular proteins and pigments were elevated by more than 10% after nitrogen source removal by PPB under sufficient carbon supply. Due to the short doubling time of PPB [55], value-added substances could be obtained from the excess PPB biomass in the denitrification process. The simple estimation of the value-added product of PPB denitrification yielded a benefit of USD 17.63 kg−1 biomass (Table S3), which could effectively address the issue of sludge disposal difficulties encountered in the conventional heterotrophic denitrifying microbial treatment process. However, the economic feasibility of high-value product production from PPB microorganisms is limited by light energy consumption and technological bottlenecks in scaling up [56]. In-depth research is needed to explore the stability of mixed cultivation, product separation processes, and performance optimization under real wastewater matrices to enable industrial-scale implementation. The production of PPB value-added substances was affected by various factors, such as light intensity and salinity [57,58]. In comparison to conventional heterotrophic denitrification, the additional cost of light in PPB denitrification needs to be taken into account. It is possible to optimize the experimental conditions for PPB denitrification to balance the costs and benefits by reducing PPB denitrification costs through light intensity optimization (e.g., intermittent illumination) and reactor design (e.g., LED arrays).
Nevertheless, there are still technical challenges to overcome in the application of PPB denitrification technology. First, the denitrification rates of PPB were more than 38.6% lower compared to those of heterotrophic denitrifying bacteria. This dilemma may be solved by screening and breeding PPB strains with a higher denitrification capacity. Simultaneously, the competitive interactions between PPB and heterotrophic bacteria must be considered. Future research should focus on strategically modulating the C/N ratio and optimizing the light–dark cycle to sustain the ecological dominance of PPB. Second, adequate carbon source supplementation was required to prevent the excessive accumulation of N2O in the PPB denitrification process. This inevitably increases the operational costs of the process. It can be achieved by adding high-concentration organic wastewater as the carbon source during the denitrification process [59,60]. Third, the collection of PPBs poses a significant challenge due to their small particle size and poor sedimentation properties. Collecting concentrated PPB products may lead to an increase in overall costs [61]. Stegman, et al. [62] showed that the formation of granular sludge from PPBs within ~50 days could primarily be achieved by controlling the upward flow velocity, but using PPB granular sludge to treat realistic wastewater requires more investigation. Fourth, the risk and market value of the products extracted from PPB biomass should be further evaluated. Finally, in wastewater anaerobic treatment, batch experiments elucidate microbial mechanisms and pollutant removal potential, while continuous reactors simulate real-world hydraulic patterns, validate process stability and establish critical scale-up design parameters [63]. Although PPB batch studies yield fundamental metabolic insights, their limitations in replicating engineering realities necessitate continuous reactor validation for technology transfer. This integration requires multidisciplinary strategies encompassing biofilm engineering, light-transfer optimization and intelligent control systems.
4. Conclusions
This study investigated the denitrification processes in PPBs, providing both theoretical foundations and engineering implications for their scalable implementation in sustainable wastewater treatment. The key results are summarized as follows:
- Incandescent light and sodium acetate were the ideal light source and carbon source, respectively, for PPB (Rps. palustris) growth.
- The true nitrite reduction rate of PPB denitrification (4.42 mg N/gVSS/h) was significantly higher than its nitrate reduction rate (1.51 mg N/gVSS/h), eliminating the possibility of nitrite accumulation.
- Under conditions of sufficient carbon, the N2O emission factor by PPB denitrification was ~0.17%, about 4 times lower than that of some conventional heterotrophic denitrification.
- The PPB biomass generated during the denitrification process could bring an additional revenue of USD 17.63 per kg−1 of biomass.
Supplementary Materials
The following supporting information can be downloaded at: https://www.mdpi.com/article/10.3390/su17104504/s1. Table S1: Composition of culture medium; Figure S1: The color changes of the medium after five days under different light sources; Figure S2: Absorption spectra of cultures under an incandescent lamp (IL) and infrared light (IFL) at 300–1000 nm of the enrichment after 5 days; Figure S3: Denitrification effect of PPB under dark condition; Figure S4: Denitrification effect of Rb.sphaeroides under light-anaerobic condition; Table S2: Changes in the content of high-value products; Table S3: Calculation of pigment and protein gains. References [64,65] are cited in the Supplementary Materials.
Author Contributions
X.P.: formal analysis, conceptualization, methodology, investigation, writing—original draft; S.Y.: methodology, writing—review and editing; C.L.: supervision, investigation, methodology, writing—review and editing; Y.X.: Supervision, Investigation, Conceptualization, Project administration, Funding acquisition, Writing—review & editing; L.P.: supervision, investigation, conceptualization, project administration, funding acquisition, writing—review and editing. All authors have read and agreed to the published version of the manuscript.
Funding
This work was supported by the National Natural Science Foundation of China (No. 42477068), Shenzhen Science and Technology Program (No. JCYJ20230807121305010), the Foundation of Key Laboratory of Yangtze River Water Environment, Ministry of Education (Tongji University), China (No. YRWEF202302), Hubei Provincial Key Research and Development Program (No. 2022BCA067) and the Knowledge Innovation Program of the Wuhan-Shuguang Project (No. 2023020201020317) for supporting this study.
Institutional Review Board Statement
Not applicable.
Informed Consent Statement
Not applicable.
Data Availability Statement
The data presented in this study are available on request from the corresponding author.
Conflicts of Interest
There are no conflicts of interest to declare.
References
- Zhang, S.; Su, J.; Zheng, Z.; Yang, S. Denitrification strategies of strain YSF15 in response to carbon scarcity: Based on organic nitrogen, soluble microbial products and extracellular polymeric substances. Bioresour. Technol. 2020, 314, 123733. [Google Scholar] [CrossRef]
- Sun, Y.; Ali, A.; Zheng, Z.; Su, J.; Zhang, S.; Min, Y.; Liu, Y. Denitrifying bacteria immobilized magnetic mycelium pellets bioreactor: A new technology for efficient removal of nitrate at a low carbon-to-nitrogen ratio. Bioresour. Technol. 2022, 347, 126369. [Google Scholar] [CrossRef]
- Seitzinger, S.P.; Mayorga, E.; Bouwman, A.F.; Kroeze, C.; Beusen, A.H.W.; Billen, G.; Van Drecht, G.; Dumont, E.; Fekete, B.M.; Garnier, J.; et al. Global river nutrient export: A scenario analysis of past and future trends. Glob. Biogeochem. Cycles 2010, 24, 2621–2628. [Google Scholar] [CrossRef]
- Hameed, A.; Nazir, S.; Rehman, J.U.; Ahmad, N.; Hussain, A.; Alam, I.; Nazir, A.; Tahir, M.B. Assessment of health hazards related to contaminations of fluorides, nitrates, and nitrites in drinking water of Vehari, Punjab, Pakistan. Hum. Ecol. Risk Assess. 2021, 27, 1509–1522. [Google Scholar] [CrossRef]
- Wang, X.; Xing, L.; Qiu, T.; Han, M. Simultaneous removal of nitrate and pentachlorophenol from simulated groundwater using a biodenitrification reactor packed with corncob. Environ. Sci. Pollut. Res. 2013, 20, 2236–2243. [Google Scholar] [CrossRef] [PubMed]
- Li, H.; Li, S. Dynamic Regeneration of D301f Anion Exchange Resin to Remove Nitrate Nitrogen in Wastewater. In Proceedings of the 4th International Conference on Technology of Architecture and Structure (ICTAS 2011), Xi’an, China, 22–24 September 2012; Volume 374–377, pp. 1005–1008. [Google Scholar]
- Lin, Z.; Cheng, S.; Li, H.; Li, L. A novel, rapidly preparable and easily maintainable biocathode electrochemical biosensor for the continuous and stable detection of nitrite in water. Sci. Total Environ. 2022, 806, 150945. [Google Scholar] [CrossRef] [PubMed]
- Zhu, B.; Zhang, X.; Zhao, C.; Chen, S.; Yang, S. Comparative genome analysis of marine purple sulfur bacterium Marichromatium gracile YL28 reveals the diverse nitrogen cycle mechanisms and habitat-specific traits. Sci. Rep. 2018, 8, 17803. [Google Scholar] [CrossRef]
- Park, J.Y.; Yoo, Y.J. Biological nitrate removal in industrial wastewater treatment: Which electron donor we can choose. Appl. Microbiol. Biotechnol. 2009, 82, 415–429. [Google Scholar] [CrossRef]
- Li, Y.; Zhang, W.; Dai, Y.; Su, X.; Xiao, Y.; Wu, D.; Sun, F.; Mei, R.; Chen, J.; Lin, H. Effective partial denitrification of biological effluent of landfill leachate for Anammox process: Start-up, influencing factors and stable operation. Sci. Total Environ. 2022, 807, 150975. [Google Scholar] [CrossRef]
- Sahinkaya, E.; Dursun, N. Sulfur-oxidizing autotrophic and mixotrophic denitrification processes for drinking water treatment: Elimination of excess sulfate production and alkalinity requirement. Chemosphere 2012, 89, 144–149. [Google Scholar] [CrossRef]
- Cao, K.F.; Zhi, R.; Zhang, G.M. Photosynthetic bacteria wastewater treatment with the production of value-added products: A review. Bioresour. Technol. 2020, 299, 122648. [Google Scholar] [CrossRef] [PubMed]
- Lu, H.; Zhang, G.; He, S.; Zhao, R.; Zhu, D. Purple non-sulfur bacteria technology: A promising and potential approach for wastewater treatment and bioresources recovery. World J. Microbiol. Biotechnol. 2021, 37, 161. [Google Scholar] [CrossRef]
- Yang, A.; Zhang, G.; Yang, G.; Wang, H.; Meng, F.; Wang, H.; Peng, M. Denitrification of aging biogas slurry from livestock farm by photosynthetic bacteria. Bioresour. Technol. 2017, 232, 408–411. [Google Scholar] [CrossRef]
- Hao, T.; Xu, Y.; Liang, C.; Peng, X.; Yu, S.; Peng, L. Establishing an efficient membrane bioreactor for simultaneous pollutant removal and purple bacteria production under salinity stress. Chemosphere 2024, 353, 141535. [Google Scholar] [CrossRef]
- Liu, S.; Zhang, G.; Zhang, J.; Li, X.; Li, J. Performance, 5-aminolevulinic acid (ALA) yield and microbial population dynamics in a photobioreactor system treating soybean wastewater: Effect of hydraulic retention time (HRT) and organic loading rate (OLR). Bioresour. Technol. 2016, 210, 146–152. [Google Scholar] [CrossRef] [PubMed]
- Hui, C.J.; Prihastyanti, M.N.U.; Brotosudarmo, T.H.P. Preliminary Evaluation of the Pigments Content from Rhodobacter sphaeroides at Stages During Photosynthetic Growth. Procedia Chem. 2015, 14, 101–107. [Google Scholar] [CrossRef]
- Idi, A.; Ibrahim, Z.; Mohamad, S.E.; Majid, Z.A. Biokinetics of nitrogen removal at high concentrations by Rhodobacter sphaeroides ADZ101. Int. Biodeterior. Biodegrad. 2015, 105, 245–251. [Google Scholar] [CrossRef]
- Yang, A.; Zhang, G.; Meng, F.; Zhi, R.; Zhang, P.; Zhu, Y. Nitrogen metabolism in photosynthetic bacteria wastewater treatment: A novel nitrogen transformation pathway. Bioresour. Technol. 2019, 294, 122162. [Google Scholar] [CrossRef]
- Zhou, Q.; Zhang, P.; Zhang, G. Biomass and pigments production in photosynthetic bacteria wastewater treatment: Effects of light sources. Bioresour. Technol. 2015, 179, 505–509. [Google Scholar] [CrossRef]
- Xu, Z.; Dai, X.; Chai, X. Effect of different carbon sources on denitrification performance, microbial community structure and denitrification genes. Sci. Total Environ. 2018, 634, 195–204. [Google Scholar] [CrossRef]
- Peng, L.; Lou, W.; Xu, Y.; Yu, S.; Liang, C.; Alloul, A.; Song, K.; Vlaeminck, S.E. Regulating light, oxygen and volatile fatty acids to boost the productivity of purple bacteria biomass, protein and co-enzyme Q10. Sci. Total Environ. 2022, 822, 153489. [Google Scholar] [CrossRef]
- Wockenfus, A.M.; Koch, C.D.; Conlon, P.M.; Sorensen, L.D.; Cambern, K.L.; Chihak, A.J.; Zmolek, J.A.; Petersen, A.E.; Burns, B.E.; Lieske, J.C.; et al. Discordance between urine pH measured by dipstick and pH meter: Implications for methotrexate administration protocols. Clin. Biochem. 2013, 46, 152–154. [Google Scholar] [CrossRef]
- Gilcreas, F.W. Standard methods for the examination of water and waste water. Am. J. Public Health Nations Health 1966, 56, 387–388. [Google Scholar] [CrossRef] [PubMed]
- Hulsen, T.; Hsieh, K.; Tait, S.; Barry, E.M.; Puyol, D.; Batstone, D.J. White and infrared light continuous photobioreactors for resource recovery from poultry processing wastewater-A comparison. Water Res. 2018, 144, 665–676. [Google Scholar] [CrossRef] [PubMed]
- Li, Q.; Xu, Y.; Liang, C.; Peng, L.; Zhou, Y. Nitrogen removal by algal-bacterial consortium during mainstream wastewater treatment: Transformation mechanisms and potential N2O mitigation. Water Res. 2023, 235, 119890. [Google Scholar] [CrossRef] [PubMed]
- Pan, Y.T.; Ni, B.J.; Yuan, Z.G. Modeling Electron Competition among Nitrogen Oxides Reduction and N2O Accumulation in Denitrification. Environ. Sci. Technol. 2013, 47, 11083–11091. [Google Scholar] [CrossRef]
- Pan, Y.; Ni, B.J.; Bond, P.L.; Ye, L.; Yuan, Z. Electron competition among nitrogen oxides reduction during methanol-utilizing denitrification in wastewater treatment. Water Res. 2013, 47, 3273–3281. [Google Scholar] [CrossRef] [PubMed]
- Green, C.T.; Boehlke, J.K.; Bekins, B.A.; Phillips, S.P. Mixing effects on apparent reaction rates and isotope fractionation during denitrification in a heterogeneous aquifer. Water Resour. Res. 2010, 46, W08525.1–W08525.19. [Google Scholar] [CrossRef]
- Yu, S.; Peng, L.; Xu, Y.; Song, S.; Xie, G.-J.; Liu, Y.; Ni, B.-J. Optimizing light sources for selective growth of purple bacteria and efficient formation of value-added products. J. Clean. Prod. 2021, 280, 124493. [Google Scholar] [CrossRef]
- Muzziotti, D.; Adessi, A.; Faraloni, C.; Torzillo, G.; De Philippis, R. Acclimation strategy of Rhodopseudomonas palustris to high light irradiance. Microbiol. Res. 2017, 197, 49–55. [Google Scholar] [CrossRef]
- Rashid, N.; Onwusogh, U.; Mackey, H.R. Exploring the metabolic features of purple non-sulfur bacteria for waste carbon utilization and single-cell protein synthesis. Biomass Convers. Biorefinery 2024, 14, 12653–12672. [Google Scholar] [CrossRef]
- Turon, V.; Anxionnaz-Minvielle, Z.; Willison, J.C. Replacing incandescent lamps with an LED panel for hydrogen production by photofermentation: Visible and NIR wavelength requirements. Int. J. Hydrog. Energy 2018, 43, 7784–7794. [Google Scholar] [CrossRef]
- Chong, S.C.; Soomro, D.M. Harmonic Behavior of Different Branded LED Lamps and Their Respective Cost Effectiveness. In Lecture Notes in Electrical Engineering, Proceedings of the 9th International Conference on Robotic, Vision, Signal Processing and Power Applications, Penang, Malaysia, 2–3 February 2016; Springer: Singapore, 2016; pp. 725–736. [Google Scholar]
- Sivanesan, J.; Vijayalakshmi, A.; Sivaprakash, B.; Rajamohan, N. Biohythane as a sustainable fuel-A review on prospective synthesis based on feedstock preprocessing, optimization approach and circular economy concept. Process Saf. Environ. Prot. 2024, 185, 739–753. [Google Scholar] [CrossRef]
- Schink, B. An alternative to the glyoxylate shunt. Mol. Microbiol. 2009, 73, 975–977. [Google Scholar] [CrossRef]
- Segura, P.C.; De Meur, Q.; Alloul, A.; Tanghe, A.; Onderwater, R.; Vlaeminck, S.E.; Wouwer, A.V.; Wattiez, R.; Dewasme, L.; Leroy, B. Preferential photoassimilation of volatile fatty acids by purple non-sulfur bacteria: Experimental kinetics and dynamic modelling. Biochem. Eng. J. 2022, 186, 108547. [Google Scholar]
- Cerrillo, M.; Morey, L.; Vinas, M.; Bonmati, A. Assessment of active methanogenic archaea in a methanol-fed upflow anaerobic sludge blanket reactor. Appl. Microbiol. Biotechnol. 2016, 100, 10137–10146. [Google Scholar] [CrossRef]
- Chen, C.-Y.; Lu, W.-B.; Liu, C.-H.; Chang, J.-S. Improved phototrophic H2 production with Rhodopseudomonas palustris WP3-5 using acetate and butyrate as dual carbon substrates. Bioresour. Technol. 2008, 99, 3609–3616. [Google Scholar] [CrossRef] [PubMed]
- Alibaba. Manufacturers, Suppliers, Exporters & Importers from the World’s Largest Online B2B Marketplace. Available online: https://www.alibaba.com/ (accessed on 15 October 2024).
- Fu, X.; Hou, R.; Yang, P.; Qian, S.; Feng, Z.; Chen, Z.; Wang, F.; Yuan, R.; Chen, H.; Zhou, B. Application of external carbon source in heterotrophic denitrification of domestic sewage: A review. Sci. Total Environ. 2022, 817, 153061. [Google Scholar] [CrossRef] [PubMed]
- Pelaz, L.; Gomez, A.; Letona, A.; Garralon, G.; Fdz-Polanco, M. Nitrogen removal in domestic wastewater. Effect of nitrate recycling and COD/N ratio. Chemosphere 2018, 212, 8–14. [Google Scholar] [CrossRef]
- Foglar, L.; Briski, F.; Sipos, L.; Vukovic, M. High nitrate removal from synthetic wastewater with the mixed bacterial culture. Bioresour. Technol. 2005, 96, 879–888. [Google Scholar] [CrossRef]
- Poh, L.S.; Jiang, X.; Zhang, Z.; Liu, Y.; Ng, W.J.; Zhou, Y. N2O accumulation from denitrification under different temperatures. Appl. Microbiol. Biotechnol. 2015, 99, 9215–9226. [Google Scholar] [CrossRef] [PubMed]
- Ding, X.; Zhao, J.; Hu, B.; Wang, S.; Li, X.; Lan, L. Characteristics of N2O Accumulation during the Endogenous Denitrification of Nitrite. Pol. J. Environ. Stud. 2020, 29, 901–908. [Google Scholar]
- Newton, J.W.; Wilson, P.W. Nitrogen fixation and photoproduction of molecular hydrogen by Thiorhodaceae. Antonie Van Leeuwenhoek 1953, 19, 71–77. [Google Scholar] [CrossRef]
- Pino, C.; Olmo-Mira, F.; Cabello, P.; Castillo, F.; Roldán, M.D.; Moreno-Vivián, C. The assimilatory nitrate reduction system of the phototrophic bacterium Rhodobacter capsulatus E1F1. Biochem. Soc. Trans. 2006, 34, 127–129. [Google Scholar] [CrossRef]
- Fenu, A.; Dockx, L.; Sandra, V.D.; Frederik, W.; Verhaeghe, K.; Koen, V.L.; Joris, R.; Rosalia, D. Glycerol used for denitrification in full-scale wastewater treatment plants: Nitrous oxide emissions, sludge acclimatization, and other insights. Water Sci. Technol. 2023, 88, 645–657. [Google Scholar]
- Hu, Z.; Zhang, J.; Li, S.; Xie, H. Impact of carbon source on nitrous oxide emission from anoxic/oxic biological nitrogen removal process and identification of its emission sources. Environ. Sci. Pollut. Res. 2013, 20, 1059–1069. [Google Scholar] [CrossRef] [PubMed]
- Kampschreur, M.J.; Temmink, H.; Kleerebezem, R.; Jetten, M.S.M.; van Loosdrecht, M.C.M. Nitrous oxide emission during wastewater treatment. Water Res. 2009, 43, 4093–4103. [Google Scholar] [CrossRef] [PubMed]
- Capodici, M.; Avona, A.; Laudicina, V.A.; Viviani, G. Biological groundwater denitrification systems: Lab-scale trials aimed at nitrous oxide production and emission assessment. Sci. Total Environ. 2018, 630, 462–468. [Google Scholar] [CrossRef]
- Warneke, S.; Schipper, L.A.; Bruesewitz, D.A.; McDonald, I.; Cameron, S. Rates, controls and potential adverse effects of nitrate removal in a denitrification bed. Ecol. Eng. 2011, 37, 511–522. [Google Scholar] [CrossRef]
- Hao, X.-d.; Yang, Z.-L.; Yu, W.-B.; Liu, R.-B. N2O Emission from the Processes of Wastewater Treatment: Mechanisms and Control Strategies. Huan Jing Ke Xue Huanjing Kexue 2023, 44, 1163–1173. [Google Scholar]
- Itokawa, H.; Hanaki, K.; Matsuo, T. Nitrous oxide production in high-loading biological nitrogen removal process under low COD/N ratio condition. Water Res. 2001, 35, 657–664. [Google Scholar] [CrossRef] [PubMed]
- Wampler, D.A.; Ensign, S.A. Photoheterotrophic metabolism of acrylamide by a newly isolated strain of Rhodopseudomonas palustris. Appl. Environ. Microbiol. 2005, 71, 5850–5857. [Google Scholar] [CrossRef] [PubMed]
- Capson-Tojo, G.; Batstone, D.J.; Grassino, M.; Vlaeminck, S.E.; Puyol, D.; Verstraete, W.; Kleerebezem, R.; Oehmen, A.; Ghimire, A.; Pikaar, I.; et al. Purple phototrophic bacteria for resource recovery: Challenges and opportunities. Biotechnol. Adv. 2020, 43, 107567. [Google Scholar] [CrossRef]
- Lu, H.; Zhao, R.; Wang, C.; Zhang, G.; Chen, C.; Li, B.; Han, T. Exploration of flashing light interaction effect on improving biomass, protein, and pigments production in photosynthetic bacteria wastewater treatment. J. Clean. Prod. 2022, 348, 131304. [Google Scholar] [CrossRef]
- Zhang, G.; Zhang, J.; Liu, H.; Liu, S.; Lv, L.; Liang, J. Treatment of high salinity organic wastewater by photosynthetic bacteria to produce value-added products: Performance, community and metabolic characteristics. J. Water Process Eng. 2024, 64, 105593. [Google Scholar] [CrossRef]
- Bodik, I.; Blstakova, A.; Sedlacek, S.; Hutnan, M. Biodiesel waste as source of organic carbon for municipal WWTP denitrification. Bioresour. Technol. 2009, 100, 2452–2456. [Google Scholar] [CrossRef]
- Sapmaz, T.; Manafi, R.; Mahboubi, A.; Lorick, D.; Koseoglu-Imer, D.Y.; Taherzadeh, M.J. Potential of food waste-derived volatile fatty acids as alternative carbon source for denitrifying moving bed biofilm reactors. Bioresour. Technol. 2022, 364, 128046. [Google Scholar] [CrossRef]
- Alloul, A.; Ganigué, R.; Spiller, M.; Meerburg, F.; Cagnetta, C.; Rabaey, K.; Vlaeminck, S.E. Capture-Ferment-Upgrade: A Three-Step Approach for the Valorization of Sewage Organics as Commodities. Environ. Sci. Technol. 2018, 52, 6729–6742. [Google Scholar] [CrossRef]
- Stegman, S.; Batstone, D.J.; Rozendal, R.; Jensen, P.D.; Hulsen, T. Purple phototrophic bacteria granules under high and low upflow velocities. Water Res. 2021, 190, 116760. [Google Scholar] [CrossRef]
- Strotmann, U.J.; Eismann, F.; Hauth, B.; Bias, W.R. An integrated test strategy for the assessment of anaerobic biodegradability of wastewaters. Chemosphere 1993, 26, 2241–2254. [Google Scholar] [CrossRef]
- Zhi, R.; Cao, K.; Zhang, G.; Zhu, J.; Xian, G. Zero excess sludge wastewater treatment with value-added substances recovery using photosynthetic bacteria. J. Clean. Prod. 2020, 250, 119581. [Google Scholar] [CrossRef]
- Popescu, M.; Iancu, P.; Plesu, V.; Todasca, M.C.; Isopencu, G.O.; Bildea, C.S. Valuable Natural Antioxidant Products Recovered from Tomatoes by Green Extraction. Molecules 2022, 27, 4191. [Google Scholar] [CrossRef] [PubMed]
Disclaimer/Publisher’s Note: The statements, opinions and data contained in all publications are solely those of the individual author(s) and contributor(s) and not of MDPI and/or the editor(s). MDPI and/or the editor(s) disclaim responsibility for any injury to people or property resulting from any ideas, methods, instructions or products referred to in the content. |
© 2025 by the authors. Licensee MDPI, Basel, Switzerland. This article is an open access article distributed under the terms and conditions of the Creative Commons Attribution (CC BY) license (https://creativecommons.org/licenses/by/4.0/).