Article

Sustainability and Grid Reliability of Renewable Energy Expansion Projects in Saudi Arabia by 2030

by
Abdulaziz Almutairi
* and
Yousef Alhamed
Department of Electrical Engineering, College of Engineering, Majmaah University, Almajmaah 11952, Saudi Arabia
*
Author to whom correspondence should be addressed.
Sustainability 2025, 17(10), 4493; https://doi.org/10.3390/su17104493
Submission received: 22 March 2025 / Revised: 9 May 2025 / Accepted: 13 May 2025 / Published: 15 May 2025

Abstract

:
The penetration of renewable energy, especially solar and wind, is increasing globally to promote a sustainable environment. However, in the Middle East, this momentum is slower compared to other regions, primarily due to abundant local fossil fuel reserves and historically low energy prices. This trend is shifting, with several countries, including the Kingdom of Saudi Arabia (KSA), setting ambitious goals. Specifically, KSA’s Vision 2030 aims to generate 50% of its energy from renewable sources by 2030. Due to favorable conditions for solar and wind, various mega-projects have either been completed or are underway in KSA. This study analyzes the potential and reliability impact of these projects on the power system through a three-step process. In the first step, all major projects are identified, and data related to these projects, such as global horizontal irradiance, wind speed, temperature, and other relevant parameters, are collected. In the second step, these data are used to estimate the solar and wind potential at various sites, along with annual averages and seasonal averages for different extreme seasons, such as winter and summer. Finally, in the third step, a reliability assessment of power generation is conducted to evaluate the adequacy of renewable projects within the national power grid. This study addresses a gap in the literature by providing a region-specific reliability analysis using actual project data from KSA, which remains underexplored in existing research. Sequential Monte Carlo simulations are employed, and various reliability indices, including Loss of Load Expectation (LOLE), Loss of Energy Expectation (LOEE), Loss of Load Frequency (LOLF), Energy Not Supplied per Interruption (ENSINT), and Demand Not Supplied per Interruption (DNSINT) are analyzed. The analysis shows that integrating renewable energy into KSA’s power grid significantly enhances its reliability. The analysis shows that integrating renewable energy into KSA’s power grid significantly enhances its reliability, with improvements observed across all reliability indices, demonstrating the viability of meeting Vision 2030 targets.

1. Introduction

1.1. Background and Motivation

The global energy market is undergoing a significant transformation driven by an urgent need to address climate change and secure a sustainable environment for future generations. Growing awareness of the environmental and social impacts of fossil fuel consumption, particularly the emission of greenhouse gases, has mobilized the international community toward a cleaner energy future [1]. This shift is not merely about environmental responsibility but also reflects a recognition of the economic potential that renewable energy presents. Nations and industries are increasingly viewing the transition to renewable energy as an opportunity to foster economic growth, create jobs, and reduce dependence on depleting fossil fuels. This momentum has led to widespread adoption of solar, wind, hydro, and other renewable energy technologies, backed by supportive policies and investments [2]. Furthermore, this energy transition aligns with the evolving global demand for resilient, decentralized energy systems, which can better withstand extreme weather events and reduce energy inequality [3]. Thus, the movement toward renewables represents a dual approach, addressing climate goals while capitalizing on sustainable economic opportunities.

1.2. Current Status and Literature Review

Globally, various efforts are underway to support the clean energy transition across different regions. For example, the global expansion of wind energy is reported in [4] with installed capacity nearly tripling since 2014, surpassing 1 TW in 2023. This paper reviews recent developments in wind power generation, discussing key factors influencing its success, such as technology advancements, resource availability, and social acceptance, and highlights five critical topics for the future of onshore and offshore wind energy. Similarly, it is reported in [5] that China can reach 15 PWh/year of PV and wind power by 2060 through optimized plant deployment, grid upgrades, and energy storage. Similarly, a recent comprehensive review [6] highlights the growing role of emerging technologies, in the U.S., such as floating PV, solar-plus-storage, and hybrid power plants, and projects a 77% reduction in solar technology costs by 2031 using Wright’s law. The European Union’s push for low-carbon economies requires all member states to transition to renewable energy sources. A cluster analysis of RES diversification in these countries from 2010 to 2019 identified subgroups with similar energy profiles and tracked their progress, offering insights for tailored national energy strategies and collective policy development [7]. The authors in [8] highlight the role of government policies, including binding climate targets and adaptive planning, in accelerating the region’s clean energy transition in Southeast Asia. The research in [9] evaluates the economic feasibility of Canada’s provincial energy transitions to carbon neutrality by 2060, using energy simulation and costing models. It finds that most provinces will benefit from fossil fuel savings, with those relying on fossil fuels for electricity generation seeing the greatest benefits from the transition. Finally, in [10], the public support for offshore wind energy development in Poland is analyzed, finding 68% support with a 5% annual increase. Economic benefits and regional development, particularly in the labor market, were key factors, while concerns about landscape changes were minimal. An optimal integrated renewable energy system for five major Australian cities in proposed in [11], analyzing ten building types in different climatic zones. The results provide viable scenarios for hybrid wind-solar systems, offering guidelines for cost-effective and low-carbon power system designs for these cities and others with similar characteristics.
Despite the global momentum toward renewable energy, the Middle East has had slower adoption of renewable energy sources, largely due to abundant local fossil fuel reserves and historically low energy prices [12]. However, some nations, including the United Arab Emirates (UAE) and the Kingdom of Saudi Arabia (KSA), have recently implemented ambitious initiatives aimed at advancing their energy sectors and increasing energy efficiency. For instance, Saudi Arabia’s Vision 2030 initiative [13] represents a transformative national agenda focused on diversifying the energy mix and reducing reliance on oil. A major part of this vision includes developing large-scale renewable energy projects, with Saudi Arabia committing to generating 50% of its energy from renewables by 2030. Neom, a futuristic smart city under development, is one such example, aiming to run entirely on renewable energy, with plans to utilize solar, wind, and green hydrogen technologies [14]. Saudi Arabia has set ambitious goals, initially targeting 9.5 GW off renewable energy by 2023, later expanding this to 58 GW by 2030 [15].
Saudi Arabia has substantial potential for both solar and wind energy, owing to its vast deserts and coastal areas that provide ideal conditions for harnessing renewable resources. With some of the highest solar irradiance levels globally, Saudi Arabia is well-positioned to tap into solar energy on a large scale [16], while areas near the Red Sea offer strong, consistent winds suitable for wind power generation [17]. In recent years, the KSA has accelerated its renewable energy projects under Vision 2030. Major initiatives include the Sakaka Solar Power Plant, Saudi Arabia’s first large-scale solar project, which became operational in 2019 and has a capacity of 300 megawatts [18]. Additionally, the Dumat Al Jandal Wind Farm, the Kingdom’s first utility-scale wind project, is now one of the largest in the region with a capacity of 400 megawatts [19]. Further projects, such as the planned Neom green hydrogen plant and the Red Sea Project’s renewable energy installations, are underway to diversify Saudi Arabia’s energy mix [20].

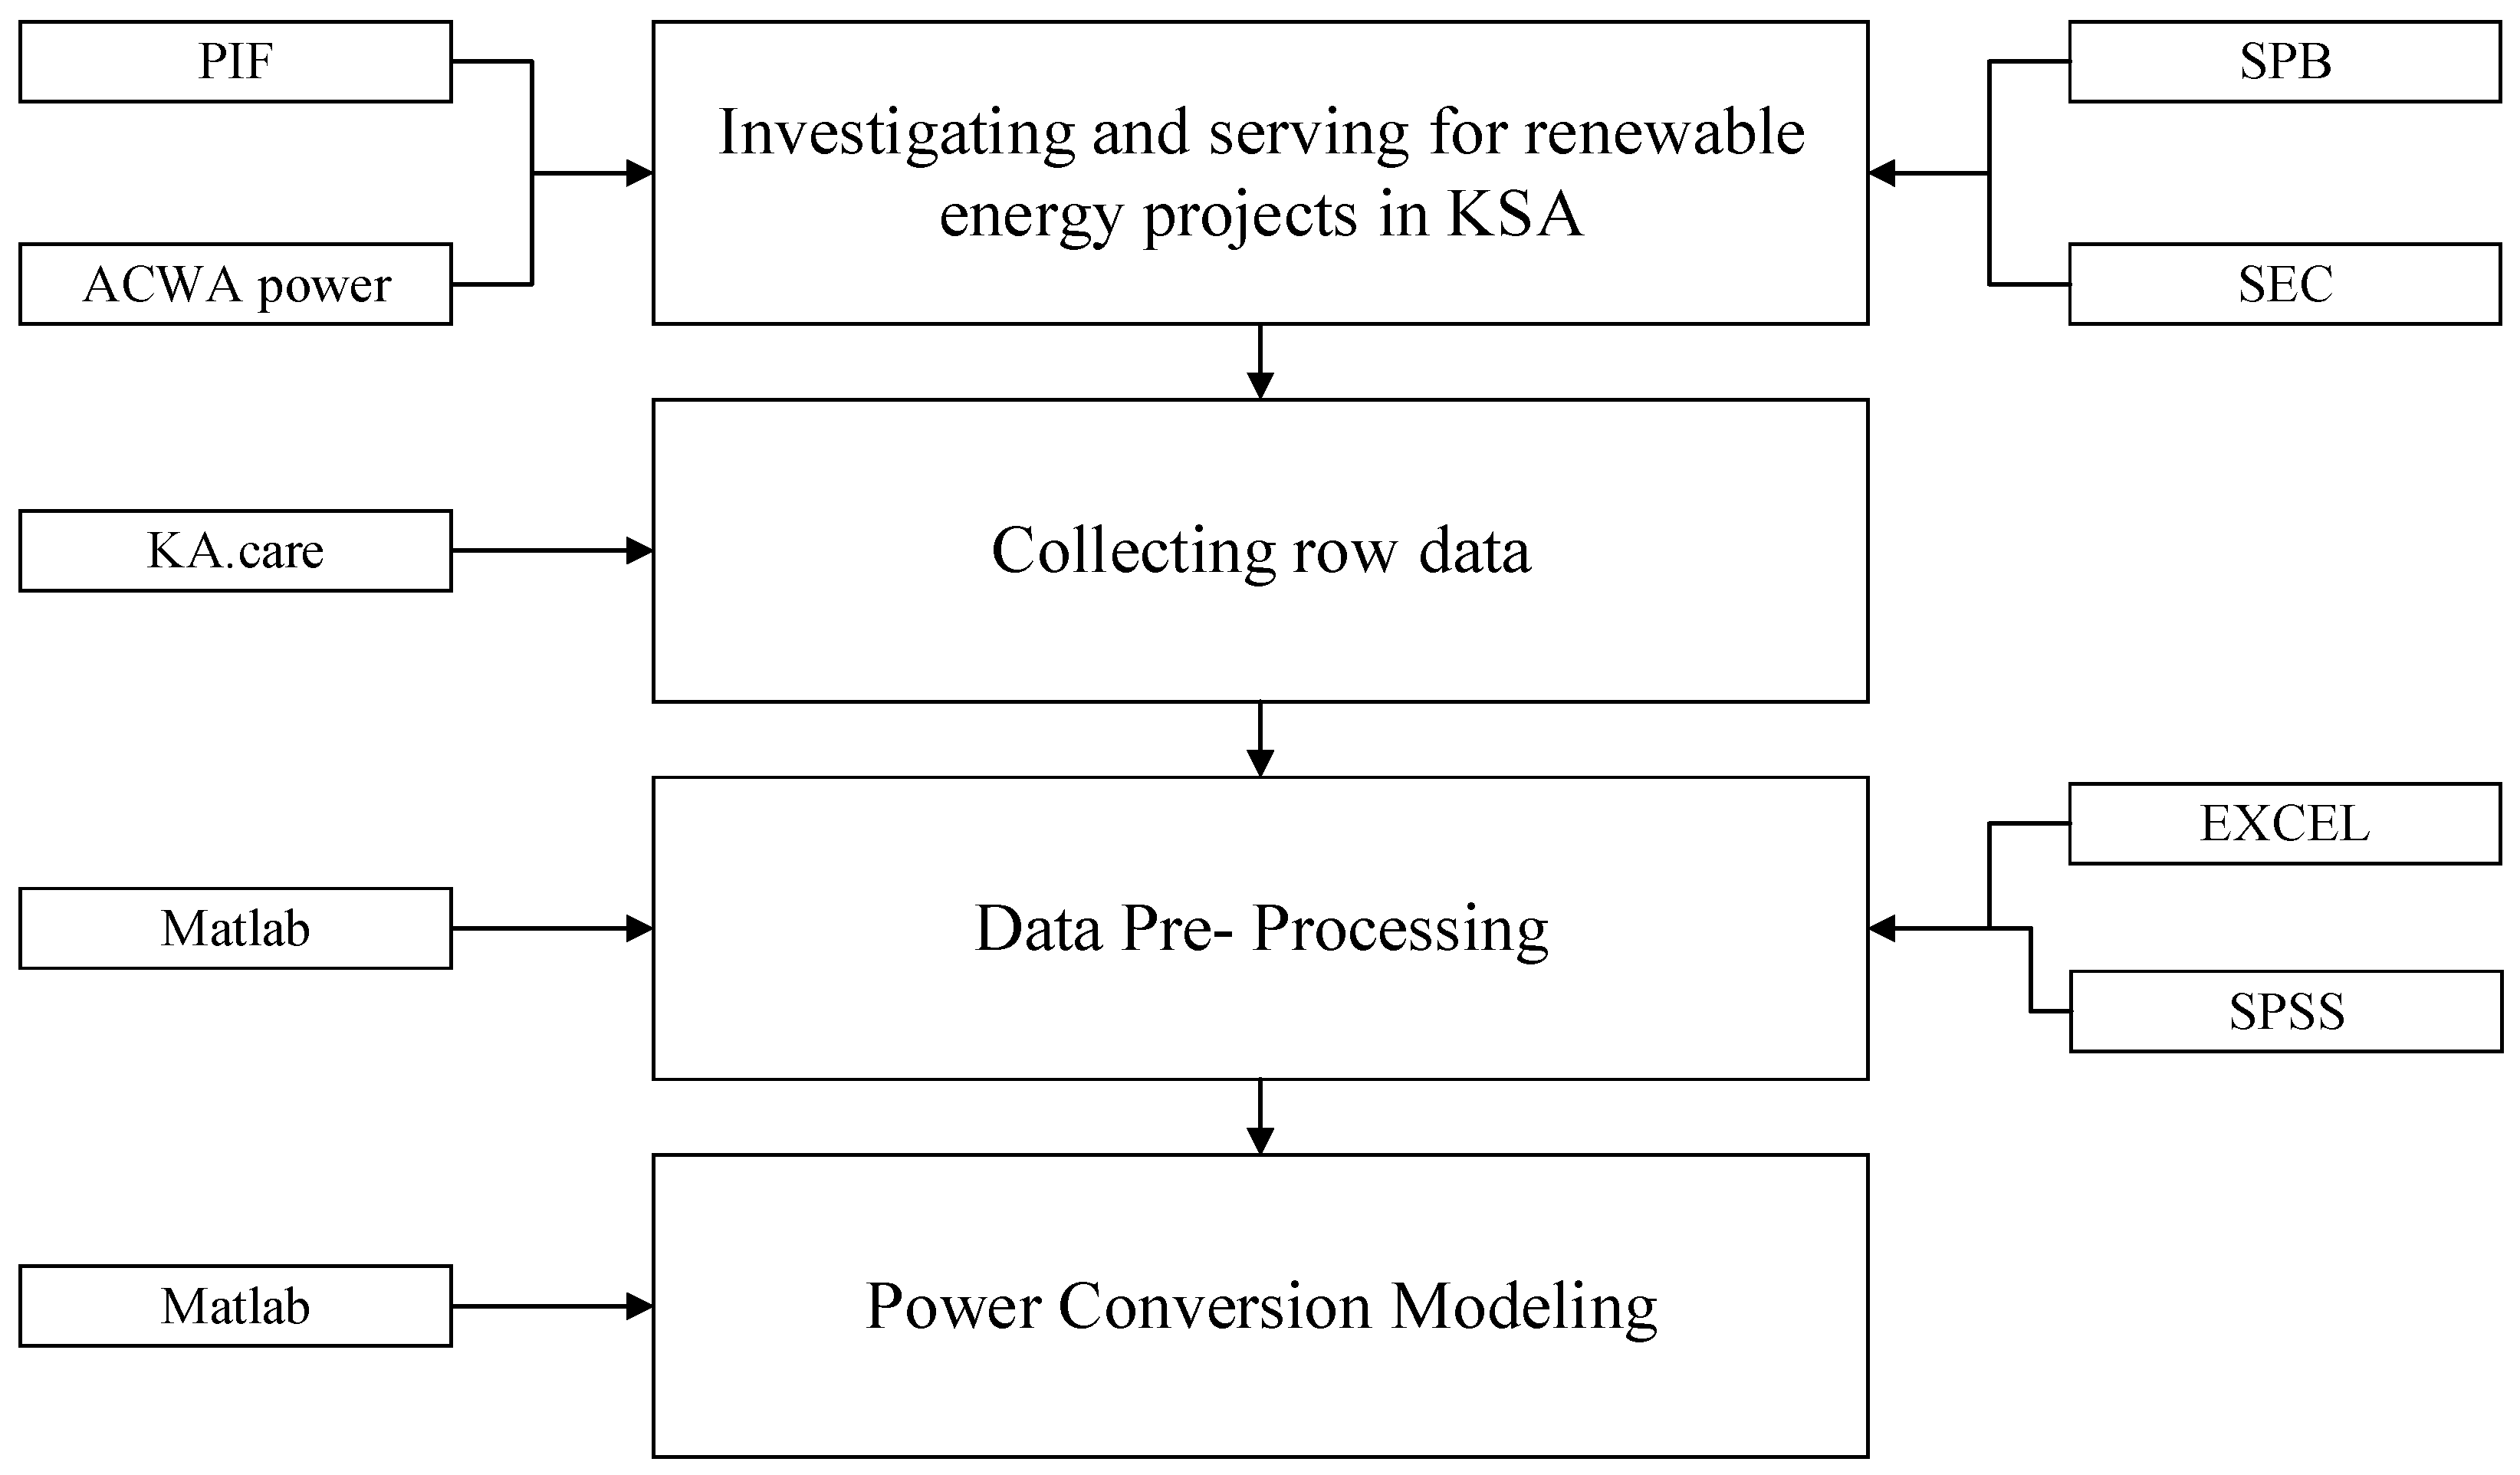
1.3. Research Gaps and Contributions

It can be observed that various studies have highlighted the importance of region-specific analysis in the development and implementation of energy systems. These studies emphasize that factors such as local climate, economic conditions, resource availability, and population density significantly influence energy demand and the feasibility of renewable energy technologies. Tailoring solutions to these regional characteristics not only enhances performance and cost-efficiency but also ensures a more sustainable and reliable energy transition. Additionally, considering local regulations, infrastructure, and social dynamics is crucial for the successful adoption and integration of energy innovations. In addition, energy potential modeling and analysis are crucial for effectively deploying renewable resources, ensuring that projects are not only economically viable but also reliable in meeting energy demand [21]. By assessing local energy potential, through solar irradiance, wind patterns, and seasonal changes, planners can identify optimal locations and forecast long-term output, reducing uncertainties associated with renewable resources. In addition, adequacy assessment plays a key role in verifying that renewable projects can reliably meet demand, using established indices that quantify system performance under variability [22]. Key indices such as Loss of Load Expectation (LOLE), Loss of Energy Expectation (LOEE), Loss of Load Frequency (LOLF), Energy Not Supplied per Interruption (ENSINT), and Demand Not Supplied per Interruption (DNSINT) provide valuable insights into the stability and resilience of renewable projects. These metrics allow decision-makers to evaluate the likelihood of energy shortages, frequency of load interruptions, and the overall impact of supply disruptions, which is essential for maintaining grid reliability.
Therefore, this study focuses on enhancing renewable energy planning and implementation in Saudi Arabia in alignment with Vision 2030 sustainability objectives. The research features several distinctive contributions aimed at strengthening the reliability and adequacy of renewable energy projects across the country. First, it involves gathering, reviewing, and analyzing data related to renewable energy initiatives in Saudi Arabia, with an emphasis on weather data from multiple locations. This initial phase, conducted using Excel and MATLAB R2023b, includes collecting and processing data on Global Horizontal Irradiance (GHI), wind speed, temperature, and other relevant parameters to estimate the solar and wind potential for various sites. The second phase centers on a comprehensive reliability assessment for power generation, aimed at evaluating the generation adequacy of renewable projects within the national power grid. Employing sequential Monte Carlo simulations, this analysis calculates key indices such as LOLE, LOEE, LOLF, and ENSINT. By analyzing the impact of renewable energy projects on grid stability and assessing their ability to meet demand, this research provides crucial insights to support Saudi Arabia’s transition toward sustainable energy and inform strategic planning for future renewable deployments. The major contributions of this study can be summarized as follows:
  • The study focuses on enhancing renewable energy planning in Saudi Arabia in line with sustainability objectives, including gathering and processing weather data (e.g., GHI, wind speed, and temperature) to estimate solar and wind potential across various sites.
  • The research evaluates the generation adequacy of renewable projects within the national grid, employing sequential Monte Carlo simulations to calculate key reliability indices (LOLE, LOEE, LOLF, and ENSINT).
  • The study analyzes the impact of renewable energy projects on grid stability, providing insights that support Saudi Arabia’s transition to sustainable energy and inform future renewable deployments and strategic planning.
The remainder of the paper is organized as follows: Section 2 provides an overview of renewable energy projects in the Kingdom of Saudi Arabia (KSA), covering both completed and planned initiatives. Section 3 outlines the renewable energy estimation process, including the assessment of average annual potential of wind and solar energy. Section 4 presents the reliability analysis, while Section 5 concludes the paper and discusses directions for future research.

2. Overview of Renewable Energy Projects in KSA

The shift to renewable energy is crucial to meet the rising energy needs driven by population growth and industrialization in developing nations, while reducing environmental impact. Investing in renewables not only helps combat climate change but also boosts economic growth, creates jobs, and reduces dependency on depleting fossil fuels [23]. This transition is both a necessary environmental response and a strategic social and economic transformation, supported by advances in technology, government policies, incentives, and increased awareness of fossil fuel impacts.
It is worth mentioning that when the share of renewable energy in total generation exceeds 30%, it can significantly impact the dynamic behavior of the power system, necessitating the reconfiguration of emergency automation schemes. Advanced control strategies, such as the rotor inertial power source (RIPS) control for self-standby PV systems [24] and synthetic inertia algorithms supported by hydrogen-based energy storage systems [25], have been proposed to enhance frequency stability and system resilience during emergency events. While these strategies provide valuable insights into managing high renewable penetration, a detailed assessment of emergency stability and automation reconfiguration for the KSA power system is not in the scope of this study.
Saudi Arabia, with its vast potential for wind and solar power and exceptionally high solar radiation levels, averaging 2200 kWh/m2 annually, ranks among the top ten countries for photovoltaic potential, as depicted in Figure 1 [26]. Saudi Arabia is actively exploring various solar energy applications, such as water desalination, irrigation, and solar cooling, showcasing a strategic commitment to diversifying its energy mix and reducing dependence on fossil fuels. Policy frameworks and strategic investments, including the establishment of the King Abdullah City for Atomic and Renewable Energy (KACARE), are steering the country toward its renewable energy targets [27]. However, challenges remain, such as technological constraints and high soiling levels, which underscore the need for substantial investment in research and infrastructure to fully realize the potential of solar energy in the region.
Similarly, KSA is among the top fifteen countries with the highest wind potential, as depicted in Figure 2 [26], owing to its vast desert landscapes, long coastlines, and favorable meteorological conditions, particularly in regions such as the Red Sea coast and parts of the central and eastern provinces. These areas offer high average wind speeds that make them well-suited for large-scale wind farm deployment. However, the development of wind power in the Kingdom still faces significant challenges, notably the variability and intermittency of wind speeds, which can lead to fluctuations in power output and pose integration difficulties for the national grid. These fluctuations require advanced forecasting techniques, energy storage systems, and grid flexibility measures to ensure consistency, reliability, and alignment with national energy transition goals under Vision 2030.

2.1. Completed and Planned Projects

Saudi Arabia is positioning itself as a leader in renewable energy through its National Renewable Energy Program (NERP), a Vision 2030 initiative focused on boosting renewable energy production and enhancing energy security. This program aims to cut carbon emissions by 278 million tons of CO2 and reduce fossil fuel dependency, while fostering local economic growth, research, and job creation. Several significant projects have been launched or are in development across various regions of Saudi Arabia. A list of all major projects is presented in Table 1 and a brief description of selected major projects is presented in the following sub-sections. The dataset includes 19 renewable energy projects in Saudi Arabia, comprising 16 solar photovoltaic (PV) and 3 wind projects. The solar projects vary in capacity from 20 MW to 2060 MW, with major developments like Shoiba Two (2060 MW), AlKahfah (1400 MW), and AlHinakiah One (1100 MW) significantly contributing to solar capacity. The wind projects, Waad AlShimal (500 MW), Doumat AlJandal (400 MW), and AlGhat (600 MW), add up to 1500 MW.

2.1.1. Sakaka PV Project

Located in AlJouf, this 300 MW project is the first utility-scale renewable energy initiative under the REPDO. Developed by ACWA Power at a cost of $302 million, it employs approximately 1.2 million Jinko JKM 320P polycrystalline panels (They are manufactured in company in Shanghai, China), generating around 930 gigawatt-hours of electricity annually and making a substantial contribution to carbon emissions reduction [28].

2.1.2. Doumat AlJandal Wind Farm Project

Situated near Domat Al Jandal city, this wind farm is one of the largest in the Middle East, featuring 99 V150 model wind turbines with a rotor diameter of 150 m and a total capacity of approximately 400 MW. These advanced turbines enable cost-effective energy production, achieving a low Levelized Cost of Electricity (LCOE) of about $0.019 per kWh [29].

2.1.3. Mahd AlDahab PV Project

As part of the REPDO Phase 3 plan, this project is expected to generate approximately 20 megawatts of power upon its completion in 2025. The Rabigh project, a collaboration between Logi and the Saudi Green Technologies Company, aims for a total capacity of 300 MW and includes a 25-year power purchase agreement. Additionally, the Saad PV project, owned and operated by Jinko Power Technologies, is a 300 MW initiative within the second phase of the REPDO plan, with plans for an additional 1125 MW in the subsequent phase [30].

2.1.4. Alkahfah PV Project

Located in Hail Province, this project aims to generate 1400 MW of clean energy across an area of over 82 km2. The Wadi Aldawaser project, part of the REPDO Phase 3 plan, is a 120 MW photovoltaic facility anticipated to become operational by 2025. The Al Madinah project, developed by Desert Technologies, is a 50 MW PV initiative scheduled to begin construction in 2024. Additionally, the Jeddah (Alnoor) PV project, developed by Masdar, EDF Renewables, and Nesma Company, represents a promising 300 MW photovoltaic plant with a 25-year power purchase agreement [31].

2.1.5. Shoiba 1 and Shoiba 2 PV Projects

The Alfaisaliah PV project, encompassing the Shoiba 1 and Shoiba 2 phases, is being developed in two stages with capacities of 600 MW and 2030 MW, respectively. This project will utilize n-type bifacial monocrystalline silicon modules with peak powers of 605, 610, and 615 Wp, leveraging silicon mono technology for high output relative to the space occupied. A single axis tracking system will be employed across approximately 55 km for both phases, estimated to incorporate over 5 million solar panels. Shoiba 1 is projected to commence production in 2025, while phase 2 is currently in the planning stages [32].

2.1.6. AlRass PV Project

Designed and constructed by ACWA Power, this project is another major initiative under Phase 3 of the REPDO plan, expected to generate over 700 MW of electricity using bifacial modules with tracking technology. The Sudair IPP PV project is among the largest photovoltaic plants globally, boasting a generation capacity of 1500 MW. With an investment of $906 million, the project aims to reduce emissions by nearly 2.9 million tons of carbon dioxide [33].

3. Renewable Energy Estimation

This section discusses the development of models for renewable energy estimation, focusing on solar and wind energy projects in Saudi Arabia. It analyzes weather data (solar radiation, wind speed, and temperature) to evaluate project productivity while addressing challenges related to data variation affecting energy output through statistical methods. The methodology comprises four stages: data collection, data verification, data processing, and conversion modeling. Data are collected from various entities, including the Saudi Investment Fund, ACWA Power, and the Saudi Electricity Company, with weather data sourced from King Abdullah City for Atomic and Renewable Energy (K.A.CARE).
After collecting the primary data, they are processed to identify and remove erroneous data and outliers, utilizing different tools (Microsoft Excel Office 2024 and IBM SPSS Statistics 29.0) for statistical analysis. The final stages involve modeling the data and converting them to power outputs using the MATLAB R2023b toolbox, accounting for factors such as wind speed, solar radiation, and temperature through appropriate mathematical equations. Figure 3 illustrates the main activities undertaken to achieve the objectives.

3.1. Average Annual Potential

This study utilized weather data from K.A.CARE, measured at various locations across Saudi Arabia. The dataset includes solar irradiance, wind speed, and temperature, with hourly measurements spanning one to three years. After collection, the data were verified and filtered to eliminate outliers, and average annual values were calculated, accounting for leap years. This organized dataset facilitates comparisons of the potential productivity of various sites designated for renewable energy projects.

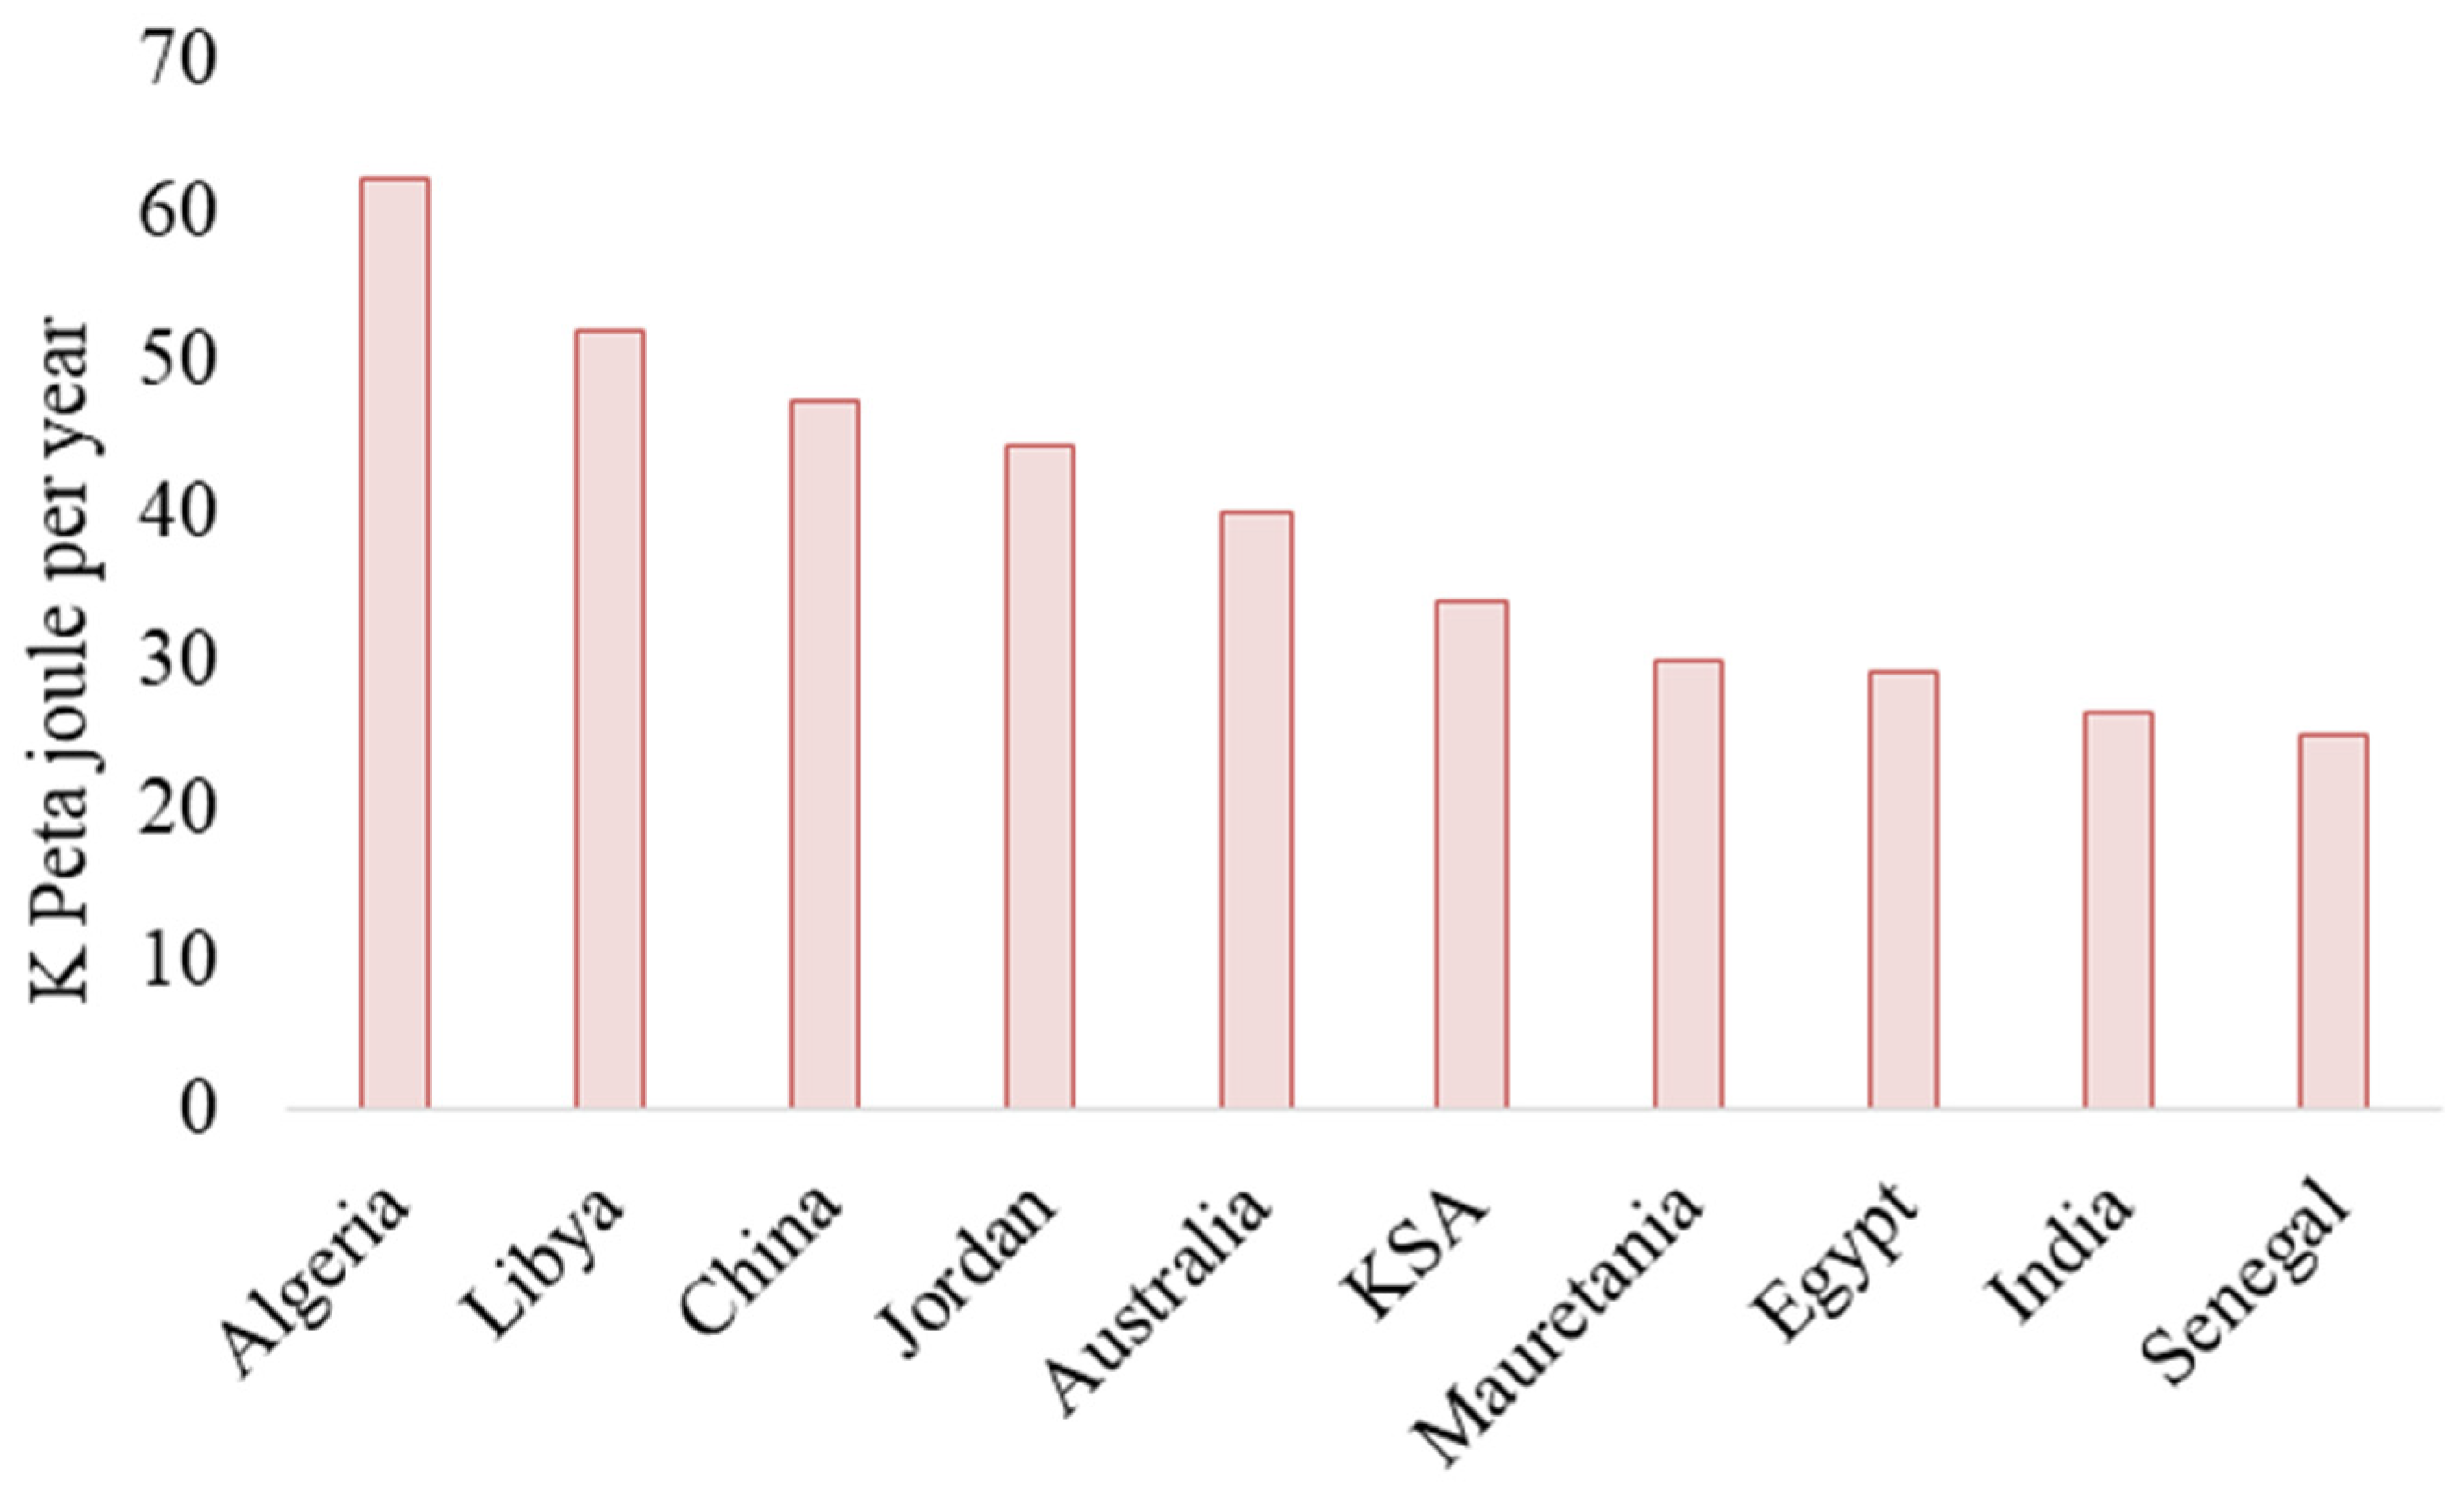
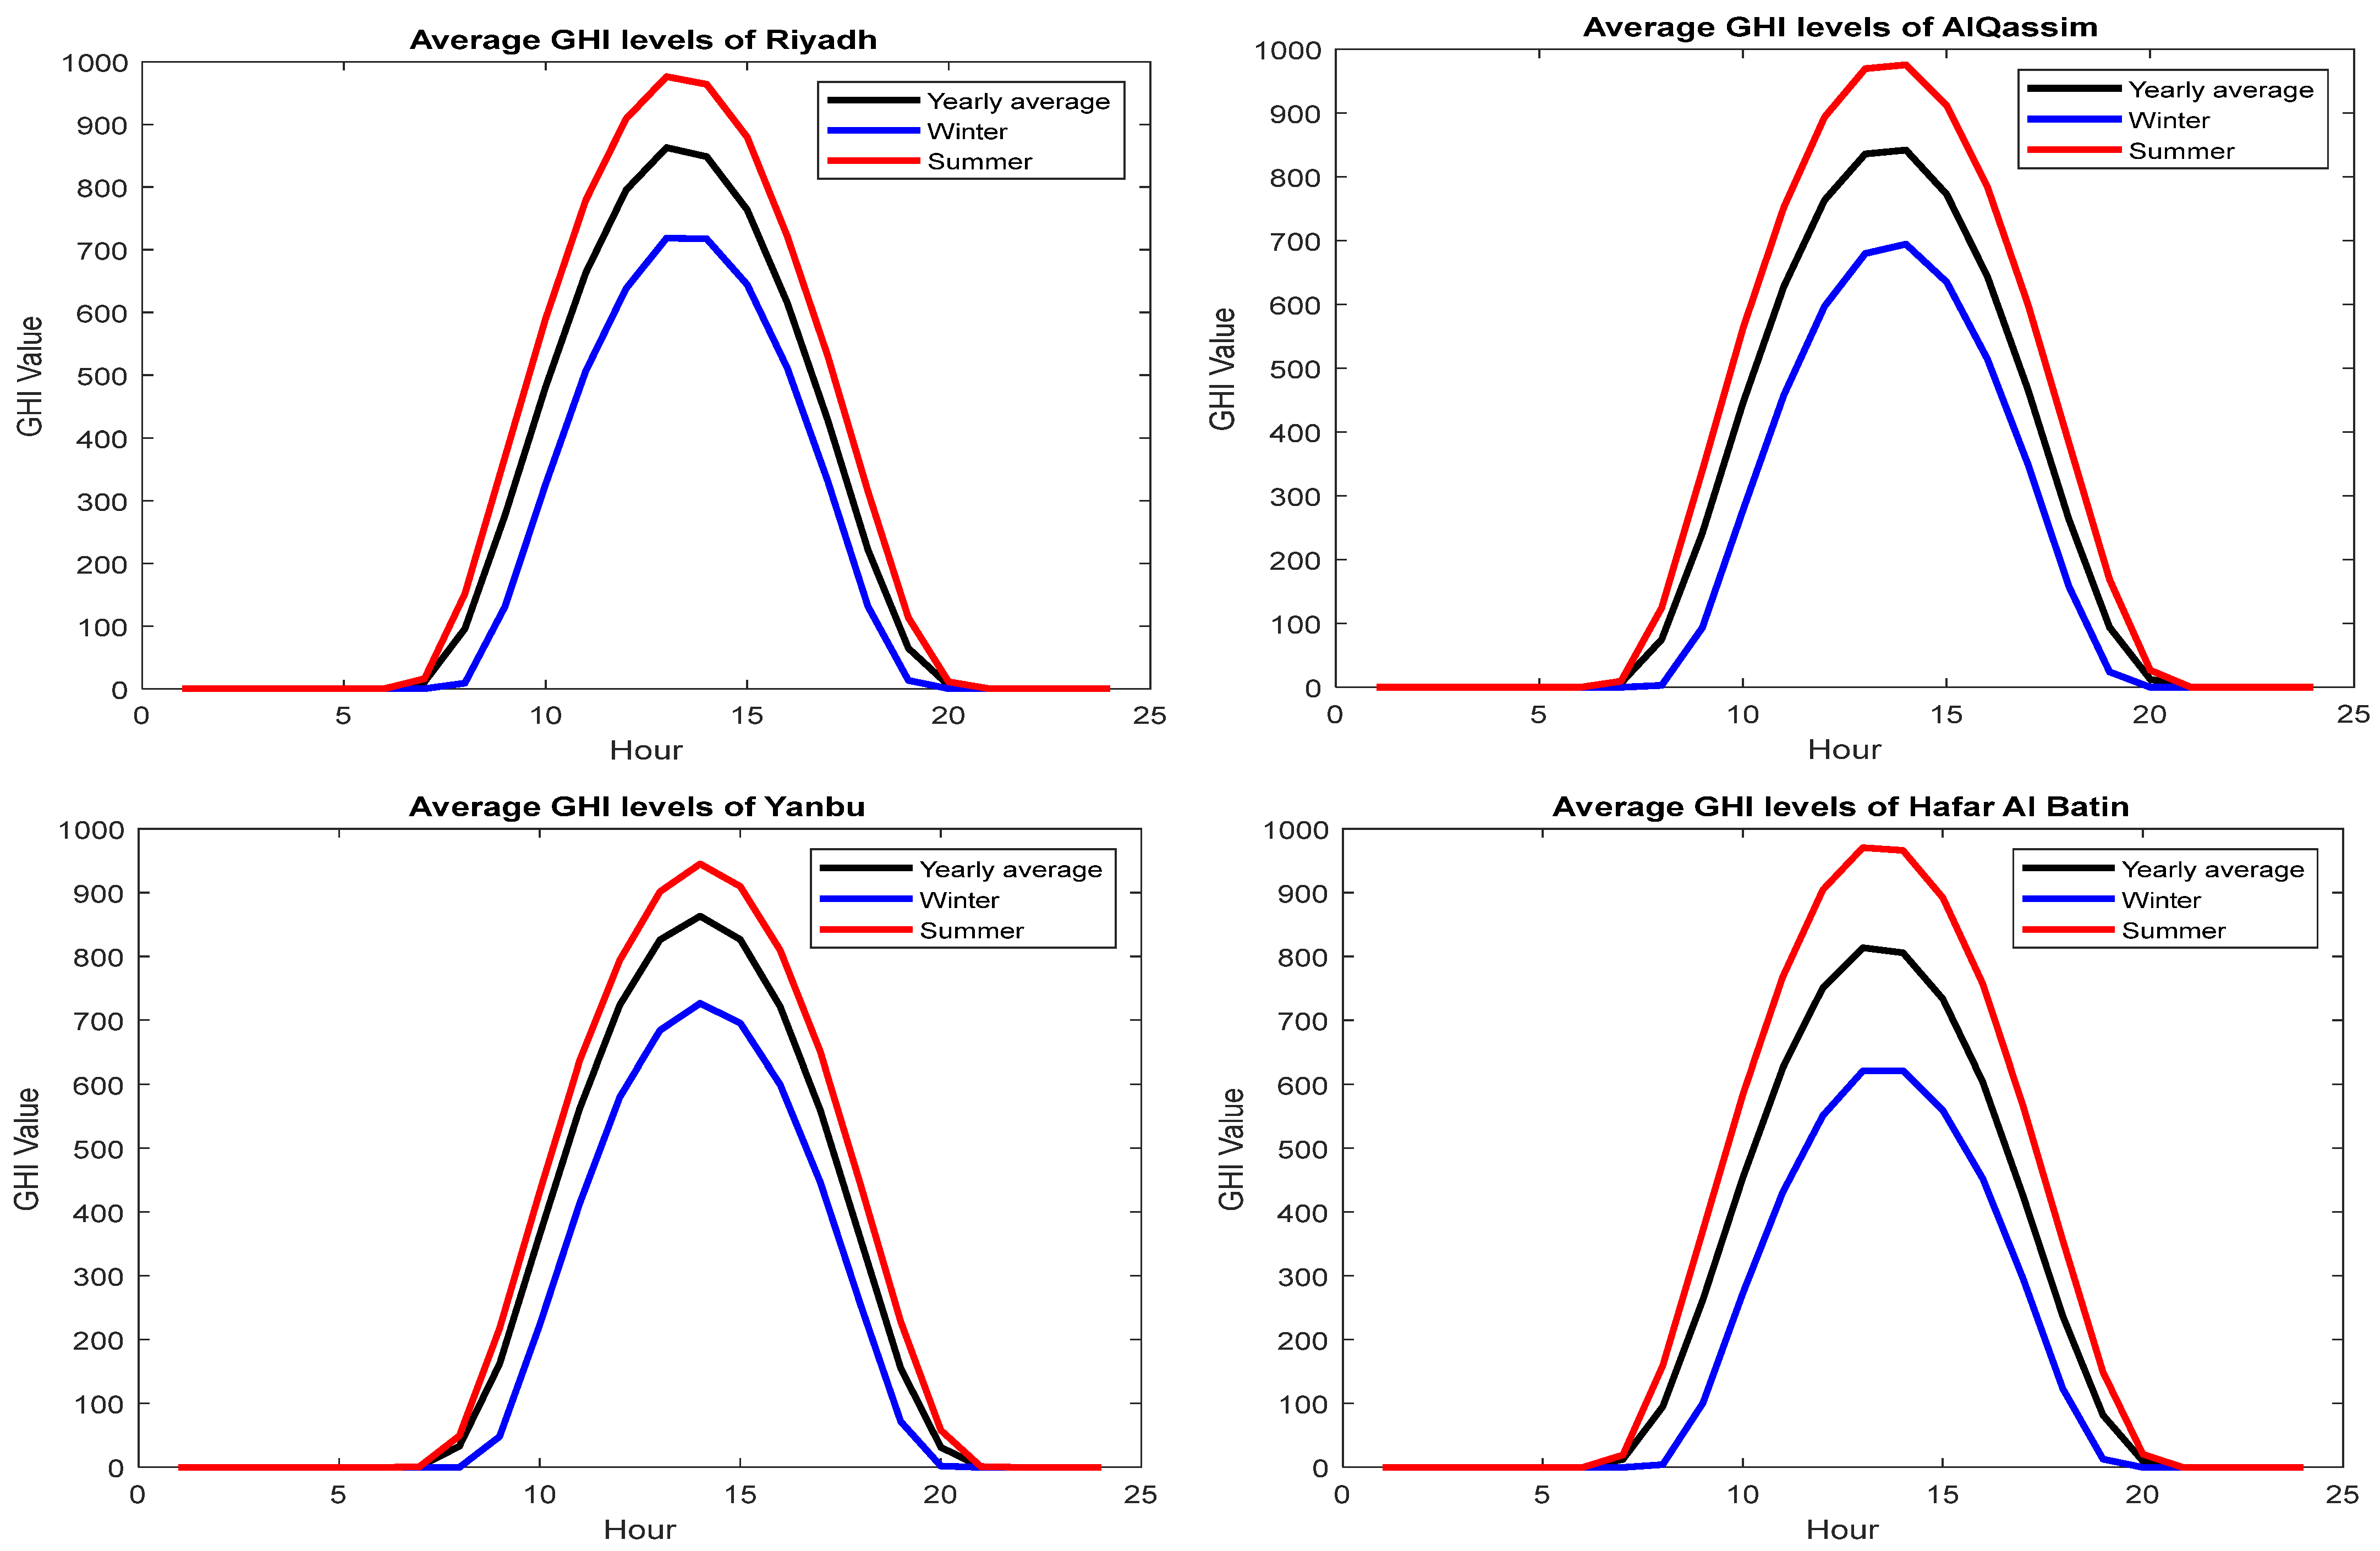
3.1.1. Solar Radiation Level

In this study, readings from 15 sites were gathered based on their proximity to the announced projects. The impact of seasonal variations in solar radiation throughout the year was analyzed. Figure 4 illustrates solar irradiance at four locations: Riyadh, Al-Qassim, Yanbu, and Hafr Al-Batin. These figures demonstrate that solar radiation fluctuates throughout the day, peaking around midday. Additionally, the maximum solar radiation levels vary by season, with winter showing the lowest levels and summer experiencing a significant increase in solar radiation during the day, as expected.

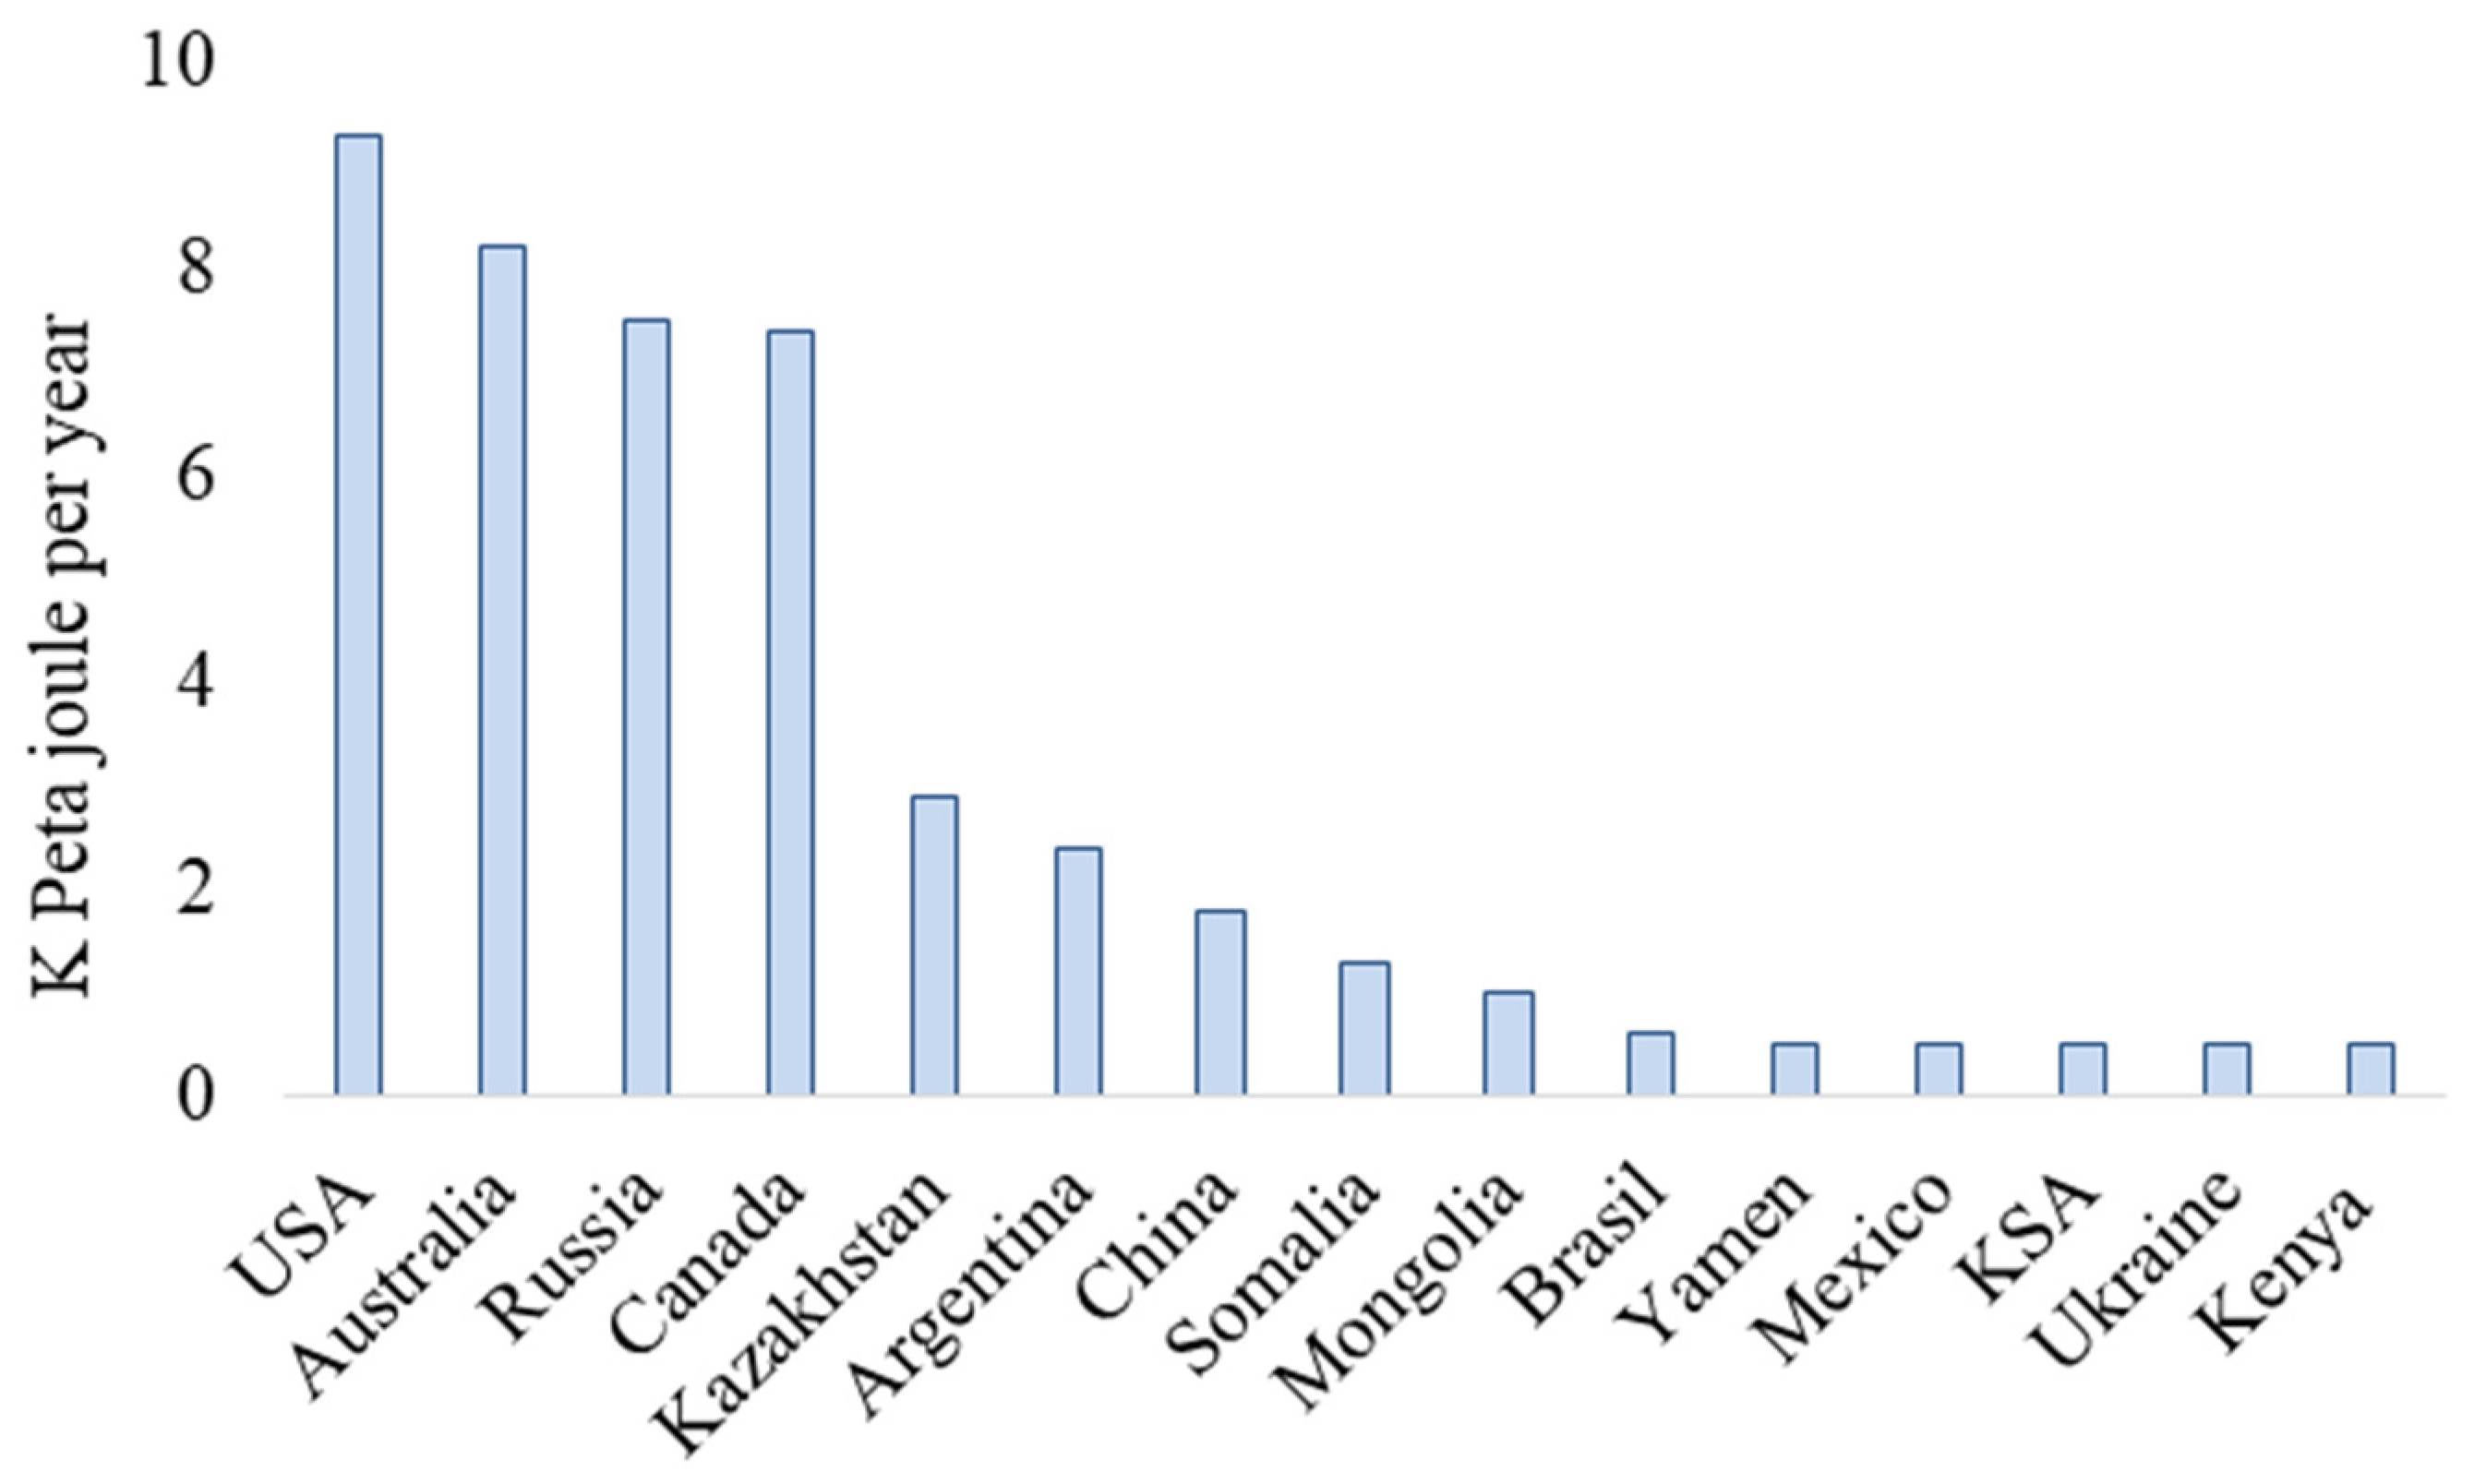
3.1.2. Wind Speed Levels

Figure 5 presents the wind speed levels for four selected locations, highlighting the crucial role of wind speed in energy generation from wind. The results indicate notable seasonal variations, with wind speeds generally peaking in summer. Wind speeds tend to rise gradually throughout the day, reaching their highest levels around midday due to solar heating effects. A detailed examination of the figures reveals that wind speeds tend to increase after the late morning hours, reaching their peak by the end of the day. Annually, summer months exhibit the highest wind speeds, particularly in coastal regions like Yanbu and nearby locations such as Hafr Al-Batin, which experience notably stronger winds. In contrast, Al-Qassim and Riyadh demonstrate medium to low wind speeds, highlighting the geographical influence on wind energy potential in these areas.

3.2. Energy Production Potential

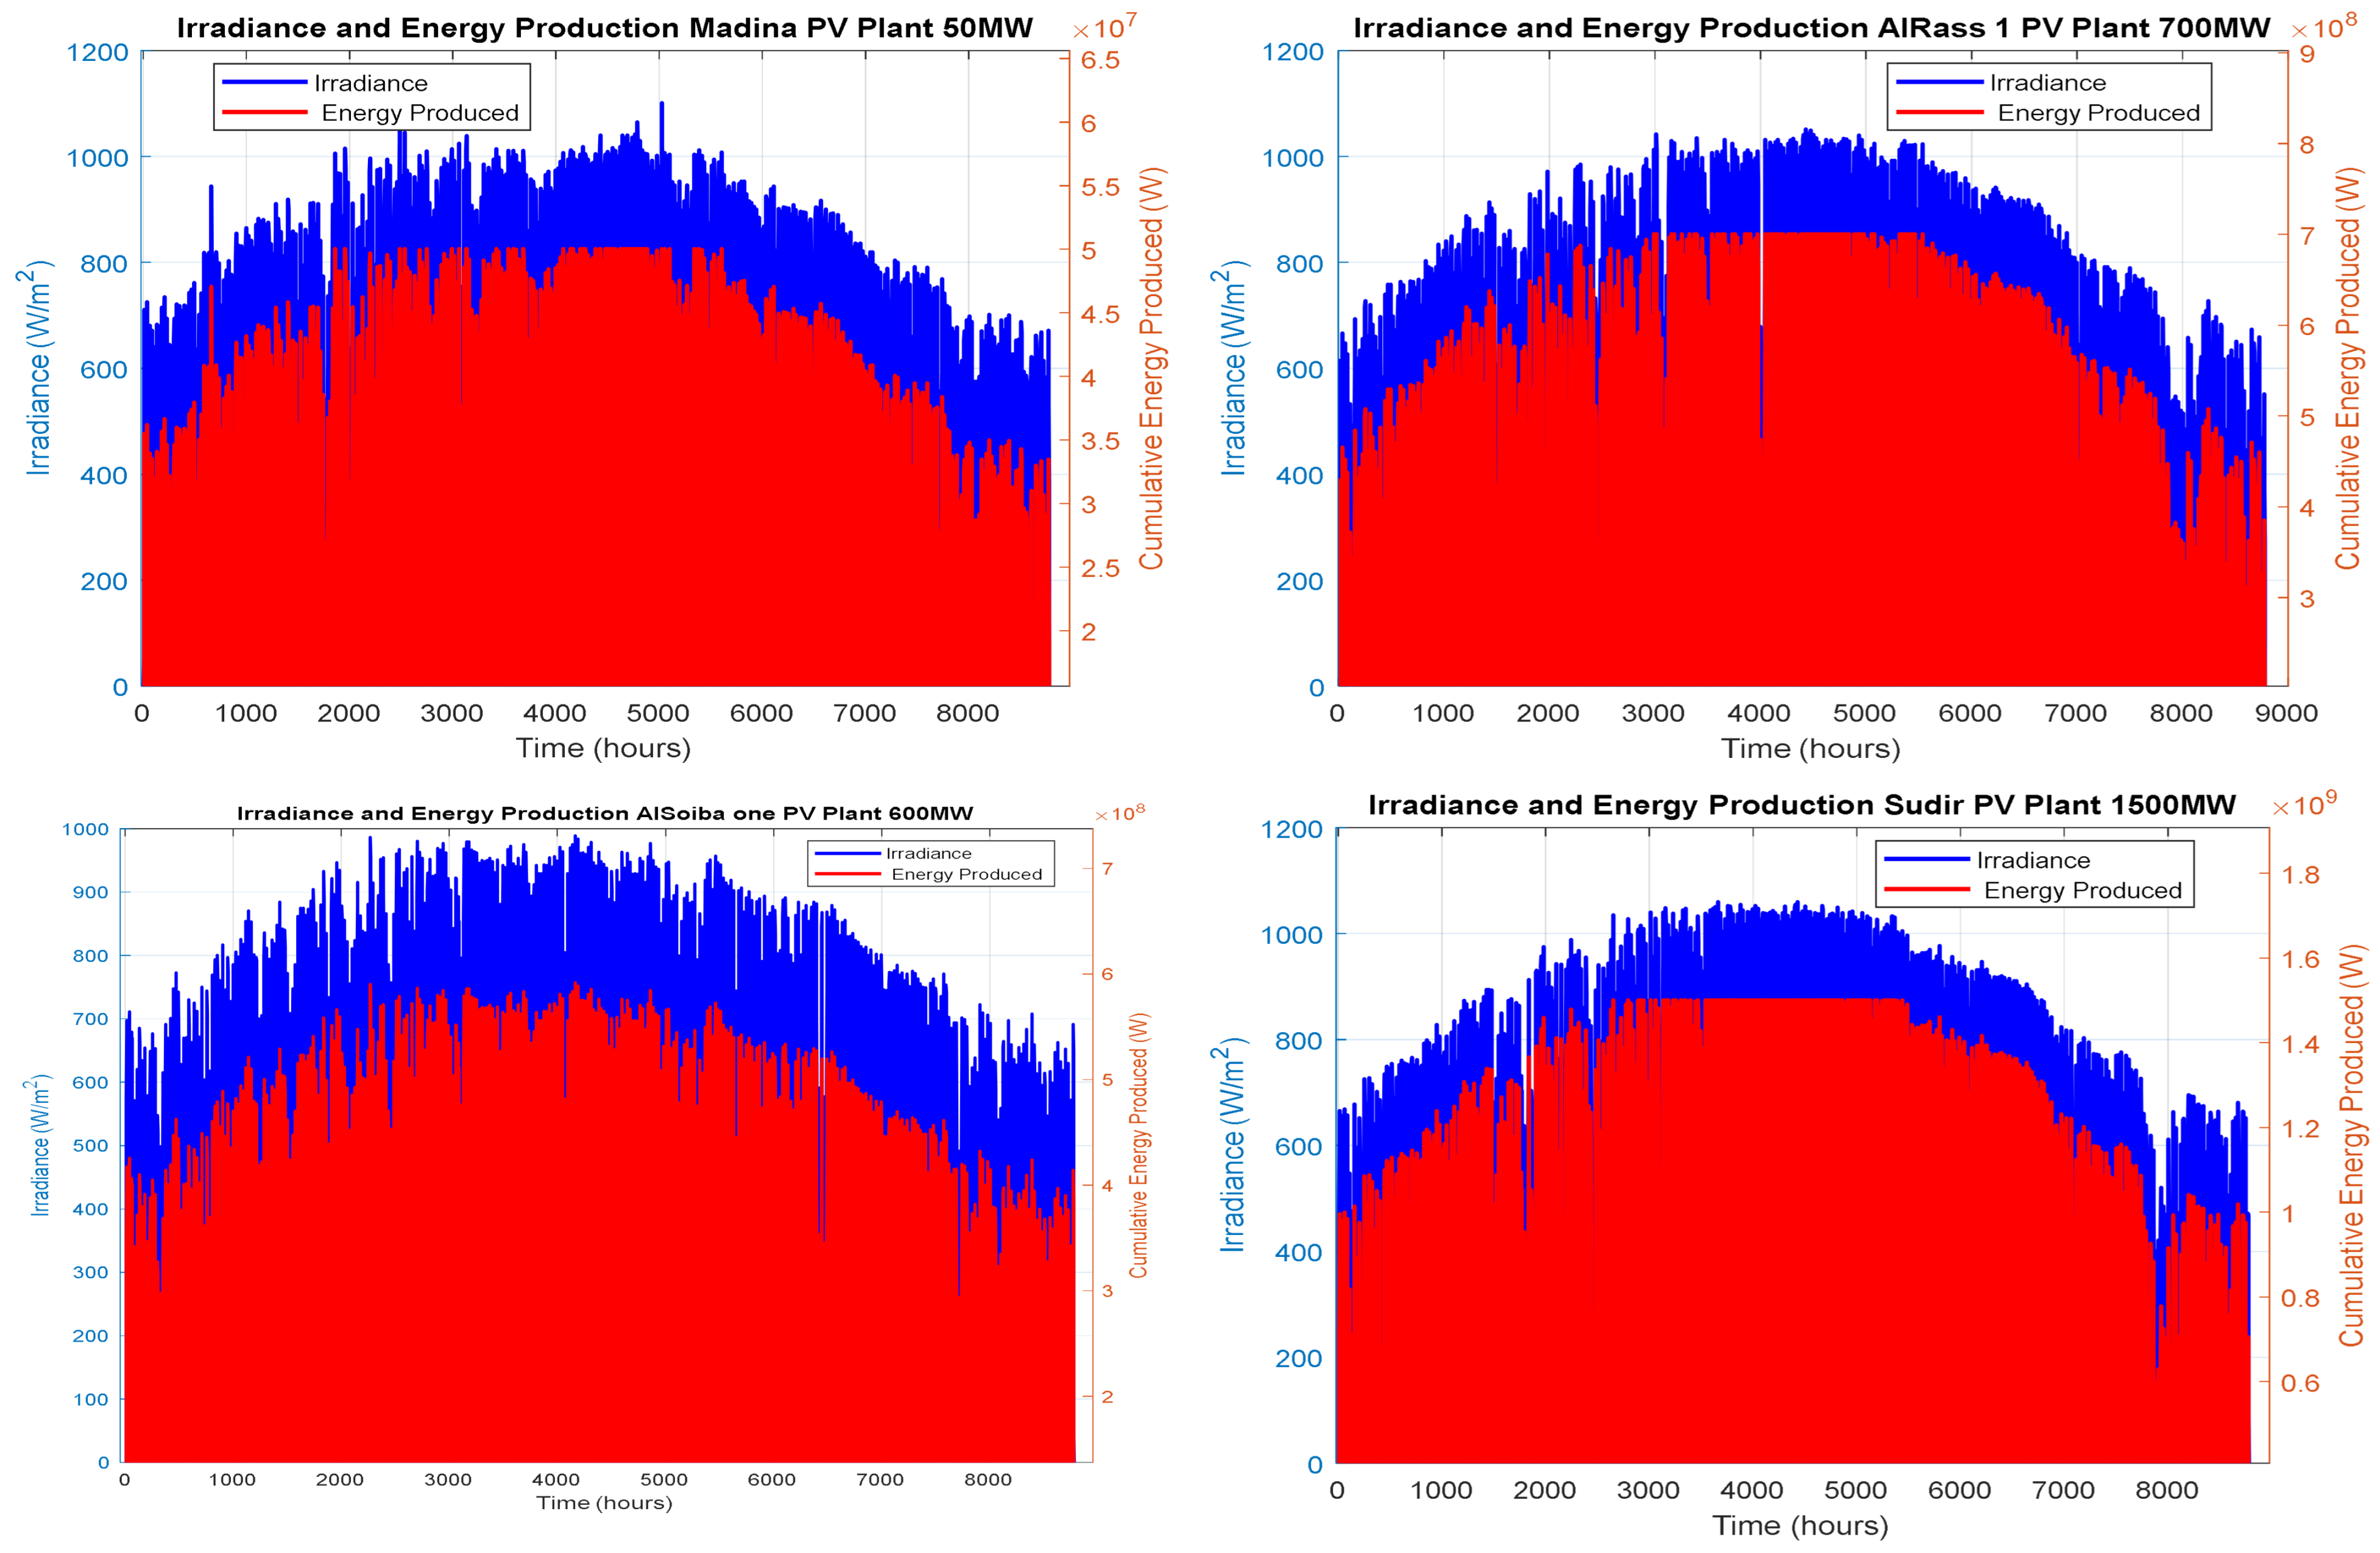
3.2.1. Solar Potential

A MATLAB code was developed to assess the performance of solar energy systems by calculating power output based on temperature and solar radiation percentages for each selected location. The program integrates data from the specified panel model in Table 2, applying appropriate solar power models to analyze performance based on the defined number of units. By simulating the energy produced according to the station’s production capacity, the program compares the generated energy with solar radiation data over a span of 8784 h, providing insights into system performance and efficiency.
The following figures (Figure 6) present simulations for four stations within Saudi Arabia’s solar energy projects: Al-Rass, Al-Madina, Sudair, and Al-Shuaiba One (Table 1). They illustrate hourly variations in energy output, highlighting differences in energy production based on the percentage of solar radiation at each location. These simulations offer valuable insights into how solar radiation fluctuations impact hourly energy generation across different regions.

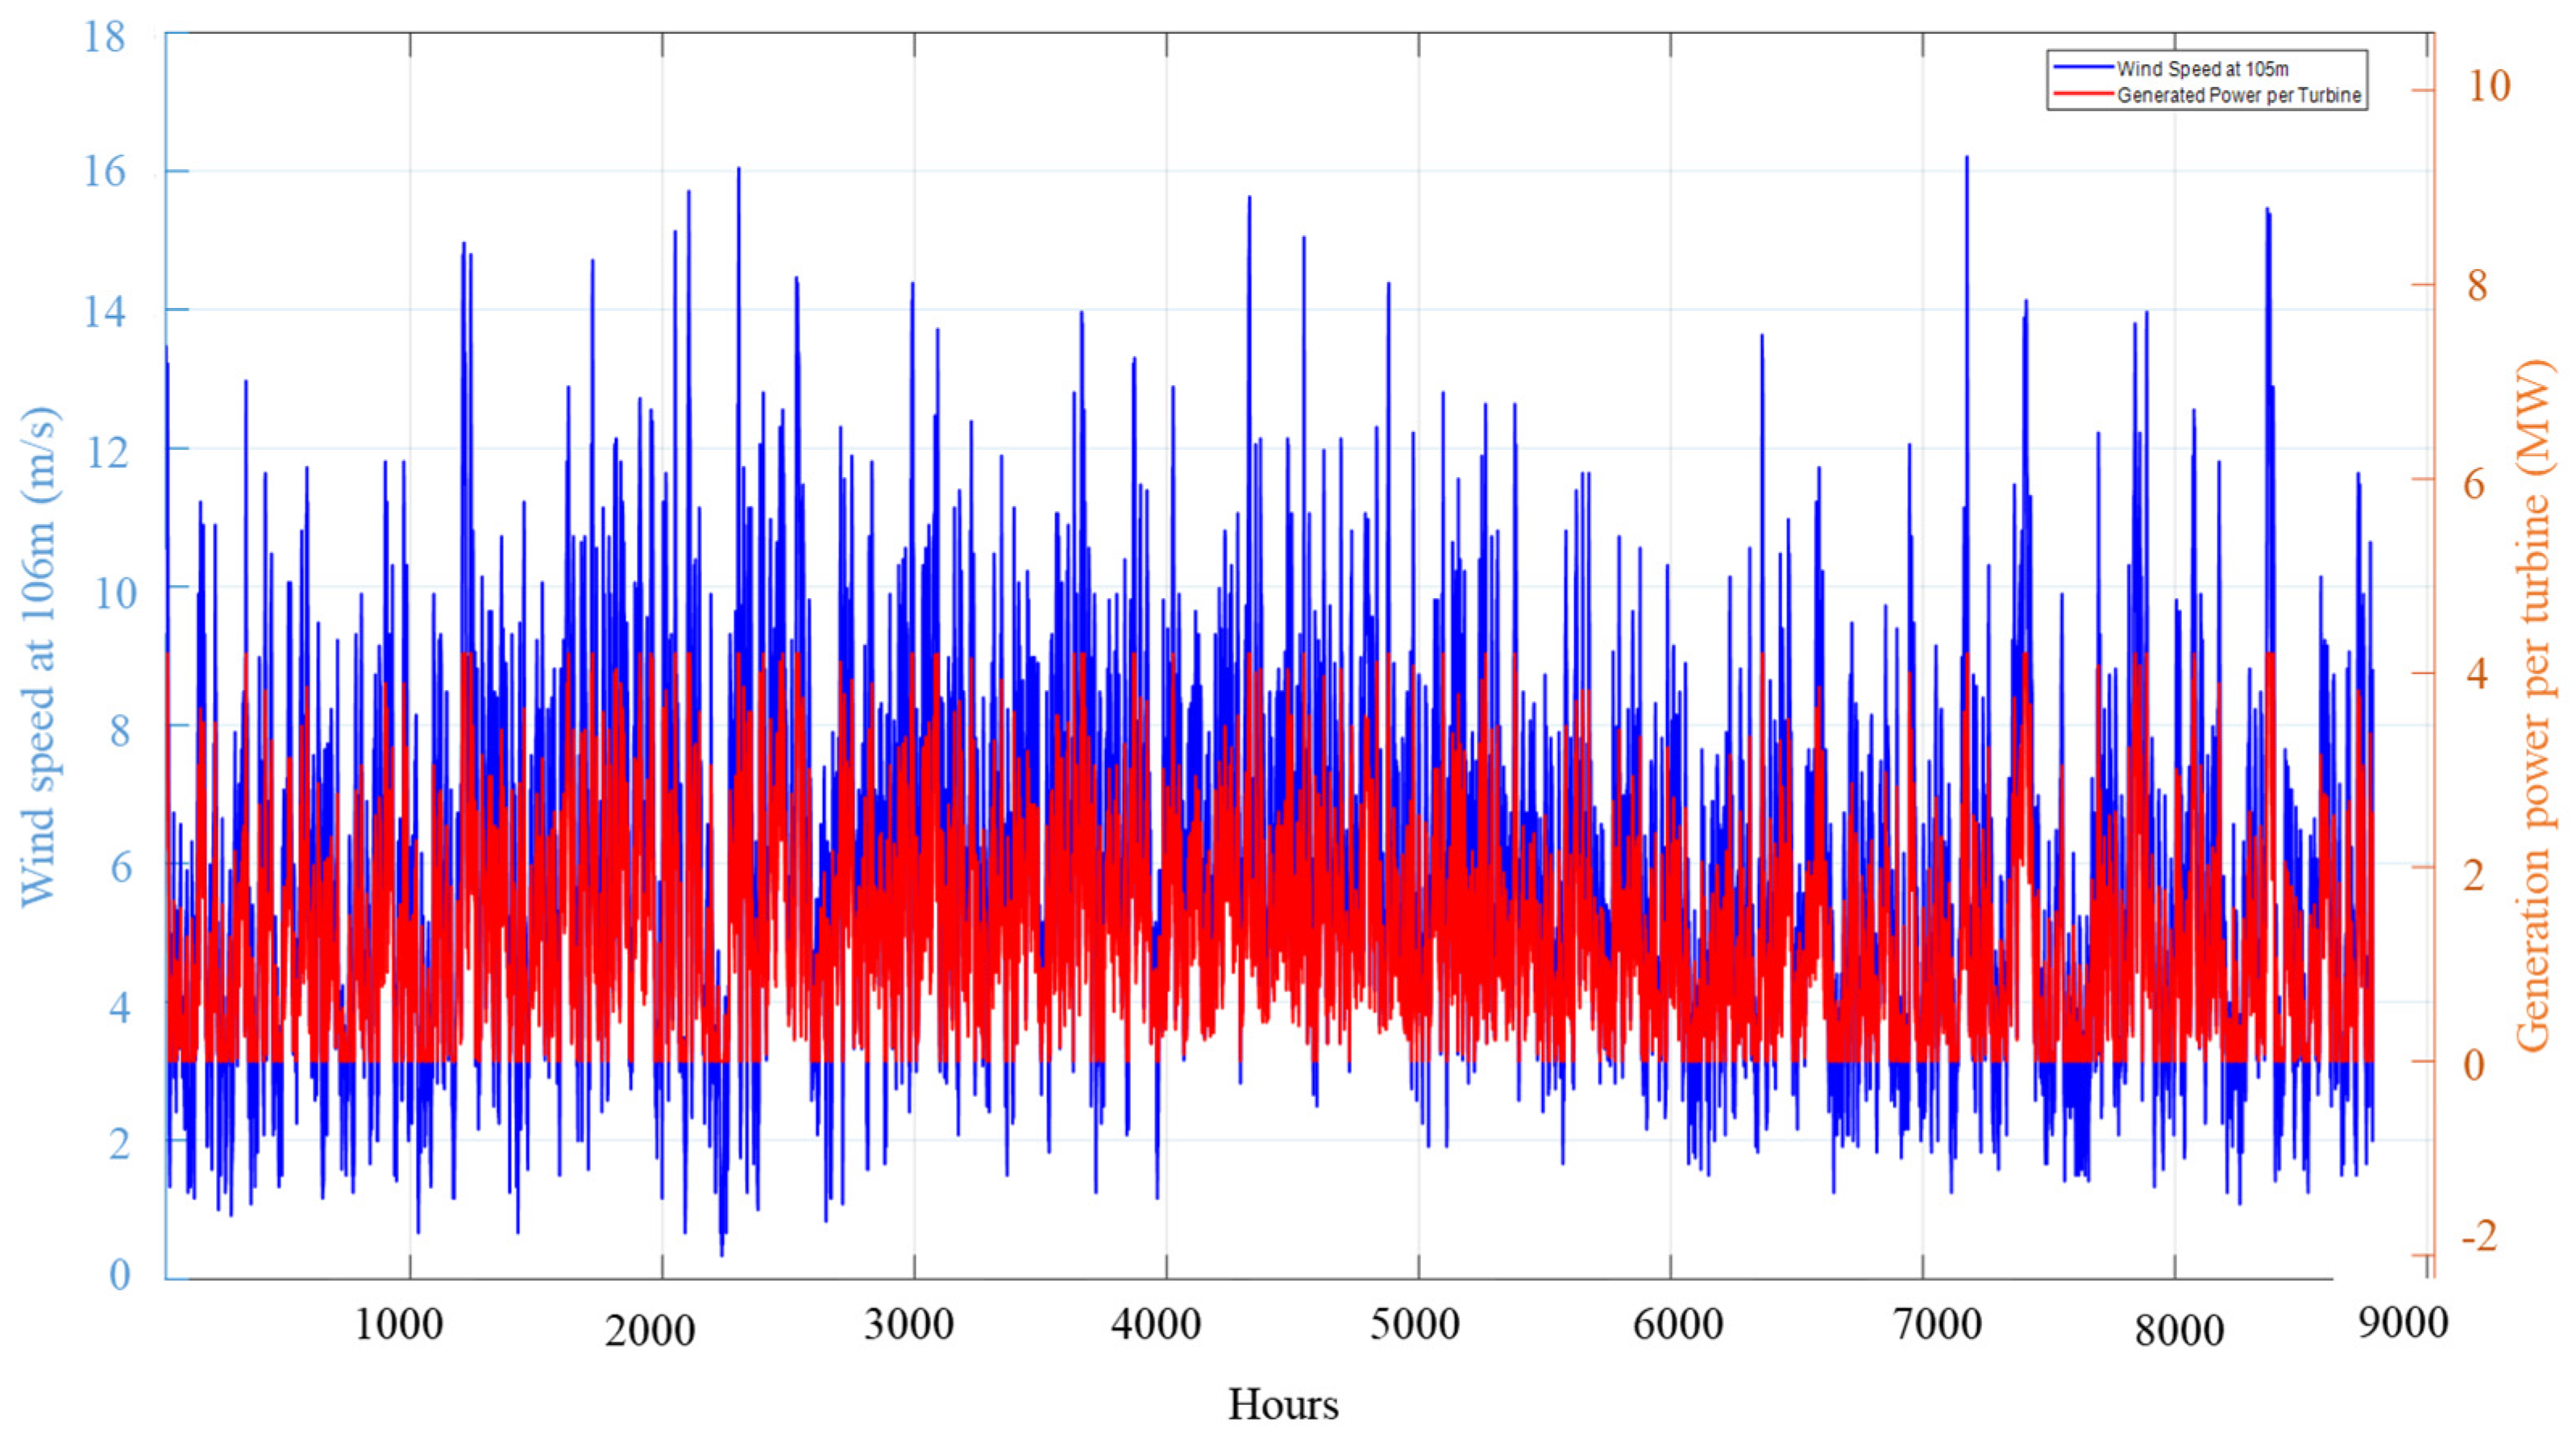
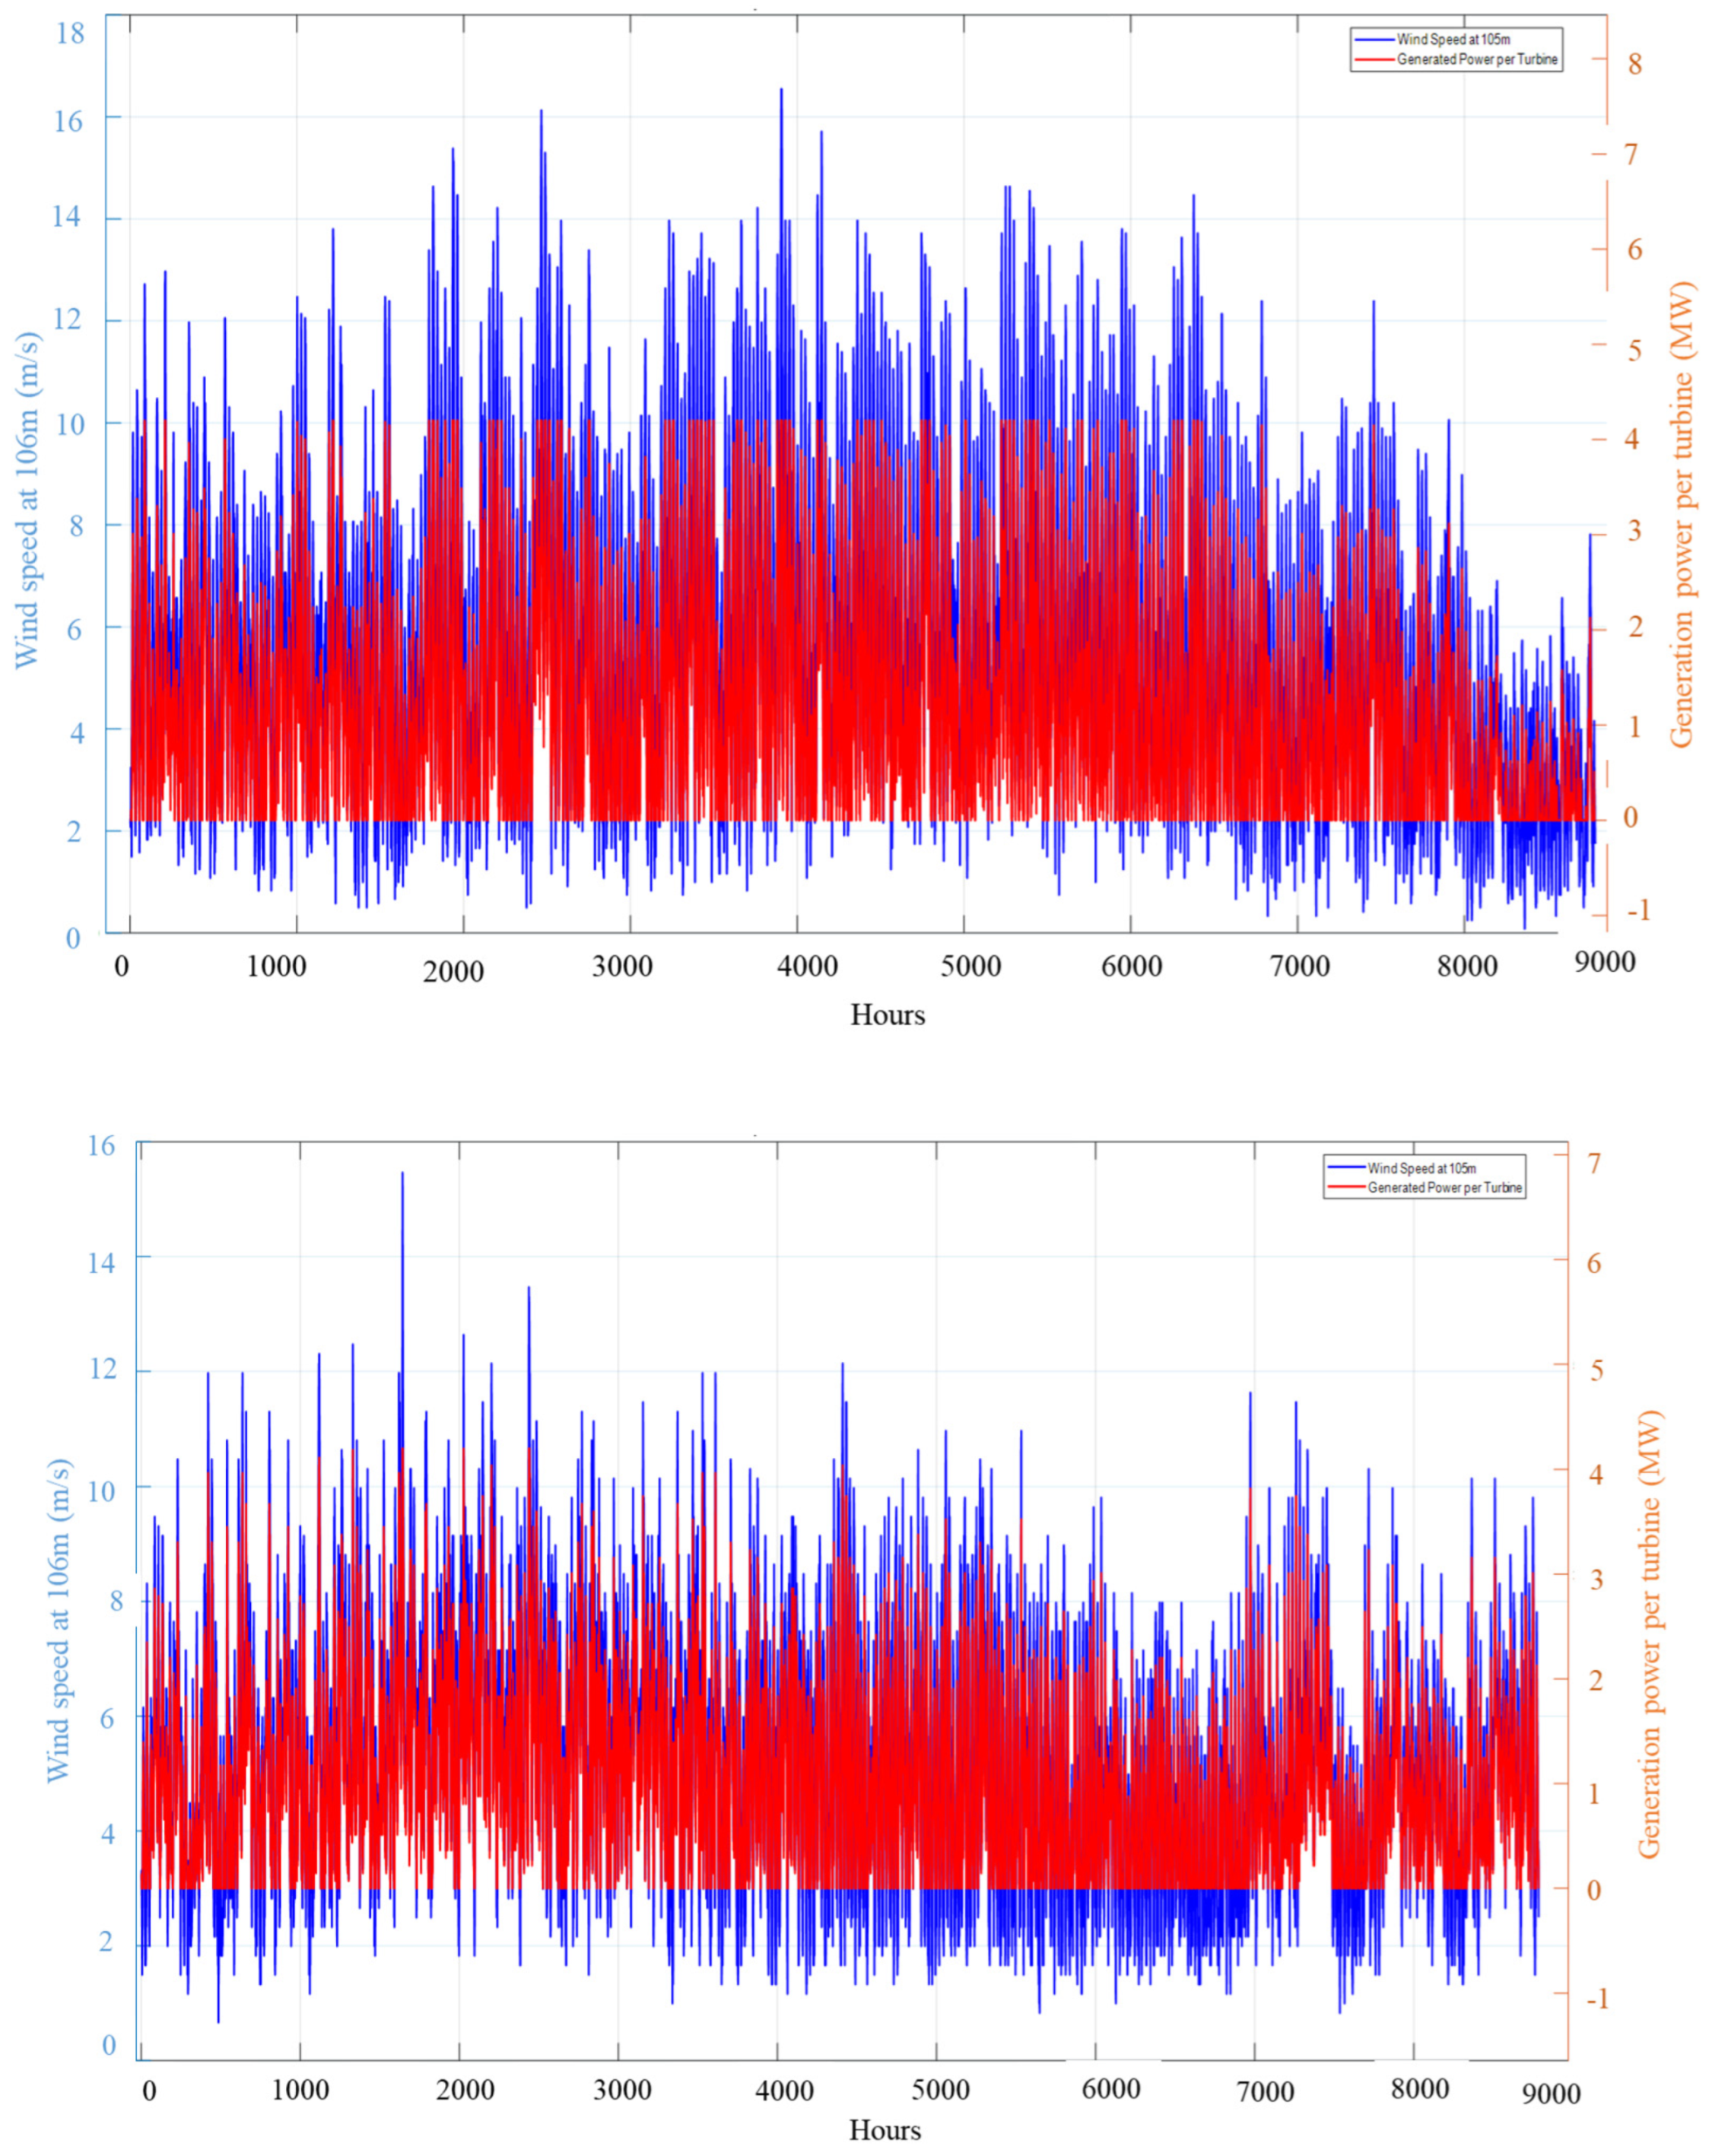
3.2.2. Wind Potential

A MATLAB code was developed to estimate wind energy production by adjusting wind speed for turbine height and using unit-specific data to simulate energy output based on turbine speed. The code accounts for conditions such as cut-in and cut-out speeds: if wind speed is below the cut-in, the output is zero; if it is between the cut-in and rated speed, output increases linearly; if it is above the rated speed but below cut-out, output remains constant; and if it is above cut-out, the output returns to zero. Details of the wind turbine model used for the analysis is presented in Table 3.
Figure 7 illustrates the direct relationship between wind speed (blue) and power generated (red) by a single turbine over the year. The turbine’s operation is directly impacted by fluctuations in wind speed, which remains within the cut-in and cut-out thresholds. These figures emphasize how the power output adjusts in response to seasonal and daily variations in wind speed.

4. Reliability Analysis
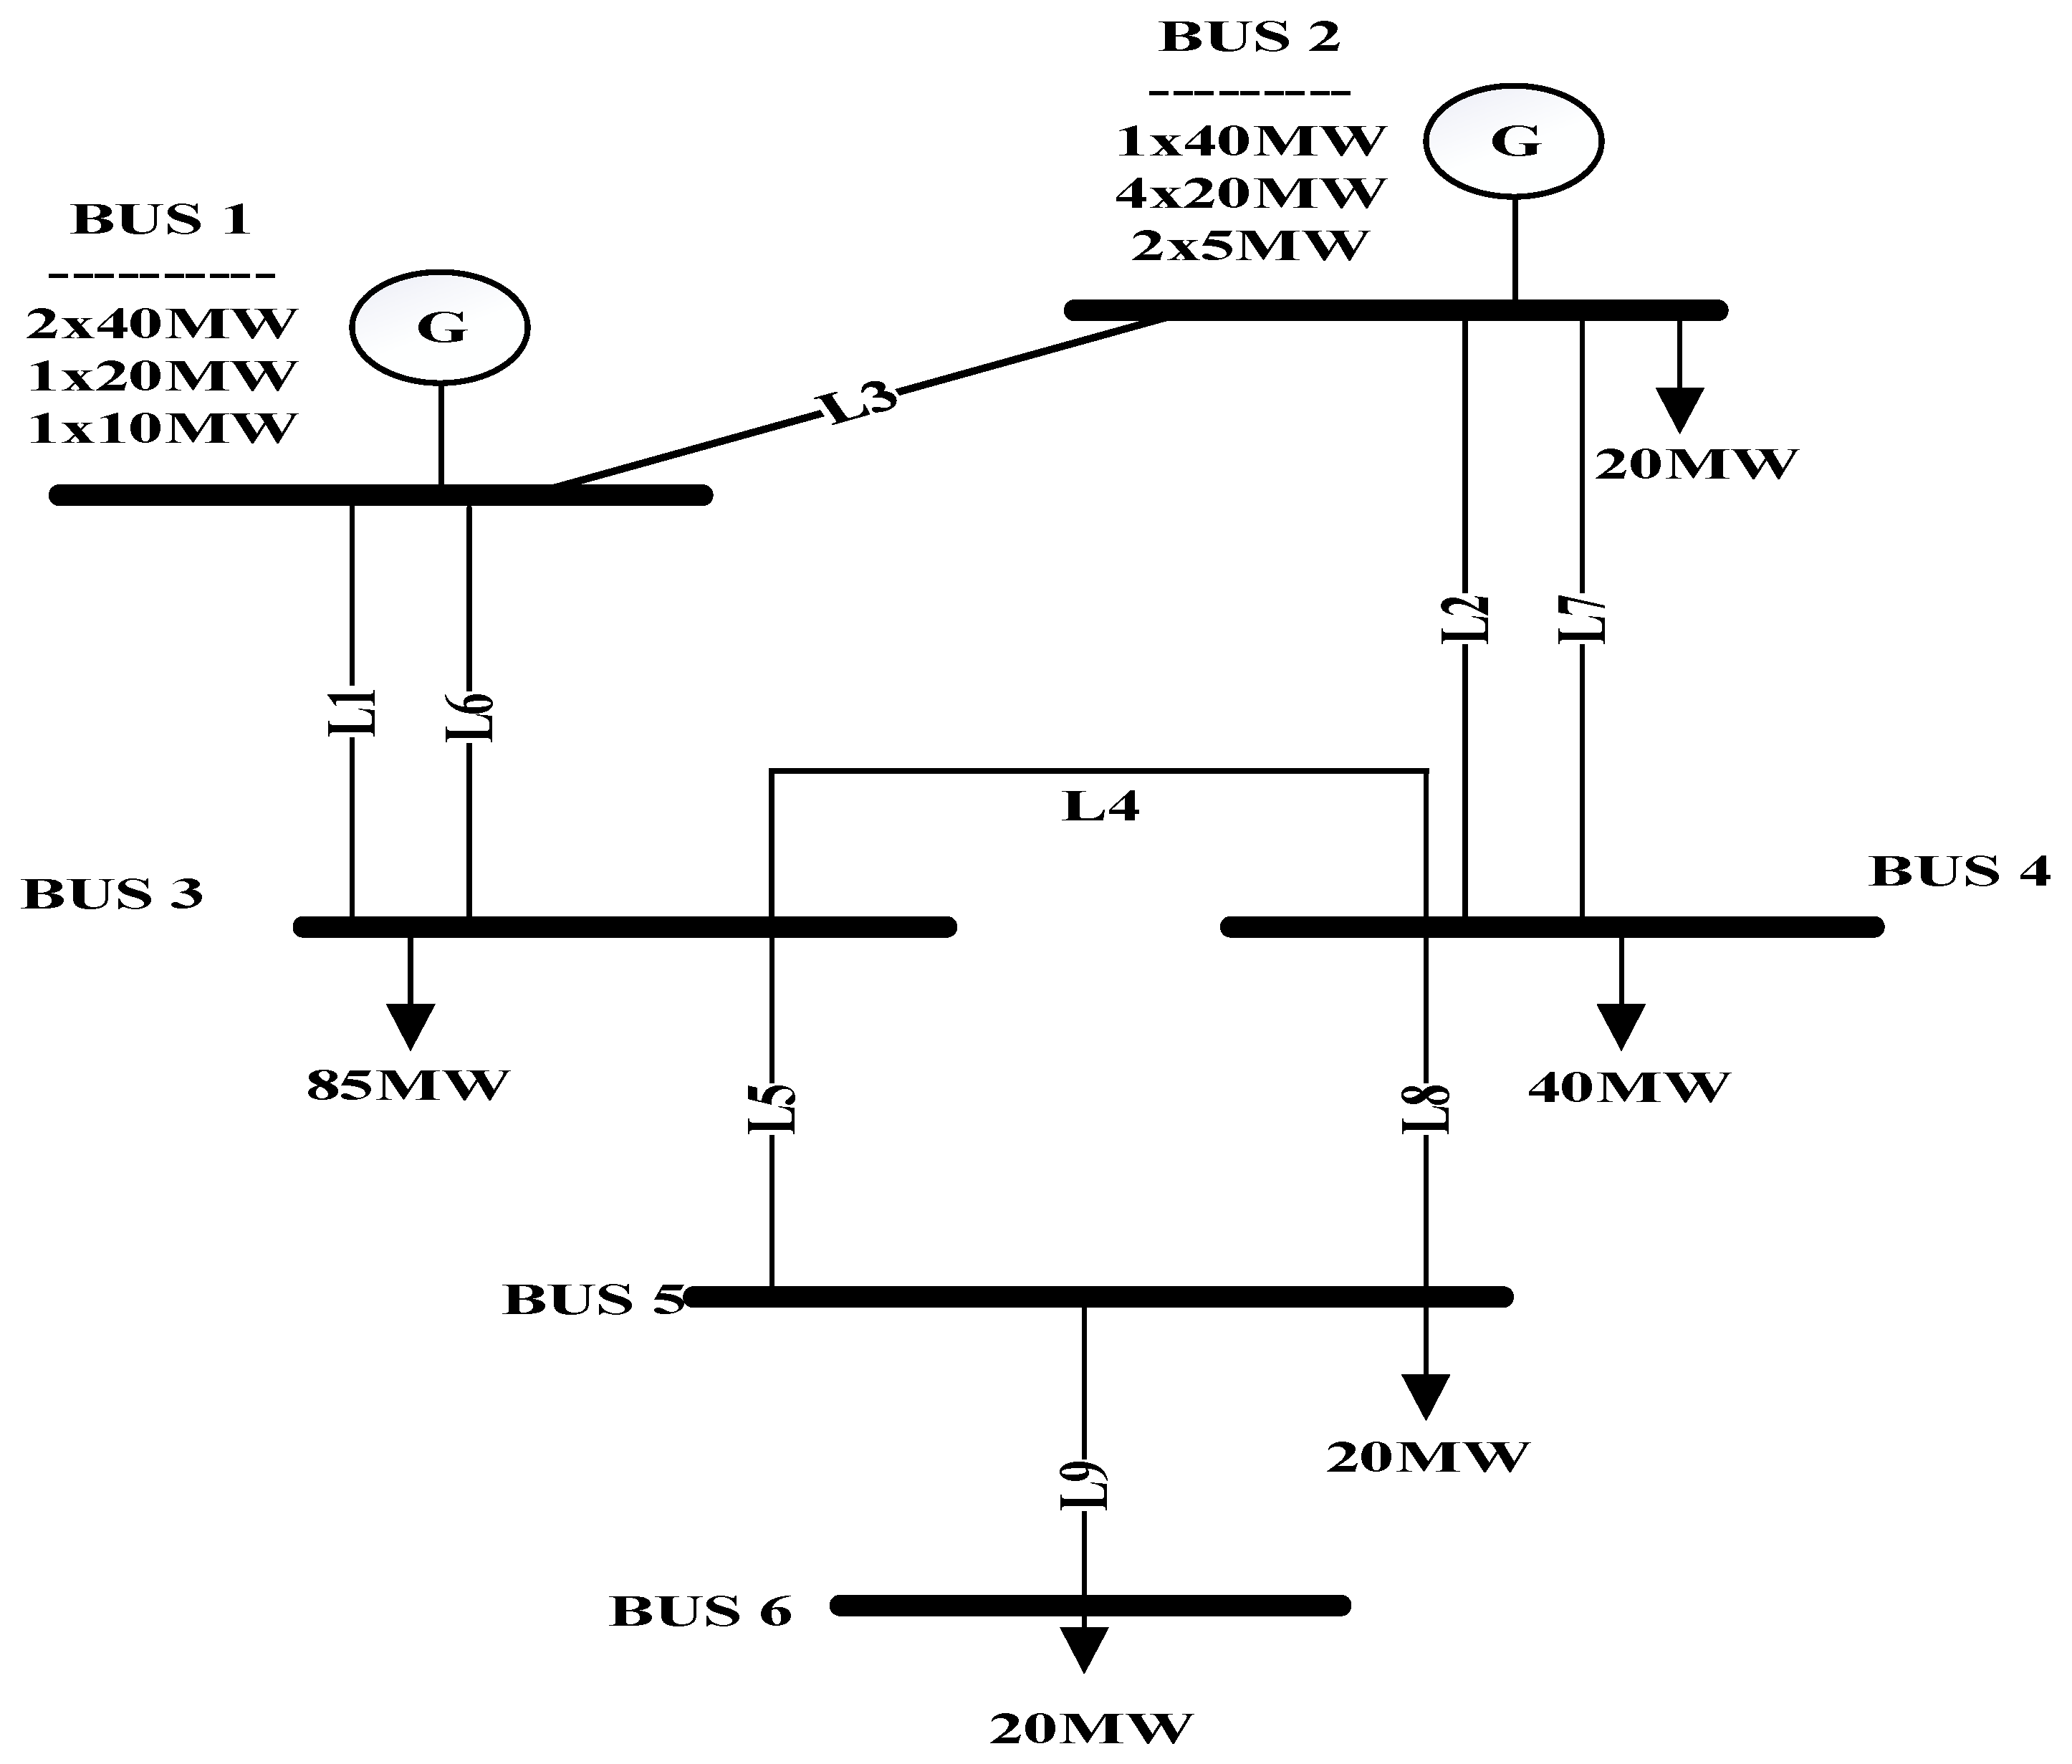
This section evaluates the adequacy of renewable energy generation in Saudi Arabia using the IEEE Roy Billinton Test System (RBTS). It assesses 28 renewable projects across different locations through Monte Carlo simulations over 10,000 simulated years to replicate operational conditions. The Monte Carlo method was chosen for its robustness in handling the stochastic nature of renewable energy generation and demand profiles. It allows for repeated random sampling to simulate a wide range of possible system states over time, which is particularly useful when evaluating reliability metrics such as LOLE, LOEE, and LOLF under high variability and uncertainty. While alternative methods such as analytical techniques or point estimation methods exist, they often rely on assumptions of linearity or limited variability, which may not capture the full spectrum of intermittent renewable behavior. Moreover, Monte Carlo simulation is widely adopted in power system adequacy studies, including those based on the IEEE RBTS framework, due to its flexibility and ability to model complex systems with multiple interdependent random variables [36,37]. Key reliability indices analyzed include LOLE, LOEE, LOLF, ENSINT, and DNSINT. These metrics, informed by renewable data from previous section, reveal how renewable sources impact system reliability, aiding utility companies and strategists in aligning projects with stability and reliability goals.

4.1. Test System

The IEEE RBTS Bus 6, developed at the University of Saskatchewan [38] and illustrated in Figure 8, is designed to support detailed reliability studies. This system enables the testing of new reliability techniques and methods by providing a model for analyzing composite power system adequacy [39]. Engineers and researchers use the RBTS to simulate diverse scenarios, gaining insights into system performance and reliability under varying conditions. By understanding how changes in one part of the system affect overall adequacy, the RBTS serves as a valuable tool for refining planning and operational strategies in real-world power systems.
Figure 8 represents the test system while Figure 9 illustrates the annual load pattern of the RBTS, spanning 8760 h, with electrical load values between 50 MW and 185 MW. The load profile shows seasonal variations, with higher loads likely occurring during summer or winter peaks due to shifts in consumer demand. Weekly cycles are evident, reflecting higher weekday loads linked to increased business and industrial activity. Recognizing these fluctuations aids in capacity planning, reliability assessment, and demand response strategies.

4.2. Simulation Process
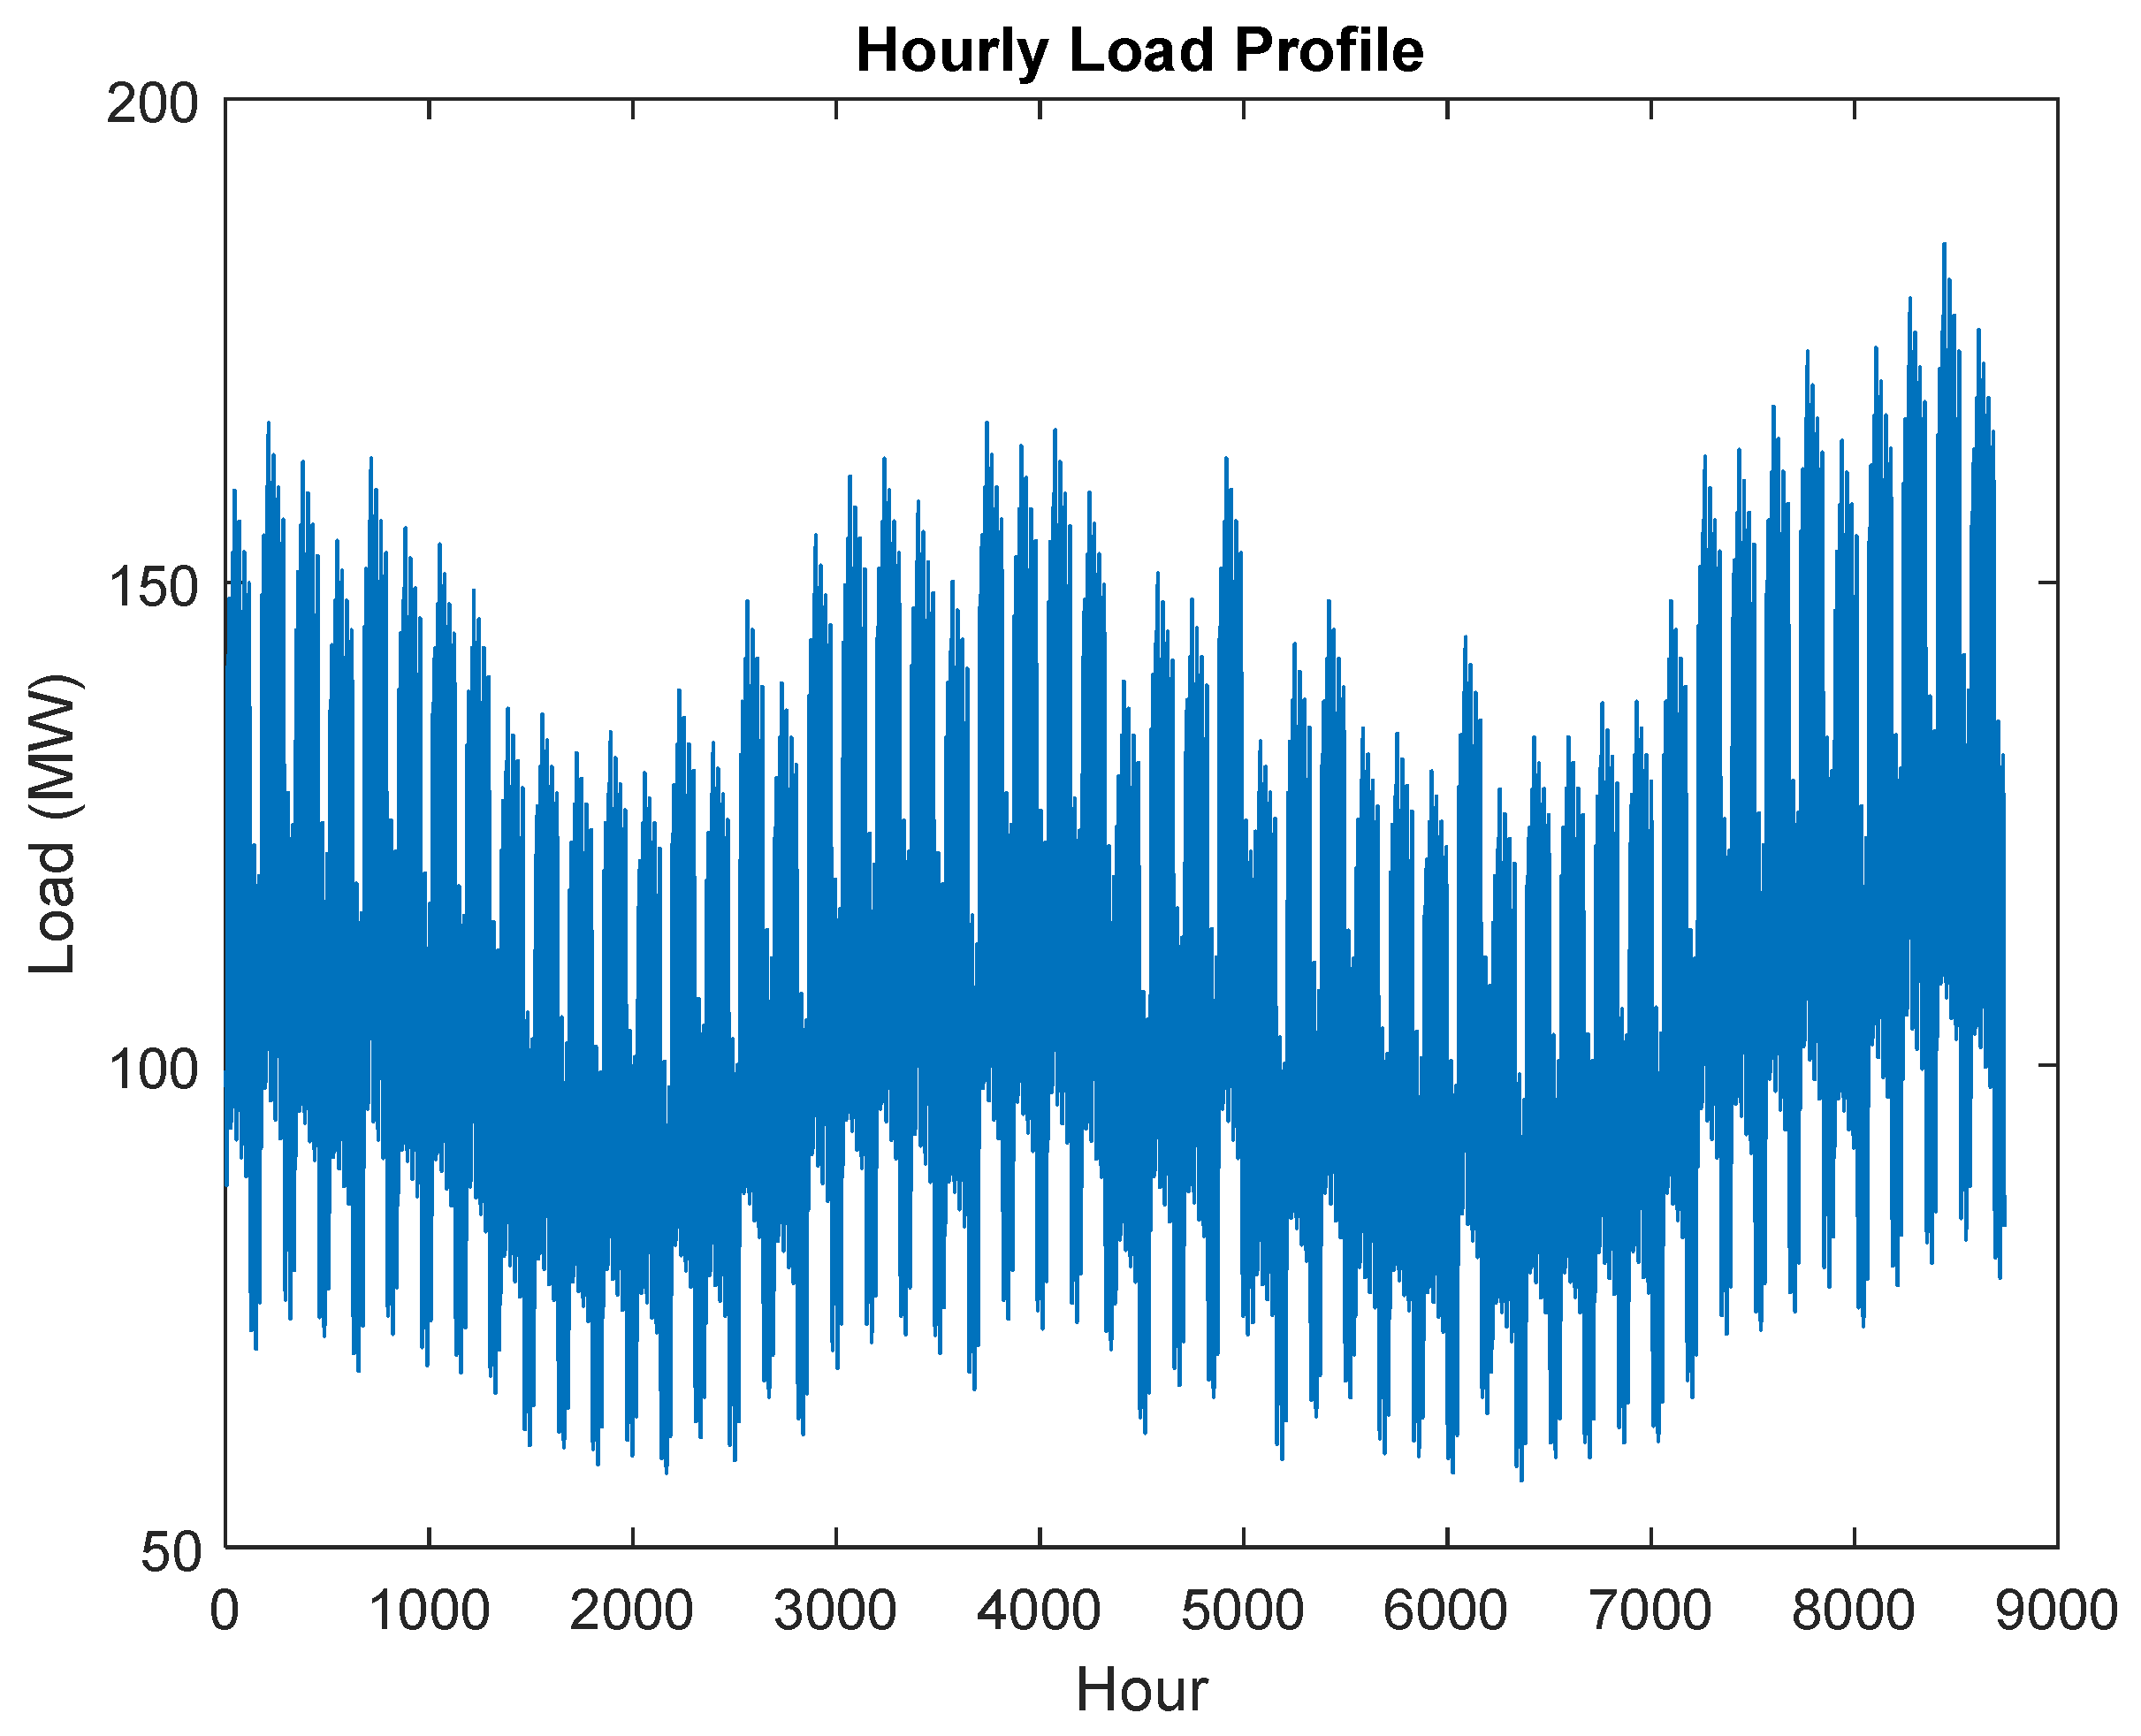
The primary procedures for simulating generation, load, and risk models using the sequential Monte Carlo Simulation method include the following:

4.2.1. Load Model

The load model estimates peak loads on an hourly, daily, and yearly basis through simulations. The process starts with data collection and standardization from historical and reliable sources to prepare for the simulations, where hourly load is calculated using the following relation:
Hourly Load = Week Peak Power × Day Peak Power × Hour Peak Power
Next, adjustments are made to account for the renewable energy integrated into the system:
Net Hourly Load = Hourly Load − Renewable Generation
This approach helps to simulate a realistic load profile by incorporating the impact of renewable generation, providing a more accurate assessment of the demand the system must support.

4.2.2. Generation Model

The power generation setup includes units with varying capacities, Mean Time to Failure (MTTF), and Mean Time to Repair (MTTR). To simulate each unit’s uptime, random values are applied to represent failure and repair durations, following a distribution that characterizes these events. This approach models the reliability and downtime of the units, providing insights into operational dependability.
The times for failure and repair events are calculated as follows:
T T F = M T T F i × l n ( U 1 )
( T T R ) = M T T R i × l n ( U 2 )
where TTF is time to failure and TTR is time to repair. Finally, U 1 and U 2 are random values between 0 and 1 generated for each failure and repair event.

4.2.3. Risk Indices

The risk assessment model assesses measures of reliability, including LOLE, LOEE, LOLF, ENSINT, and DNSINT [40].
L o s s   o f   L o a d   E x p e c t a t i o n :   L O L E = L o s s   o f   L o a d   i n   H o u r s N
L o s s   o f   E n e r g y   E x p e c t a t i o n :   L O E E = E n e r g y   N o t   S e r v e d N
L o s s   o f   L o a d   F r e q u e n c y :   L O L F = L o s s   L o a d   F r e q u e n c y N
Expected   Energy   not   Supplied :   E N S I N T = E n e r g y   N o t   S e r v e d L o s s   L o a d   F r e q u e n c y
D e m a n d   n o t   S u p p l i e d :   D N S I N T = D e m a n d   n o t   S u p p l i e d L o s s   L o a d   F r e q u e n c y

4.3. Results and Analysis

A total of 28 projects were simulated and partially injected into the RBTS, showing reliability improvements for each project when benchmarked against the RBTS standard operating conditions, as shown in Table 4. For instance, in the Sakaka project, an increase in injected capacity from 30 MW to 90 MW consistently lowers reliability indicators, such as the duration of load shedding, demand not supplied per interruption, energy not supplied per interruption, LOEE, LOLE, and LOLF. Notably, the LOLE decreases from 0.5397 at 30 MW to 0.3438 at 90 MW, indicating improved reliability with higher capacity.
Similarly, analyzing projects such as Rafha, Quriyat, and Tabarjal reveals that higher injected capacities generally result in improved reliability metrics, with decreased LOEE, LOLE, and LOLF values. For instance, the Rafha project’s LOEE decreases from 5.230911 at 30 MW to 3.237334 at 90 MW. These outcomes demonstrate that increasing the grid-injected capacity of renewable energy typically enhances the power system’s dependability by reducing the frequency and duration of load shedding while improving energy supply adequacy. This comprehensive analysis highlights the positive impact of higher renewable capacities on overall system reliability and performance.
The data in Table 4 show that as power levels increase, most regions experience improved system reliability, with reductions in interruption duration (D), ENSINT, and LOEE. Higher power levels lead to more stable performance, though the LOLF varies across regions. Regions like Sakaka and Rafha exhibit stable metrics, while areas like Madina and Sudir show more variability, indicating potential infrastructure or energy management challenges.
Similarly, analysis of different wind farms is carried out and results are tabulated in Table 5. This positive change was observed in projects such as Rafha, Quriyat, Tabarjal, and Mahdaldahab, where higher capacities resulted in decreased energy deficits and fewer instances of load shedding. The Rafha and Quriyat projects notably improved their LOEE. Moreover, the expansion of capabilities implies that a higher adoption of renewable energy could mitigate the likelihood of energy deficits during disruptions. Other projects like Alhinakiah One, Almasa, and Shoiba demonstrated a reduction in both LOLE and LOLF, suggesting that integrating renewable energy leads to fewer and shorter durations of power outages. Furthermore, wind projects such as Waad AlShimal, Doumat AlJandal, and Yanbu also exhibited this trend. In the Doumat AlJandal project, increasing the capacity from 30 MW to 90 MW resulted in improvements across all reliability aspects, highlighting the positive impact of wind energy on system reliability.
The results in Table 5 indicate a general trend of improved reliability as capacity increases from 30 MW to 90 MW across most regions. Indicators such as interruption duration (D), DNSINST, ENSINT, LOEE, LOLE, and LOLF all show noticeable decreases with higher capacity. Regions like AlGhat and Doumat AlJandal demonstrate strong performance improvements, especially in ENSINT and LOEE. However, Yanbu exhibits less sensitivity to increased capacity, with only modest reductions in reliability indices, suggesting room for targeted improvements.

5. Discussion and Future Research Directions

The findings of this study provide valuable insights into the performance and reliability of power systems with increasing levels of renewable energy integration, particularly in desert regions. However, the current methodology relies on modeled data and historical weather datasets. Incorporating real-time grid data in future work would improve model accuracy and enhance the applicability of the results to real-world operations. Moreover, the absence of a cost–benefit or economic analysis limits the ability to evaluate trade-offs between reliability, investment, and operational costs. Including such an analysis would support more robust decision-making aligned with both technical and financial objectives.
While the models developed in this study offer a solid foundation, they do not account for climate-related risks such as sandstorms, extreme heat, and dust accumulation on PV modules. These environmental stressors can significantly reduce generation efficiency and accelerate component degradation. Future work should include detailed climate-resilient modeling frameworks that capture these impacts and inform maintenance strategies and system resilience planning.
Finally, based on the findings presented in this thesis, several areas for future investigation are suggested. First, conducting a detailed reliability assessment of power systems aiming to meet 50% of local demand through renewable sources—aligned with Saudi Arabia’s Vision 2030—would be instrumental in identifying infrastructural and operational challenges. Additionally, the IEEE RTS-79 system, with its load capacity of up to 2800 MW, offers a robust platform for integrating and simulating various levels of renewable energy. Future studies should leverage this flexibility to evaluate system performance under different penetration levels and environmental scenarios.

6. Conclusions

This study demonstrates that integrating renewable energy capacities into Saudi Arabia’s power grid can significantly enhance system reliability, particularly when supported by robust planning and effective implementation strategies. By conducting a comprehensive reliability assessment using sequential Monte Carlo simulations and real project data, the research provides a quantitative foundation for evaluating renewable energy’s contribution to grid adequacy, an area that remains underexplored in the context of the Gulf region. The findings contribute to the existing literature by filling a critical gap concerning region-specific modeling of renewable integration, which is vital for informing national energy policies aligned with Vision 2030 goals. The results offer a practical framework for utility companies and system operators to maximize the benefits of renewable resources while safeguarding key reliability metrics. Notably, increasing renewable injections from 30 MW to 90 MW resulted in substantial improvements across all indices—Loss of Load Expectation (LOLE), Loss of Energy Expectation (LOEE), Loss of Load Frequency (LOLF), Energy Not Supplied per Interruption (ENSINT), and Demand Not Supplied per Interruption (DNSINT). These improvements validate the adequacy of renewables in meeting growing demand without compromising system reliability.
While site-specific outcomes are promising, the research also identifies a need to further examine the aggregated performance of the national grid when diverse renewable projects are integrated simultaneously. Such scenarios may introduce new operational uncertainties that require advanced modeling and real-time validation. Future work should therefore expand the geographic and temporal scope of simulations, incorporate real-time grid data, and assess techno-economic trade-offs under evolving climate risks such as extreme heat and sandstorms.

Author Contributions

Conceptualization, Y.A. and A.A.; methodology, Y.A.; software, Y.A.; validation, A.A.; formal analysis, Y.A.; investigation, Y.A.; resources, A.A.; data curation, Y.A.; writing—original draft preparation, Y.A.; writing—review and editing, A.A.; visualization, Y.A.; supervision, A.A.; project administration, A.A.; funding acquisition, A.A. All authors have read and agreed to the published version of the manuscript.

Funding

The authors extend the appreciation to the Deanship of Postgraduate Studies and Scientific Research at Majmaah University for funding this research work through the project number (R-2025-1784).

Institutional Review Board Statement

Not applicable.

Informed Consent Statement

Not applicable.

Data Availability Statement

No new data were created or analyzed in this study. Data sharing is not applicable to this article.

Conflicts of Interest

The authors declare no conflicts of interest.

References

  1. Adelekan, O.A.; Ilugbusi, B.S.; Adisa, O.; Obi, O.C.; Awonuga, K.F.; Asuzu, O.F.; Ndubuisi, N.L. Energy Transition Policies: A Global Review of Shifts Towards Renewable Sources. Eng. Sci. Technol. J. 2024, 5, 272–287. [Google Scholar] [CrossRef]
  2. Rastegar, H.; Eweje, G.; Sajjad, A. The impact of environmental policy on renewable energy innovation: A systematic literature review and research directions. Sustain. Dev. 2024, 32, 3859–3876. [Google Scholar] [CrossRef]
  3. Musilek, P.; Hussain, A. Equity-oriented power sharing and demand response for enhancing green energy access in mixed communities. Energy Build. 2024, 308, 114029. [Google Scholar] [CrossRef]
  4. Jung, C. Recent Development and Future Perspective of Wind Power Generation. Energies 2024, 17, 5391. [Google Scholar] [CrossRef]
  5. Wang, Y.; Wang, R.; Tanaka, K.; Ciais, P.; Penuelas, J.; Balkanski, Y.; Sardans, J.; Hauglustaine, D.; Liu, W.; Xing, X.; et al. Accelerating the energy transition towards photovoltaic and wind in China. Nature 2023, 619, 761–767. [Google Scholar] [CrossRef]
  6. Tabassum, S.; Rahman, T.; Islam, A.U.; Rahman, S.; Dipta, D.R.; Roy, S.; Mohammad, N.; Nawar, N.; Hossain, E. Solar Energy in the United States: Development, Challenges and Future Prospects. Energies 2021, 14, 8142. [Google Scholar] [CrossRef]
  7. Wałachowska, A.; Ignasiak-Szulc, A. Comparison of Renewable Energy Sources in ‘New’ EU Member States in the Context of National Energy Transformations. Energies 2021, 14, 7963. [Google Scholar] [CrossRef]
  8. Aleluia, J.; Tharakan, P.; Chikkatur, A.P.; Shrimali, G.; Chen, X. Accelerating a clean energy transition in Southeast Asia: Role of governments and public policy. Renew. Sustain. Energy Rev. 2022, 159, 112226. [Google Scholar] [CrossRef]
  9. Stringer, T.; Joanis, M. Assessing energy transition costs: Sub-national challenges in Canada. Energy Policy 2022, 164, 112879. [Google Scholar] [CrossRef]
  10. Chomać-Pierzecka, E. Investment in Offshore Wind Energy in Poland and Its Impact on Public Opinion. Energies 2024, 17, 3912. [Google Scholar] [CrossRef]
  11. Rahimi, I.; Nikoo, M.R.; Gandomi, A.H. Techno-economic analysis for using hybrid wind and solar energies in Australia. Energy Strateg. Rev. 2023, 47, 101092. [Google Scholar] [CrossRef]
  12. Elshurafa, A.M.; Peerbocus, N. Electric vehicle deployment and carbon emissions in Saudi Arabia: A power system perspective. Electr. J. 2020, 33, 106774. [Google Scholar] [CrossRef]
  13. Saudi Vision 2030. Available online: https://www.vision2030.gov.sa/en (accessed on 4 November 2024).
  14. Almutairi, A. Plug-in electric vehicles and their impact on power generation availability: A real survey-based analysis in Saudi Arabia. Sustain. Cities Soc. 2021, 75, 103389. [Google Scholar] [CrossRef]
  15. Islam, M.T.; Ali, A. Sustainable green energy transition in Saudi Arabia: Characterizing policy framework, interrelations and future research directions. Next Energy 2024, 5, 100161. [Google Scholar] [CrossRef]
  16. Short, S.; Molini, A.; Santamarina, J.C.; Friedrich, L. COP26 Visions for a Net Zero Future—Regional Profile for the Arabian Peninsula. Camb. Open Engag. 2021. [Google Scholar] [CrossRef]
  17. Chen, W.; Castruccio, S.; Genton, M.G.; Crippa, P. Current and Future Estimates of Wind Energy Potential Over Saudi Arabia. J. Geophys. Res. Atmos. 2018, 123, 6443–6459. [Google Scholar] [CrossRef]
  18. Sakaka Solar Power Plant. Available online: https://www.vision2030.gov.sa/en/explore/projects/sakaka-solar-power-plant (accessed on 4 November 2024).
  19. The Dumat Al-Jandal Wind Farm Is Saudi Arabia’s First Wind Farm—Green Prophet. Available online: https://www.greenprophet.com/2024/05/dumat-al-jandal-wind-farm-saudi-arabia/ (accessed on 4 November 2024).
  20. NEOM Green Hydrogen Complex|Air Products. Available online: https://www.airproducts.com/energy-transition/neom-green-hydrogen-complex (accessed on 4 November 2024).
  21. Almutairi, A. Impact Assessment of Diverse EV Charging Infrastructures on Overall Service Reliability. Sustainability 2022, 14, 13295. [Google Scholar] [CrossRef]
  22. Hussain, M.S.; Cho, K.; Park, S.J. Resource Adequacy and Integration of Renewables in Light of US, EU, and Pakistan’s Evolving Power Sector. Energies 2024, 17, 5051. [Google Scholar] [CrossRef]
  23. Pouresmaieli, M.; Ataei, M.; Qarahasanlou, A.N.; Barabadi, A. Integration of renewable energy and sustainable development with strategic planning in the mining industry. Results Eng. 2023, 20, 101412. [Google Scholar] [CrossRef]
  24. Cao, K.; Xiong, H.; Ye, C.; Jiang, K.; Yu, H.; Wang, D.; Liu, J. Collaborative Self-Standby Adjustment for Photovoltaics with Rotor Inertial Power Source Control Strategy in Weak Power Grids. Energies 2025, 18, 907. [Google Scholar] [CrossRef]
  25. Ruban, N.; Rudnik, V.; Askarov, A.; Maliuta, B. Frequency control by the PV station in electric power systems with hydrogen energy storage. Int. J. Hydrogen Energy 2023, 48, 28262–28276. [Google Scholar] [CrossRef]
  26. Ministry of Investment Saudi Arabia. Renewable Energy Brochure. Invest Saudi. 2024. Available online: https://misa.gov.sa/app/uploads/2024/03/investsaudi-renewable-energy-brochure.pdf (accessed on 12 January 2025).
  27. Al-Gahtani, S.F. Saudi Arabia’s Journey toward a Renewable Future. Energies 2024, 17, 2444. [Google Scholar] [CrossRef]
  28. Acwa Power|Sakaka PV IPP. Available online: https://acwapower.com/en/projects/sakaka-pv-ipp/ (accessed on 4 November 2024).
  29. Masdar|Dumat Al Jandal. Available online: https://masdar.ae/en/renewables/our-projects/dumat-al-jandal (accessed on 4 November 2024).
  30. Project Mahad Al-Dahab—Gudnus. Available online: https://gudnus.com/en/portfolio_page/project-mahad-al-dahab/ (accessed on 4 November 2024).
  31. Yang, C.; Wu, Z.; Li, X.; Fars, A. Risk-constrained stochastic scheduling for energy hub: Integrating renewables. demand response, and electric vehicles. Energy 2024, 288, 129680. [Google Scholar] [CrossRef]
  32. Acwa Power|Shuaibah PV IPP. Available online: https://acwapower.com/en/projects/shuaibah-pv-ipp/ (accessed on 4 November 2024).
  33. Acwa Power|Ar Rass PV IPP. Available online: https://acwapower.com/en/projects/ar-rass-pv-ipp/ (accessed on 4 November 2024).
  34. NOMAC|Sakaka PV IPP. Available online: https://www.nomac.com/en/our-operations/nomac-globally/sakaka-pv-ipp/ (accessed on 4 November 2024).
  35. Offshore Wind Turbines|Vestas. Available online: https://www.vestas.com/en/energy-solutions/offshore-wind-turbines (accessed on 4 November 2024).
  36. Abud, T.P.; Augusto, A.A.; Fortes, M.Z.; Maciel, R.S.; Borba, B.S.M.C. State of the Art Monte Carlo Method Applied to Power System Analysis with Distributed Generation. Energies 2023, 16, 394. [Google Scholar] [CrossRef]
  37. Guimarães, I.O.; da Silva, A.M.L.; Nascimento, L.C.; Fotuhi-Firuzabad, M. Reliability assessment of distribution grids with DG via quasi-sequential Monte Carlo simulation. Electr. Power Syst. Res. 2024, 229, 110122. [Google Scholar] [CrossRef]
  38. Almutairi, A. Evaluating Wind Power Generating Capacity Adequacy Using MCMC Time Series Model. Master’s Thesis, University of Waterloo, Waterloo, ON, Canada, 2014. [Google Scholar]
  39. Billinton, R.; Kumar, S.; Chowdhury, N.; Chu, K.; Debnath, K.; Goel, L.; Khan, E.; Kos, P.; Nourbakhsh, G.; Oteng-Adjei, J. A reliability test system for educational purposes—Basic data. IEEE Trans. Power Syst. 1989, 4, 1238–1244. [Google Scholar] [CrossRef]
  40. Almutairi, A.; Aljohani, T.M. Reliability-driven time-of-use tariffs for efficient plug-in electric vehicle integration. Sustain. Cities Soc. 2024, 107, 105463. [Google Scholar] [CrossRef]
Figure 1. List of top 10 countries with highest PV potential [26].
Sustainability 17 04493 g001
Figure 2. List of top 15 countries with highest onshore wind potential [26].
Sustainability 17 04493 g002
Figure 3. Procedure used for analysis in this study.
Sustainability 17 04493 g003
Figure 4. Average yearly and seasonal (summer and winter) solar irradiance (W/m2) for four selected cities.
Sustainability 17 04493 g004
Figure 5. Average yearly and seasonal (summer and winter) wind levels (m/s) for four selected cities.
Sustainability 17 04493 g005
Figure 6. Comparison of annual solar irradiance and corresponding energy generation across selected locations.
Sustainability 17 04493 g006
Figure 7. Relationship between wind speed and power output from a single wind turbine at selected locations.
Sustainability 17 04493 g007aSustainability 17 04493 g007b
Figure 8. Single line diagram of the RBTS.
Sustainability 17 04493 g008
Figure 9. Hourly load profile of the RBTS.
Sustainability 17 04493 g009
Table 1. List of all major renewable energy projects in KSA.
Project NumberProject NameEnergy TypeCapacity (MW)
1SakakaPV300
2RafhaPV20
3QuriyatPV200
4TabarjalPV400
5Waad AlShimalWIND500
6Doumat AlJandalWIND400
7Mahd AlDahabPV20
8alHinakiah OnePV1100
9alHinakiah TwoPV400
10AlKahfahPV1400
11AlMasaPV1000
12Shoiba OnePV600
13Shoiba TwoPV2060
14JeddahPV300
15Rabigh OnePV300
16Rabigh TwoPV300
17Saad OnePV300
18Saad TwoPV1125
19AlGhatWIND600
20SudirPV1500
21AlRass OnePV700
22AlRass TwoPV2000
23YanbuWIND700
24MadinaPV50
25WadiAlDawasirPV120
26AlSadawiPV2000
27LaylaPV91
28Red SeaPV1200
Table 2. Technical parameters of the PV cell module used in this study [34].
ParameterSub-ParameterValue
Model-JKM320P
TechnologyTypePoly Crystalline
Module Peak Power320 Wp
Open Circuit Voltage, Voc, V46.4 V
Standard Test Conditions, STCShort Circuit current, ISC, A9.05 A
Maximum Voltage, Vmp, V37.40 V
Maximum Current, Imp, A8.56 A
Fill Factor76.20%
Module Efficiency16.50%
Temperature coefficient of Pmax−0.40%/°C
Table 3. Technical parameters of the wind turbine used in this study [35].
ParameterValue
ManufacturerVestas (Aarhus, Denmark)
TypeVestas V150-4.2 MW 50 Hz
ModeP01
Rated Power4200 kW
Turbine serial no.228051
Hub-height above ground130 m
Rotor diameter150 m
Distance: middle of tower to middle of blade flange4.5 m
Gearbox typeZF, EH1052A
Generator typeVestas, 3 Phase IG, VND DASG 560/6M
Rotor bladesVestas Wind Systems A/S, Vestas 73.65 m
Blade additional componentsSerrated trailing edges
Power control (pitch/stall)Pitch
Table 4. Reliability indices of PV projects analyzed in this study.
NAMECI (MW)DDNSINSTENSINTLOEELOLELOLF
RBTS 4.9941494.91496644.883689.2056421.02430.2051
Sakaka302.9867184.76189225.882114.6768970.53970.1807
602.6693654.64901624.247783.8941940.42870.1606
902.3499665.38813222.716433.3234140.34380.1463
Rafha303.1428574.84228728.631155.2309110.57420.1827
602.6425564.65555824.486234.0622660.43840.1659
902.3560985.54834122.559823.2373340.33810.1435
Quriyat303.179824.97520530.815575.4666830.56410.1774
602.5898414.53241522.270573.5076140.40790.1575
902.3457485.36477821.56793.0691130.33380.1423
Tabarjal303.1259844.80553228.858525.1310450.55580.1778
602.656564.67411724.149124.1415750.45560.1715
902.366335.49351121.860753.2463210.35140.1485
Mahd AlDahab302.6778074.36665523.199774.4427550.51280.1915
602.0997575.06656617.755682.9190330.34520.1644
901.9873255.20714617.389382.6066690.29790.1499
Alhinakiah one302.7531434.64341724.827714.3448490.48180.175
602.1842114.93970719.282243.223990.36520.1672
902.0322585.34863817.374032.4236780.28350.1395
Alhinakiah two302.6788454.54172523.540333.9947940.45460.1697
602.14.80971217.697392.6546090.3150.315
902.0817895.62025319.872123.1099870.32580.1565
Alkahfah302.804024.75725525.320334.5348710.50220.1791
602.3781165.26092824.129343.9692770.39120.1645
901.9830755.26562615.772222.2365010.28120.1418
AlMasa302.7878264.54425625.028224.3173690.48090.1725
602.3003065.04631721.125693.4540510.37610.1635
902.0870665.38220418.832792.9849970.33080.1585
Shoiba One302.7344284.5695224.192664.2724240.48290.1766
602.1842625.01688919.09282.9116520.33310.1525
902.0667816.36275118.569572.1689260.24140.1168
Shoiba Two302.6530174.43270123.133874.2936470.49240.1856
602.299145.12065721.842793.3004460.34740.1511
901.9342656.02922516.576032.0173020.23540.1217
Jeddah302.7313034.31546324.694484.6228070.51130.1872
602.2989355.05123321.092753.1681310.34530.1502
901.9879886.07986717.451552.3245470.26480.1332
Rabigh One302.4173094.46187819.386213.2704530.40780.1687
602.2121954.89460919.719653.2340220.36280.164
902.0819546.51425219.244812.3247730.25150.1208
Rabigh Two302.6486334.58081123.7164.164530.46510.1756
602.24.92928819.527242.9681410.33440.152
902.027176.31194417.945592.3777910.26860.1325
Saad One302.9415144.9358229.178265.0886890.5130.1744
602.4583334.75737121.434693.4466980.39530.1608
902.292555.6684721.660613.1689470.33540.1463
Saad Two302.7982164.81798123.763634.2631960.5020.1794
602.4489164.57737422.395313.6168430.39550.1615
902.3059395.64649220.799663.011790.33390.1448
Sudir302.778144.51442524.341754.4764480.51090.1839
602.3956575.03730122.629883.7520340.39720.1658
902.1716575.52119920.310333.0526420.32640.1503
AlRass One302.804364.78883625.013354.5899510.51460.1835
602.3457614.80999721.003563.4928920.39010.1663
902.1564995.58329219.884642.9986040.32520.1508
AlRass Two302.716464.68785122.852044.0539520.48190.1774
602.3248074.57687720.743743.4870230.39080.1681
902.1194975.57205519.543632.7966940.30330.1431
Madina302.7680914.4017225.417384.460750.48580.1755
602.1110415.13192617.521752.7771970.33460.1585
902.0494135.50051418.714613.0298950.33180.1619
WadiAlDawasir302.6240864.36411123.325854.1450040.46630.1777
602.2896515.02897321.694763.5427540.37390.1633
902.0576925.5463118.568982.4139670.26750.13
AlSadawi302.9221424.57521726.440414.7883580.52920.1811
602.4915994.93104623.156583.7212630.40040.1607
902.2893475.89066121.250473.0919440.33310.1455
Layla302.6721134.33102122.612984.0138030.47430.1775
602.3096695.0521720.751513.0691490.34160.1479
902.1971155.60527920.583782.9969980.31990.1456
Red Sea302.6182554.61925722.895413.9883810.45610.1742
602.2397085.21212820.127813.0312490.33730.1506
902.0627586.48871918.966782.2968770.24980.1211
Table 5. Reliability indices of wind projects analyzed in this study.
ProjectCI (MW)DDNSINSTENSINTLOEELOLELOLF
RBTS 4.9941494.91496644.883689.2056421.02430.2051
Waad AlShimal303.7954555.02613834.216534.0649230.45090.1188
602.9412925.27753826.33252.6911810.30060.1022
902.6588895.98426826.147212.3532490.23930.09
Doumat AlJandal303.840894.95929935.206734.2705760.46590.1213
603.1248695.44813528.867312.7510540.29780.0953
902.5182145.70509721.769911.8526190.21430.0851
Yanbu304.4328725.23526740.570954.986170.54480.1229
604.2077655.42426136.779353.5050720.4010.0953
903.994535.99926336.803443.3638340.36510.0914
AlGhat303.6309054.80045632.556754.0663380.45350.1249
602.7941995.50353624.801551.7956320.20230.0724
902.3677425.47158120.087791.2454430.14680.062
Disclaimer/Publisher’s Note: The statements, opinions and data contained in all publications are solely those of the individual author(s) and contributor(s) and not of MDPI and/or the editor(s). MDPI and/or the editor(s) disclaim responsibility for any injury to people or property resulting from any ideas, methods, instructions or products referred to in the content.

