

Air Pollution in Residential Areas of Monocentric City Agglomerations: Objective and Subjective Dimensions


Abstract
1. Introduction
1.1. Raison D’être and Aim of the Study
- omission of personal protection and prevention, implemented at the household level and thus exposing oneself to unnecessary exposure,
- inadequate targeting of public action, e.g., protests against alleged rather than actual hazards,
- at the local government level, inappropriate targeting of policies.
1.2. Methodology
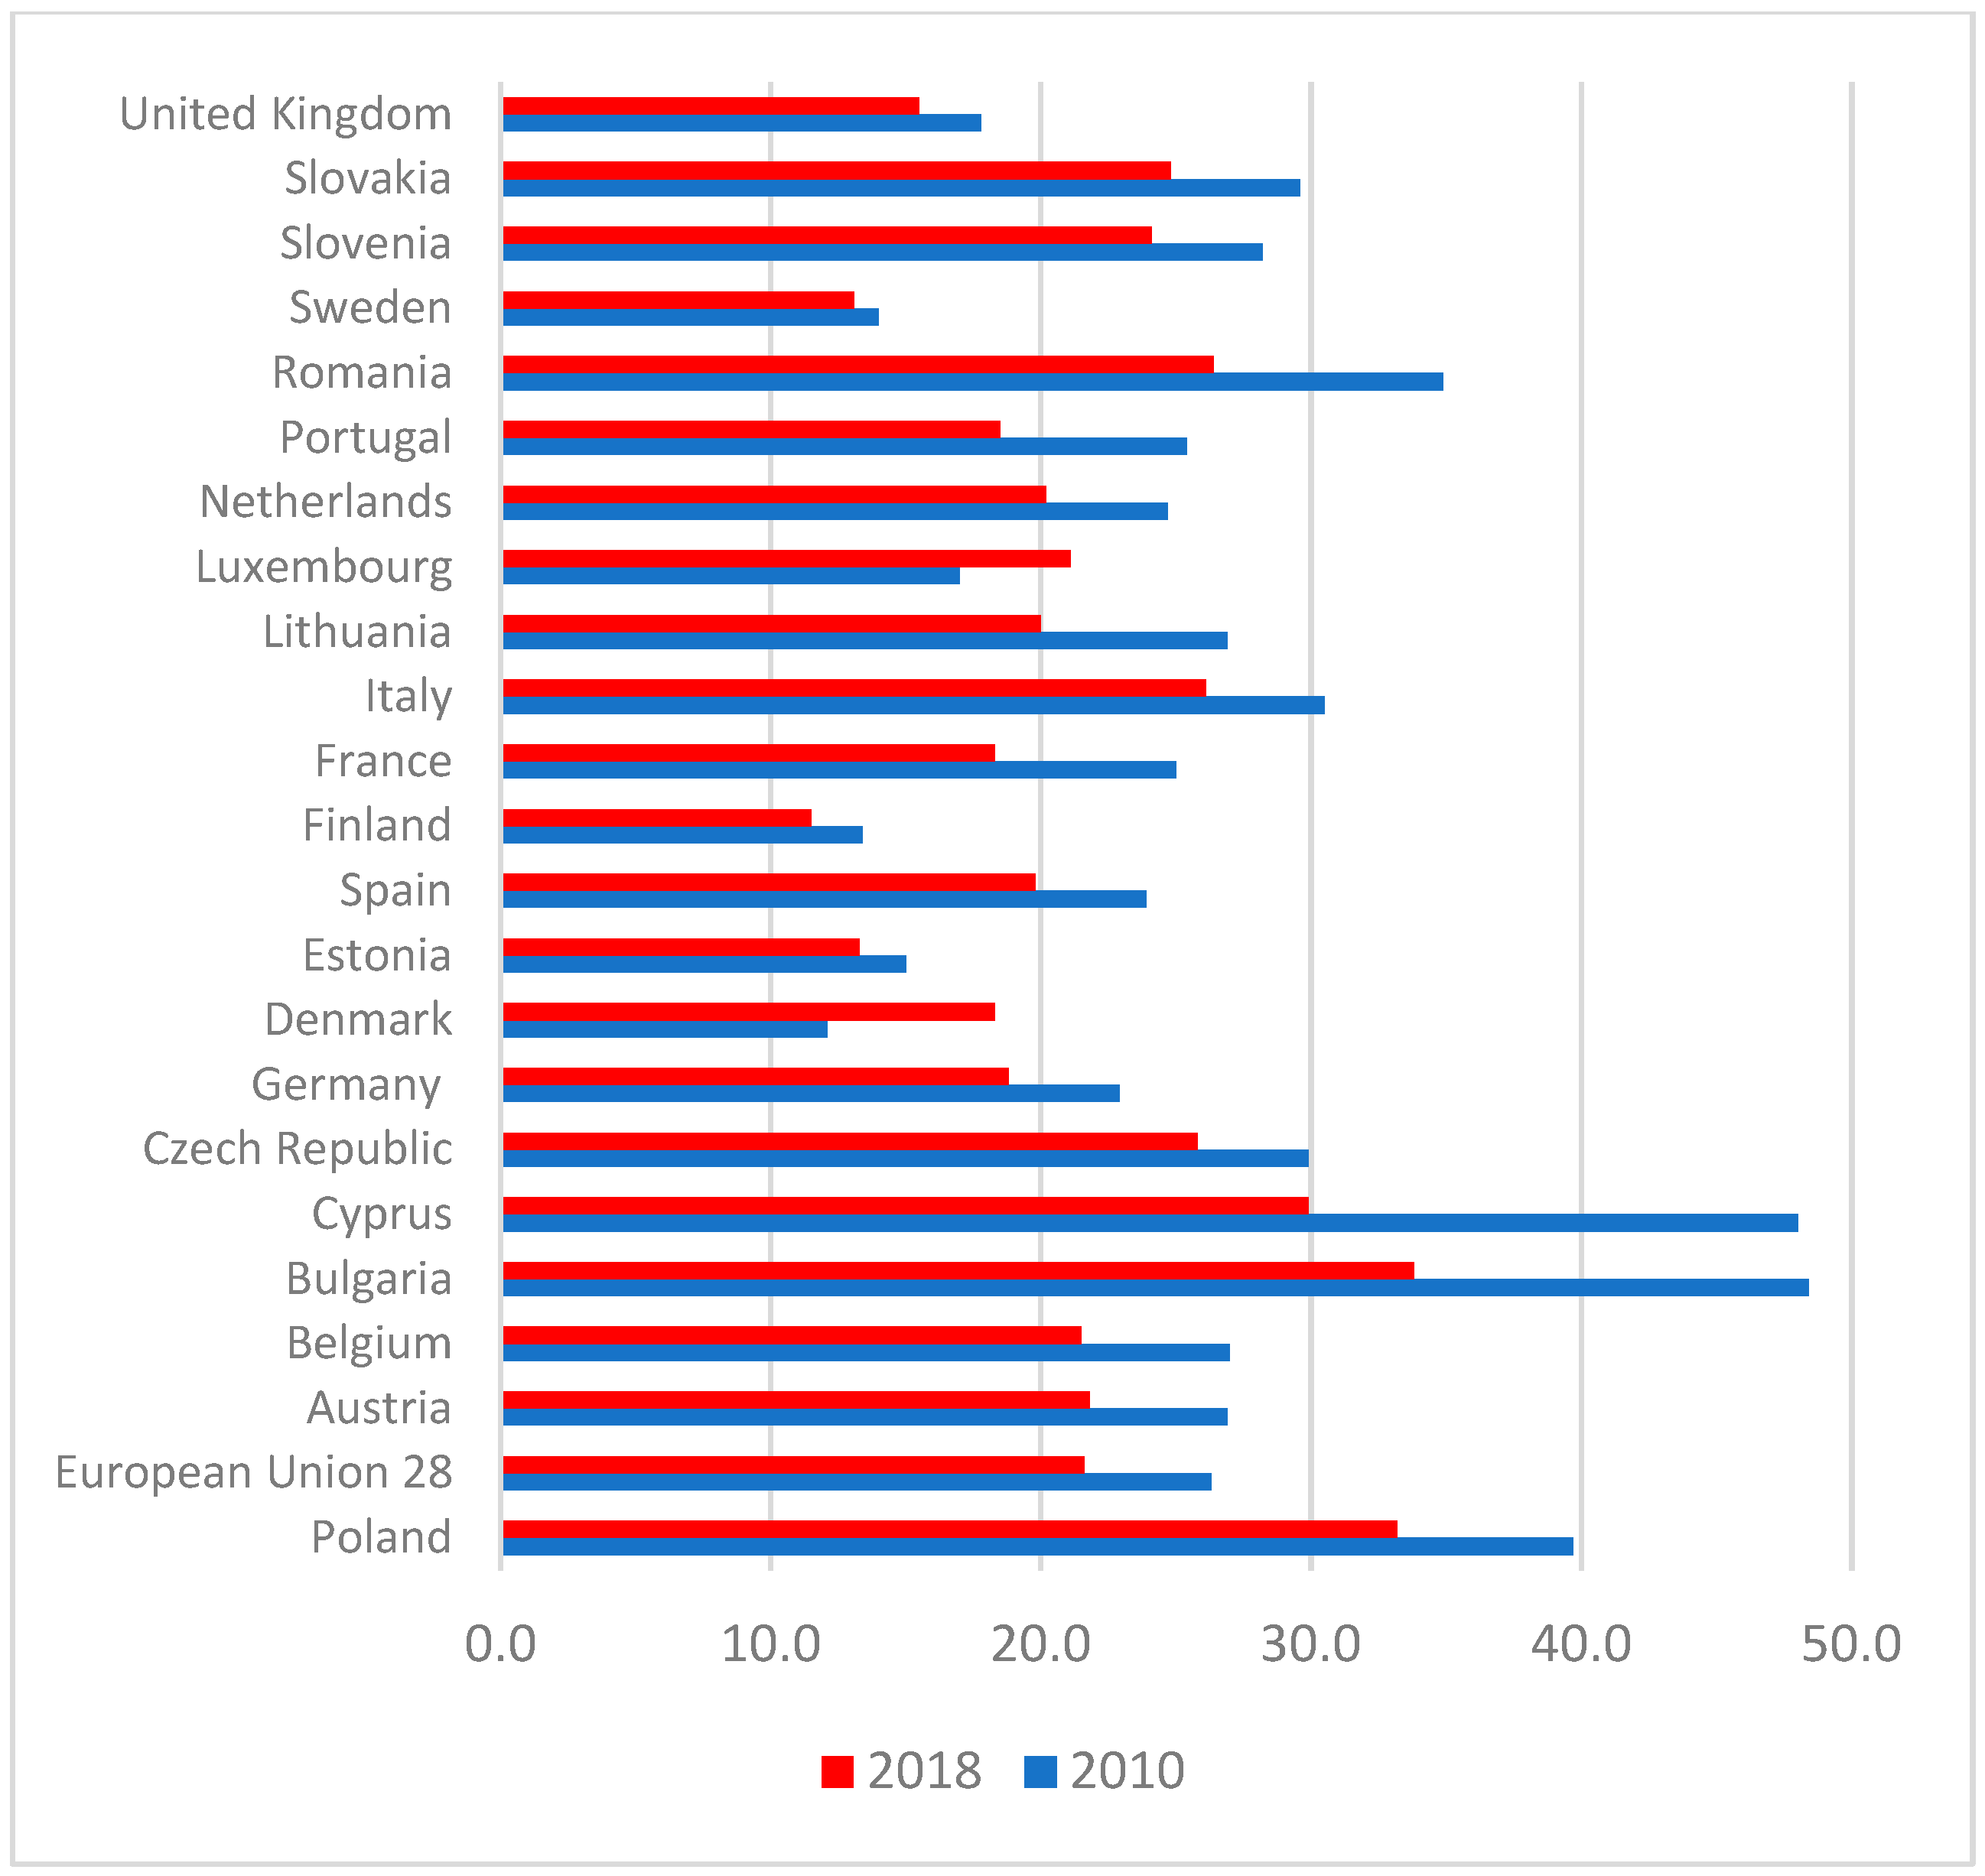
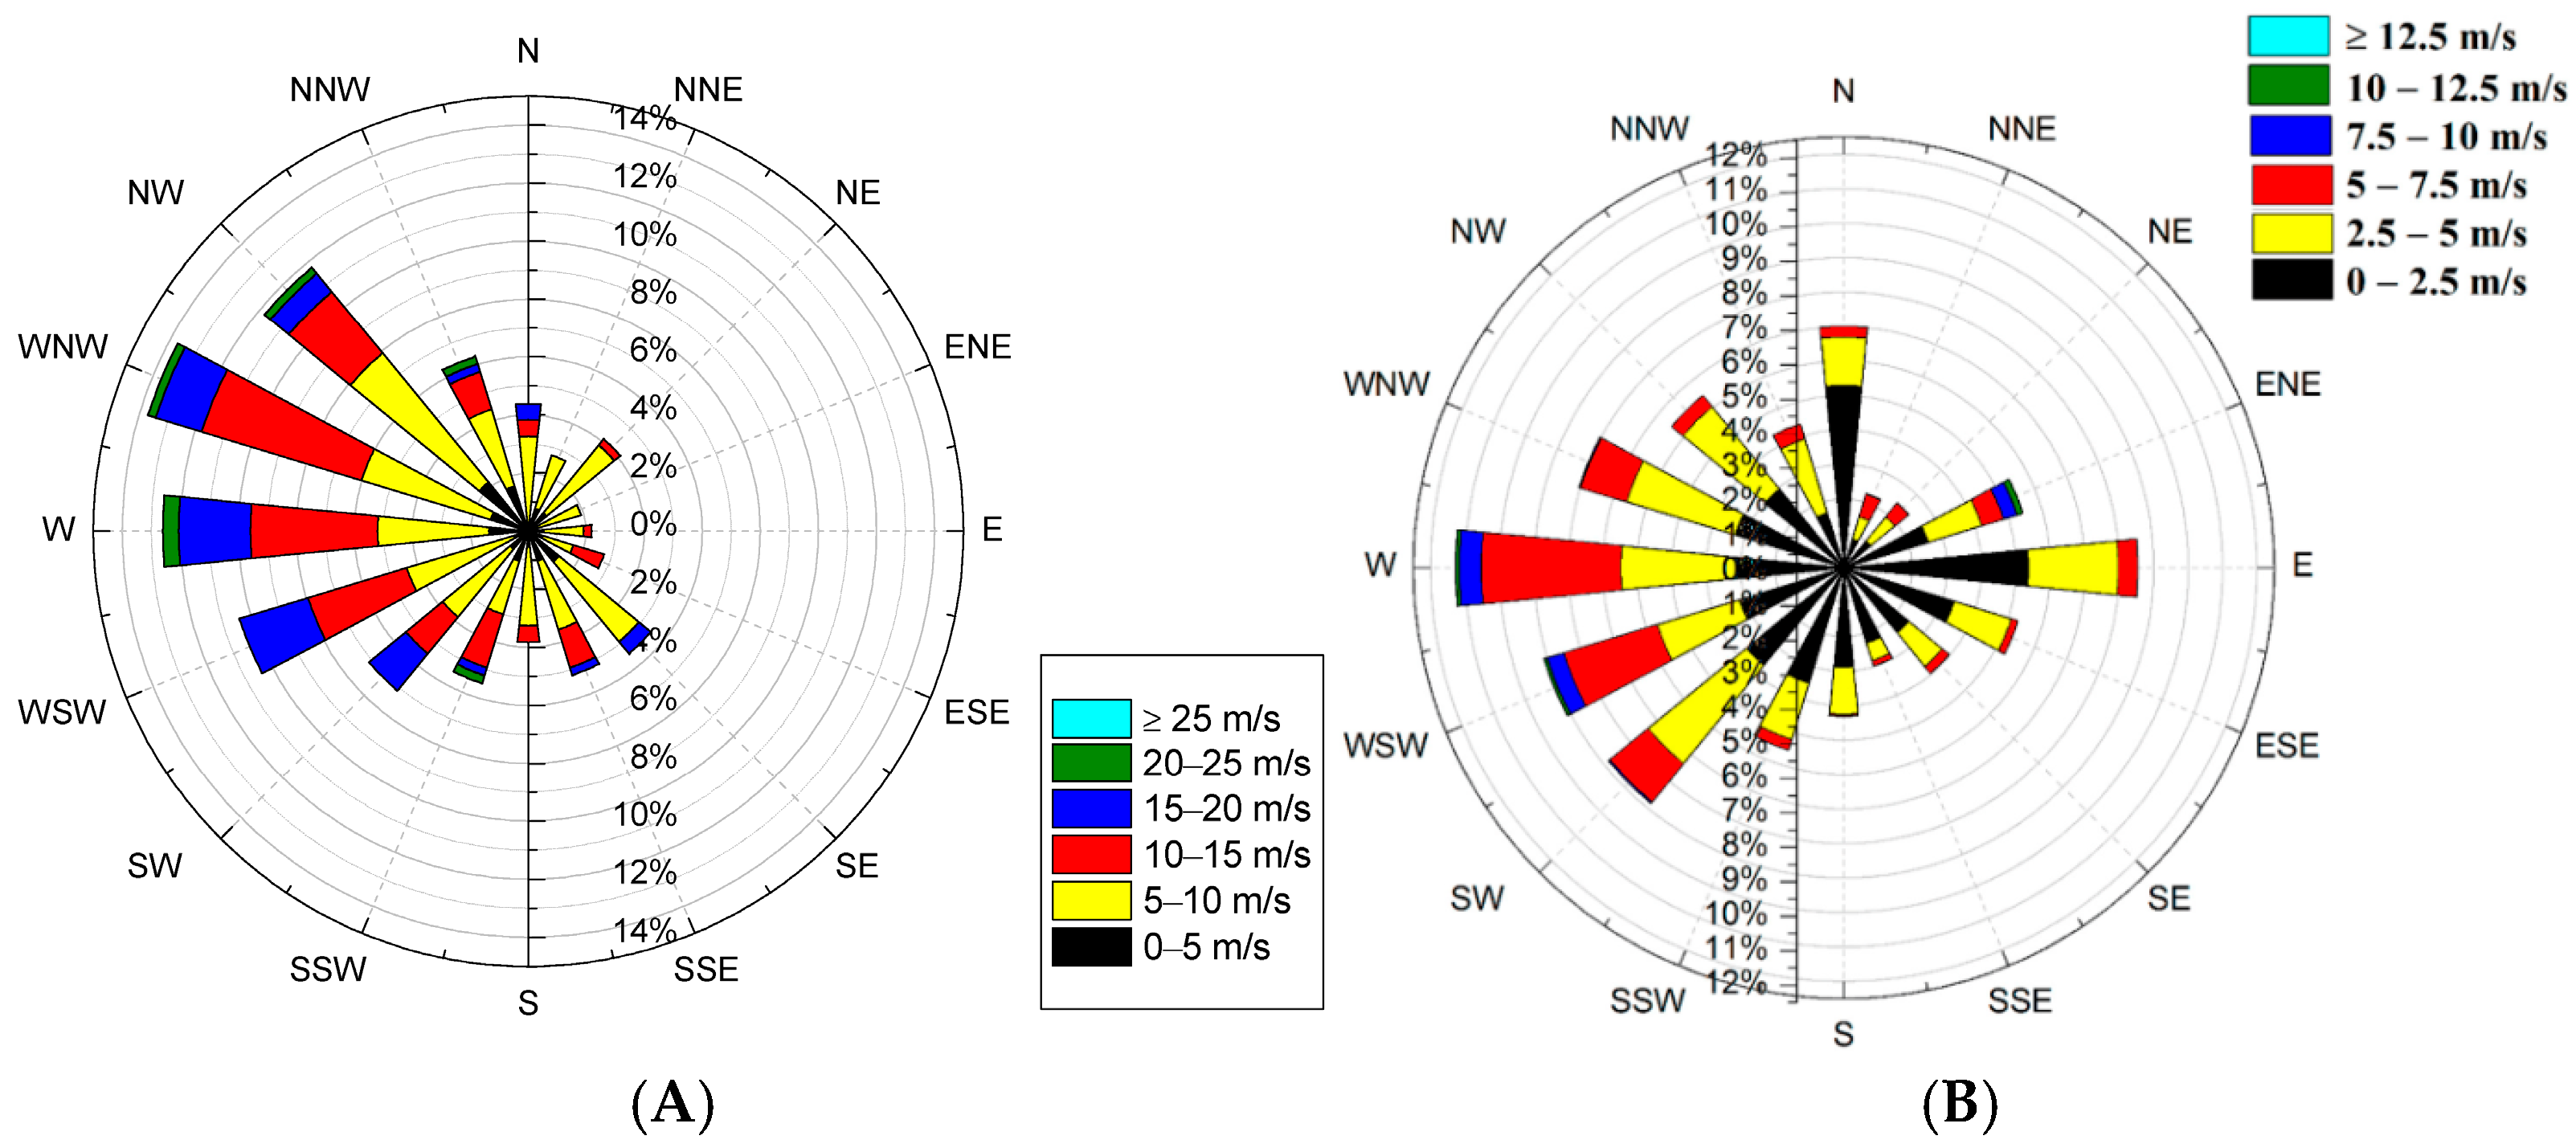
1.3. Air Pollution—Objective Dimension—Regional Perspective
- Good: Levels of fine particulate matter that do not exceed the annual limit of 5 μg/m3;
- Fair: Levels above 5 and not exceeding 10 μg/m3;
- Moderate: Levels above 10 and not exceeding 15 μg/m3;
- Poor: Levels above 15 and not exceeding 25 μg/m3;
- Very poor: Levels at and above the European Union limit value of 25 μg/m3
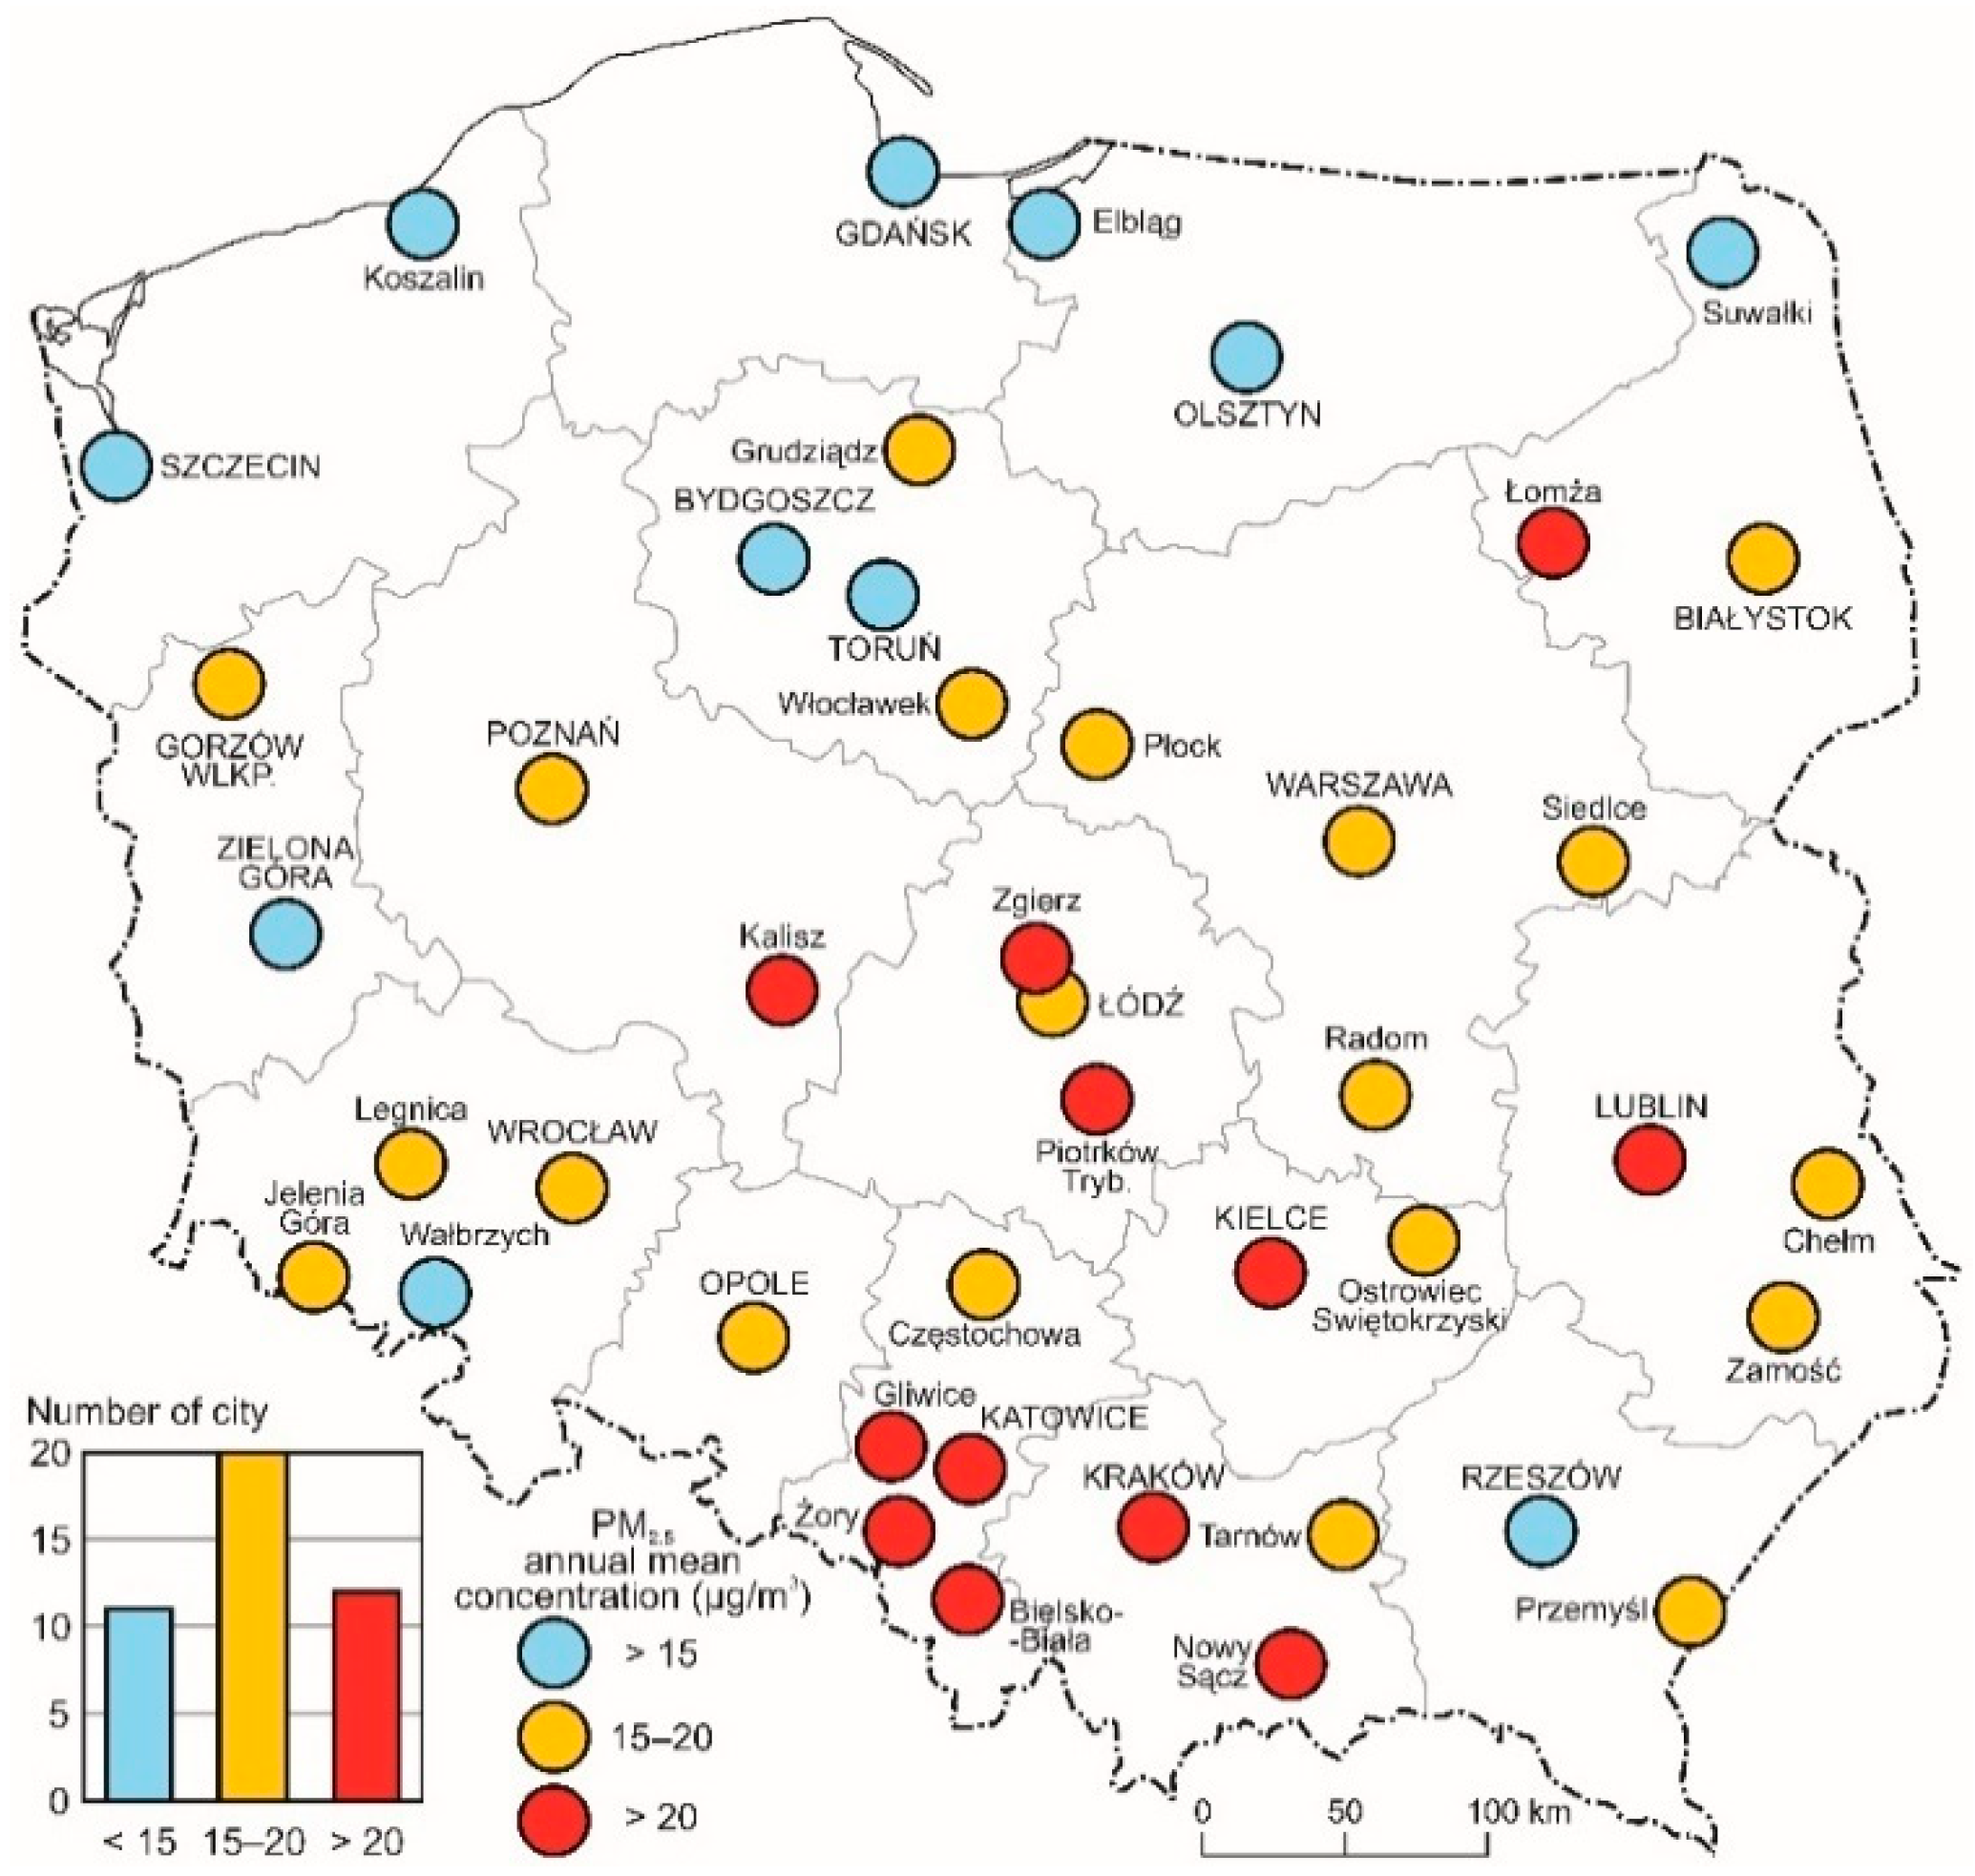
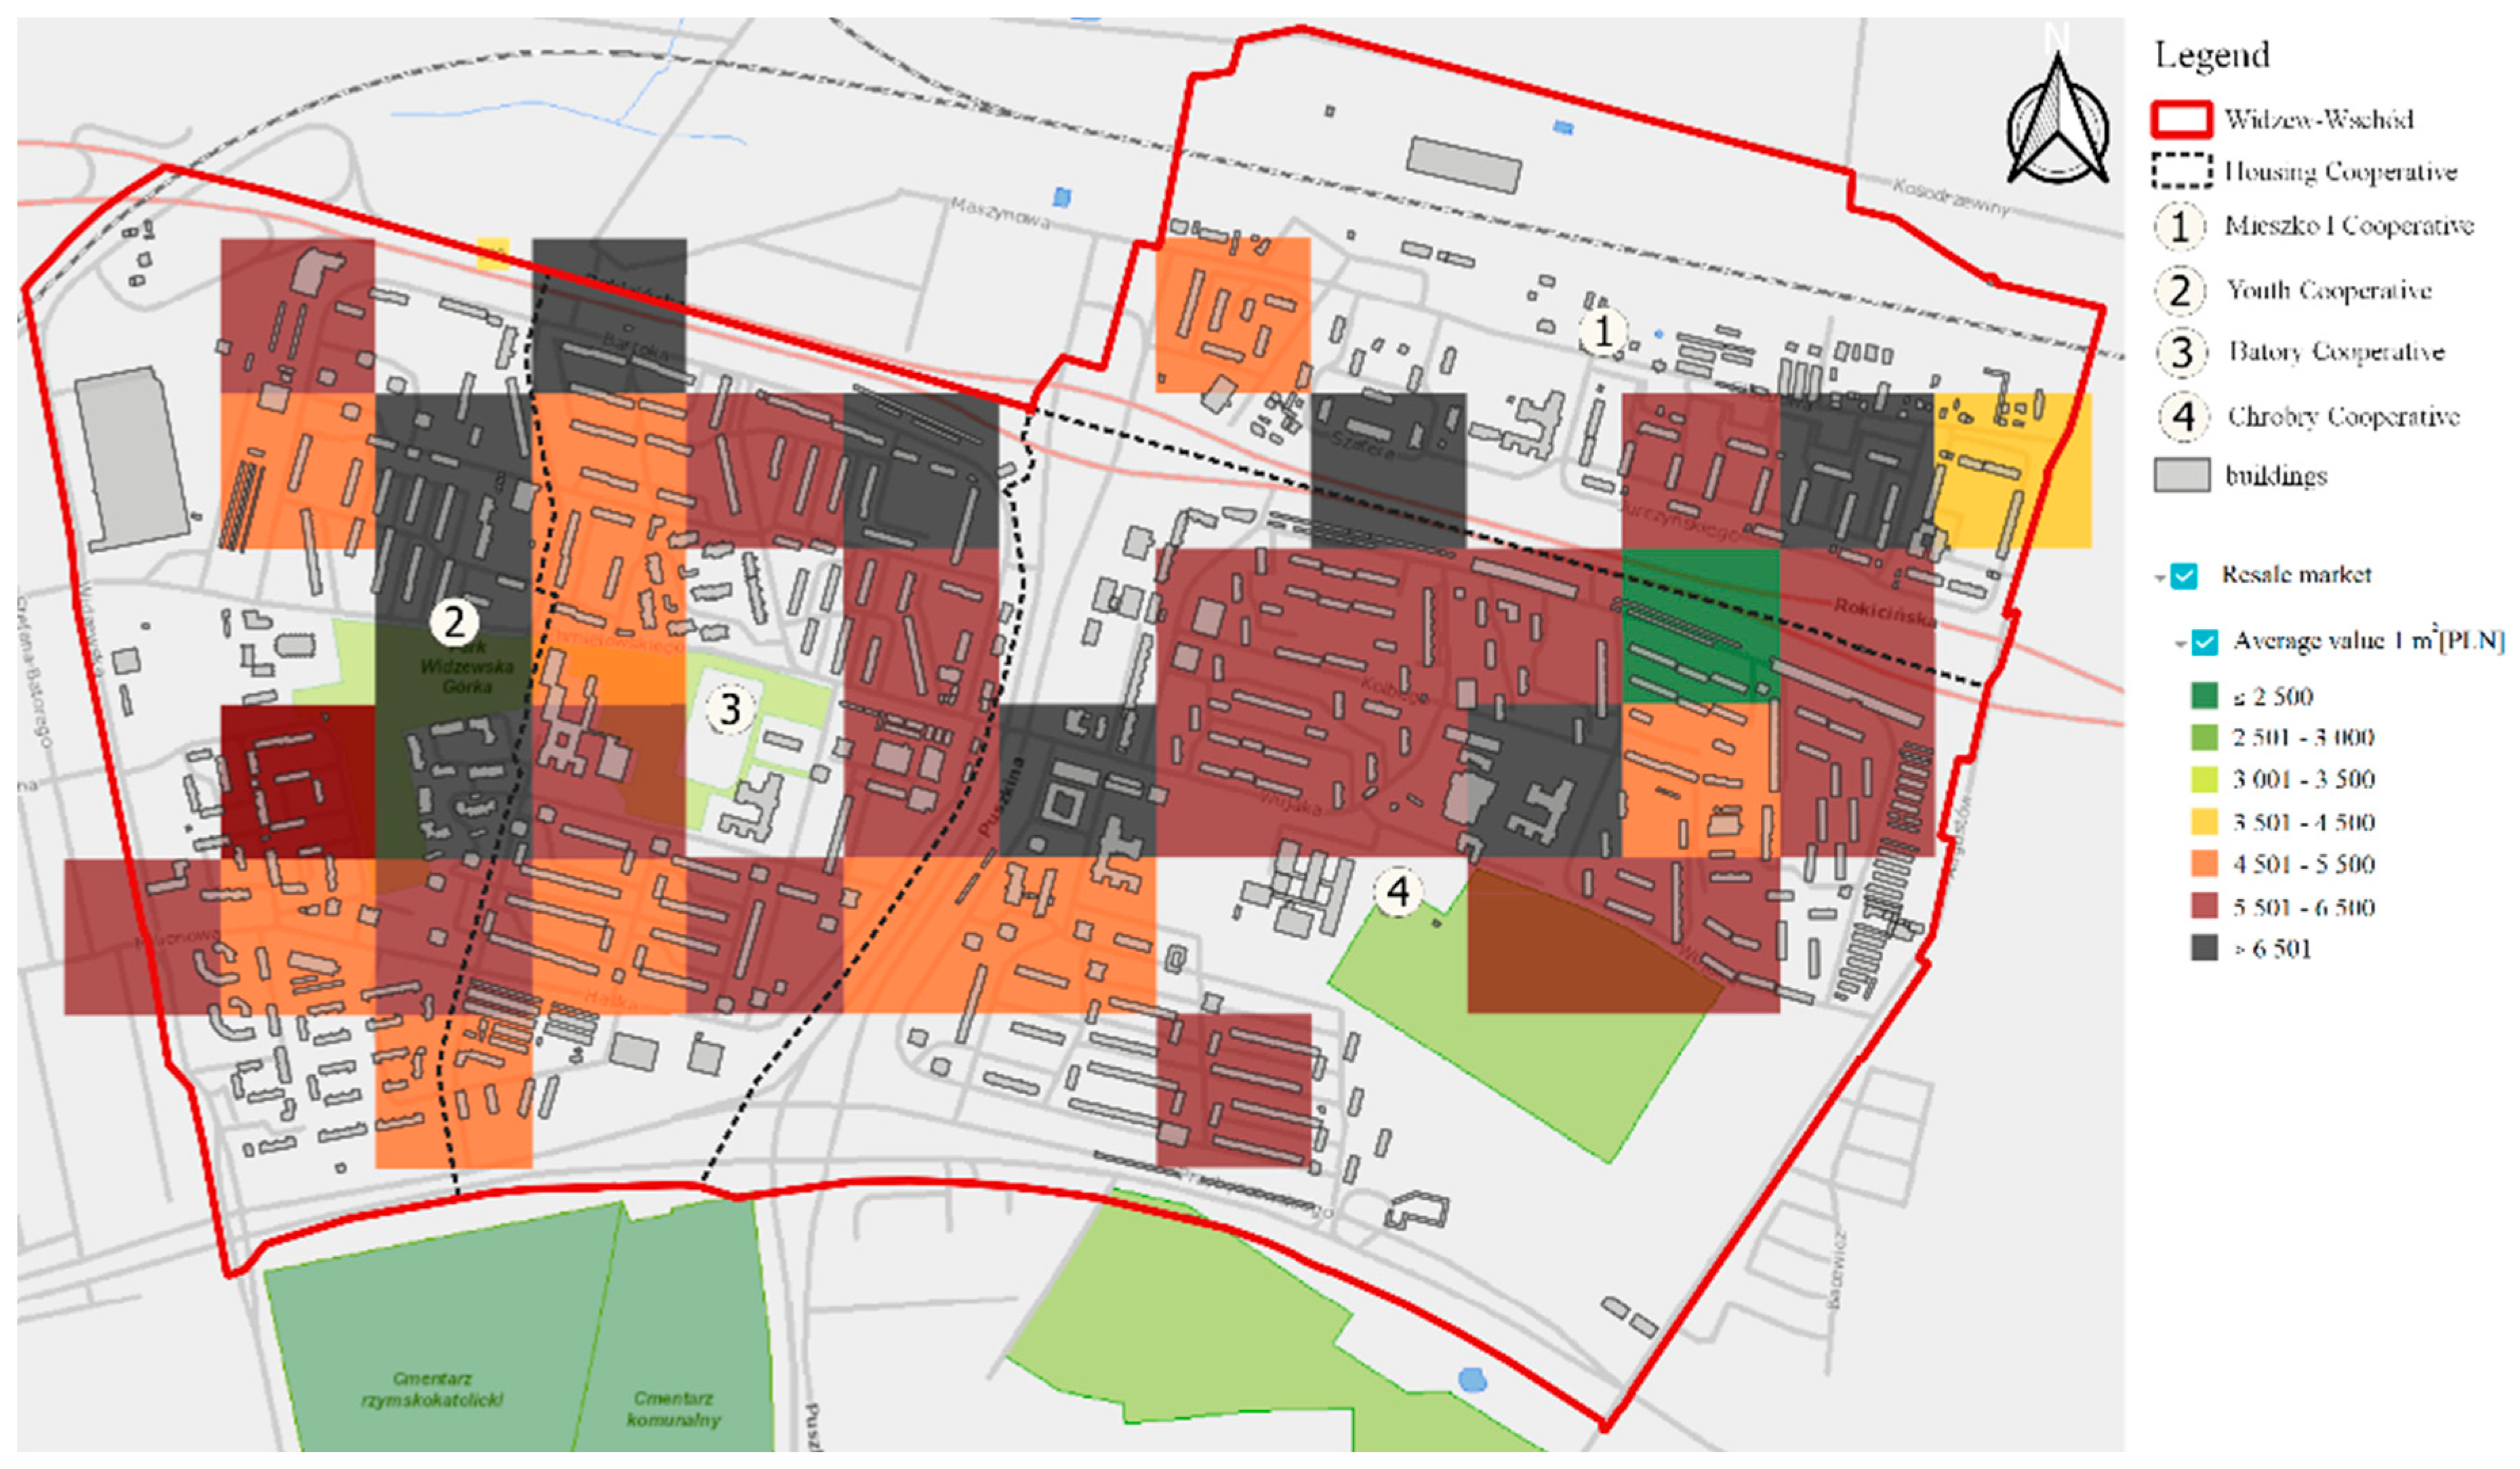
2. Analyzed Area and Air Pollution
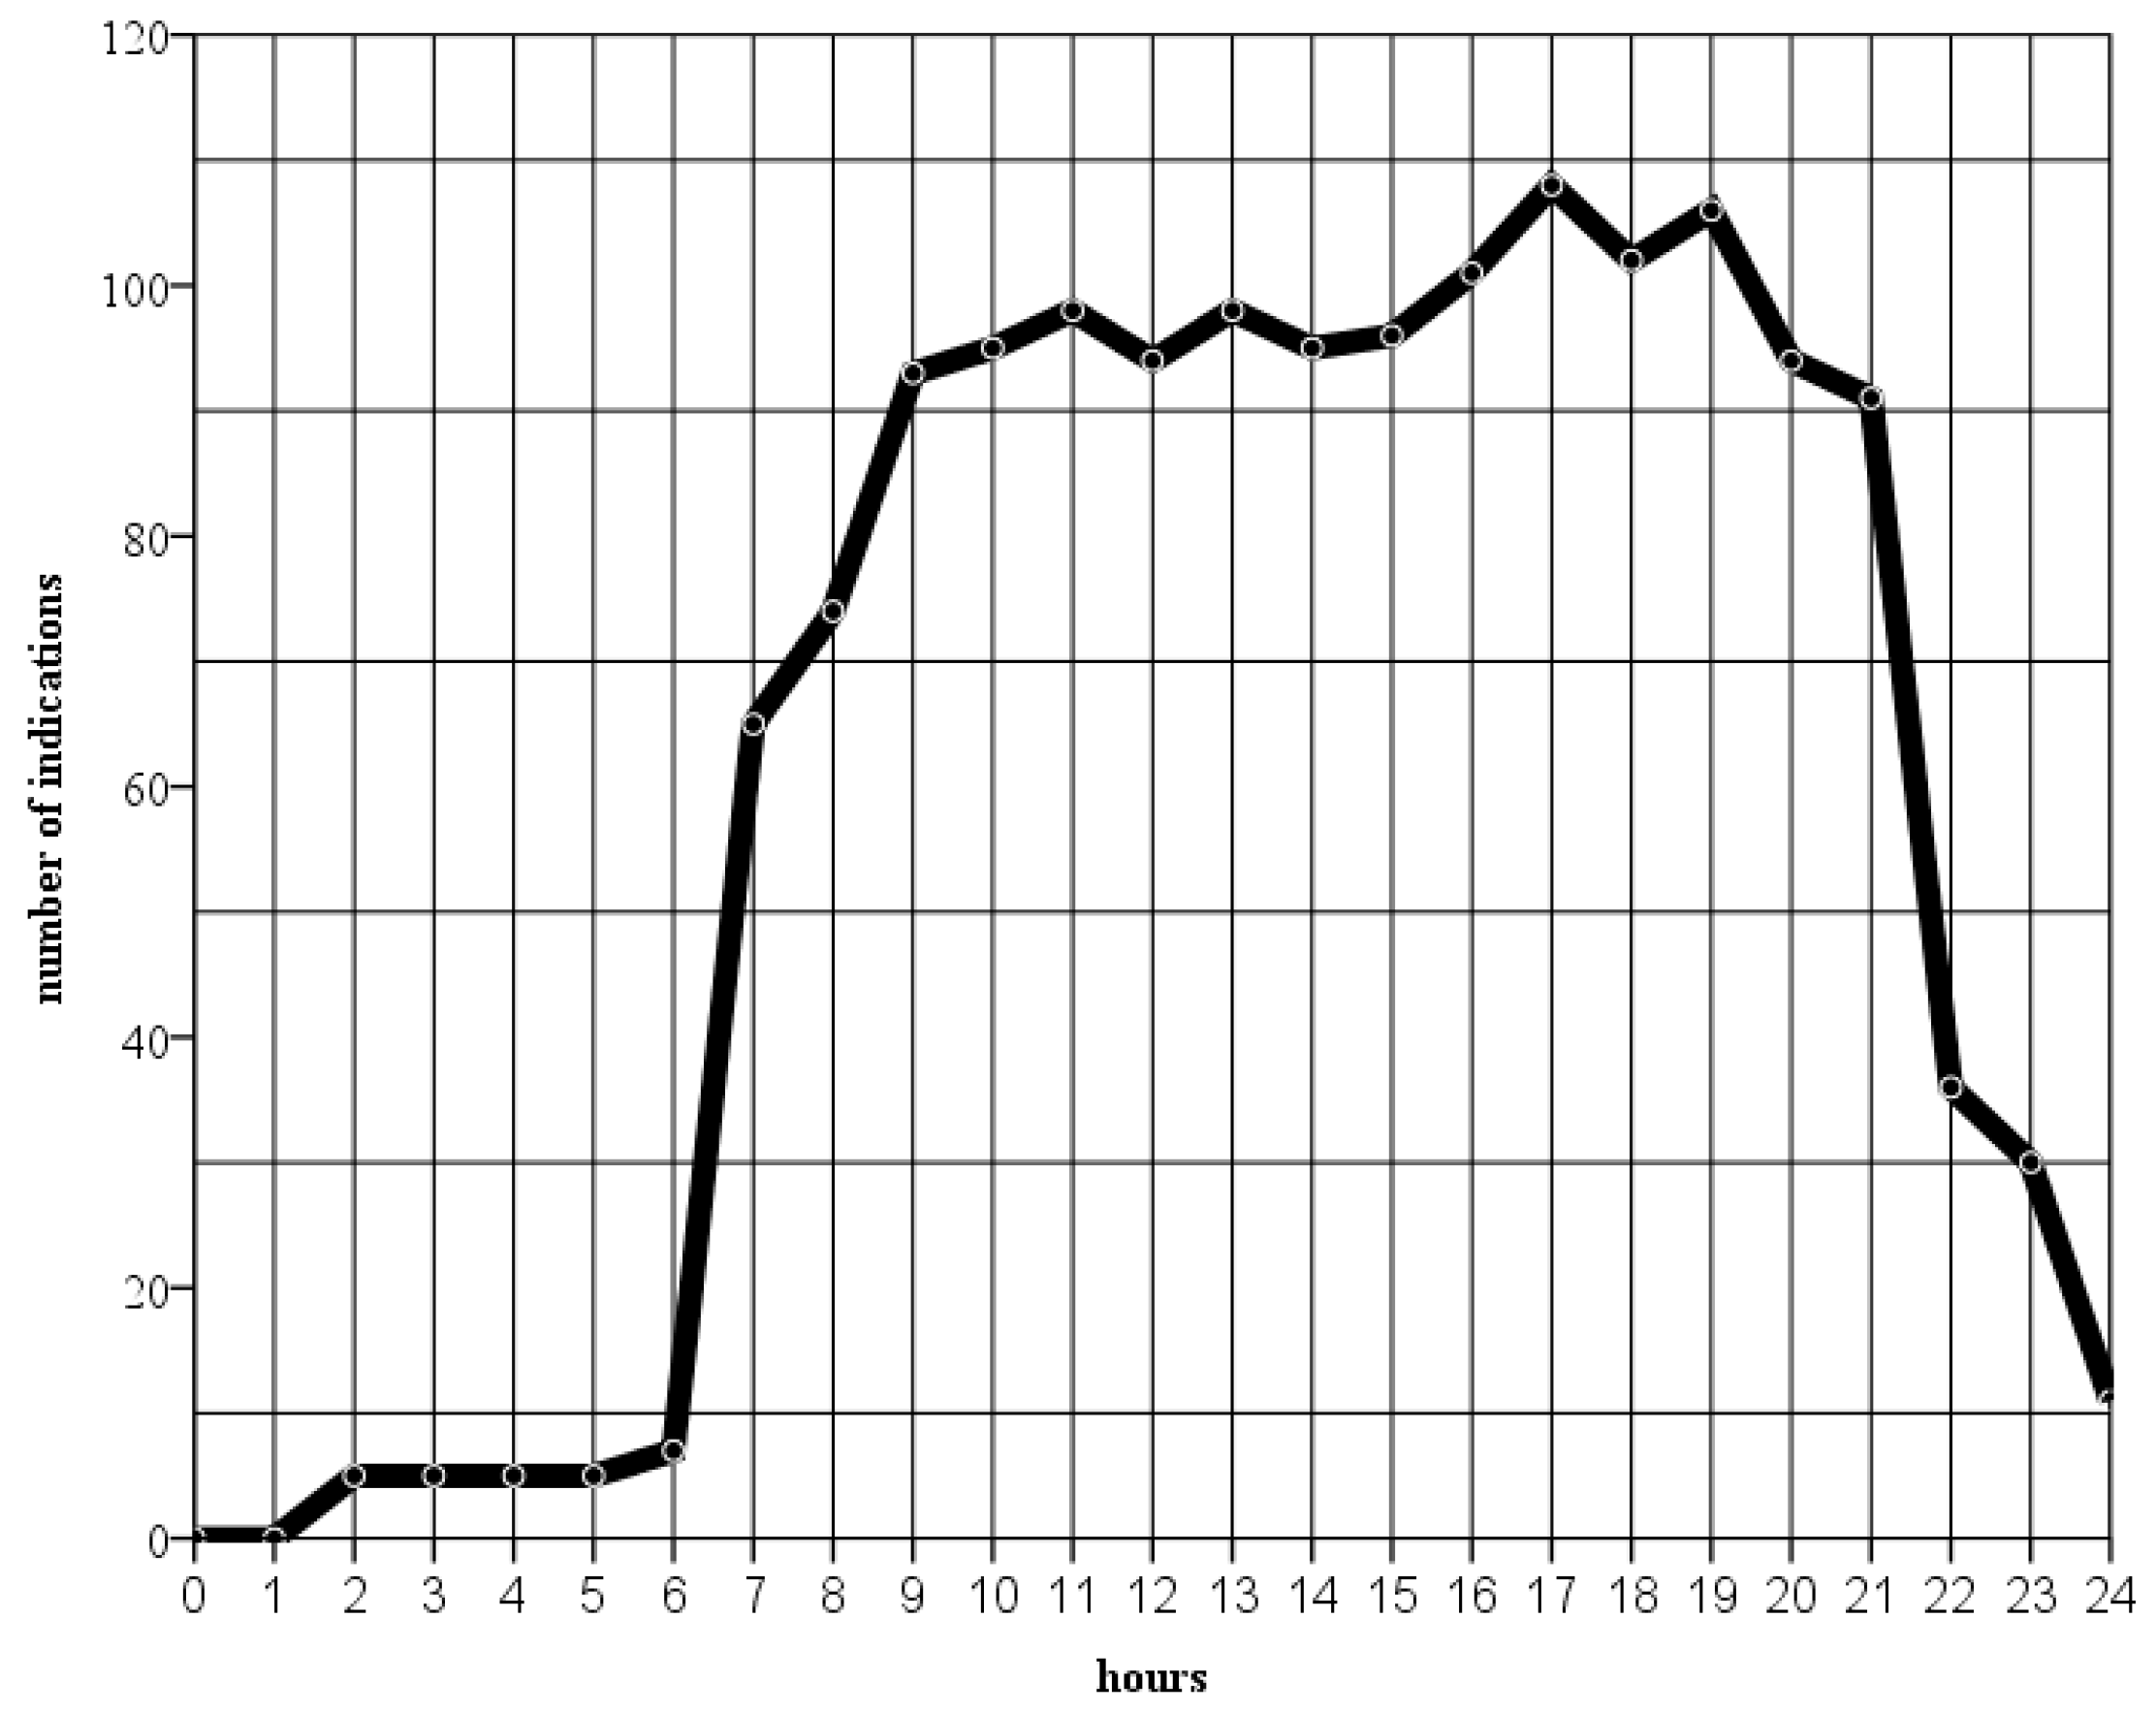
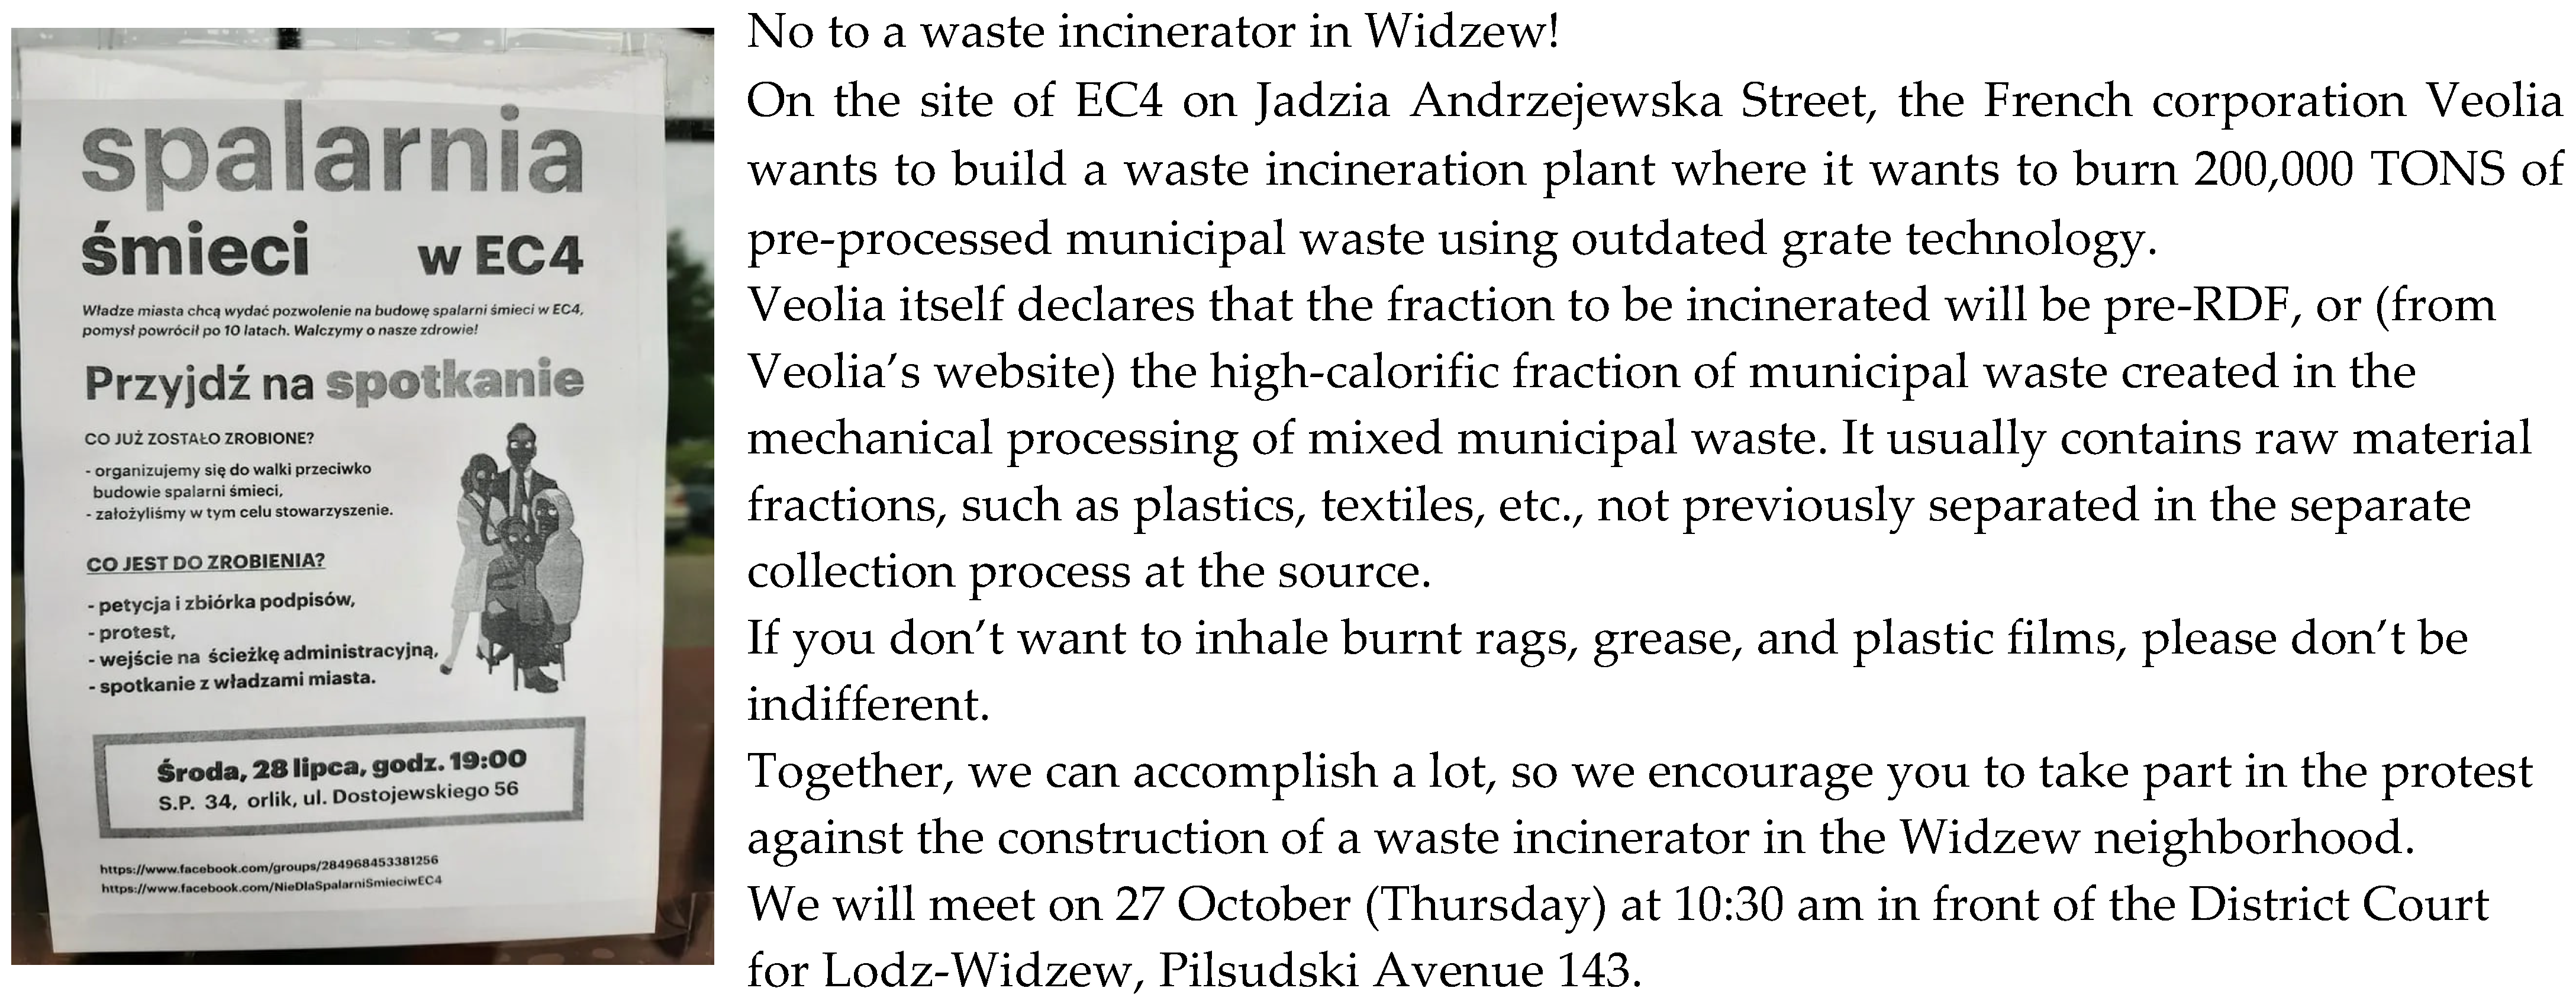
3. Results and Discussion
- “When I lived in Starowa Gora, everywhere was far away. Here everything is within walking distance. It’s such a city within a city”.
- “Air? Here I feel that it is excellent. In Starowa Gora in winter when the neighbours fired up their stoves it was impossible to go out in front of the house, such was the stench”.
- “If I could I would have the windows open all the time, only my husband is cold and closes them” (Female 33).
- “We live very well here. The park is close, the air is smog-free, even now I have a window open. I ventilate when I feel like it and don’t check any messages” (Male 78).
- “We live close to Górka Widzewska. No cars drive under the block, no one pollutes the air. It’s a long way to Rokicinska Street, it’s probably worse there”.
- “The smog used to be noticeable. When it blew over these houses from the city side, you could feel that people were burning whatever they wanted. But that was only in the winter. Now I don’t feel it anymore”.
- “I don’t see a connection between the air quality here and the CHP plant” (Female 52).
- “I moved here from the center, as the conditions are better—I only have further to go school. I did not think about (the quality of) the air. It seems to me that it is better here, though. Just the fact that there is not so much car traffic directly under the windows” (Female 22).
4. Conclusions
Author Contributions
Funding
Institutional Review Board Statement
Informed Consent Statement
Data Availability Statement
Conflicts of Interest
References
- Brookfield, H.C. On the Environment as Perceived. In Progress in Geography 1; Hodder Education: London, UK, 1969; pp. 51–80. [Google Scholar]
- Pocock, D.C.D. Urban Environmental Perception and Behaviour. Tijdschr. Voor Econ. En Soc. Geografie 1971, 62, 321–326. [Google Scholar] [CrossRef]
- Demeritt, D. What is the ‘social construction of nature’? A typology and sympathetic critique. Prog. Hum. Geogr. 2002, 26, 767–790. [Google Scholar] [CrossRef]
- Bahrami, Z.; Sato, S.; Yang, Z.; Maiti, M.; Kanawat, P.; Umemura, T.; Onishi, K.; Terasaki, H.; Nakayama, T.; Matsumi, Y.; et al. The perception of air pollution and its health risk: A scoping review of measures and methods. Glob. Health Action 2024, 17, 2370100. [Google Scholar] [CrossRef] [PubMed]
- Cori, L.; Donzelli, G.; Gorini, F.; Bianchi, F.; Curzio, O. Risk Perception of Air Pollution: A Systematic Review Focused on Particulate Matter Exposure. Int. J. Environ. Res. Public Health 2020, 17, 6424. [Google Scholar] [CrossRef] [PubMed]
- Campbell, D.T.; Fiske, D.W. Convergent and discriminant validation by the multitrait-multimethod matrix. Psychol. Bull. 1959, 56, 81–105. [Google Scholar] [CrossRef] [PubMed]
- Denzin, N.K. The Research Act, 2nd ed.; McGraw-Hill: New York, NY, USA, 1978. [Google Scholar]
- Chomczyński, P.; Konecki, K.T. Słownik Socjologii Jakościowej; Difin: Warszawa, Poland, 2012. [Google Scholar]
- Mazurek-Łopacińska, K.; Sobocińska, M. Triangulacja w Badaniach Jakościowych; Prace Naukowe Uniwersytetu Ekonomicznego we Wrocławiu nr 525/2018, Uniwersytet Ekonomiczny we Wrocławiu, s.: Wrocław, Poland, 2018; pp. 11–20. [Google Scholar]
- Glaser, B.; Strauss, A. The Discovery of Grounded Theory: Strategies for Qualitative Research; Sociology Press: Mill Valley, CA, USA, 1967. [Google Scholar]
- Glaser, B. Basics of Grounded Theory Analysis; Sociology Press: Mill Valley, CA, USA, 1992. [Google Scholar]
- Said Pace, D. Probability and Non-Probability Sampling—An Entry Point for Undergraduate Researchers. Int. J. Quant. Qual. Res. Methods 2021, 9, 1–15. [Google Scholar]
- Lehdonvirta, V.; Atte, O.; Räsänen, P.; Blank, G. Using Non-Probability Samples in Policy Research, Policy and the Internet. Int. J. Quant. Qual. Res. Methods 2021, 9, 1–15. [Google Scholar]
- Witaszek, Z. Miejsce i rola sondaży w badaniu opinii społecznej. Zesz. Nauk. Akad. Mar. Wojennej Rok XLVIII 2007, 171, 141–162. [Google Scholar]
- Murray, C.J.L.; Aravkin, A.Y.; Zheng, P.; Abbafati, C.; Abbas, K.M.; Abbasi-Kangevari, M.; Abd-Allah, F.; Abdelalim, A.; Abdollahi, M.; Abdollahpour, I.; et al. Global burden of 87 risk factors in 204 countries andterritories, 1990–2019. Lancet 2020, 396, 1223–1249. [Google Scholar] [CrossRef] [PubMed]
- WHO. Air Quality Guidelines 2021. Available online: https://www.who.int/publications/i/item/9789240034228 (accessed on 12 April 2024).
- WHO. Air Quality Guidelines—Global Update. 2005. Available online: https://iris.who.int/bitstream/handle/10665/107823/9789289021920-eng.pdf?sequence=1 (accessed on 12 April 2024).
- WHO. 2021. Available online: https://www.who.int/news-room/feature-stories/detail/what-are-the-who-air-quality-guidelines (accessed on 12 April 2024).
- Official Journal of the EU L 152 of 11.06.2008, p.1. Available online: https://eur-lex.europa.eu/legal-content/EN/TXT/PDF/?uri=OJ:L:2008:152:FULL (accessed on 3 February 2024).
- Official Journal of the EU L 23 of 26.01.2005, p.3. Available online: https://eur-lex.europa.eu/legal-content/EN/TXT/?uri=oj:JOL_2005_023_R_TOC (accessed on 3 February 2024).
- WHO. Ambiet (Outdoor) Air Pollution Database 2018. Available online: https://www.who.int/data/gho/data/themes/air-pollution/who-air-quality-database/2018 (accessed on 12 April 2024).
- Poland on the Path of Sustainable Development Report 2020, GUS. Available online: https://raportsdg.stat.gov.pl/2020/cel11.html (accessed on 2 December 2023).
- Directive 2008/50/EC of the European Parliament and of the Council of 21 May 2008 on Ambient Air Quality and Cleaner Air for Europe (Dz. Urz. UE L 152 z 11.06.2008); Official Journal of the European Union: Luxembourg, 2008; Available online: https://eur-lex.europa.eu/eli/dir/2008/50/oj/eng (accessed on 20 January 2024).
- European City Air Quality Viewer. Available online: https://www.eea.europa.eu/themes/air/urban-air-quality/european-city-air-quality-viewer (accessed on 20 January 2024).
- European Countries in 2020. Available online: https://www.eea.europa.eu/publications/air-quality-in-europe-2022 (accessed on 20 January 2024).
- CSO. Available online: https://stat.gov.pl/statystyka-regionalna/badania-regionalne/urban-audit-250/ (accessed on 25 November 2023).
- CSO. Basic Statistics for Cities According to Degurba Classification. Urban Audit. Available online: https://stat.gov.pl/en/regional-statistics/regional-surveys/urban-audit/ (accessed on 23 November 2023).
- The Urban Statistics Project, 2022, GUS/Eurostat. Available online: https://ec.europa.eu/eurostat/databrowser/view/URB_PERCEP__custom_3709441/default/table?lang=en (accessed on 23 November 2023).
- The Urban Statistics Project, 2012, Eurostat. Available online: https://ec.europa.eu/eurostat/databrowser/view/URB_PERCEP__custom_3709441/default/table?lang=en (accessed on 23 November 2023).
- GIOS. 2022. Available online: https://www.gov.pl/web/gios/portal-jakosc-powietrza) (accessed on 2 December 2023).
- Central Statistical Office. 2020. Available online: https://stat.gov.pl/obszary-tematyczne/warunki-zycia/dochody-wydatki-i-warunki-zycia-ludnosci/jakosc-zycia-i-kapital-spoleczny-w-polsce-wyniki-badania-spojnosci-spolecznej-2018,4,3.html (accessed on 1 December 2023).
- Statistics Poland. Quality of Life and Social Capital in Poland. Results of the Social Cohesion Survey 2018; Statistics Poland: Warszawa, Poland, 2020. Available online: https://stat.gov.pl/files/gfx/portalinformacyjny/pl/defaultaktualnosci/5486/4/3/1/jakosc_zycia_i_kapital_spoleczny_w_polsce_wyniki_badania_spojnosci_spolecznej_2018.pdf (accessed on 1 December 2023).
- Statistics Poland. In LDB—Lokal Data Bank; 2023. Available online: https://bdl.stat.gov.pl/bdl/dane/teryt/tablica (accessed on 1 December 2023).
- Kita, J.; Puś, W.; Śmiechowski, K.; Woźniak, K.P. Rozwój Łodzi przemysłowej w czasach zaborów, w J. Kita. In Rozwój Łodzi Przemysłowej t.2. Wyd; Uniwersytetu Łódzkiego: Lodz, Poland, 2023. [Google Scholar]
- Lodz w Liczbach, 2023, Urząd Miasta Łodzi. Available online: https://uml.lodz.pl/dla-biznesu/dla-inwestora/lodz-w-liczbach/ (accessed on 12 December 2023).
- Goździk, J.; Wieczorkowska, J. Rzeźba Terenu, Atlas Miasta Łodzi. 2000. Available online: http://www.mapa.lodz.pl/mapa/atlas/P-07.pdf (accessed on 12 November 2022).
- Klysik, K.; Wibig, J.; Fortuniak Rembowski, K.; Fokczyński, J.; Podstawczyńska, A. Klimat, Atlas Miasta Łodzi. 2002. Available online: http://www.mapa.lodz.pl/index.php?strona=atlas (accessed on 13 March 2024).
- Resolution on Updating and Amending the Air Protection Program and Short-Term Action Plan for the Lodz Agglomeration Zone, no XII/209/19 Poz. 655. Available online: https://dziennik.lodzkie.eu/WDU_E/2020/655/akt.pdf (accessed on 10 February 2023).
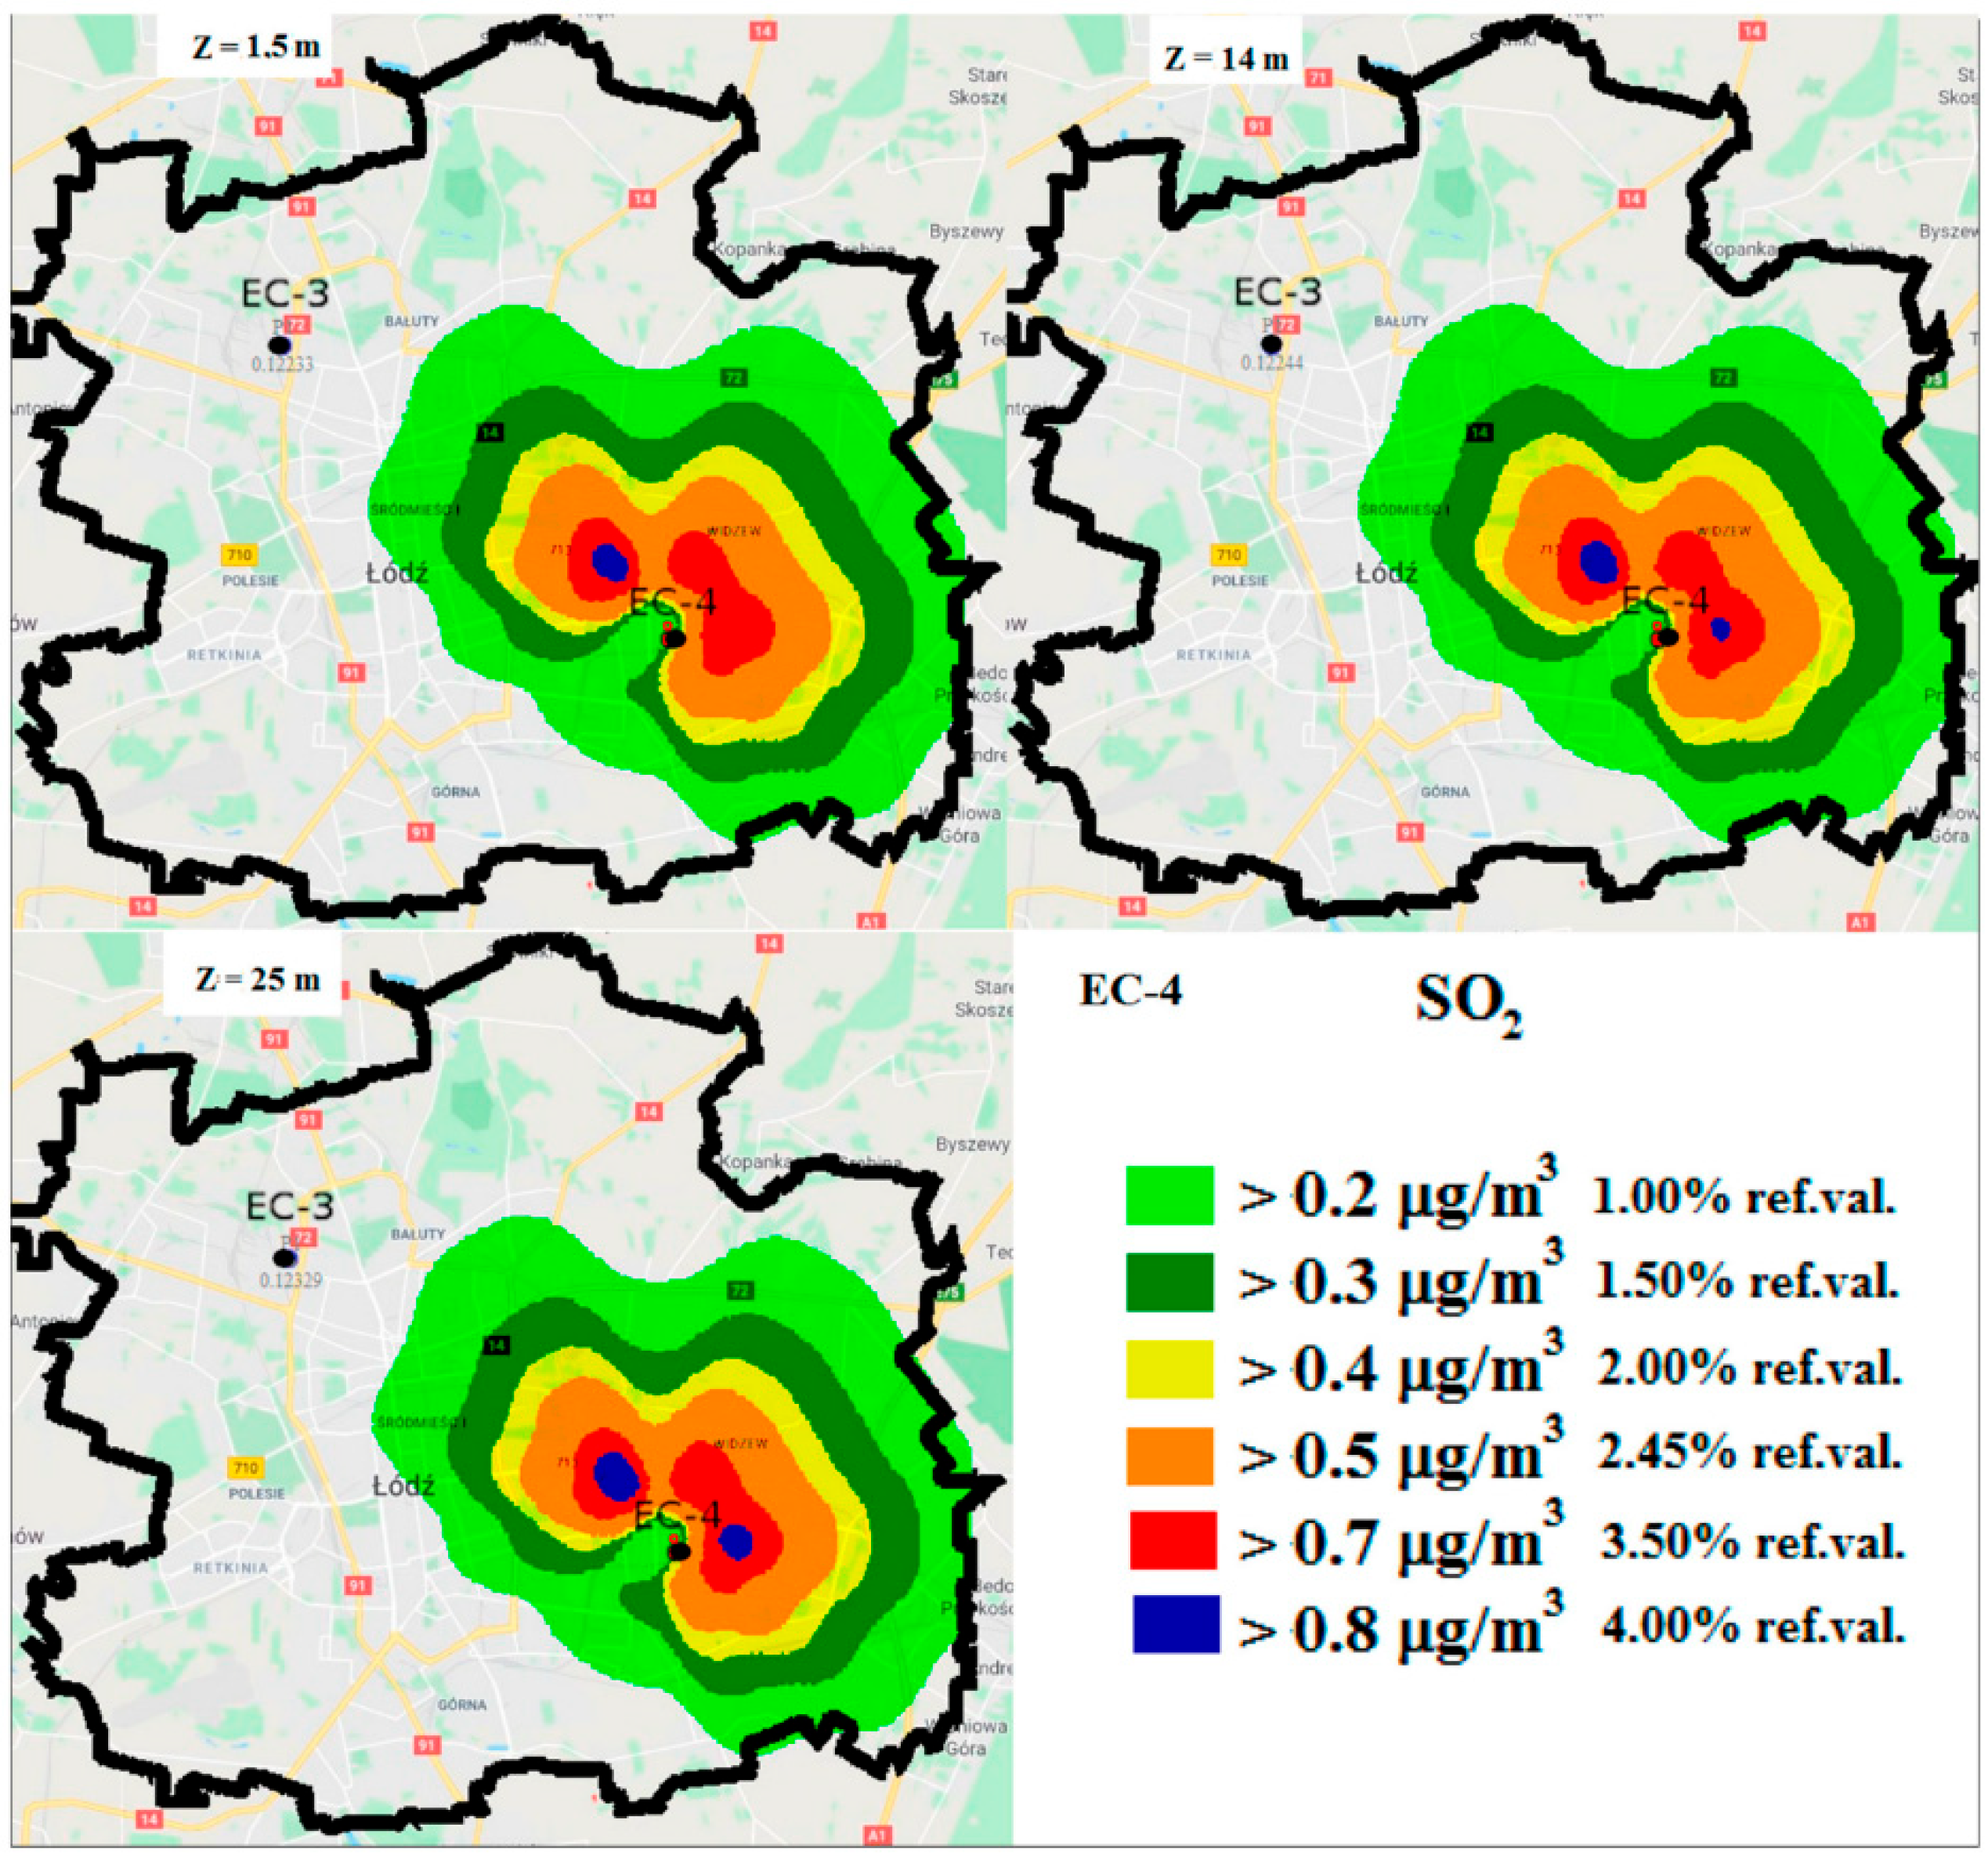
- Cichowicz, R.; Dobrzański, M. 3D Spatial Analysis of Particulate Matter (PM10, PM2.5 and PM1.0) and Gaseous Pollutants (H2S, SO2 and VOC) in Urban Areas Surrounding a Large Heat and Power Plant. Energies 2021, 14, 4070. [Google Scholar] [CrossRef]
- Cichowicz, R.; Dobrzański, M. Analysis of Air Pollution around a CHP Plant: Real Measurements vs. Computer Simulations. Energies 2022, 15, 553. [Google Scholar] [CrossRef]
- Klima, E. Przestrzeń Religijna Miasta; Wyd. Uniwersytetu Łódzkiego: Łódź, Poland, 2011. [Google Scholar]
- Fortuniak, K.; Krawczyk, E.; Wilk, S. Miejska wyspa ciepła w Łodzi w latach 2015-2018 na tle wcześniejszych badan. Przegląd Geoficzny LXVII 2022, 1–2, 3–18. [Google Scholar] [CrossRef]
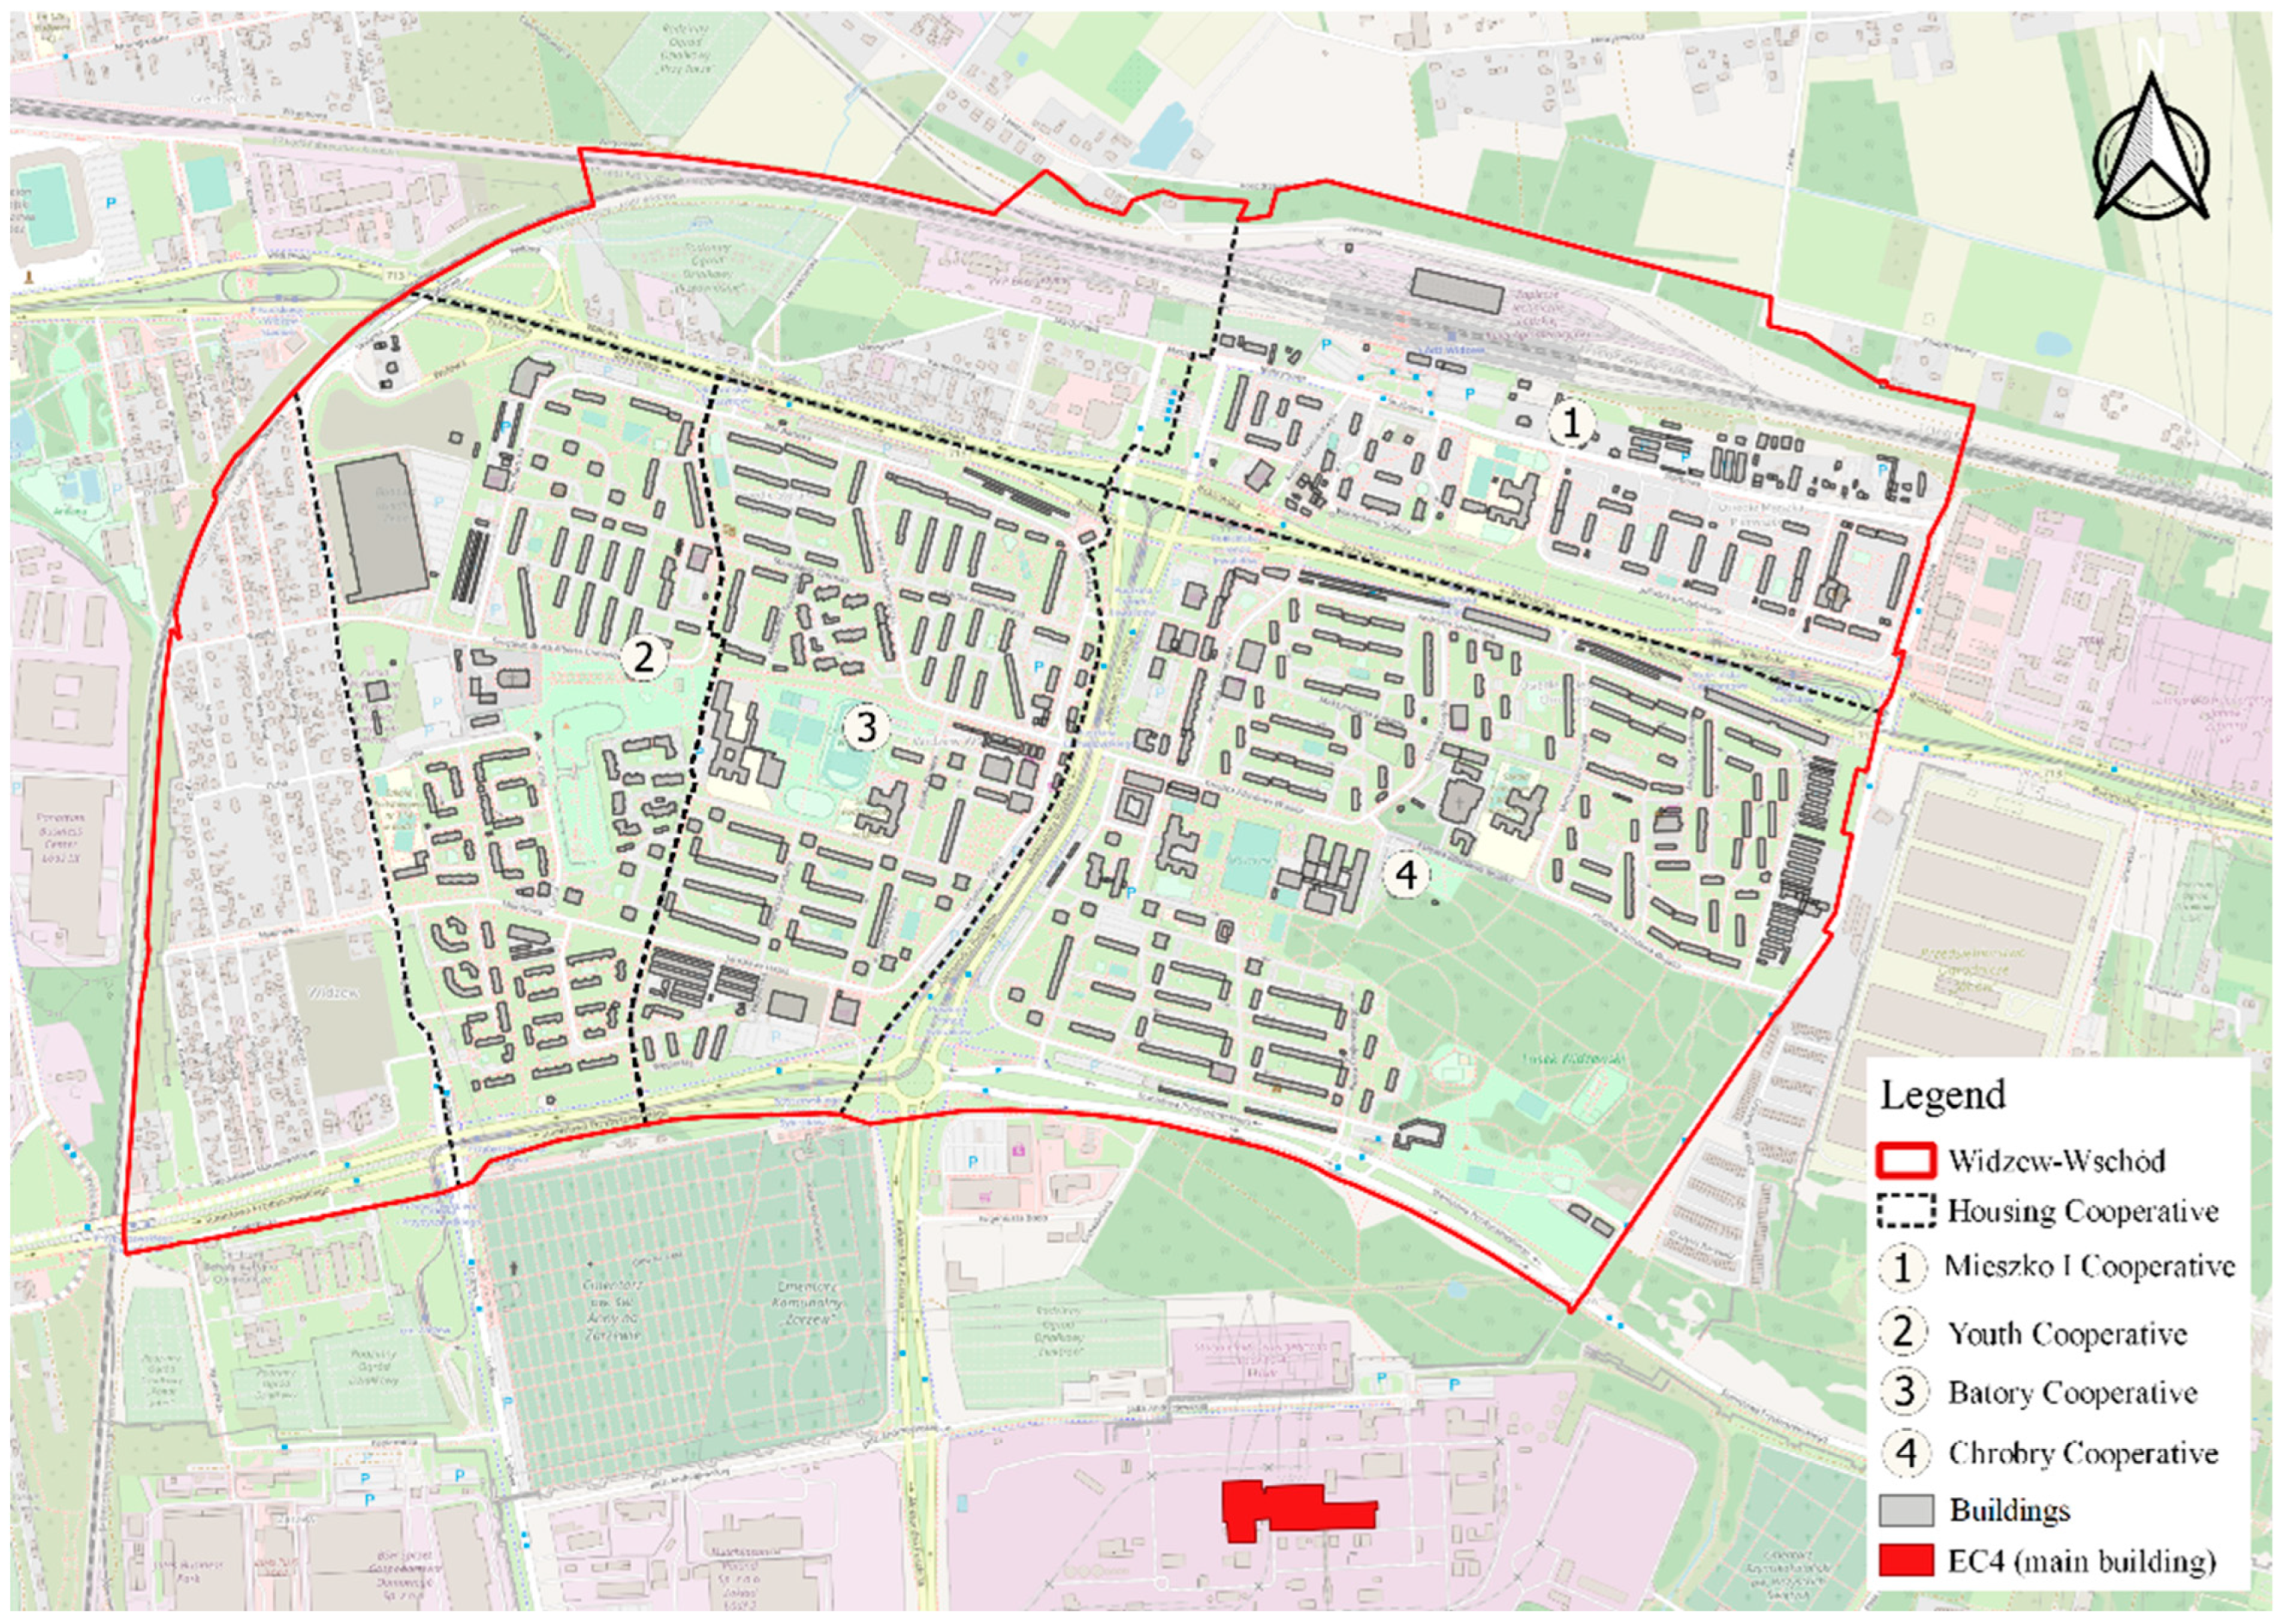
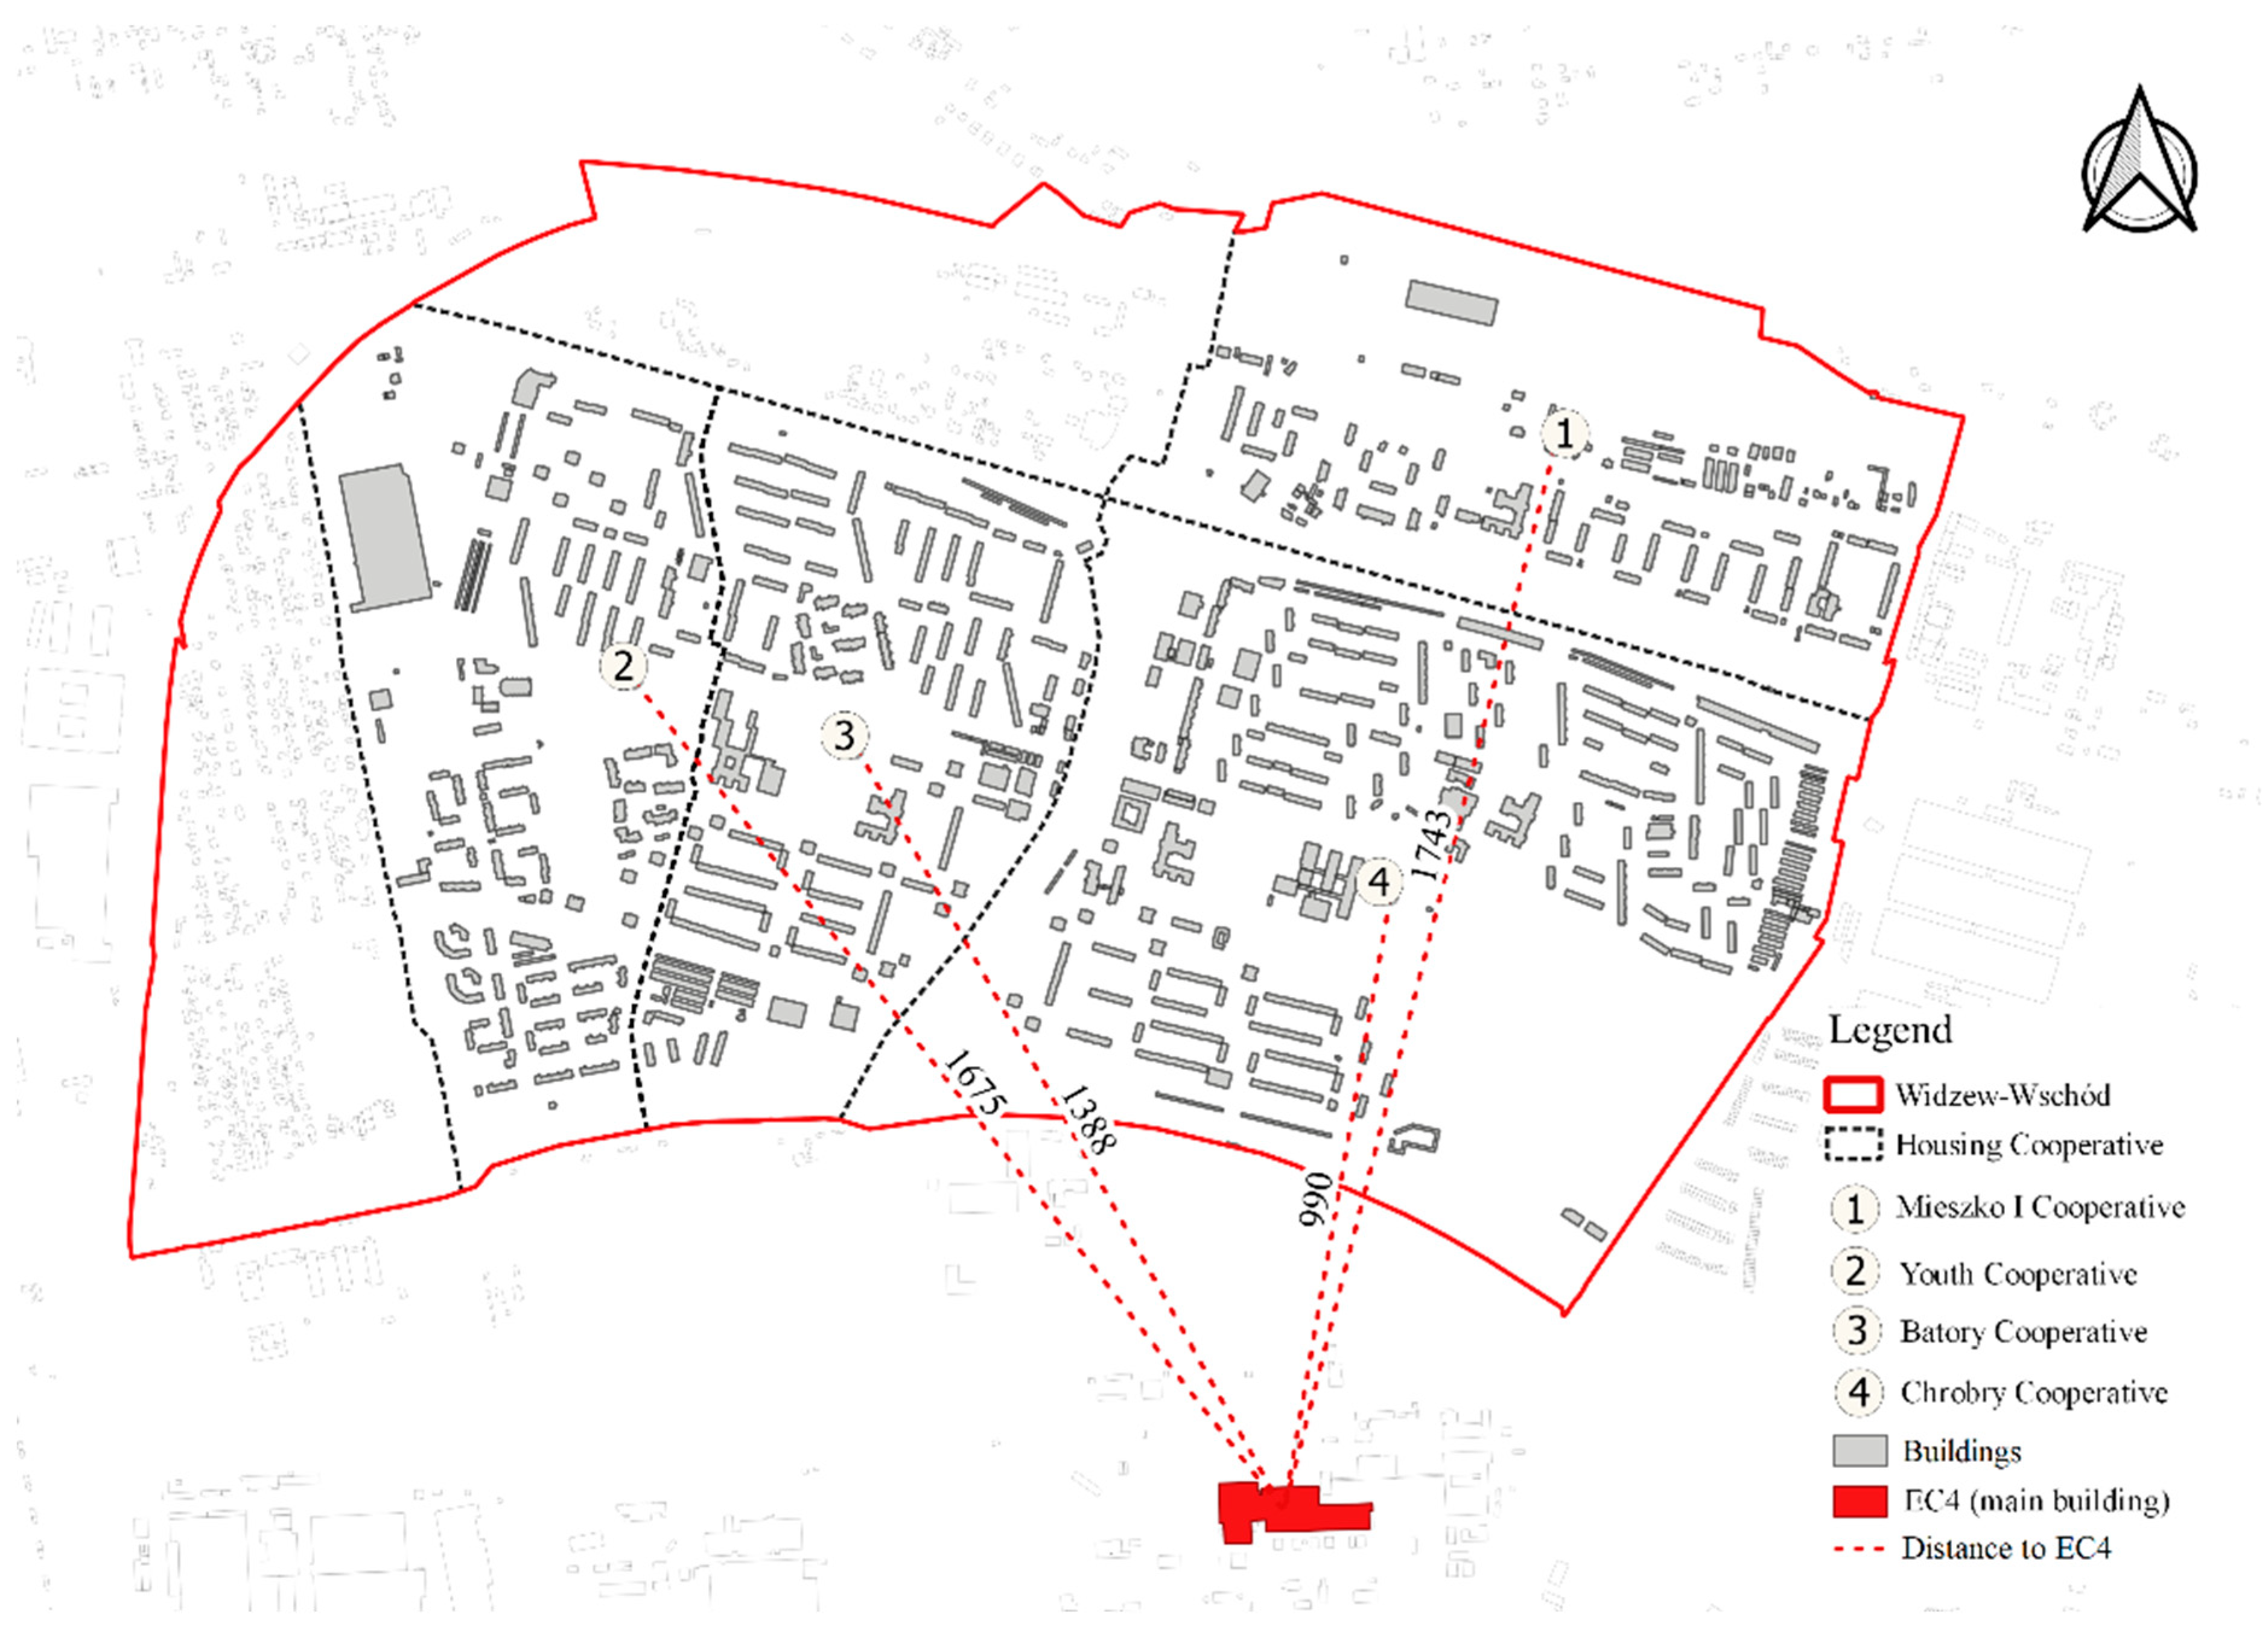
- Masica, R.; Milewska, K. Zmiany w Zagospodarowaniu Zespołu Osiedli Mieszkaniowych: Przykład Widzewa-Wschodu w Łodzi [w:] Markowski T. (red.), Zagospodarowanie PRZESTRZENI MIEJSKIEJ ŁODZI, „Biuletyn KPZK PAN”, z. 203; Polish Academy of Siences: Warszawa, Poland, 2003. [Google Scholar]
- System Heat for Lodz, n.d, Veolia. Available online: https://www.energiadlalodzi.pl/dane-kluczowe/dane-techniczne/ (accessed on 28 October 2022).
- Cichowicz, R.; Dobrzański, M. Modeling Pollutant Emissions: Influence of Two Heat and Power Plants on Urban Air Quality. Energies 2021, 14, 5218. [Google Scholar] [CrossRef]
- InterSit. 2023. Available online: http://www.mapa.lodz.pl/ (accessed on 10 January 2023).
- Musterd, S.; van Kempen, R. Large Housing Estates in European Cities: Opinions of Residents on Recent Developments; UU GEOG URU: Utrecht, The Netherlands, 2005; Available online: https://www.researchgate.net/publication/241883976_Large-scale_housing_estates_in_European_cities_Opinions_of_residents_on_recent_developments (accessed on 12 October 2022).
- UMŁ, bd. Available online: https://uml.lodz.pl/budzet-obywatelski/minione-edycje/lbo-20202021/podzial-srodkow-miedzy-osiedlami/ (accessed on 17 October 2022).
- Szafrańska, E. Starzenie się mieszkańców wielkich osiedli mieszkaniowych w mieście postsocjalistycznym przykład Łodzi. Space-Soc.-Econ. 2017, 20, 43–64. [Google Scholar] [CrossRef]
- Szafrańska, E. Wielkie osiedla mieszkaniowe w mieście postsocjalistycznym. In Geneza, Rozwój, Przemiany, Percepcja, Wyd; Uniwersytetu Łódzkiego: Lodz, Poland, 2016. [Google Scholar]
- Chmielewski, J.M.; Mirecka, M. Modernizacja Osiedli Mieszkaniowych; Oficyna Wydawnicza Politechniki Warszawskiej: Warsaw, Poland, 2007. [Google Scholar]
- Rozporządzenie Ministra Infrastruktury z Dnia 12 Kwietnia 2002 r. w Sprawie Warunków Technicznych, Jakim Powinny Odpowiadać Budynki i ich Usytuowanie. Dz.U. 2002 nr 75 poz. 690. Available online: https://isap.sejm.gov.pl/isap.nsf/DocDetails.xsp?id=wdu20020750690 (accessed on 12 July 2023).
- Aktualizacja Krajowego Programu Ochrony Powietrza Do 2025 r. z Perspektywa Do 2030 r. Oraz Do 2040 r., 2021, Ministerstwo Klimatu i Srodowiska. Available online: https://bip.mos.gov.pl/fileadmin/user_upload/bip/strategie_plany_programy/AKPOP/AKTUALIZACJA_KRAJOWEGO_PROGRAMU_OCHRONY_POWIETRZA_do_2025_r__z_perspektywa_do_2030_r_oraz_do_2040_r_.pdf (accessed on 13 December 2022).
- Jałowiecki, B. Społeczna Przestrzeń Metropolii; Wyd. Naukowe Scholarship: Warsaw, Poland, 2000. [Google Scholar]


| Pollutant | Averaging Time | 2005 AQGs | 2021 AQGs |
|---|---|---|---|
| PM2.5, μg/m3 | Annual | 10 | 5 |
| 24-h a | 25 | 15 | |
| PM10, μg/m3 | Annual | 20 | 15 |
| 24-h a | 50 | 45 | |
| O3, μg/m3 | Peak season b | - | 60 |
| 8-h a | 100 | 100 | |
| NO2, μg/m3 | Annual | 40 | 10 |
| 24-h a | - | 25 | |
| SO2, μg/m3 | 24-h a | 20 | 40 |
| CO, mg/m3 | 24-h a | - | 4 |
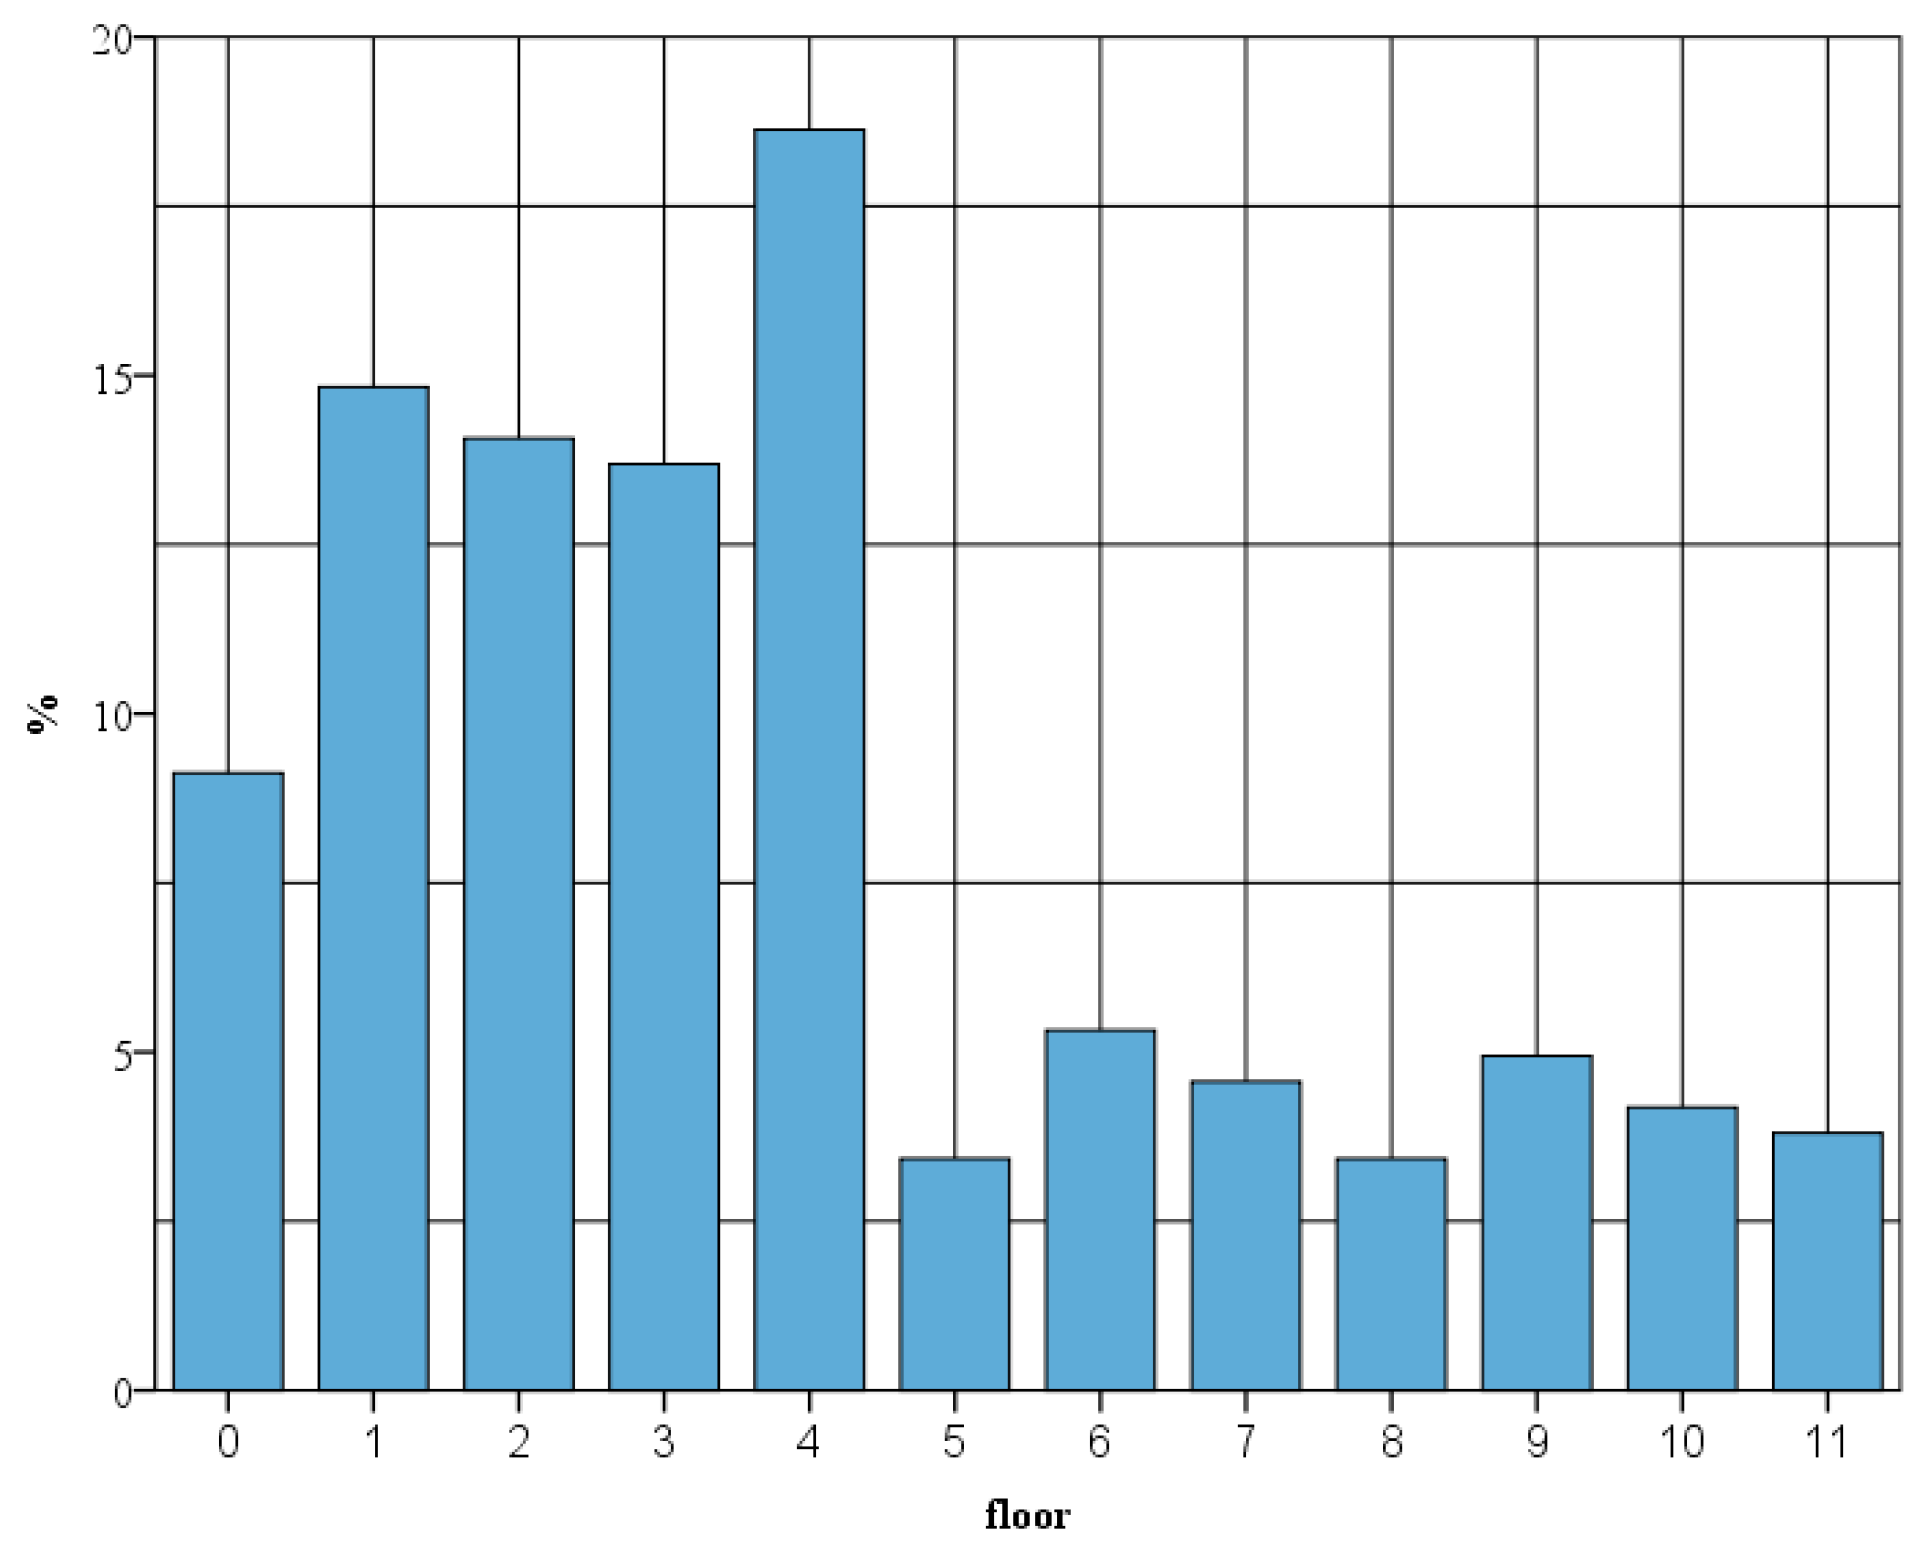
| Floor Zone | Total | ||||
|---|---|---|---|---|---|
| 1 | 2 | 3 | |||
| Batory | 51.0 | 34.0 | 15.0 | 100.0 | |
| Chrobry | 37.2 | 35.1 | 27.7 | 100.0 | |
| Mieszko I | 55.2 | 31.0 | 13.8 | 100.0 | |
| Youth Cooperative | 82.9 | 11.4 | 5.7 | 100.0 | |
| Total | 31.0 | 18.2 | 100.0 | ||
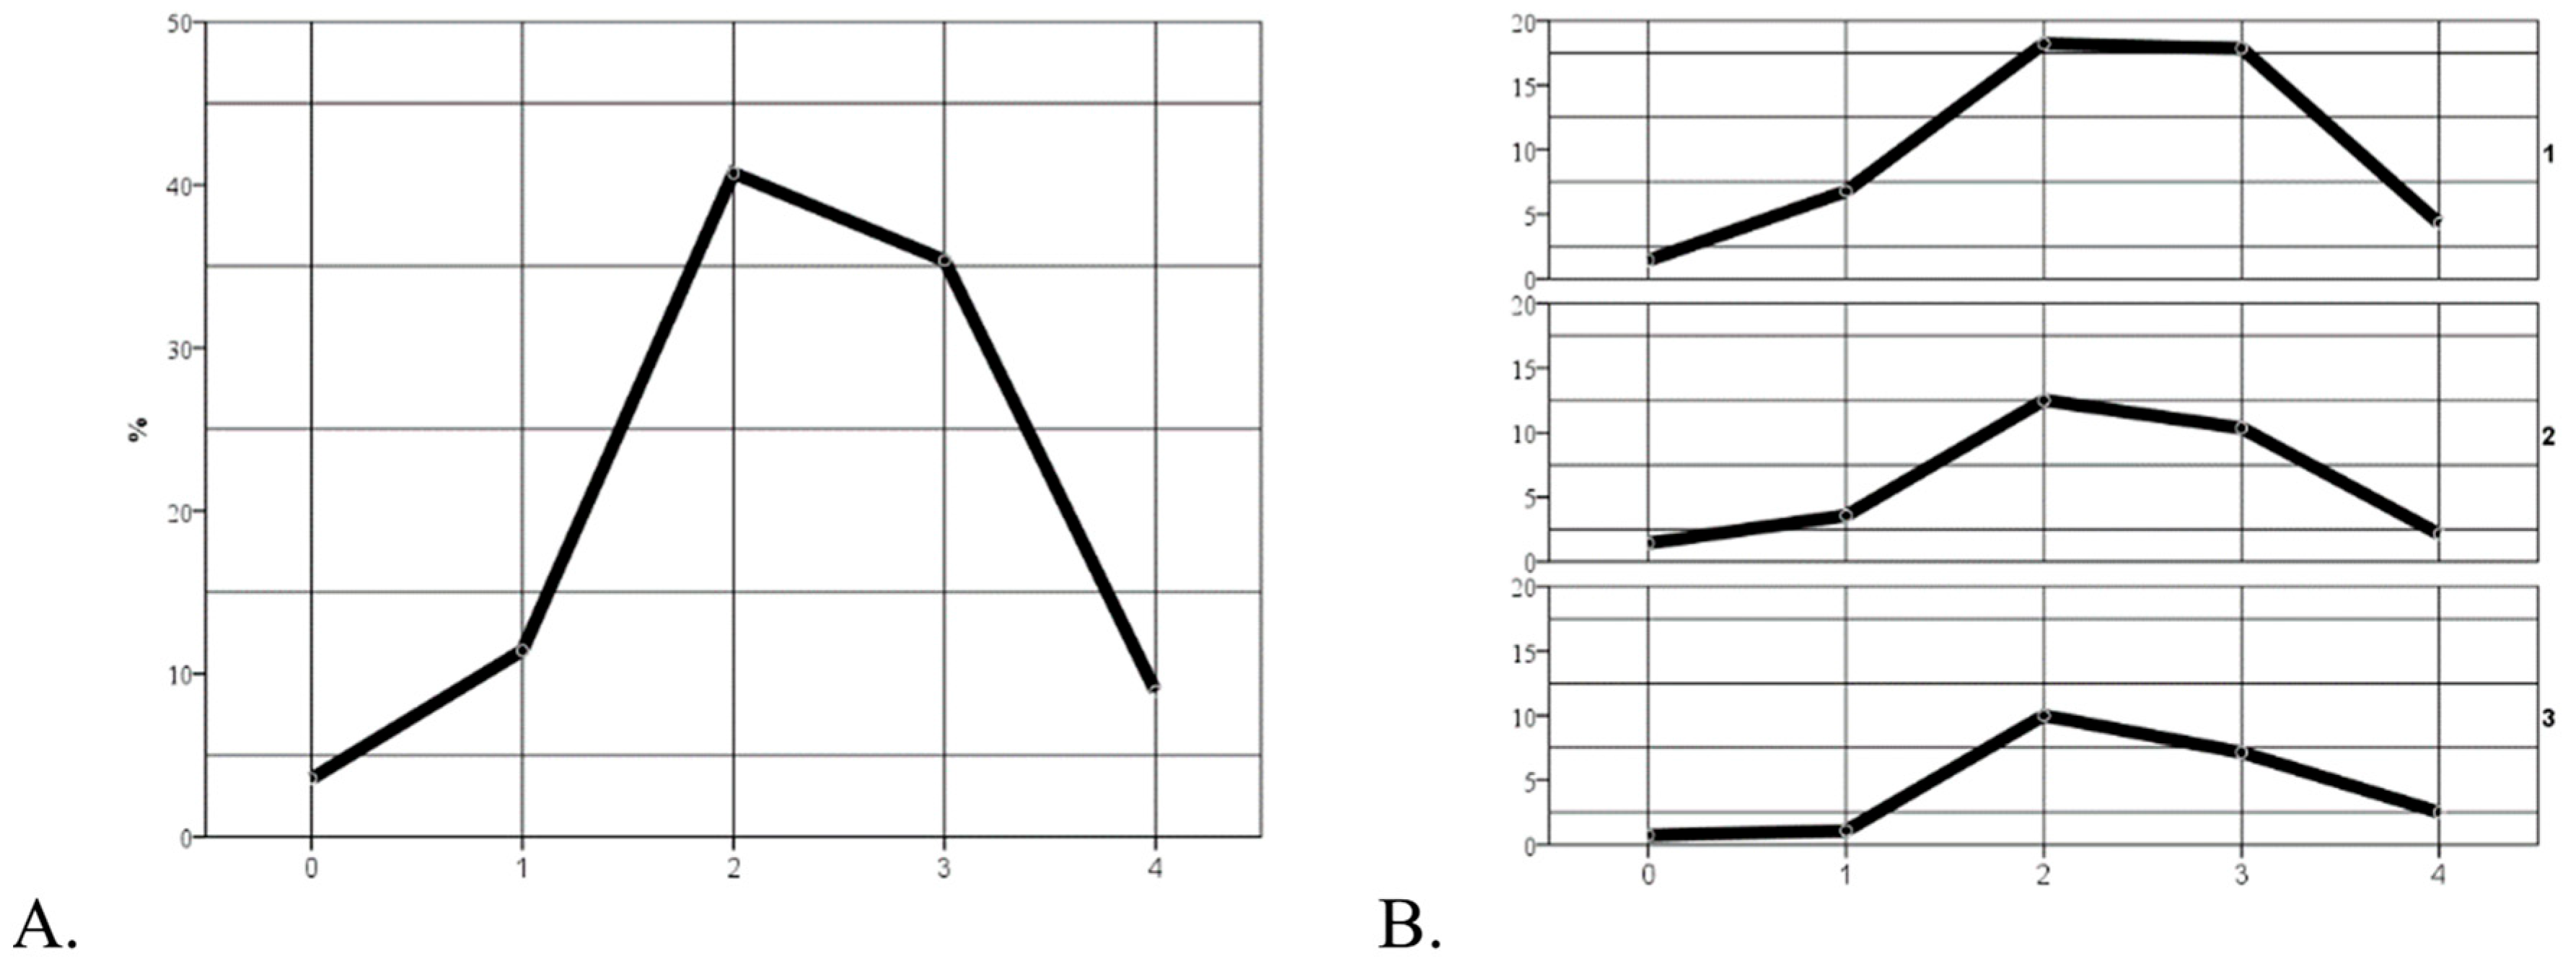
| Scale | Total | ||||||
|---|---|---|---|---|---|---|---|
| 0 | 1 | 2 | 3 | 4 | |||
| Batory | 1.0 | 14.0 | 42.0 | 36.0 | 7.0 | 100.0 | |
| Chrobry | 6.4 | 10.6 | 37.2 | 33.0 | 12.8 | 100.0 | |
| Mieszko I | 0.0 | 3.4 | 51.7 | 37.9 | 6.9 | 100.0 | |
| Youth Cooperative | 2.9 | 14.3 | 34.3 | 40.0 | 8.6 | 100.0 | |
| Total | 3.1 | 11.6 | 40.3 | 35.7 | 9.3 | 100.0 | |
| Air | Noise | Illumination | ||
|---|---|---|---|---|
| Batory | Mean | 2.780 | 2.780 | 3.140 |
| Standard deviation | 1.203 | 1.447 | 1.544 | |
| Chrobry | Mean | 2.720 | 2.790 | 2.800 |
| Standard deviation | 1.469 | 1.451 | 1.485 | |
| Mieszko I | Mean | 3.100 | 2.970 | 2.860 |
| Standard deviation | 1.012 | 1.322 | 1.432 | |
| Youth Cooperative | Mean | 2.770 | 2.940 | 3.000 |
| Standard deviation | 1.087 | 1.494 | 1.495 | |
| Total | Mean | 2.790 | 2.830 | 2.970 |
| Standard deviation | 1.272 | 1.435 | 1.503 |
| Less | The Same | More | Total | ||
|---|---|---|---|---|---|
| Estate | Batory | 21.2 | 68.7 | 10.1 | 100.0 |
| Chrobry | 31.5 | 58.7 | 9.8 | 100.0 | |
| Mieszko I | 27.6 | 51.7 | 20.7 | 100.0 | |
| Youth Cooperative | 15.2 | 72.7 | 12.1 | 100.0 | |
| Total | 24.9 | 63.6 | 11.5 | 100.0 | |
| Zone | 1 | 24.4 | 65.6 | 9.9 | 100.0 |
| 2 | 22.6 | 63.1 | 14.3 | 100.0 | |
| 3 | 28.3 | 61.7 | 10.0 | 100.0 | |
| Total | 24.7 | 64.0 | 11.3 | 100.0 | |
| Observers /Likes | Type | Address URL | |
|---|---|---|---|
| Spotted: Widzew | 15,371/16,290 | Page | Available online: https://www.facebook.com/spottedWidzew (accessed on 28 March 2023) |
| Widzew–Wschód | 2400/2400 | Page | Available online: https://www.facebook.com/osiedlewidzewwschod (accessed on 28 March 2024) |
| Osiedle Widzew–Wschód w Łodzi | 3100/na | Group | Available online: https://www.facebook.com/groups/227925995629667 (accessed on 28 March 2024) |
Disclaimer/Publisher’s Note: The statements, opinions and data contained in all publications are solely those of the individual author(s) and contributor(s) and not of MDPI and/or the editor(s). MDPI and/or the editor(s) disclaim responsibility for any injury to people or property resulting from any ideas, methods, instructions or products referred to in the content. |
© 2025 by the authors. Licensee MDPI, Basel, Switzerland. This article is an open access article distributed under the terms and conditions of the Creative Commons Attribution (CC BY) license (https://creativecommons.org/licenses/by/4.0/).
Share and Cite
Klima, E.; Janiszewska, A.; Ciosek, A.; Cichowicz, R. Air Pollution in Residential Areas of Monocentric City Agglomerations: Objective and Subjective Dimensions. Sustainability 2025, 17, 4490. https://doi.org/10.3390/su17104490
Klima E, Janiszewska A, Ciosek A, Cichowicz R. Air Pollution in Residential Areas of Monocentric City Agglomerations: Objective and Subjective Dimensions. Sustainability. 2025; 17(10):4490. https://doi.org/10.3390/su17104490
Chicago/Turabian StyleKlima, Ewa, Anna Janiszewska, Agnieszka Ciosek, and Robert Cichowicz. 2025. "Air Pollution in Residential Areas of Monocentric City Agglomerations: Objective and Subjective Dimensions" Sustainability 17, no. 10: 4490. https://doi.org/10.3390/su17104490
APA StyleKlima, E., Janiszewska, A., Ciosek, A., & Cichowicz, R. (2025). Air Pollution in Residential Areas of Monocentric City Agglomerations: Objective and Subjective Dimensions. Sustainability, 17(10), 4490. https://doi.org/10.3390/su17104490