1. Introduction
The capacity and throughput of railway infrastructure are crucial parameters that determine how efficiently and effectively a railway system can operate. These concepts relate to the ability of the track and facilities to handle the demand for passenger and freight transportation. The capacity of railway infrastructure refers to the maximum number of trains that a specific railway track or station can handle in a given period. Capacity can vary based on many factors. The most important are the number of tracks, train speed, concept of train operations, number of stops and crossings, signalling and control systems, and safety devices in the stations, on the railway line, and in the trains. Throughput refers to the ability of a railway line or system to transport a certain amount of freight or passengers over a given period. It is a more complex concept that encompasses not only capacity but also the efficiency of utilising that capacity. The capacity and throughput of railway infrastructure are essential for the efficient functioning of the railway system. These parameters not only consider the technical specifications of tracks and trains but also logistics, maintenance, and modernisation efforts.
The mentioned issue has been addressed in several important publications. These are scientific articles, studies, university textbooks, and legislative documents dealing with railway infrastructure. There are several explanations and definitions of railway infrastructure capacity. The most important are the following:
“In the process of train path capacity allocation to the railway undertaking, the infrastructure manager needs to be aware of infrastructure capacity. It is relatively hard to define railway infrastructure capacity, and there are several different approaches to defining it. This widely used term currently replaces an established term for operating efficiency, although in some respects it broadens the meaning of operating efficiency. Throughput is defined as efficiency expressed in the number of trains that can be operated on railway infrastructure without compromising the required quality of railway traffic.” This is the definition according to publication [
1].
Railway capacity is a seemingly easy but rather inaccessible concept; it has been “a vague expression in railway systems” according to reference [
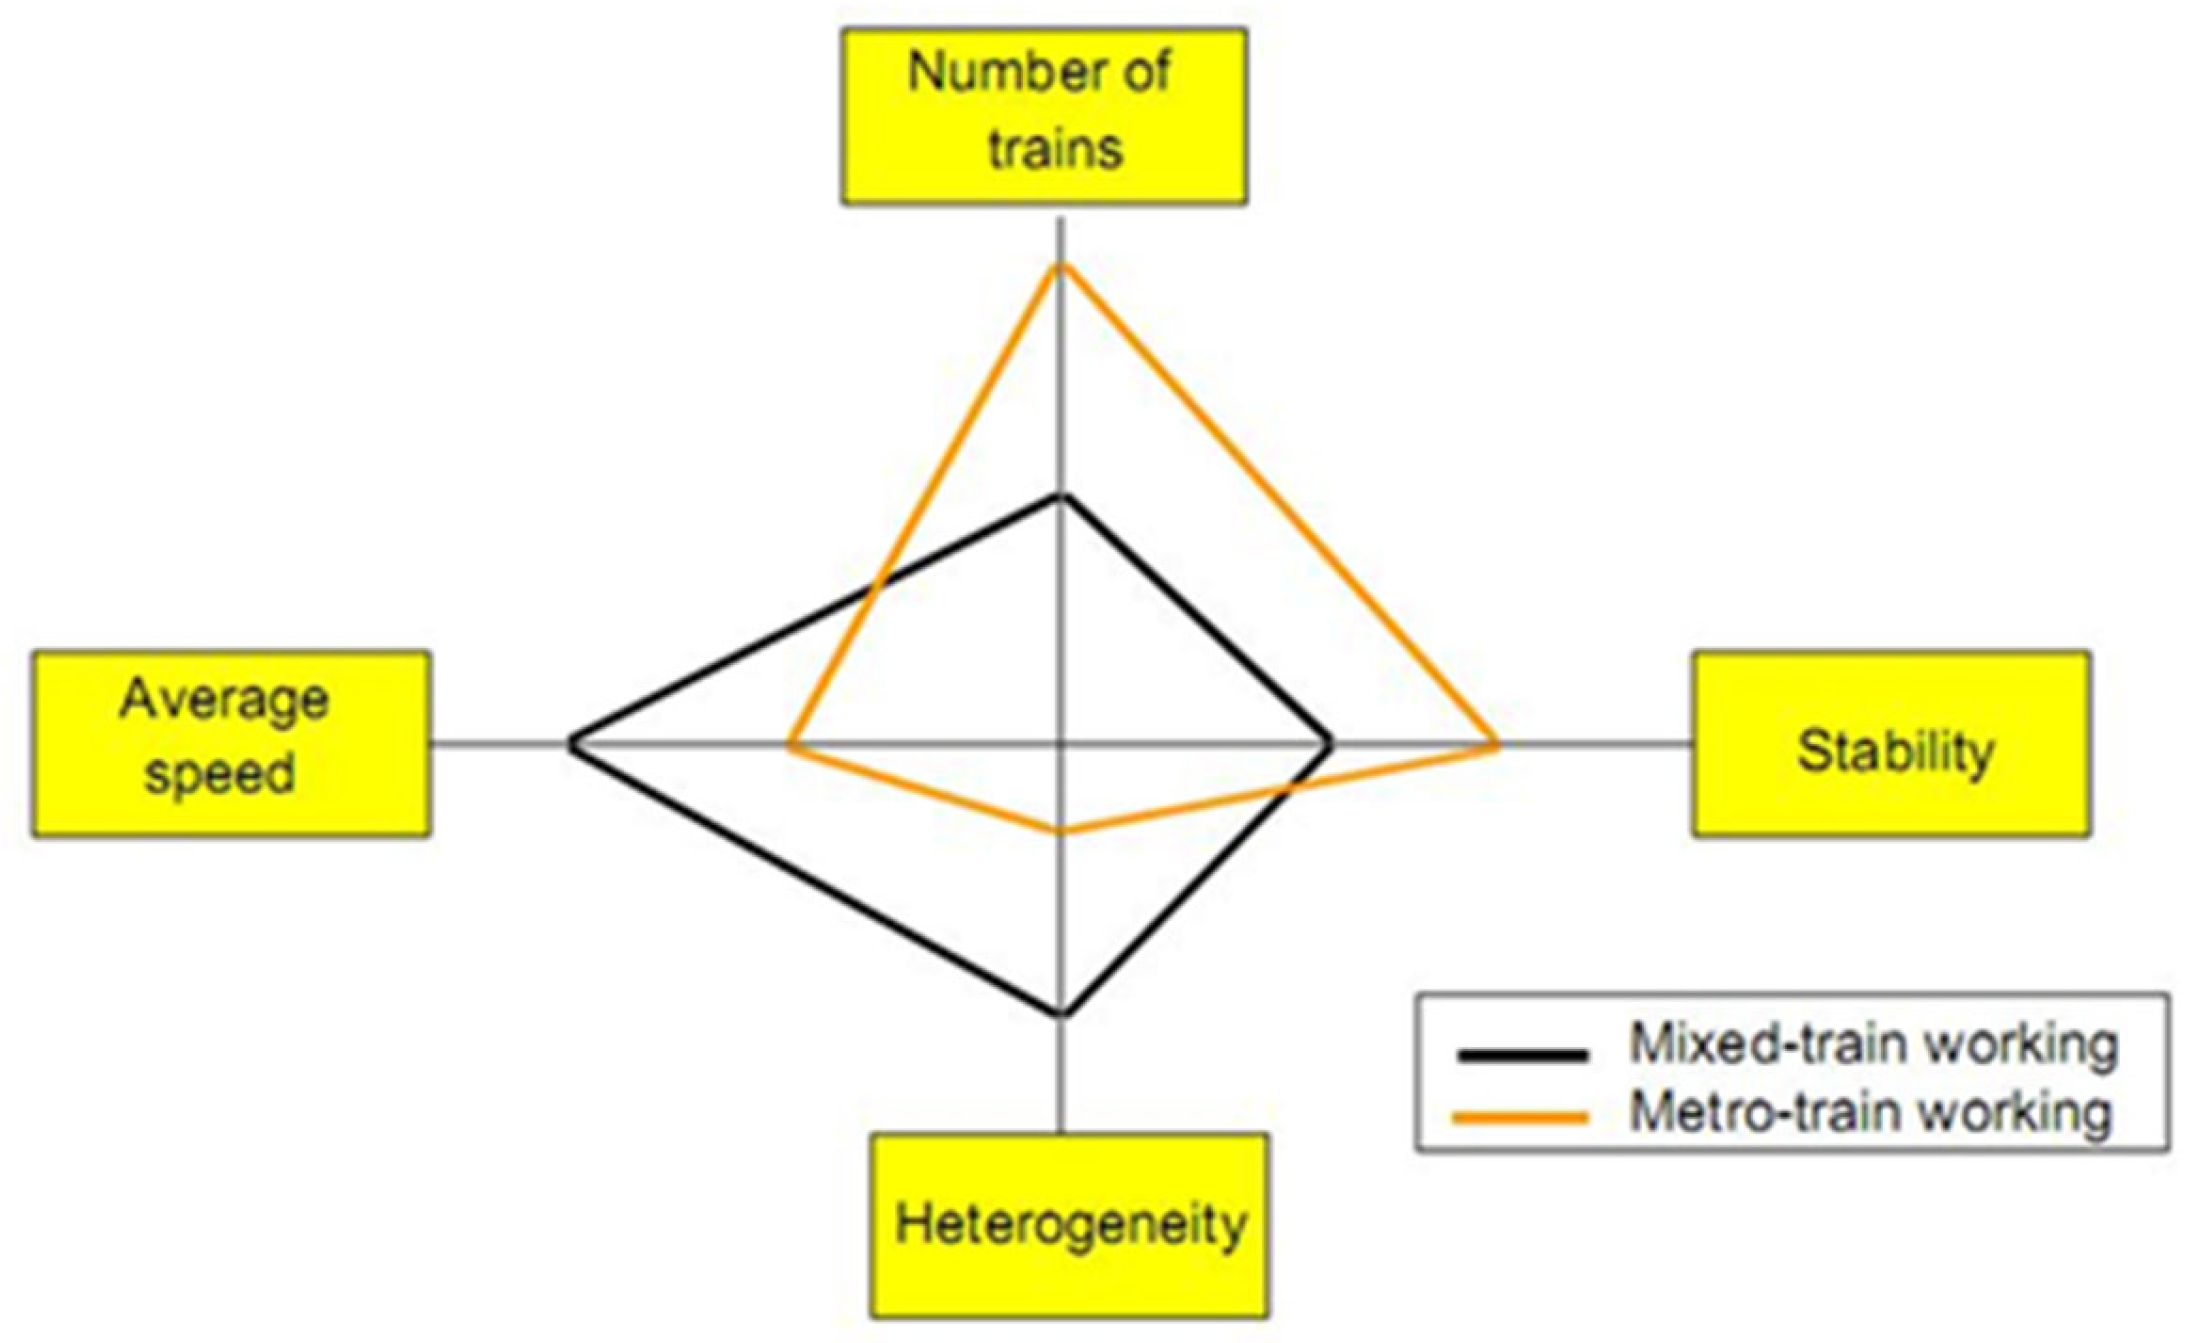
2]. It is further stated that “Capacity as such does not exist. Railway infrastructure capacity depends on the way it is utilised. On a given infrastructure, capacity is based on the interdependencies existing between the number of trains, the average speed, the stability, and the heterogeneity” in reference [
3]. “The maximum number of trains that may be operated using a defined part of the infrastructure at the same time as a theoretical limiting value is not reached in practice.” This idea is mentioned in reference [
4].
“Capacity is the ability of infrastructure to generate value by moving passengers (or freight) toward their destination. The value generated is a function of ‘macro capacity utilisation’, which is the quantity of discrete steps in the use of railway capacity (e.g., the number of trains), and ‘micro capacity utilisation’, which is the quality of discrete steps in the use of railway capacity (e.g., load factor)” [
2].
The International Union of Railways’ Code of Practice (UIC Code 406) has concluded the following: “A unique, true definition of capacity is impossible”. It is discussed that “Railway infrastructure capacity depends on the way it is utilised”, which is a trade-off between the number of trains, heterogeneity, and average speed. The relationships among them are mentioned in
Figure 1.
As part of the established research, we will rely on the mentioned theoretical concepts, which will be expanded and enriched with other scientific and research elements and features. Currently, there are several definitions and methods for the determination of capacity and throughput of railway infrastructure. However, no method has been proposed yet that would combine graphical and software methods. Therefore, it is necessary to emphasize the main goal of our contribution, which is to determine a new combined method. The individual steps of this method are explained within the heuristic procedure located in the proposal part. For better understanding, this methodological procedure is explained based on a specific example, or rather on a practical application on the railway line Bratislava–Dunajská Streda–Komárno.
2. Materials and Methods
In order to fulfil the aim of the paper, it is also necessary to know the current state of the issue and the materials that deal with it. Within the first part of the sub-chapter “Publication materials”, current important scientific publications that examine the issue of railway infrastructure capacity are listed. The second chapter describes the current theoretical framework for the determination of the capacity of railway infrastructure including the current most widely used methods. In the third subchapter, the most widespread scientific research methods for railway infrastructure capacity determination which are currently used are listed.
2.1. Publication Materials
Currently, there are a large number of publications that deal with the mentioned issue and which are a source of inspiration for the authors’ research. Currently, there is a lot of different theoretical and scientific knowledge with several progressive professional and scientific ideas. Many of them are the subject of scientific manuscripts, which are presented and described within this subchapter.
For example, the main idea of railway infrastructure capacity is that with increased transport, there is a need for railway capacity. The simplest solution is increasing the number of railway tracks. However, this solution is very expensive. One of the solutions can be reducing the difference between train speeds. Trains slower than local and freight trains reduce the railway capacity [
5].
In addition to double-tracking and the construction of new switches, it is possible to increase railway capacity by increasing the length of stations by an extended switch point. By this solution, it is possible to reduce the time of occupation in the interstation section. This measure is appropriate for trains run behind and for trains run alternately. An extended station switchpoint area can increase the stability of traffic [
6].
Regarding increased demand for freight transport, there is a need to increase capacity on the railway line between Ogulin and Škrljevo in Croatia. By analyses of available solutions to increase the capacity of railway lines, it was detected that the most advantageous solution is double-tracking of one section of the railway line for the needs of freight transport [
7]. Lindfeldt, O., in their publication [
8], points to the low capacity of railway infrastructure caused by running fast and slow trains on the same track. The influence of infrastructure on capacity is dependent on differences in train speeds. Losses in capacity for this reason can be improved with new places offering the possibility of overtaking.
For double-track railway lines, there are many capacity analyses. However, for single-track lines, there are a smaller number of available analyses. The principles of capacity analyses for double-track lines are possible to partly apply on single-track lines. One of the methods is UIC 406, which is applicable for both types of railway lines. When using this method, it is necessary to divide the railway line into sections because adding new trains to the total line can significantly reduce the railway capacity [
9]. The capacity of railway lines is also dependent on stations. It is important to plan the traffic in addition to operations on the stations at present and in the future. At the same time, it is necessary to have a sufficient number of stations on the railway line for station operations and for traffic on the line. With an optimal number of stations, it is possible to achieve the needed volume of transport and required station operations [
10].
The key factor that influences railway transport is heterogeneity. Different types of trains have different running characteristics, including maximum speed, weight, and power. These heterogeneities influence the capacity of the railway infrastructure and can cause delays in trains. Understanding the factors delaying trains can help to efficiently plan the capacity of the railway network and efficient railway transport [
11]. Regarding the high investment costs of modernising railway lines, it is possible to increase the railway capacity by changing the mode of operation on the railway. This solution is cheaper and faster than modernisation of the infrastructure. It is advisable to conduct an economic evaluation of this change to see whether the proposed changes are beneficial [
12].
The capacity can be increased by using a quasi-moving block between stations. This quasi-moving block is suitable for mixed characters of transport, and it can increase the railway capacity, mainly with evenly situated stations [
13]. Umiliacchi, S. et al., in their manuscript [
14], point to ways to increase accuracy and reduce energy consumption on single-track railways by using the optimisation algorithm. It is possible to do this by modifying the trajectory of the second train, dependent on the amount of delay of the first train.
Low capacity on single-track infrastructure often leads to delayed trains. To reduce the delay of the train and increase the reliability, the timetable can be changed by adding balancing time. However, adding balancing time reduces capacity and worsens the optimisation of the used railway network. It leads to an extension of the train journey and reduces the railway capacity [
15].
To achieve the required quality of railway run, it is possible to use simulation programs, for example, OpenTrack 2023.3.0. By this method, it is possible to simulate situations that occur on single-track railways, such as non-planned stops or delayed trains. Results from this analysis could be used in the strategic planning of transport on a single-track railway or for the improvement of the railway infrastructure. This output is mentioned in reference [
16]. The important factor for a single-track railway is real analysis of causes of delay. By using algorithms and software, it is possible to analyse delay propagation. This method is not a simulation, but it is possible to use it to show how chain delays propagate on these railways. This method and analysis can be used to improve the accuracy of the train traffic diagram [
17].
Kendra, M. et al., in their paper [
18], considered using alternative drives or partly electrifying railways on monitored lines. Electrification is mainly suitable between Dunajská Streda and Bratislava regarding the numerous freight trains. Bialy, W., in his paper, stated that the capacity of the railway line is also affected by breakdowns on the railway line. The numerous breakdowns and condition of infrastructure influence the stability of the train traffic diagram and railway capacity. The quality of railway transport also depends on the capacity of the lines [
19]. The manuscript of Ricci, S. et al. [
20] focused on measures to increase the capacity on selected congested railway lines. They compared doubling the line with partly doubling the line and the influence on the capacity.
Abramovic, B. et al. focused on problems that can begin in the case of increased performance on today’s infrastructure in the Slovak Republic. At that time, the value of capacity was sufficient, but in the future, if the transfer of part of the freight to the trains occurs, the capacity of the infrastructure will be insufficient [
21]. Bulková, Z. et al. focused on increasing the capacity on a selected railway line by the method of determining the practical throughput performance in the anticipated timetable. They compare some variants, like doubling the line, partly doubling the line, or increasing the maximal line speed. This not only decides the number of trains but also the type of the trains and line characteristics [
22].
Akay., M. E. and Aygun., H., in their paper [
23], research the planning of the trains between selected towns in Turkey. Regarding often-delayed trains, they performed simulation studies in MATLAB 23.2. By editing the timetable, the delaying of trains was reduced by about 65%. Publication [
24] focused on the problem of calculating the capacity for transport junctions and railway lines separately. They developed a new model that maximises the number of trains and also meets infrastructure constraints. This model permits the calculation of a network-wide capacity, taking into consideration restrictions like route conflicts or minimum headway time. Another publication [
25] focused on problems in railway line capacity in combination with different trains with different parameters. By changing the parameters of the trains, it is possible to achieve increased railway capacity. The results show that the capacity is increased non-linearly by increased train speed. The aim of the proposed model is to maximise the number of trains on the railway line and line section in a specific period.
The mentioned solution of low-capacity railway lines is often solved by new constructions, such as new stations, doubling the interstation sections, or other infrastructure constructions. However, these solutions are more financially demanding than our preferred solution.
All of the above publications are a significant inspiration for the authors, as it is essential to know in detail all relevant previous research and scientific outputs. All of these outputs contain unique ideas that the authors also use in the research presented in this contribution, while continuing its basic goal.
2.2. Current Theoretical Framework
Throughput efficiency (throughput capacity) can be basically divided into the following [
26,
27]:
- -
Theoretical (maximum),
- -
Practical.
Throughput efficiency is defined for these railway facilities:
- -
Track line,
- -
Station head (development of tracks),
- -
Traffic track (at the traffic control point).
The calculation of maximum throughput efficiency does not consider any time losses and the facility whose throughput is defined is assumed to serve exclusively for its purpose, and inevitable technological times of occupancy are closely linked without any time losses.
Maximum throughput efficiency is implied from the following relationship:
where
T is time window, calculation time (either peak time or all-day time window) [min],
b is the average time needed to accomplish monitoring of technological operation (train movement, hump shunting, shunting, etc.).
The calculation of practical throughput efficiency does not only consider maintenance needs of the facility or the fact that the respective facility is intended for other purposes than usual but also a buffer time necessary for removal of potential failures or irregularities of the railway service [
28].
The practical throughput efficiency is determined according to the following formula:
This applies for evaluation of the throughput performance in the constructed train traffic diagram.
where
n is practical throughput efficiency (capacity) of a specific facility or element (track line, traffic track, station head) [trains],
T is the time window (calculation time) [min],
Tv is total time for regular shutdown and maintenance (the infrastructure device within the calculated time is excluded from operation due to planned inspections, repairs, and maintenance), given as [min],
Ts is total time of permanent manipulations, i.e., the time in which the operating device is occupied by other actions than those given as [min],
B is technological time of the occupation by one train (calculated as an average train) [min],
bd is average time corresponding to one train that includes the following [min]:
- -
time by which an occupancy time of the specific operating facility (element) needs to be extended because its release prevents occupancy of another operating facility (element),
- -
time necessary for compensating the delay due to irregularities and failures in railway traffic.
br is the average time of a probable correlative disruption of running arising in point of threat due to the impossibility of parallel running on a specific facility or element pertaining to one train [min],
mr is the real average buffer time per train [min],
mt is required (minimal) buffer time per one train according to IM methodology [min].
2.3. Current Methodologies for Throughput Efficiency and Capacity Estimation
Currently, there are many types of throughput efficiency and capacity estimation methodologies that are commonly used in railway operations. The most important methodologies are the graphical-analytical method for constructed timetable and analytical methods for perspective timetable. Both methodologies are briefly described in the following subsections.
2.3.1. Graphical-Analytical Method for Constructed Timetable
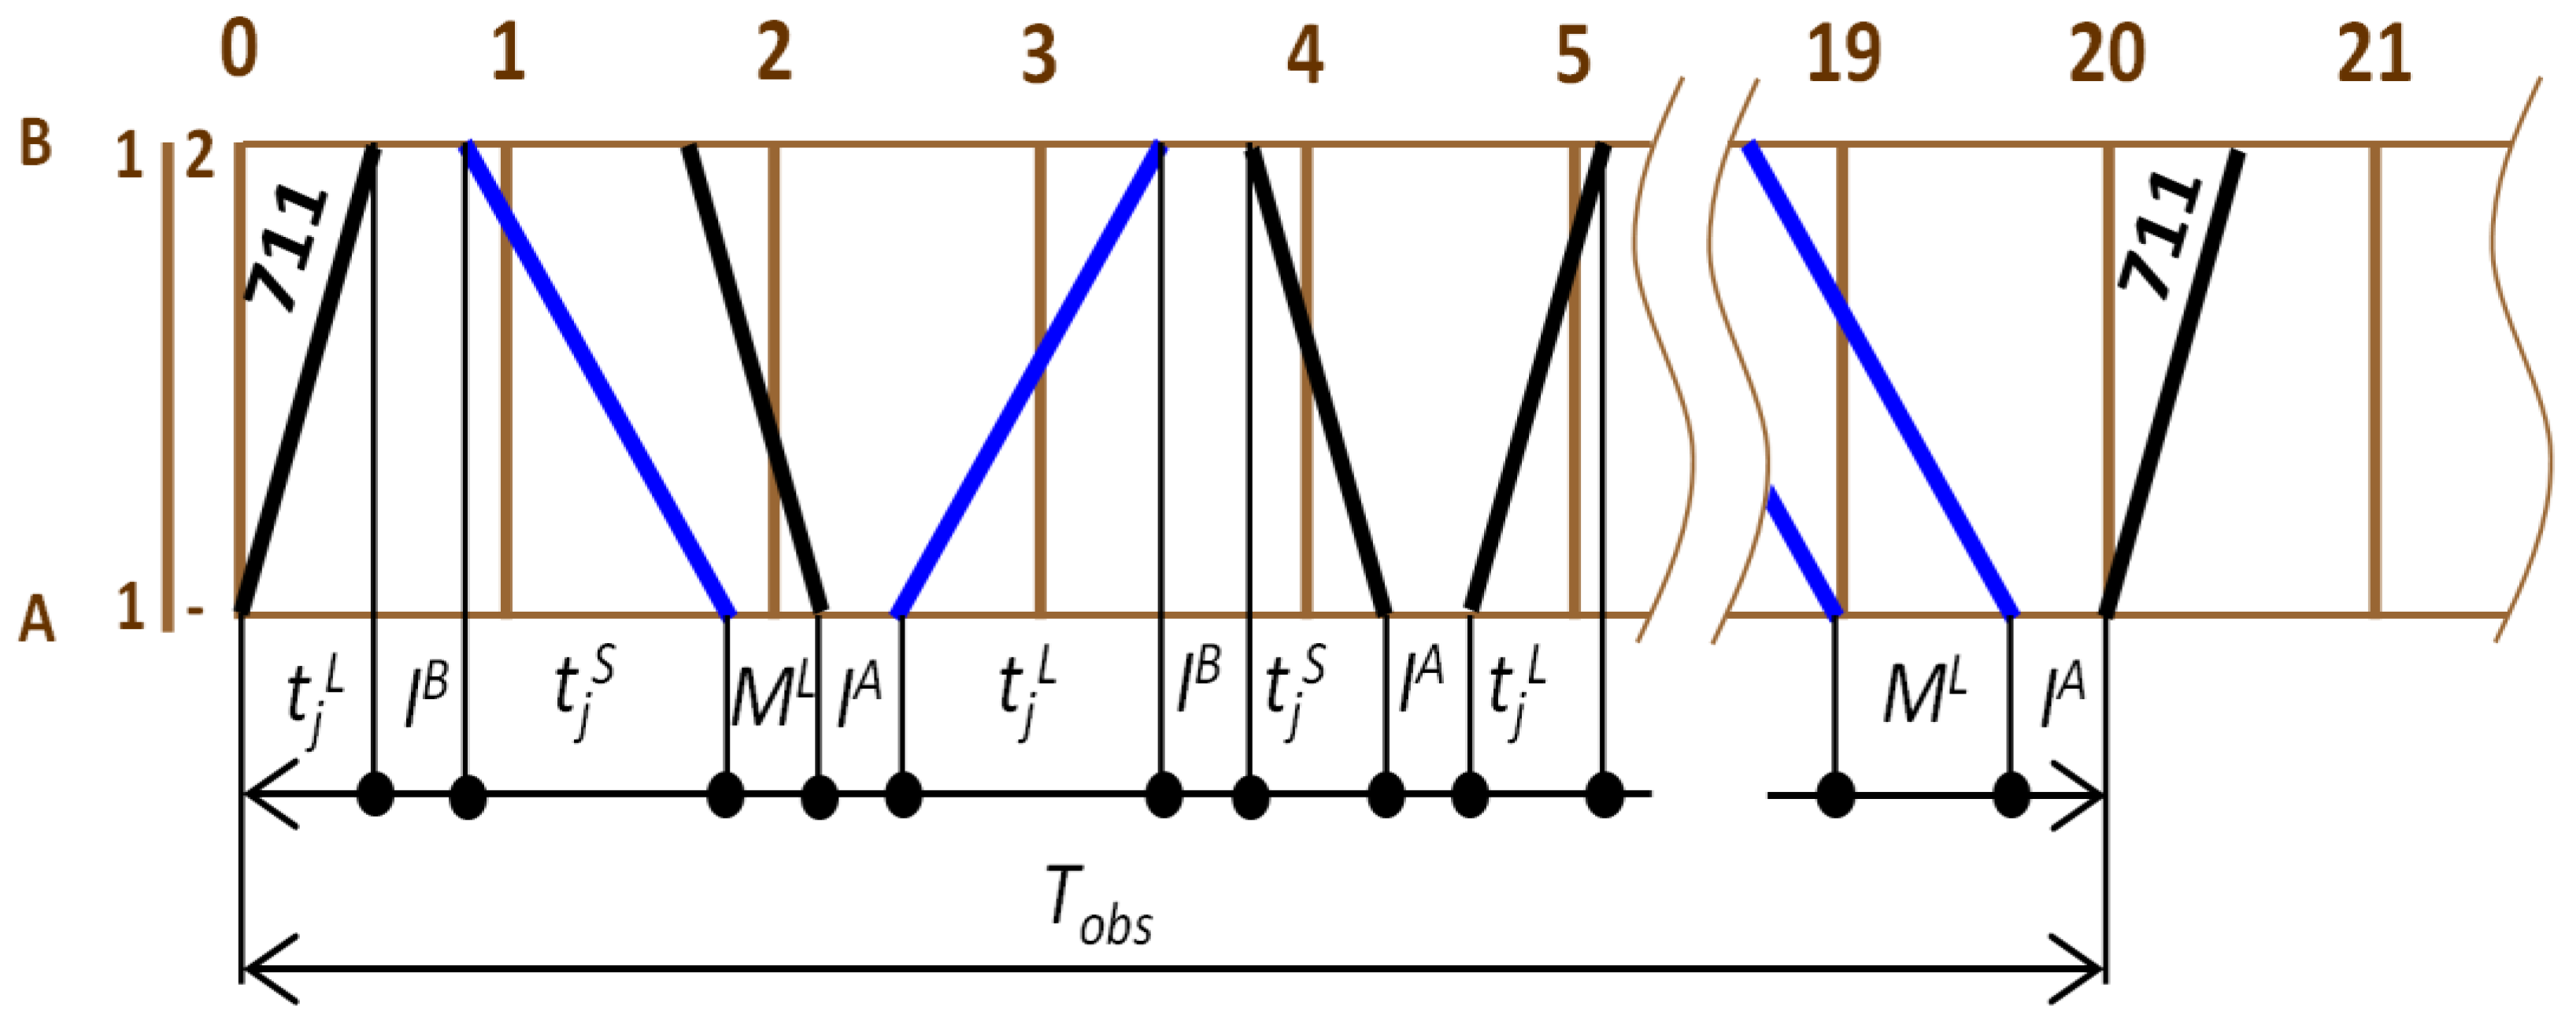
In the graphical-analytical method, the additional train paths are inserted in the timetable, and then all the train paths are drawn in the boundary interstationary section in the order in which they follow each other in the timetable without any buffer times and regardless of adjacent intermediate sections. The train path of the first train is put again as the last one in the sequence. The total time occupied by trains is then read on the time axis between zero and the end train’s elevation, always on the axis showing the same traffic point. From it, the average occupancy time, the average gap time, and consequently the practical throughput efficiency is calculated. The graphic method of determining the total occupancy time is shown in
Figure 2. The brown numbers at the top (0–5, 19–21 are the hours), the blue lines are freight trains, and the individual letters at the bottom are designations of either train runs or operating intervals.
2.3.2. Analytical Methods for Perspective Timetable
To determine the prospective practical throughput efficiency of the line (it is not necessary to have a pre-constructed timetable), the methods of mathematical statistics and the number of probabilities are primarily used.
The calculation is based on a statistical analysis of the existing timetable for lines with similar infrastructural and operational conditions. To use this method, the following data are needed:
- -
Scope of train transport (numbers of trains by type),
- -
Expected running times of trains by type,
- -
Expected operating intervals and headways,
- -
Required value of buffer time,
- -
Duration of permanent manipulations,
- -
Duration of predicted exclusions of infrastructure.
Knowing the occupation time of interstationary sections and probable sequence of trains allows calculation of a total occupation time, and knowledge of a principle of distribution of buffer times allows the definition of probable practical throughput efficiency. The benefit of the method is its close similarity to the distribution of trains in the timetable. It is appropriate for the calculation of throughput in the prospective timetable, including stochastic operating conditions [
15].
For this purpose, trains are divided by type, where
N is the total number of trains and
Ni is the number of trains of individual types; for example, NEx is the number of trains of category Ex. The probability of running this train type is determined by the following formula [
29]:
where
p(i) is the probability of running of the i-train type [100%],
Ni is the number of trains of the i-type [trains],
N is the number of all trains on the line section [trains].
In order to determine the characteristics of the perspective timetable, it is necessary to know not only the probability of the train running but also the probability of the given sequence of trains running. Probability is a relative quantity; therefore, instead of the probability of a sequence of trains, it is more appropriate to work with the frequency of their occurrence.
The total occupation time of the interstation section by all trains, Σ b, is determined as the scalar product of the frequency table and the table of the shortest occupation times. In addition, null values can be omitted. In the case of a procedure based on the use of probability theory and mathematical statistics, the buffer times play an important role. The average occupancy per train is calculated as follows:
The average buffer time is calculated as follows:
Subsequently, it is necessary to check the feasibility of the perspective timetable by comparing the detected average buffer time with the minimum buffer time value. The feasible train traffic diagram is when mr > mt. Subsequently, it is possible to calculate the throughput efficiency and its qualitative indicators S and Kp.
If the relationship
mr ≥
mt is fulfilled, i.e., the average buffer time is greater than the minimum buffer time, we can consider inserting additional train paths of average trains according to the same principles as in the ŽSR methodology, but with the difference that we do not look for buffer times for inserting train paths in the timetable but have to derive them on the basis of knowledge of the laws on the distribution of buffer times. The analysis of many realised timetables shows that the distribution of buffer times in the train diagram is governed by an exponential probability distribution, and its density has the following form [
29]:
The abundance corresponding to this probability density is then given by the following:
where
p(z) is the probability [×100%],
h(z) is the frequency [number of buffer times],
N is the number of all trains on the section [trains],
α is the ratio of the specific (variable) buffer time to the average buffer time.
The coefficient α is determined by the following ratio:
where
mri is the buffer time for the specific i-train [min],
mt is the needed (minimal) buffer time [min].
In a normally filled timetable, shorter and short buffer times will occur more often than longer. From a certain value, which, however, depends on the nature of the traffic, the size of the buffer time asymptotically approaches zero. If we know the distribution law of the distribution of buffer times, we can solve the task of determining the number of buffer time values in which a certain number of additional train paths can be inserted [
30].
2.4. Scientific-Research Methods
In current and future research in the area of railway infrastructure capacity and throughput, it is essential to know how to correctly and effectively use several existing methods that are used in several scientific and research activities. These are universal and generally applicable methods that must also be used within the mentioned research. In this case, they are, for example, the following:
Panel Expert Method: This is a forecasting technique that provides insights or recommendations about future options and needs related to a specific transportation topic based on input data. The method involves approximately 15–20 experts who collaborate on a particular issue over a defined period (ranging from 3 to 18 months). The final results are derived through joint compromises and collaborative scientific and professional research.
Heuristic Method: This method explores and uncovers new ways to solve problems and create new contexts. It is a scientific approach based on a “discovery” process, typically beginning with a general proposal or rough estimate, which is then refined over time. It represents a combination of empirical and precise methods.
FMEA (Failure Mode and Effect Analysis): FMEA is a fundamental analytical method used in quality management, reliability, and safety processes. It is a key technique in semi-quantitative risk analysis, applicable not only to production processes and products but also to services, financial systems, social systems, and other types of processes [
31].
As part of the issue of particular methods for railway infrastructure capacity determination, it is also necessary to take into account the mathematical-statistical principles and various mathematical methods such as the following:
Methods of abstraction and generalization—when creating mathematical formulas, empirical observations and data are often based on the field of railway operations, which lead to the creation of formulas that can subsequently be analysed and generalized.
Algebraic methods—the creation of mathematical formulas often involves the manipulation of algebraic equations, for example, using factorisation, principles of direct and indirect proportionality, expansion of binomial expressions, linear and non-linear equations, and formulas with linear or quadratic relationships between variables, which are very common and can be generated using basic algebraic techniques.
Numerical methods—formulas from the field of transport processes are often created using numerical methods that allow approximation of solutions when an analytical solution is not possible or practical (e.g., methods such as Newton’s method, finite difference methods); in certain cases, it is important to use interpolation methods (determining values between known points) and extrapolation (predicting values outside the data range) [
32].
3. Results
The results chapter will primarily focus on the proposal of a new methodology for the determination of the railway infrastructure capacity. This methodology will be a specific and unique intersection of current existing methods, which will be supplemented with other new ideas and scientific research principles and outputs. The basic principle will be that it will use the advantages of graphic and analytical methods as well as a new software application that is used in the conditions of the railway infrastructure manager in the Slovak Republic. The application, the outputs of which were presented in the paper, is not a typical simulation tool. In this case, it is a specific internal software application that was created by one of the authors (for the purposes of his own research) and allows the user to flexibly use railway network data and train timetable data and perform calculations on them according to the UIC 406 methodology and according to the Slovak Railways methodology.
This application helps us to implement several simulations and models on the railway infrastructure. Specific partial parts of this methodology will be theoretically explained within the framework of the heuristic procedure in
Section 3.3. For a better and comprehensible understanding, these individual steps will be immediately presented on a specific example, namely on the example of the railway line Bratislava–Dunajská Streda–Komárno in the southwestern part of the Slovak Republic, where there is currently a significant problem with insufficient capacity of the railway infrastructure. The characteristics of this railway line are briefly described in
Section 3.1. The most important current practical problems and bottlenecks in the field of railway operation are also presented on specific examples in
Section 3.2.
3.1. Description of the Railway Line
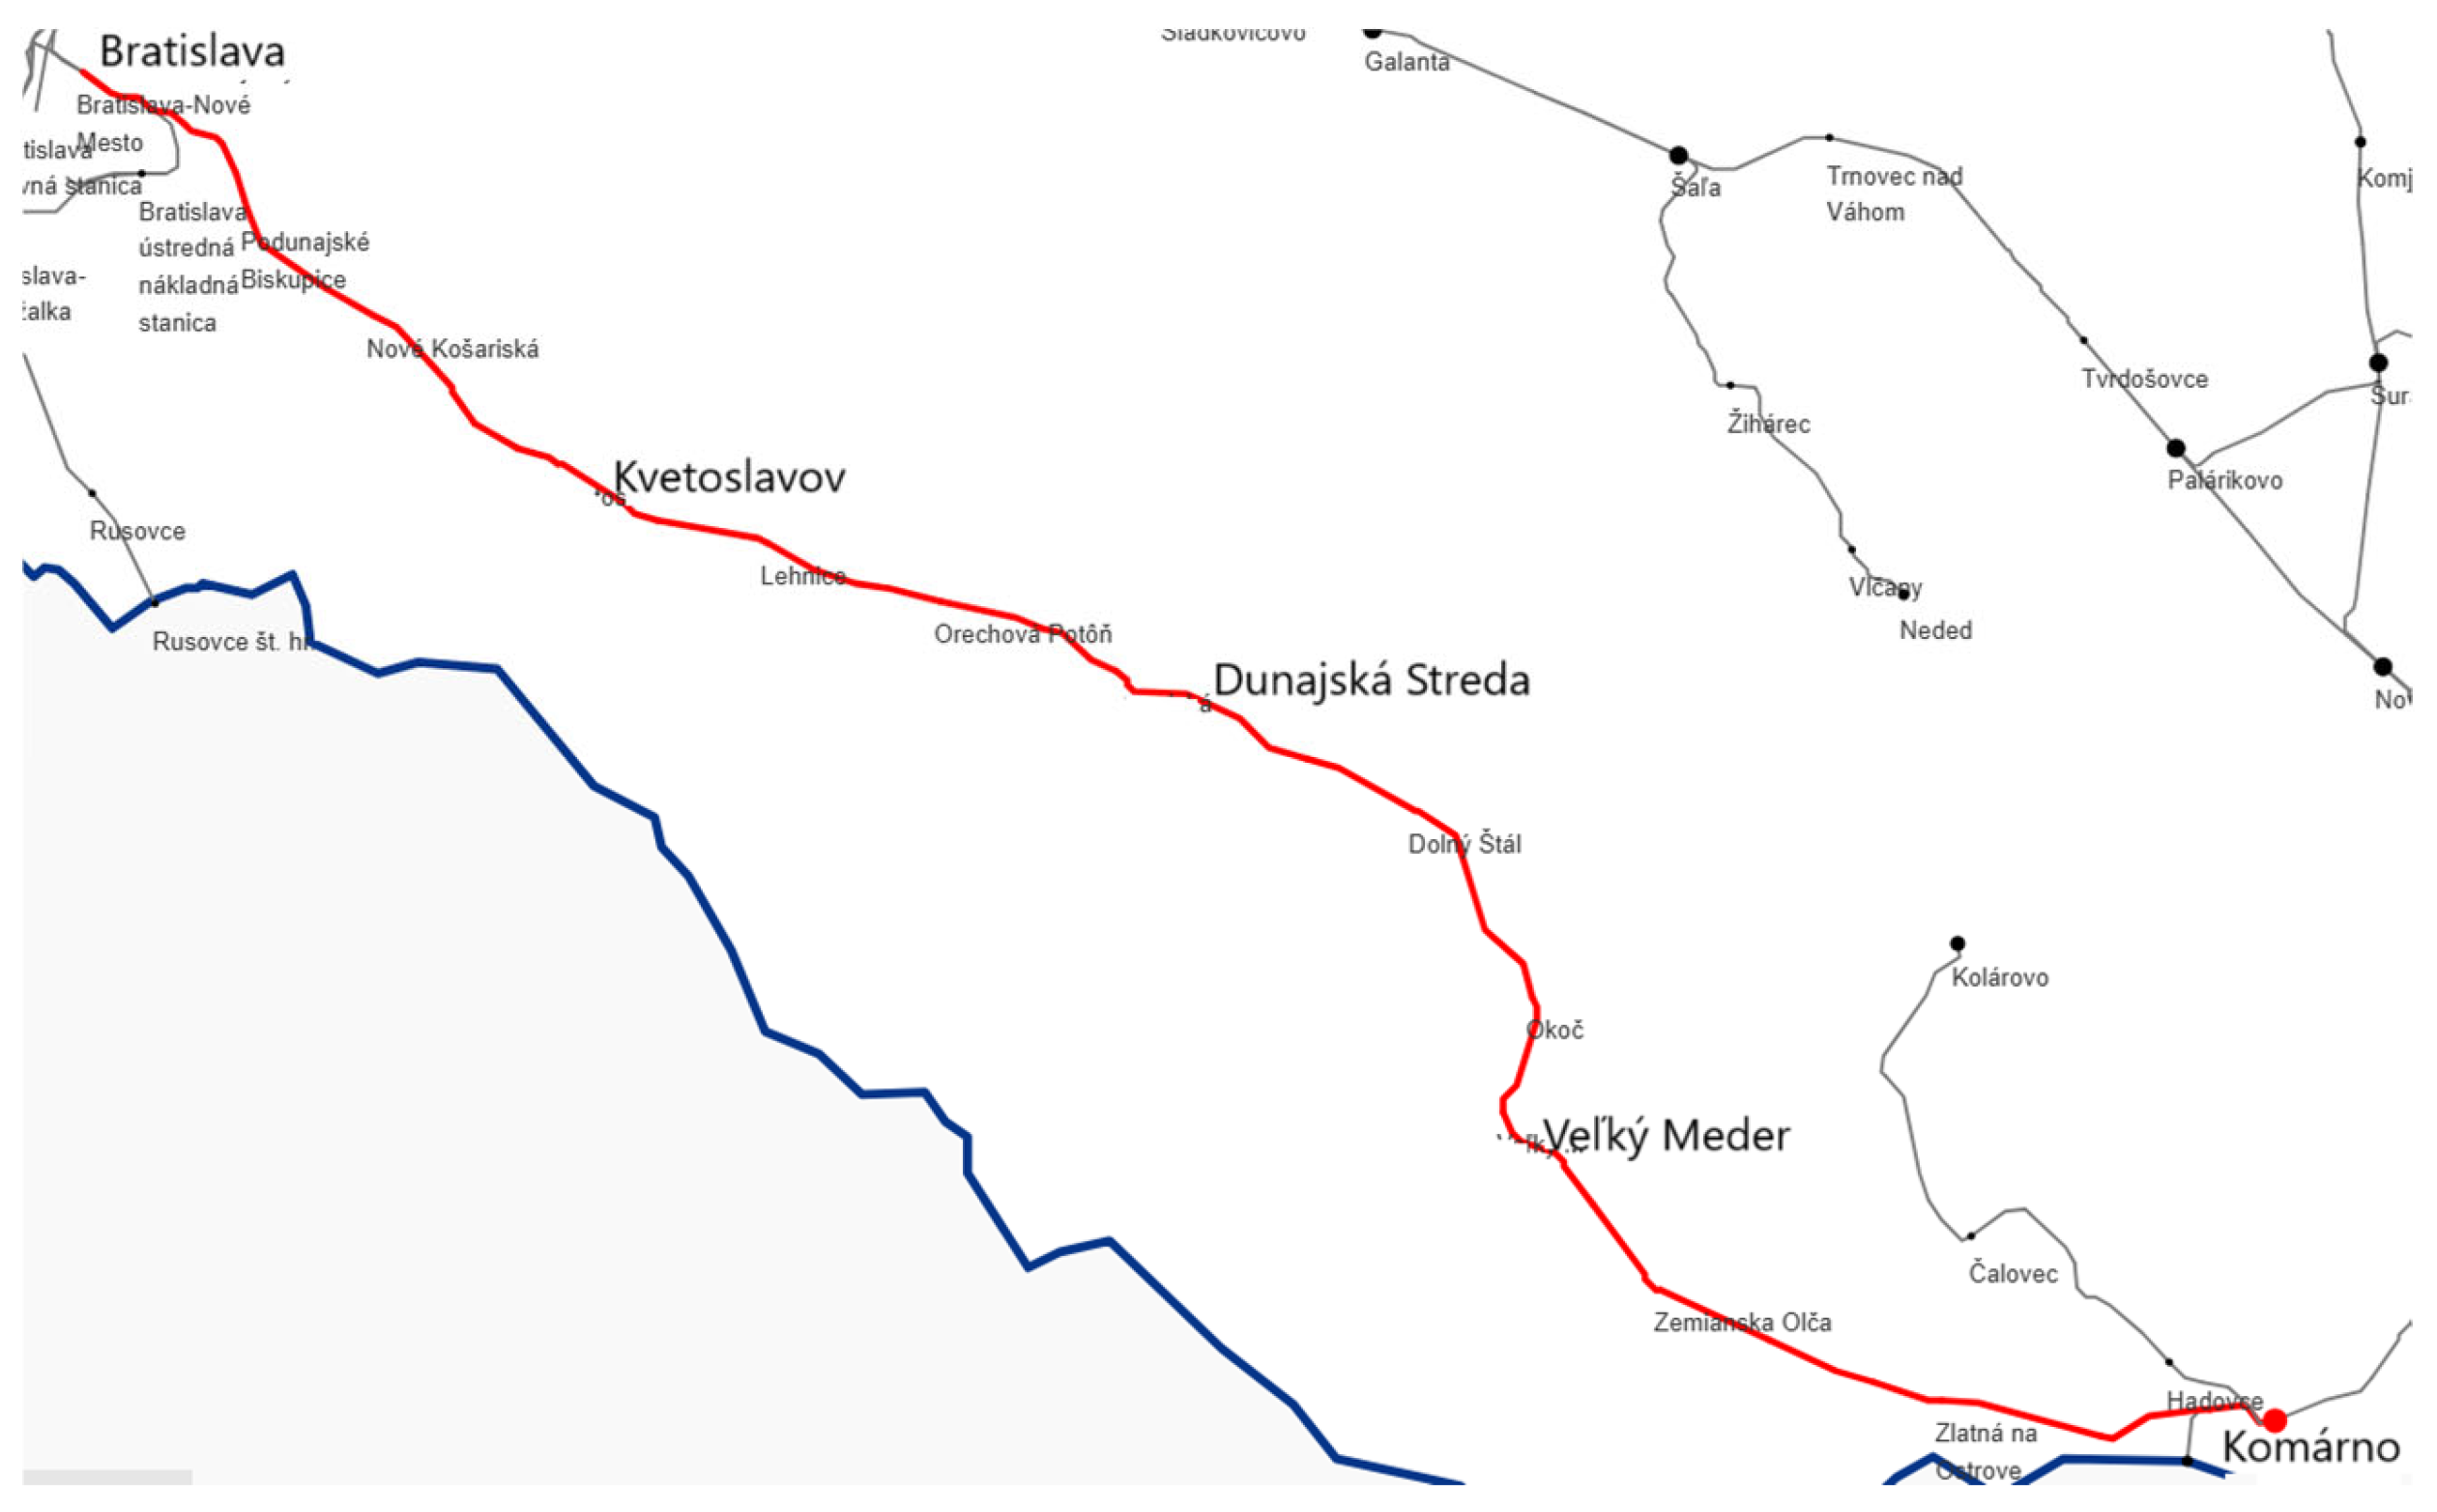
The railway line between Bratislava and Komárno is 100 km long. This railway is situated in the southwest part of Slovakia. A graphic representation of this railway is presented in
Figure 3. Based on official labelling of the examined railway routes, the line has number 124. In the public schedule examined, the line has number 131. The monitored railway is single-track, and the vast majority of it is not electrified. There are some stations that allow crossing trains. The maximal speed is 80 kmph with local restrictions. Passenger and freight transport are relatively dense, mainly between Bratislava and Dunajská Streda, as explained in
Figure 4. The worst situation is at the traffic peak in the morning and afternoon. Traffic saddle occurs at noon and at night. Based on the train traffic diagram shown in
Figure 3, freight transport is run mainly in the evening.
Control systems are very important to achieving railway safety. The most important control systems used are stations and route control systems that are focused on the railway infrastructure and train control systems. Depending on the control system and type of stations used, different amounts of time are needed to cross the trains. Between Bratislava and Dolný Štál, the station control system electronic gate or relay control device is used. A slightly worse situation is found between Dolný Štál and Komárno. There are older station safety devices in some stations. On all interstation sections, a semi-automatic block is used without divided sections. Important factors are the numbers of traffic tracks at the stations and their length.
Regarding level access to platforms on the majority of stations, there is a need to plan the transport so that freight train are not sent to tracks with platforms [
33].
3.2. Current Bottlenecks of the Railway Line
The current problematic bottlenecks on the mentioned railway line mainly consist of the insufficient capacity of the railway infrastructure.
Section 3.2.1 describes selected capacity indicators of the monitored railway line and
Section 3.2.2 describes the examples of selected situations of operative management on this railway line.
3.2.1. Capacity of the Railway Line
The capacity of the railway is the main assumption of fluency, and the stability of the train traffic diagram is its correct composition, which is evaluated by its capacity (throughput). The capacity of the railway infrastructure is given by the number of train paths that can be planned in a certain time period on a certain part of the railway infrastructure, given the heterogeneity of train types and the required quality of train services.
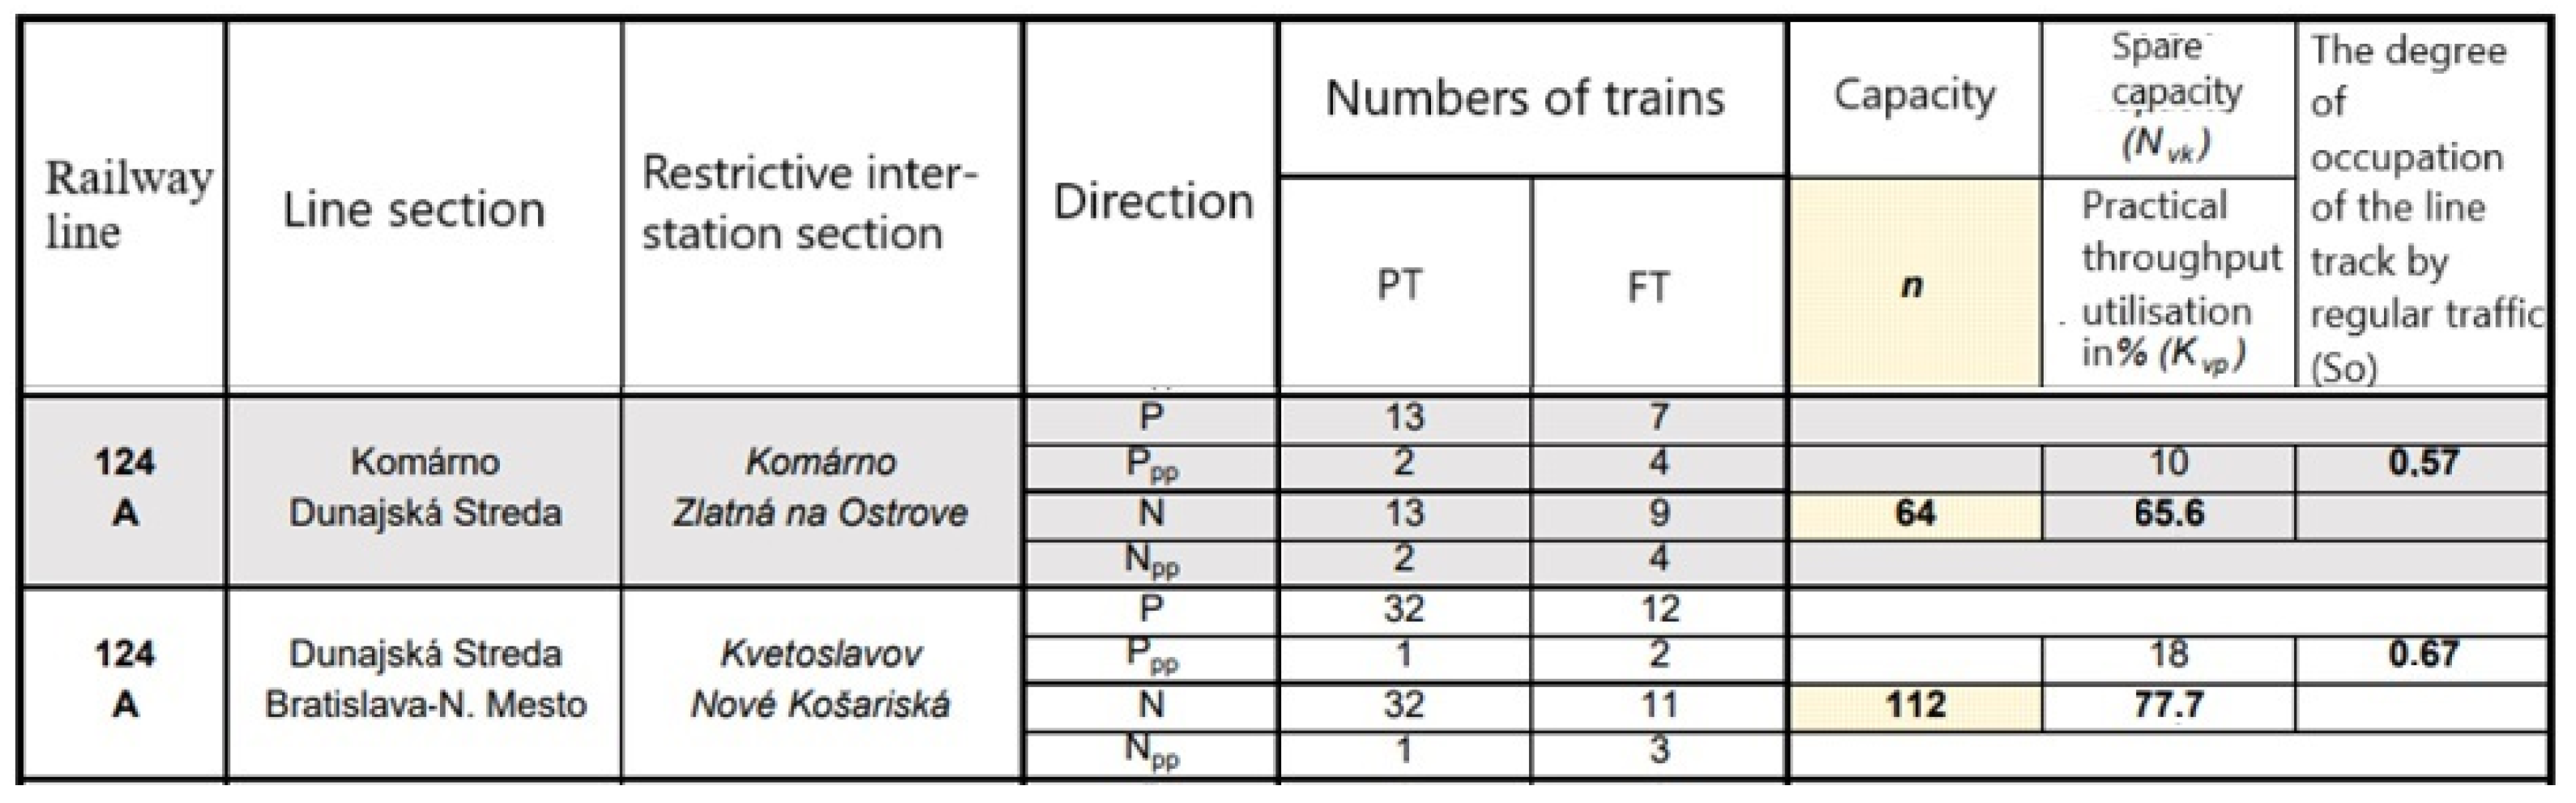
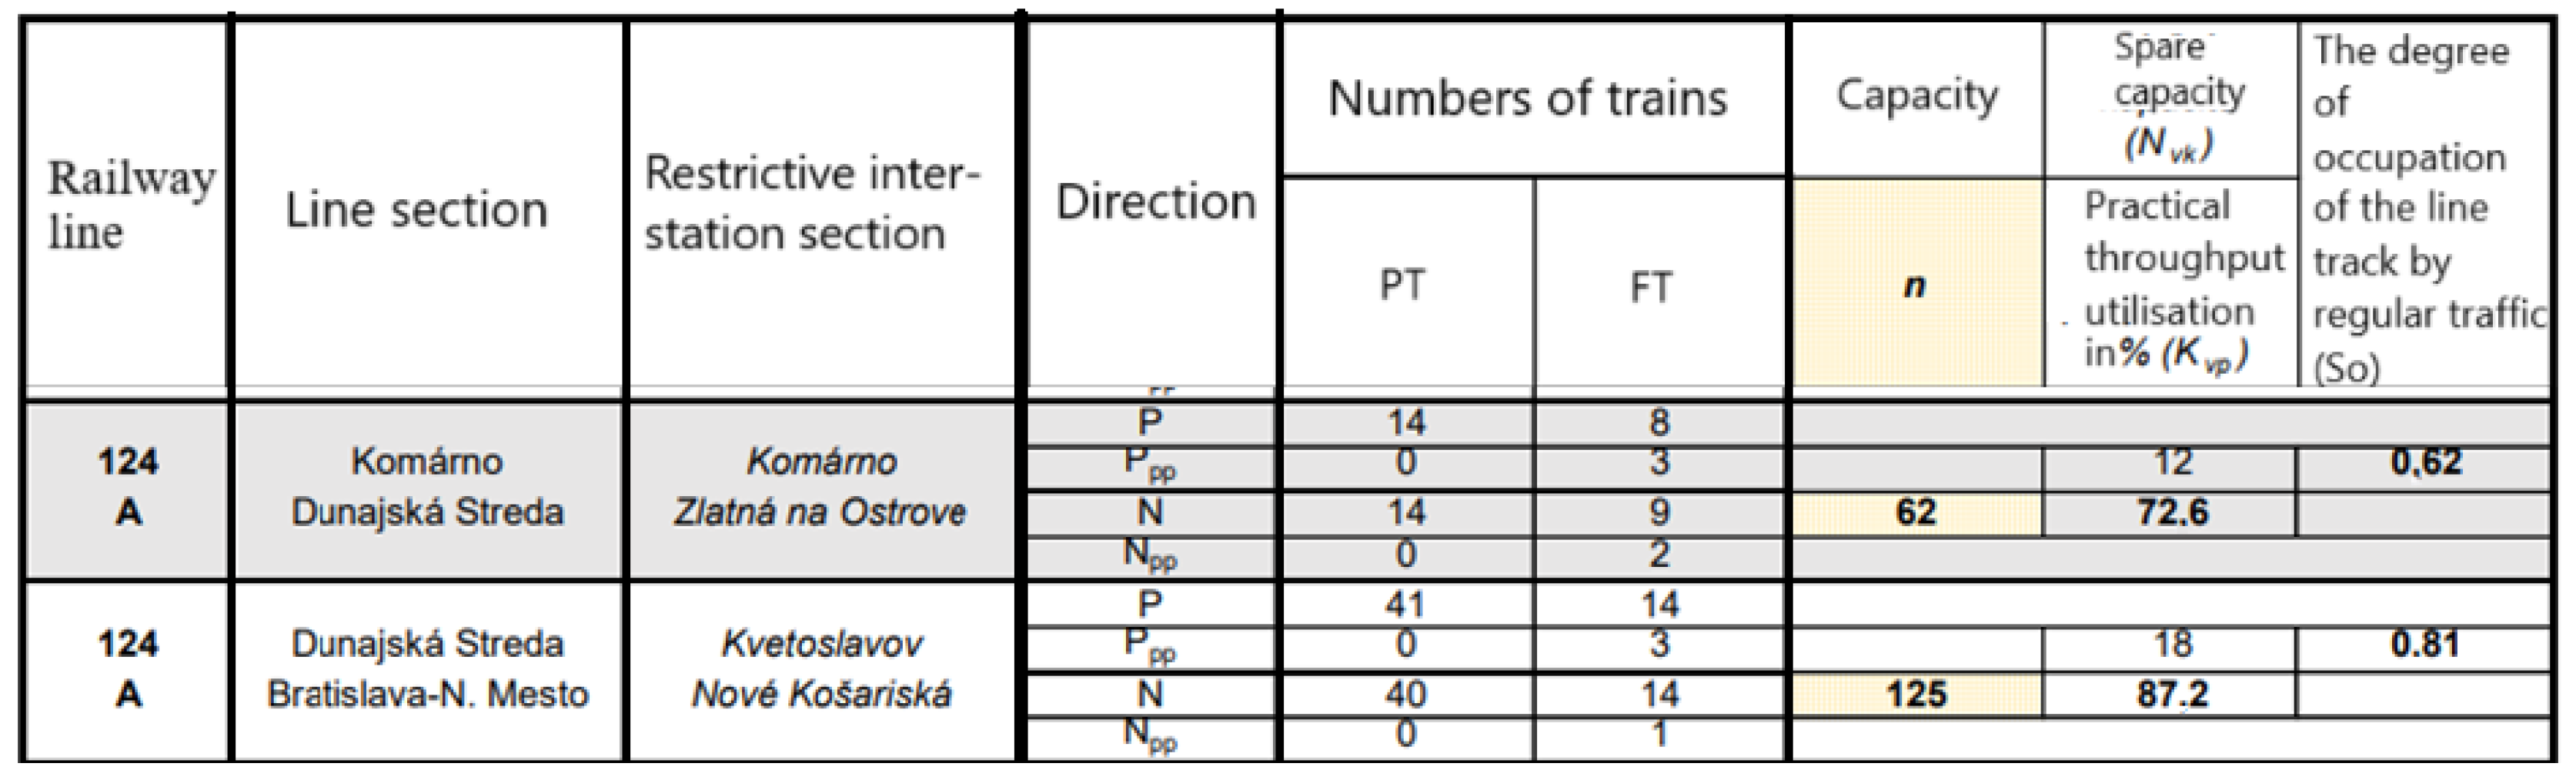
The capacity of the railway infrastructure for all railway networks and for selected sections is published in supplement 4.5.B of the conditions of use of the railway network (CURN) for the annual timetable period. The stimulus of operator METRANS was an increase in passenger train performances in 2024. The increase was mainly between Bratislava Nové Mesto and Dunajská Streda. These increasing complications transfer their NEx freight trains on this line. The increase in performances and using capacity is published in a cutout of supplement 4.5.B CURN, where the restrictive interstation section determines the capacity of total track sections [
33].
The capacity of the monitored railway line for timetable period 2022/2023 is shown in
Figure 4:
Figure 4.
The capacity of the monitored railway line for timetable period 2022/2023 [
33].
Figure 4.
The capacity of the monitored railway line for timetable period 2022/2023 [
33].
The capacity of the monitored railway line for timetable period 2023/2024 is shown in
Figure 5:
The usability of occupation of the line track (the ratio between total time of direct occupation by trains and total calculated time) indicates the “degree of occupancy”. By regulation, ŽSR D242 is additionally occupied by operation devices that fundamentally consider the device, which has a degree of occupation so = 0.5 to 0.67.
The International Railway Union (UIC) in their edict UIC 406 Capacity recommends the values of time occupation (e.g., equivalent of our time occupation) for lines with mixed transport in the transport peak (usually a 2 h section) at a level of 75% and for all day at 60% (so equivalent to 0.75 or 0.6).
The supplement of degree of occupancy to the whole (value 1 or 100%) is the reserve intended for elimination of delayed trains (to stabilise timetable period back to planned condition) and also for maintenance of the railway infrastructure. This reserve should be in all-day evaluation on a level of 33–40%. By lowering the reserve, the dealing of trains is transformed to other trains, the elimination of delays has a longer duration, and the space for operational management is reduced.
In the timetable period 2023/2024, the line between Dunajská Streda and Bratislava-Nové Mesto by the methodology ŽSR D24, as well as UIC 406, according to the occupancy level value throughout the day of 0.81 or 81%, is clearly overloaded. The remaining equivalent of unoccupied time of 0.19, or 19%, is clearly an insufficient reserve in the sense of the above [
3].
3.2.2. The Examples of Selected Situations of Operative Management
All the above circumstances must be accepted and assumed by the primary station master and secondary traffic dispatcher. The operative solutions are usually unique and dependent on employers.
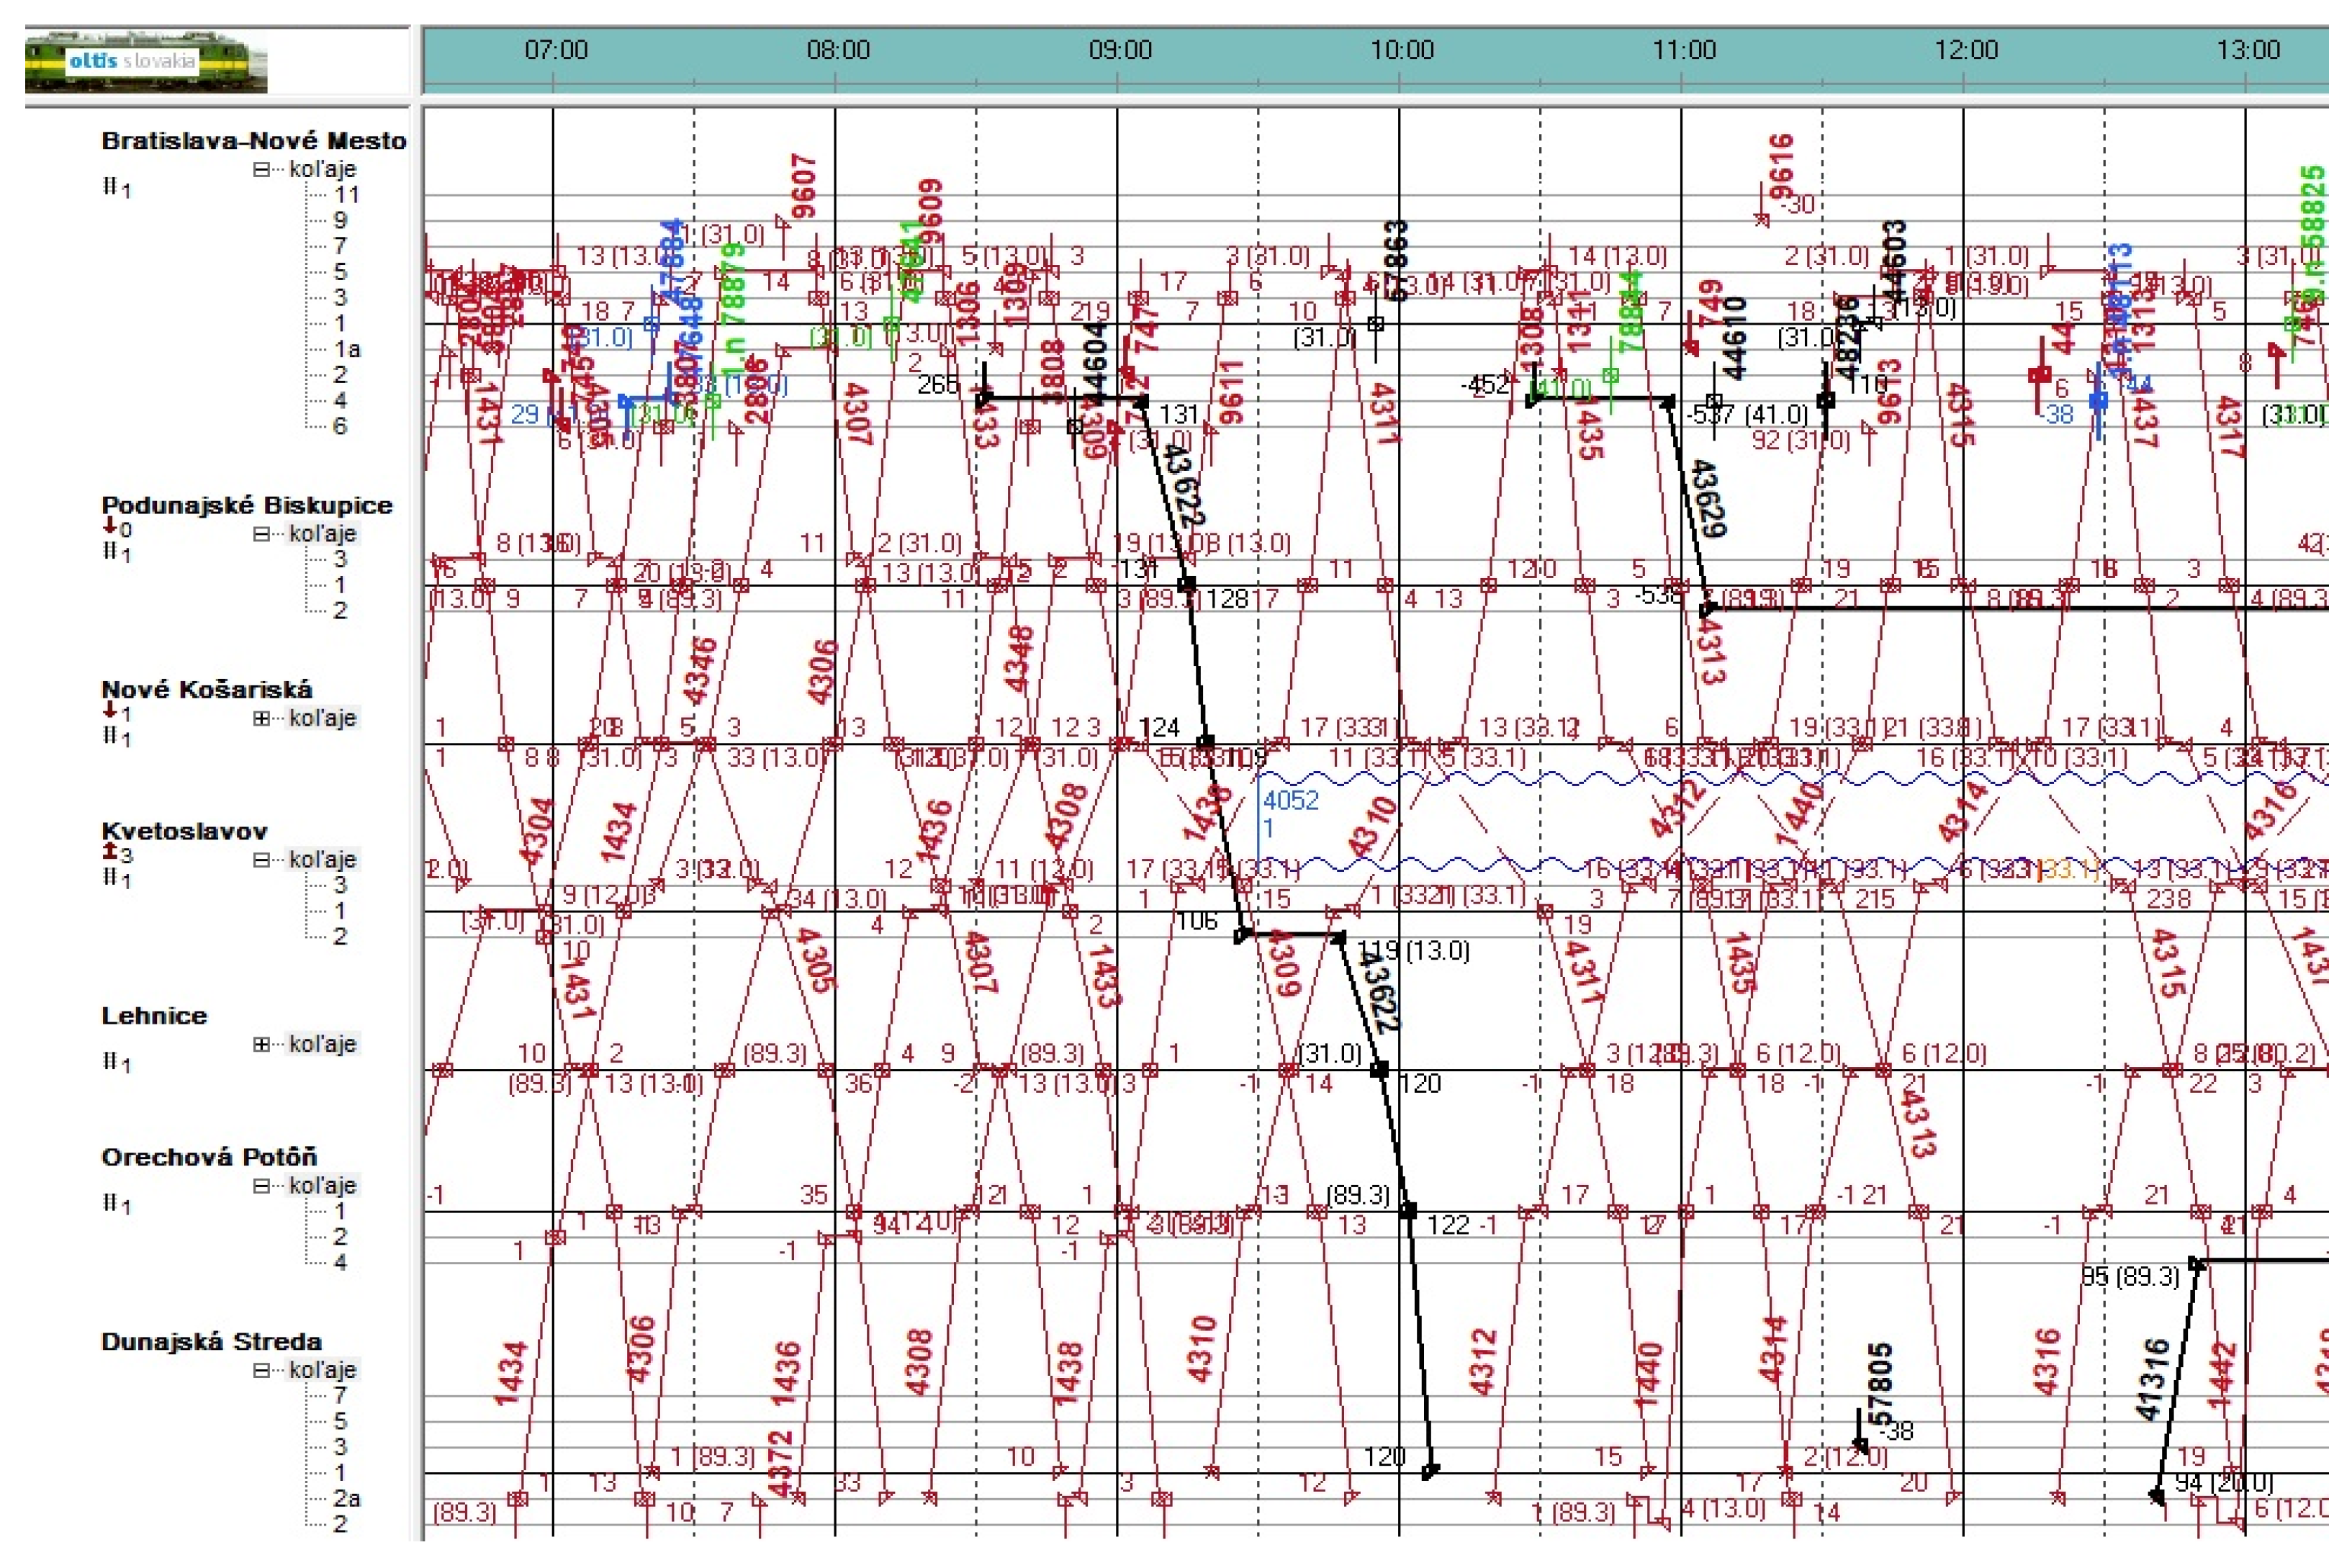
On the monitored railway line No. 124 between Bratislava Nové Mesto and Dunajská Streda in the timetable period 2023/2024, it generally applies that in extraordinary situations in passenger transport from 14:00 to 19:00, it is not possible to transport freight trains regarding the systematic timetable period and occupancy of stations’ tracks in the stations Kvetoslavov and Nové Košariská. For example, three situations were selected on the monitored line. On the cutout of the VDS (Train Dispatcher System), passenger trains are shown by red routes and freight trains by black routes [
33].
At the planned lockout between Kvetoslavov and Nové Košariská from 09:30 to 13:05 (blue wavy line in the section), passenger transport replacement by bus transport and by transfer to bus replacement transport resulted in delays of connections. There began an irregular traffic situation.
Before the lockout was transferred, NEx 43622 was delayed by 266 min in Bratislava Nové Mesto. This train came to Dunajská Streda with a delay of 120 min.
NEx 43629 was transferred to Podunajské Biskupice station with arrival at 11:06 and a head start of 538 min and with departure at 16:40 and a head start of 207 min.
NEx 41316 (with a length of 644 m) came to Orechová Potôň at 12:50 with a delay of 95 min. This train departed at 20:35 with a delay of 560 min caused by the operation of passenger trains and NEx 43629. Freight train 41110 (with a length of 646 m) departed from Dunajská Streda at 20:10 with a 451 min delay for the above reasons [
34]. Cutout from Train Dispatcher System from 29 January 2024 is situated in the
Figure 6.
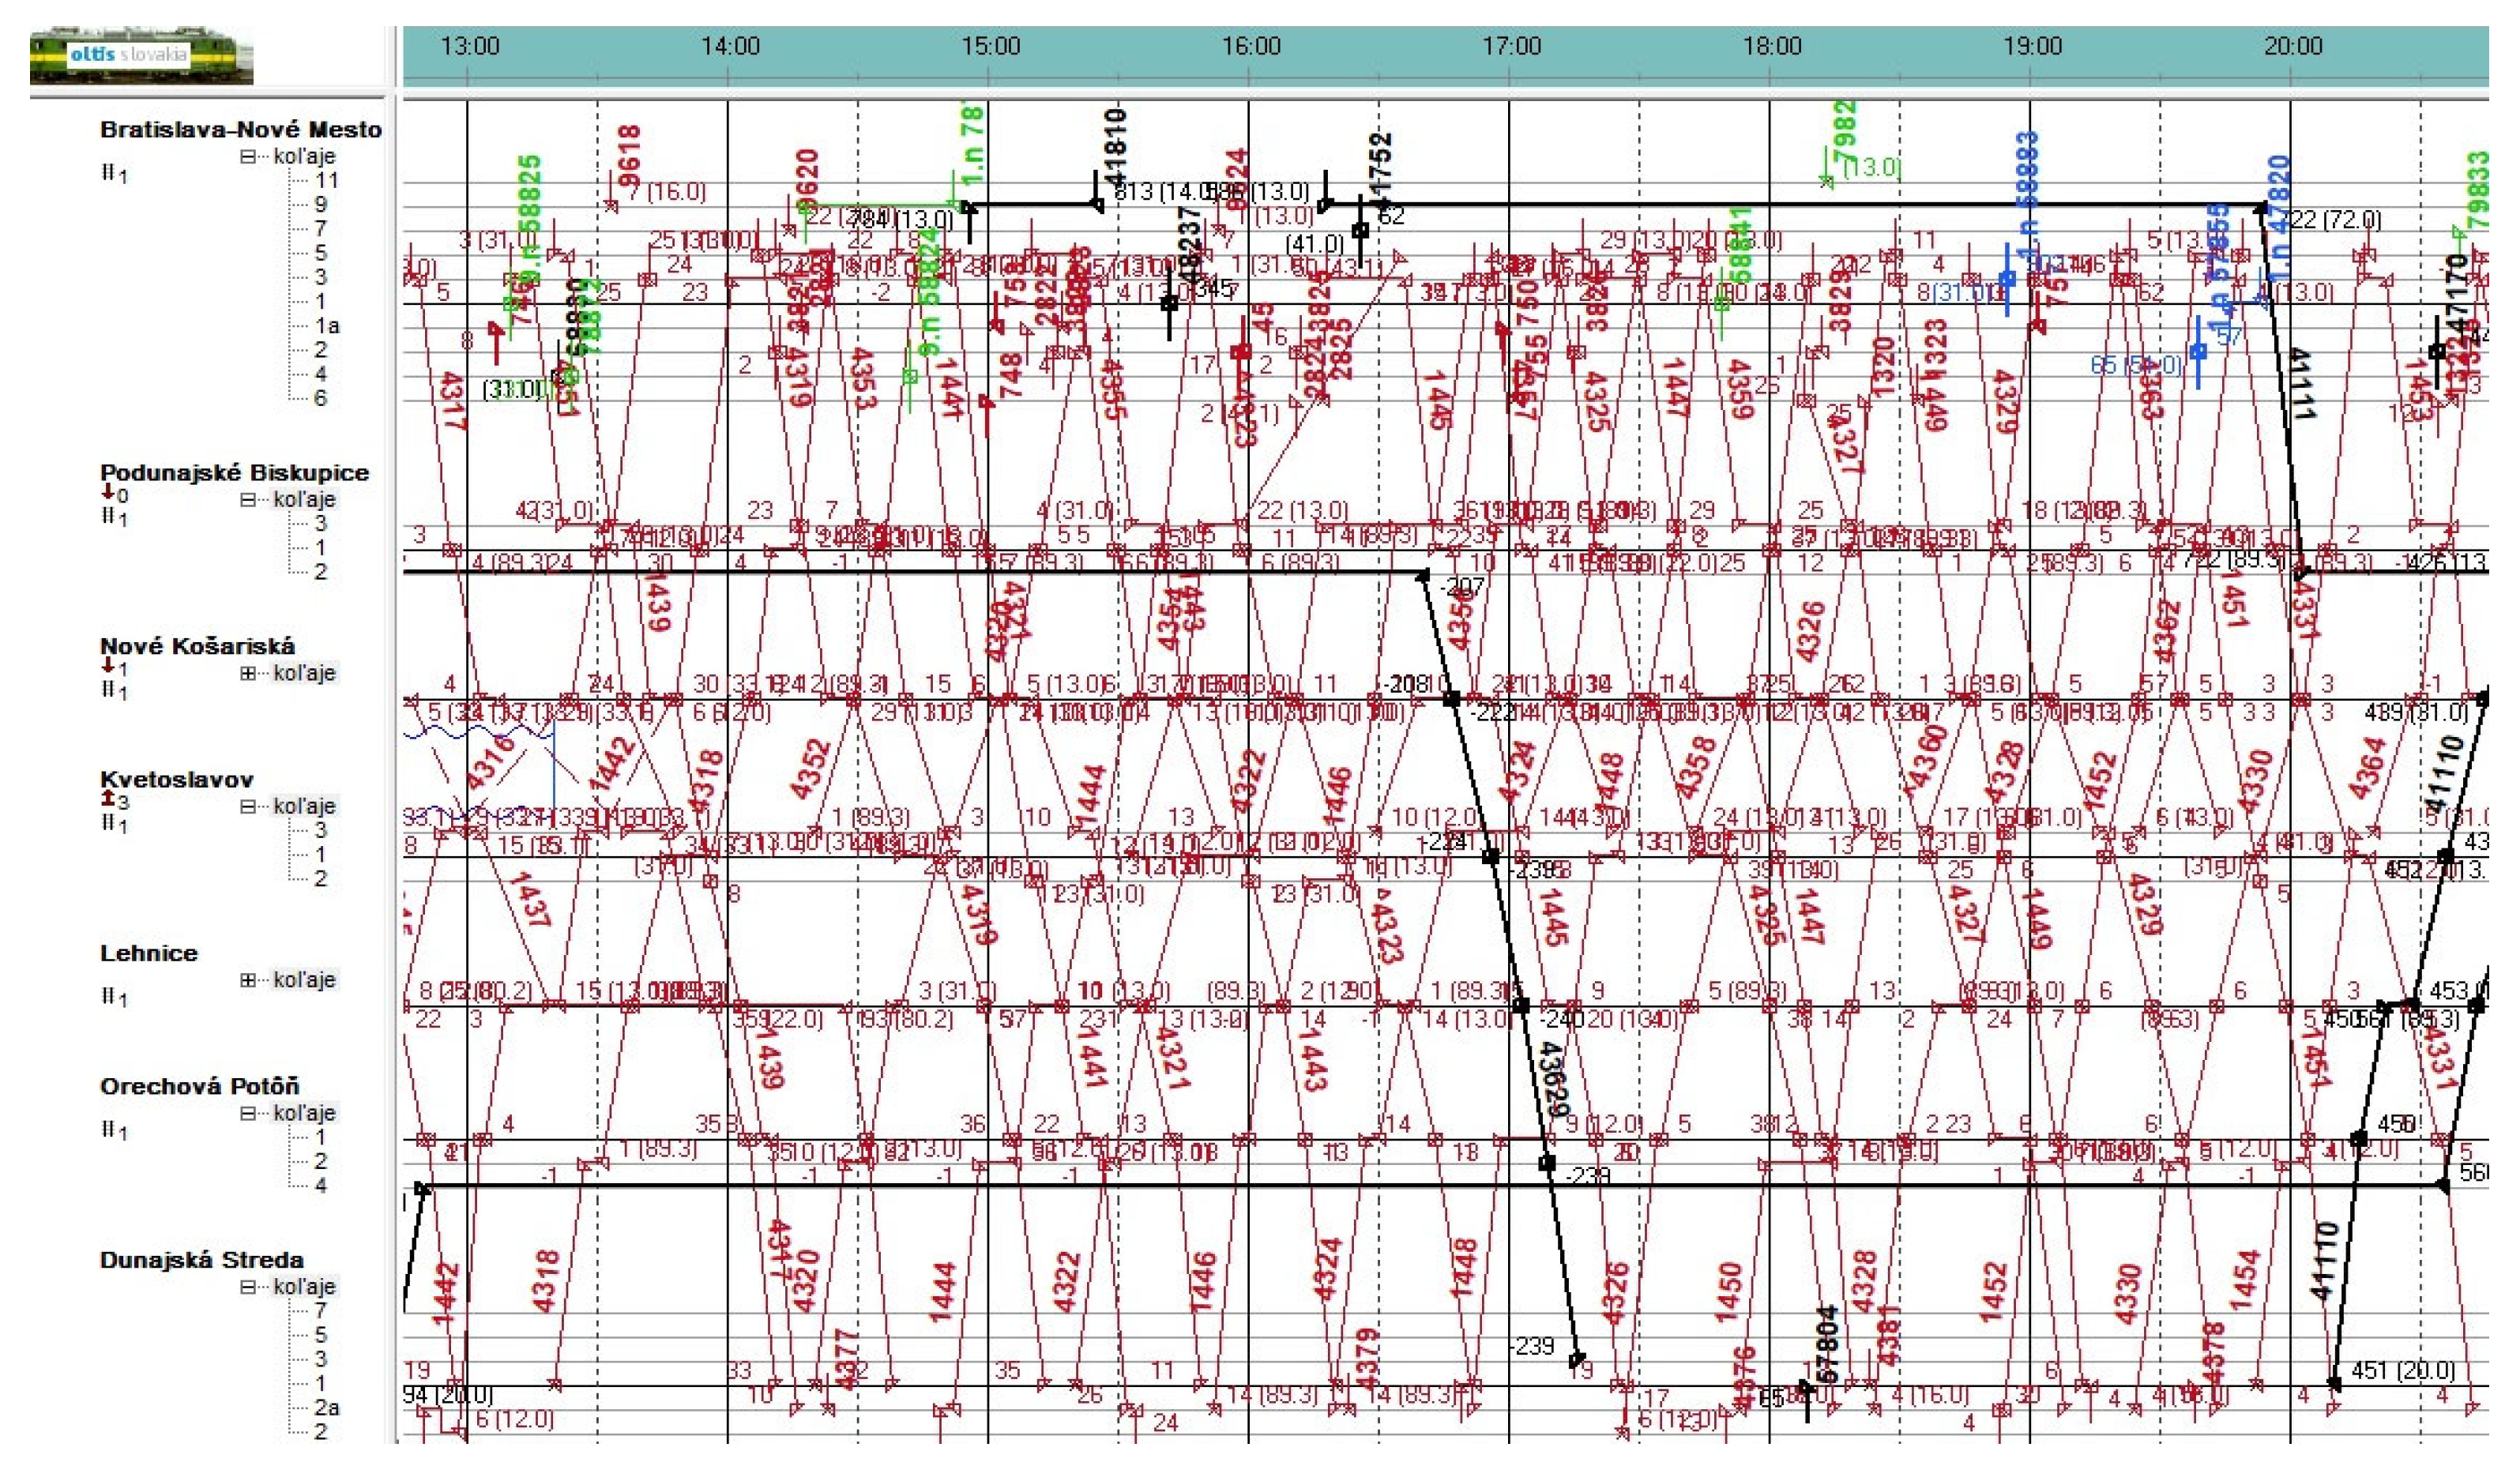
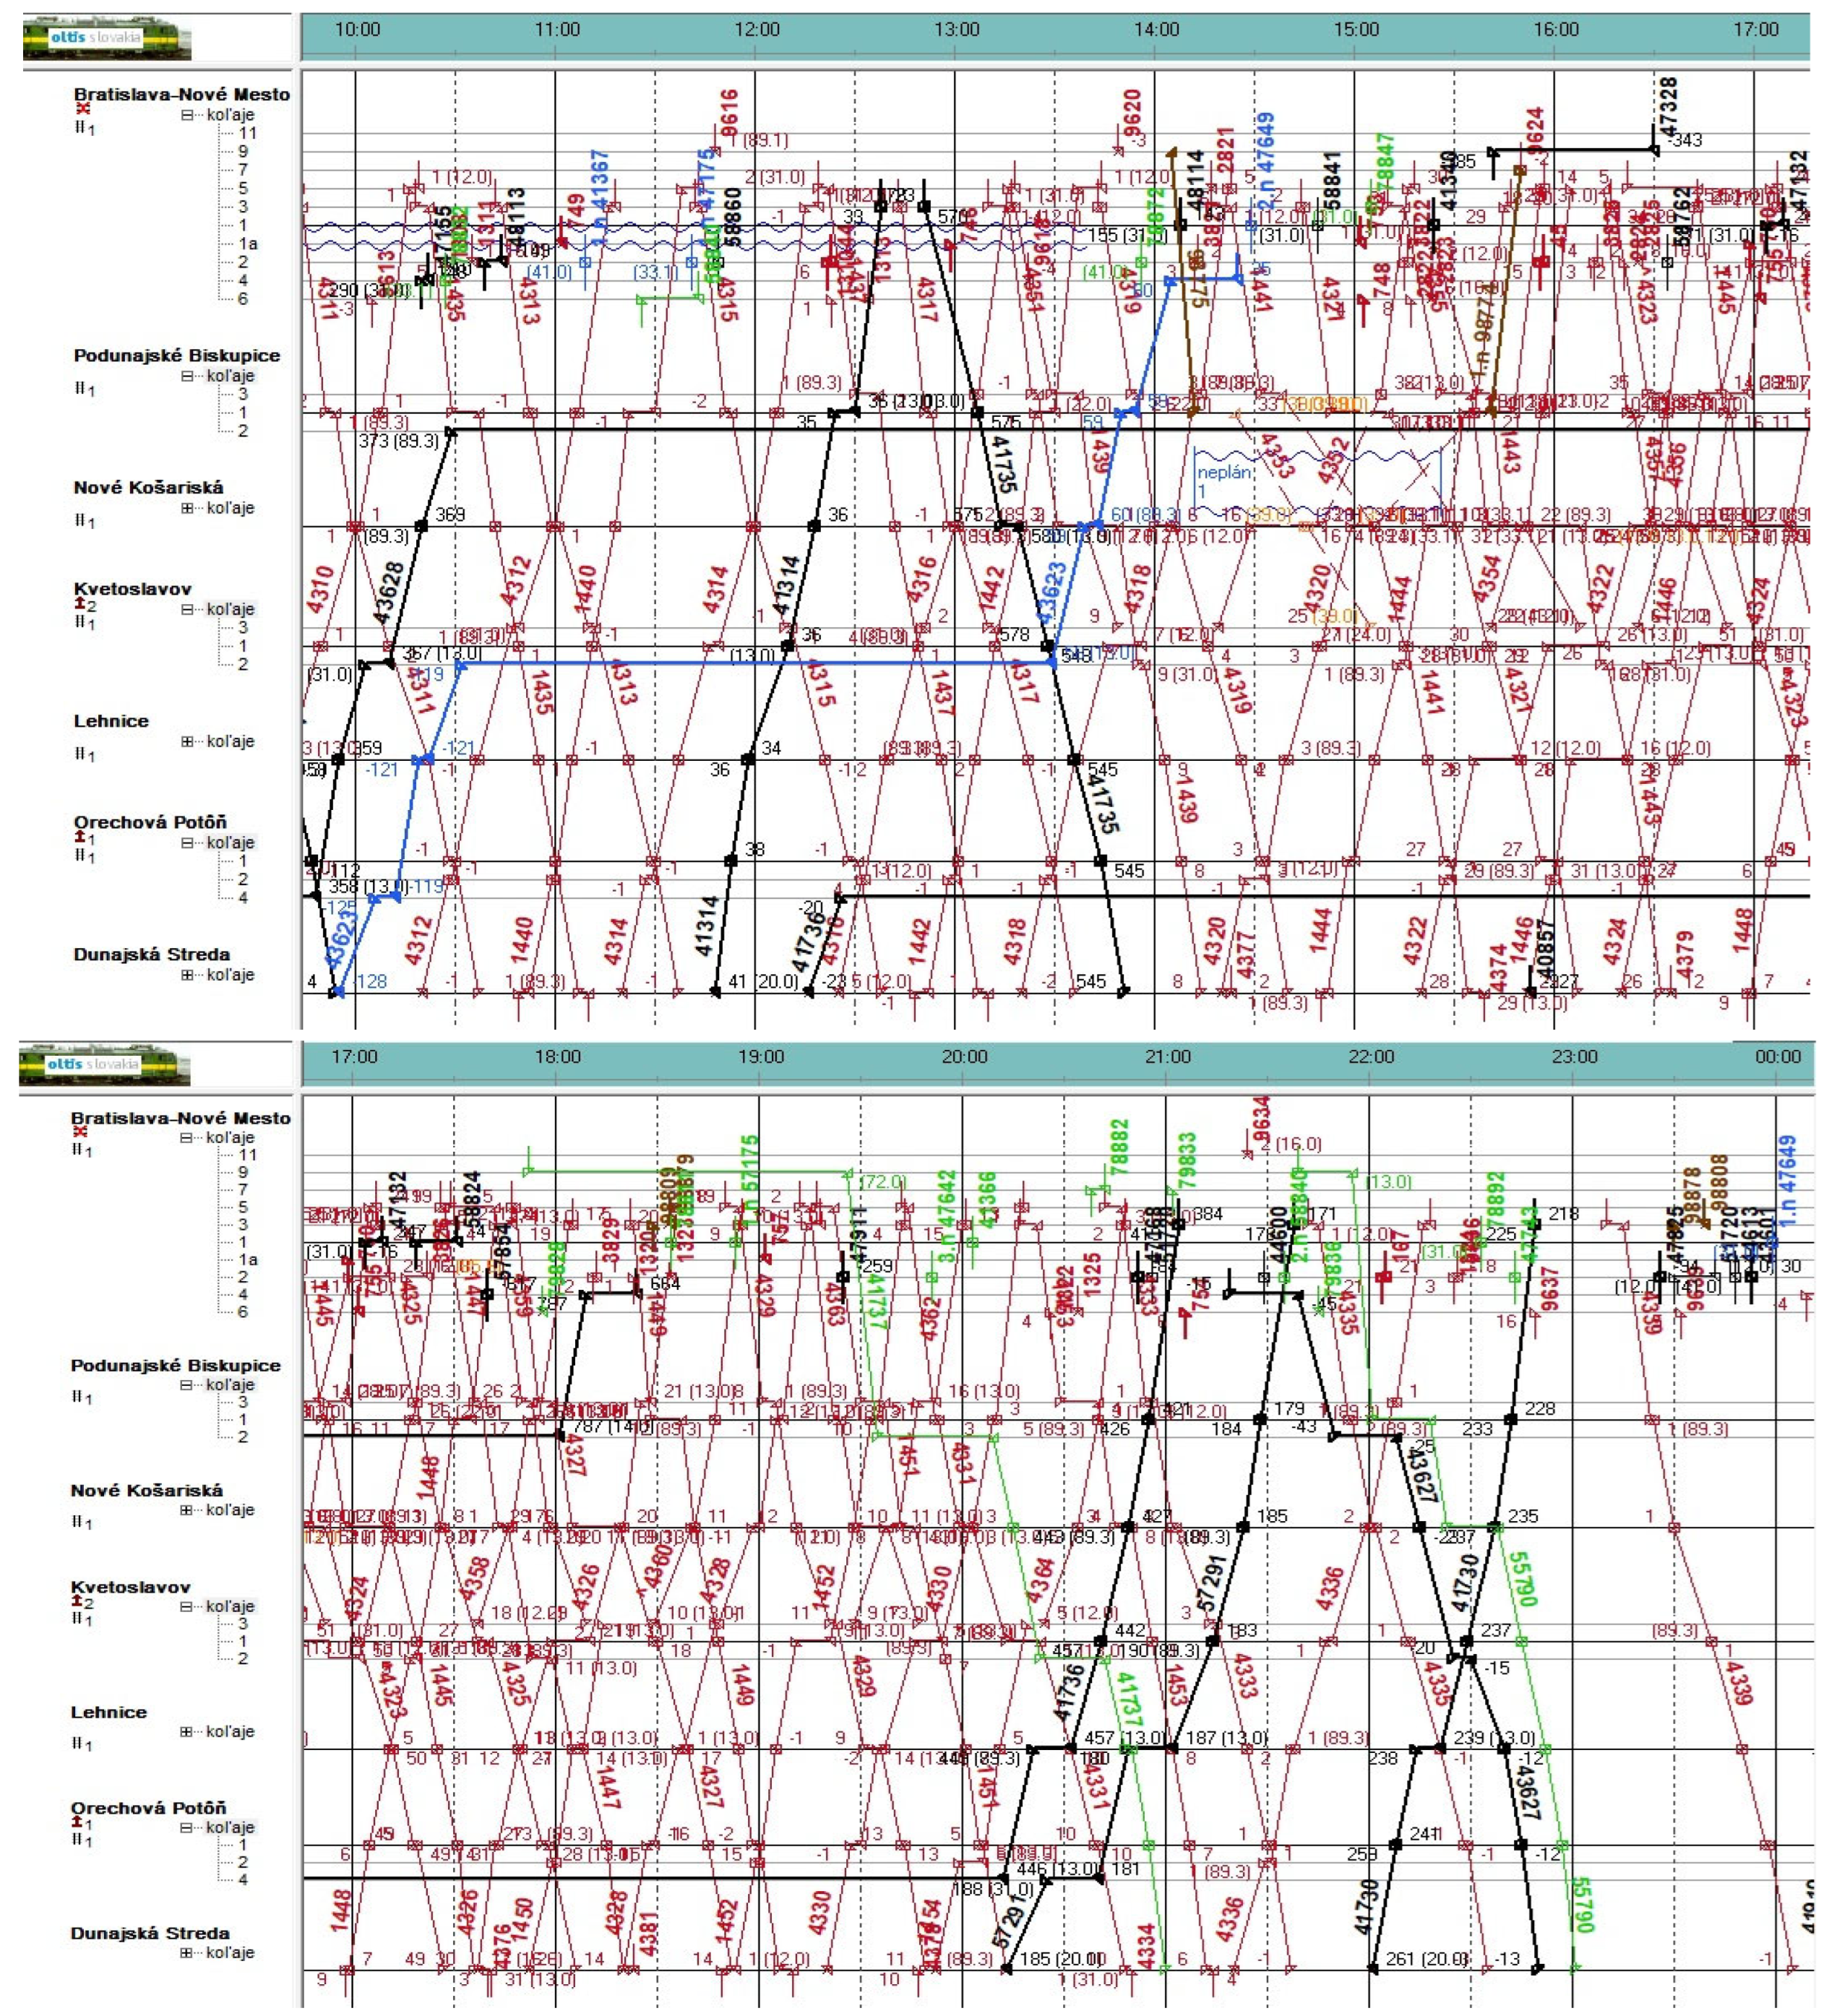
A non-planned lockout between Nové Košariská and Podunajské Biskupice from 14:12 to 15:25 (blue wavy line in section) and a planned lockout in Bratislava Nové Mesto station from 08:00 to 13:40 (blue wavy line in tracks) meant, for the freight trains of the METRANS operator, an inability to make the runaround manoeuvre from/to Bratislava Petržalka. In Podunajské Biskupice station, freight train 43628 was delayed 417 min because of a lockout in Bratislava Nové Mesto station.
The train NEx 41736 in Orechová Potôň station was delayed 446 min in the sequence of trackout from 12:26 to 20:12. Subsequently, there was a departure from Kúty station at 23:37 with a head start of 342 min.
The train NEx 57291 departed from Dunajská Streda station with a delay of 185 min due to the sequence of delayed passenger trains and the delaying of NEx 41736 (in Orechová Potôň). The train NEx 41730 departed from Dunajská Streda station with a delay of 261 min due to the sequence of the passenger trains and trains 41736 and 57291.
In time before the lockout, there were five NEx trains of operator METRANS that were transported, and those were 41731, 43628, 43623, 41314, and 41735. In conclusion, the main goal and task of the ŽSR is to provide the capacity of the railway line for all operators, not only at regular transport but also in extraordinary situations with compliance with the principles of operative management. At the same time, it is necessary to emphasise that all principles of management have different applications at the correct timetable period (sufficiently utilised facilities) and at difficult timetable periods (unstable, overloaded timetable period), taking into account its heterogeneity [
34]. Cutout from Train Dispatcher System from 7 February 2024 is situated in the
Figure 7.
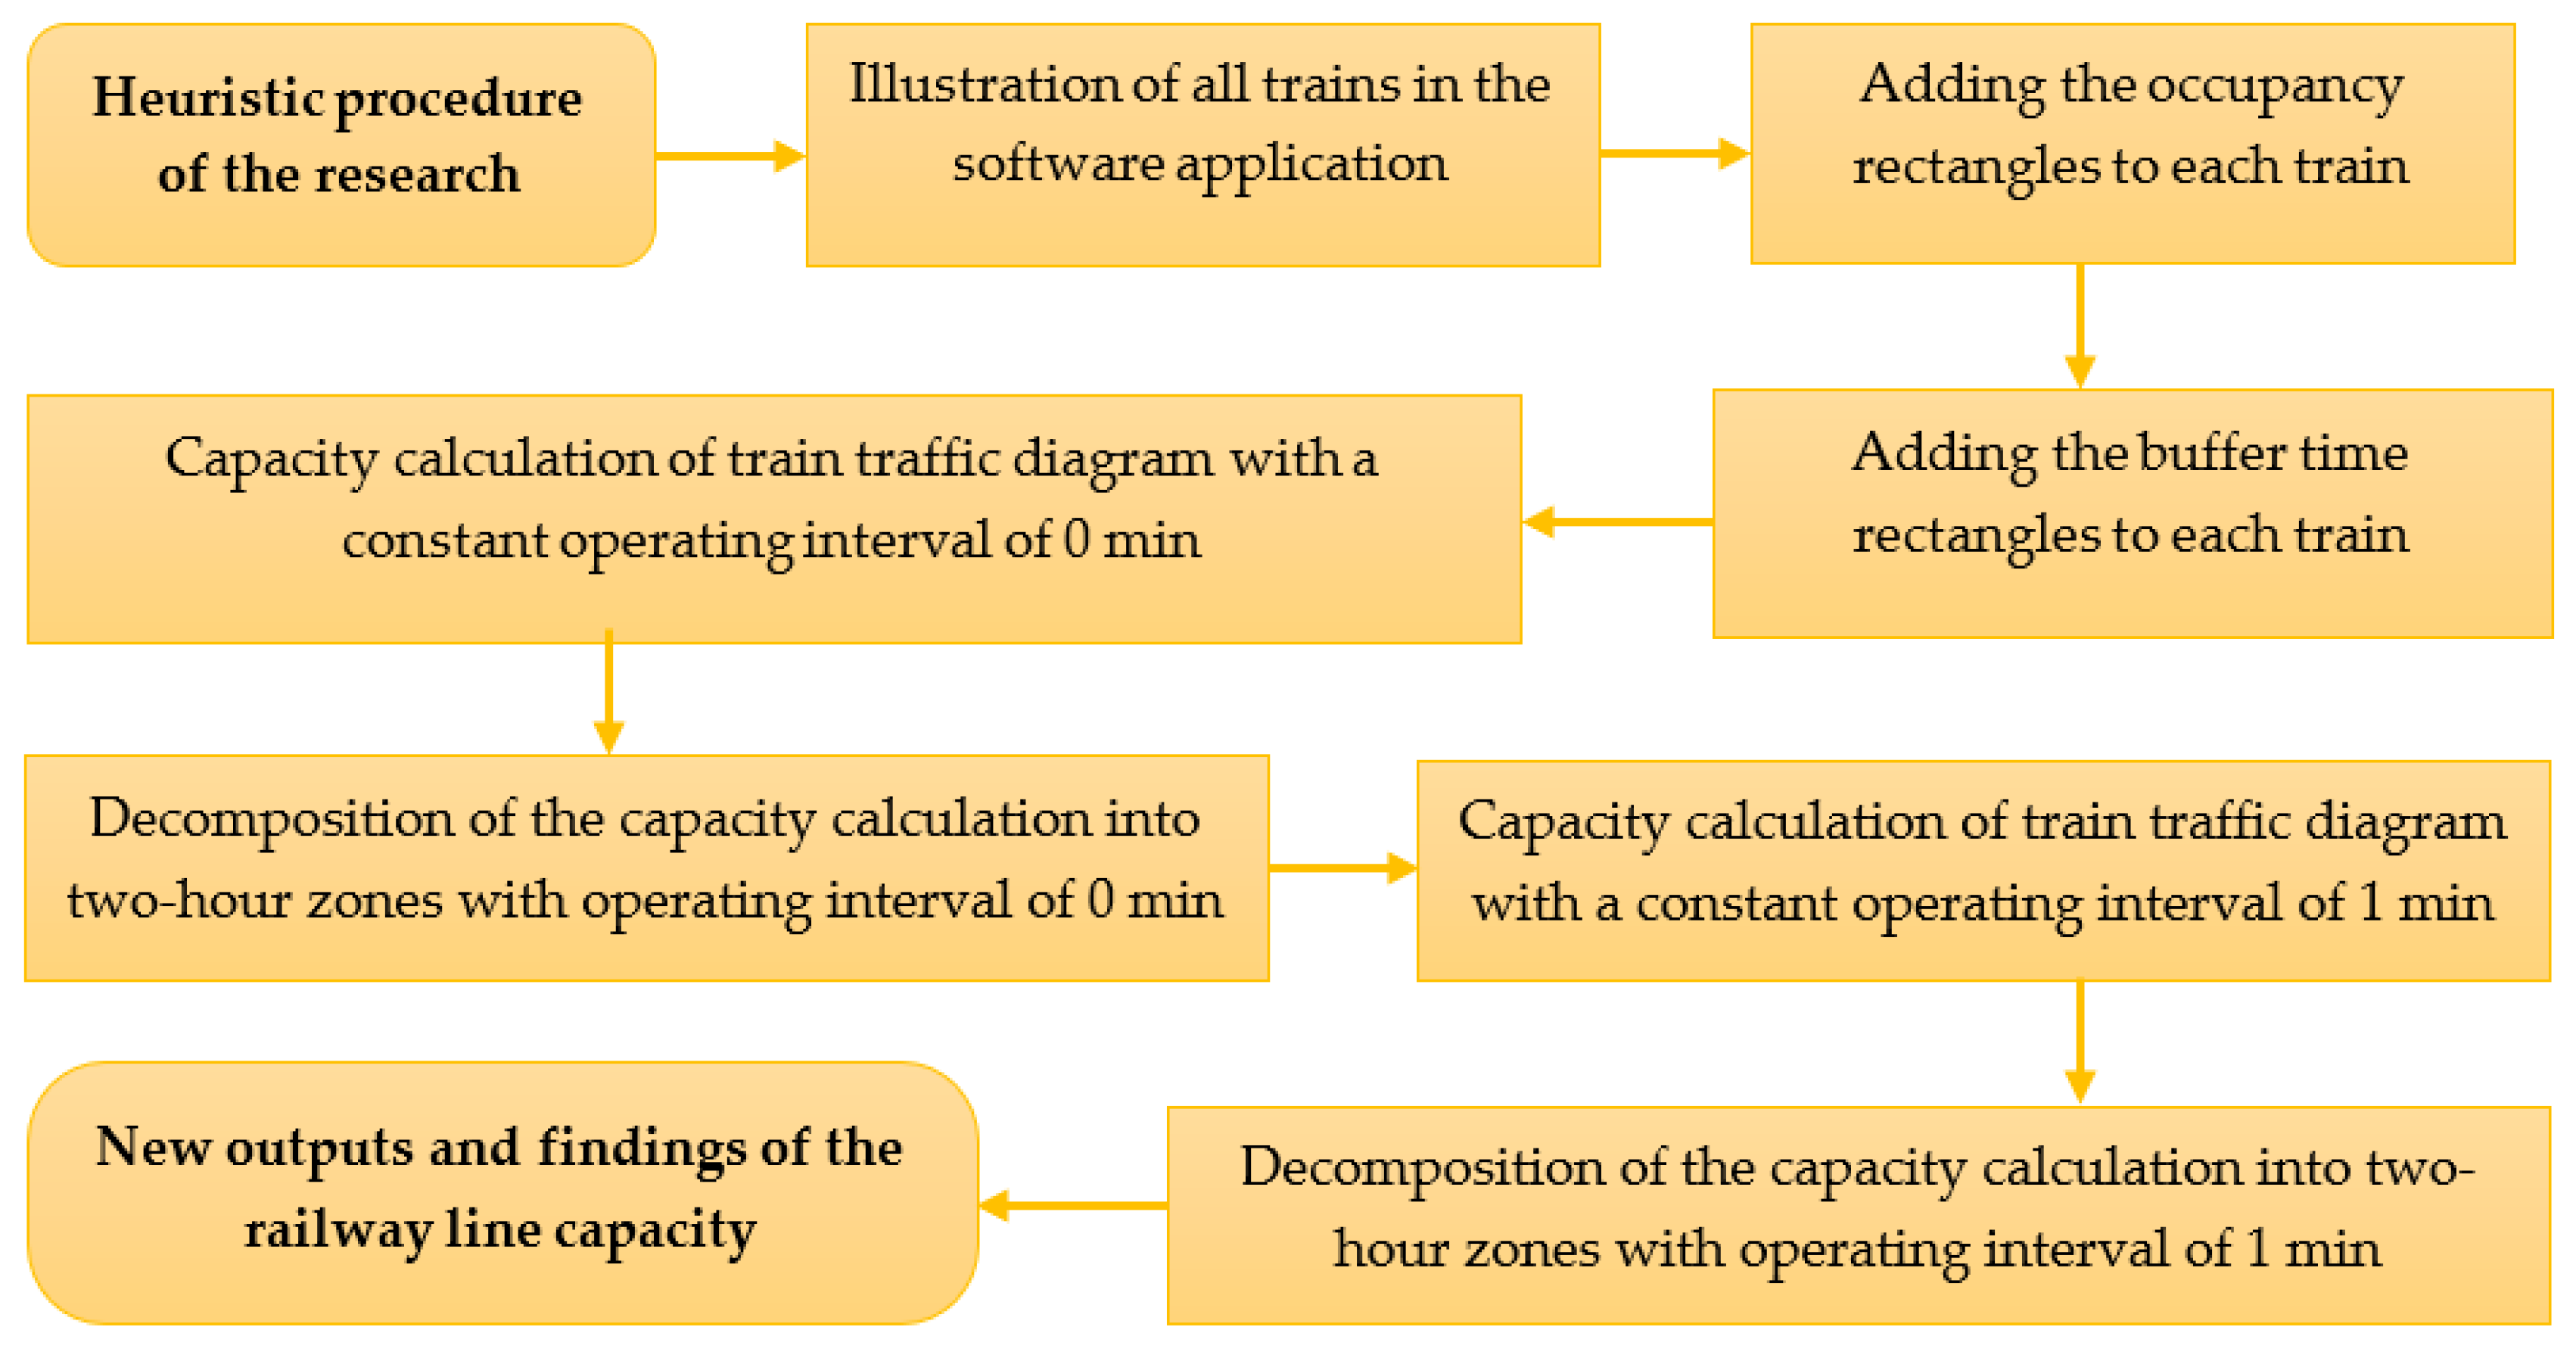
3.3. Proposal of a New Combined Method
The proposal part is largely based on heuristics, which includes methods of offering and discovering new ways of solving problems and inventing certain new contexts. It is a scientific activity based on a “discovery” procedure, which usually starts with a general proposal or some rough estimate which is gradually refined. Heuristic methods represent an intersection between empirical and exact methods. The proposed procedure is also based on this intersection, with some steps using exact methods or exact problem-solving procedures. The mentioned heuristic method is applied to the heuristic procedure in
Figure 8, including particular steps. In this case, the application of these methods is new, and the methods serve to identify individual partial steps of this heuristic procedure. The method combines the advantages of the graphical method and the method using software applications.
There are seven of these partial steps, and they follow each other. A specific explanation and description of individual parts are elaborated in
Section 3.3.1,
Section 3.3.2,
Section 3.3.3,
Section 3.3.4,
Section 3.3.5,
Section 3.3.6 and
Section 3.3.7. For a better understanding of the issue, all these partial steps are practically applied and explained on the concrete example of the railway line Bratislava–Komárno. Therefore, the particular steps within the individual subsections contain multiple calculations and graphic outputs.
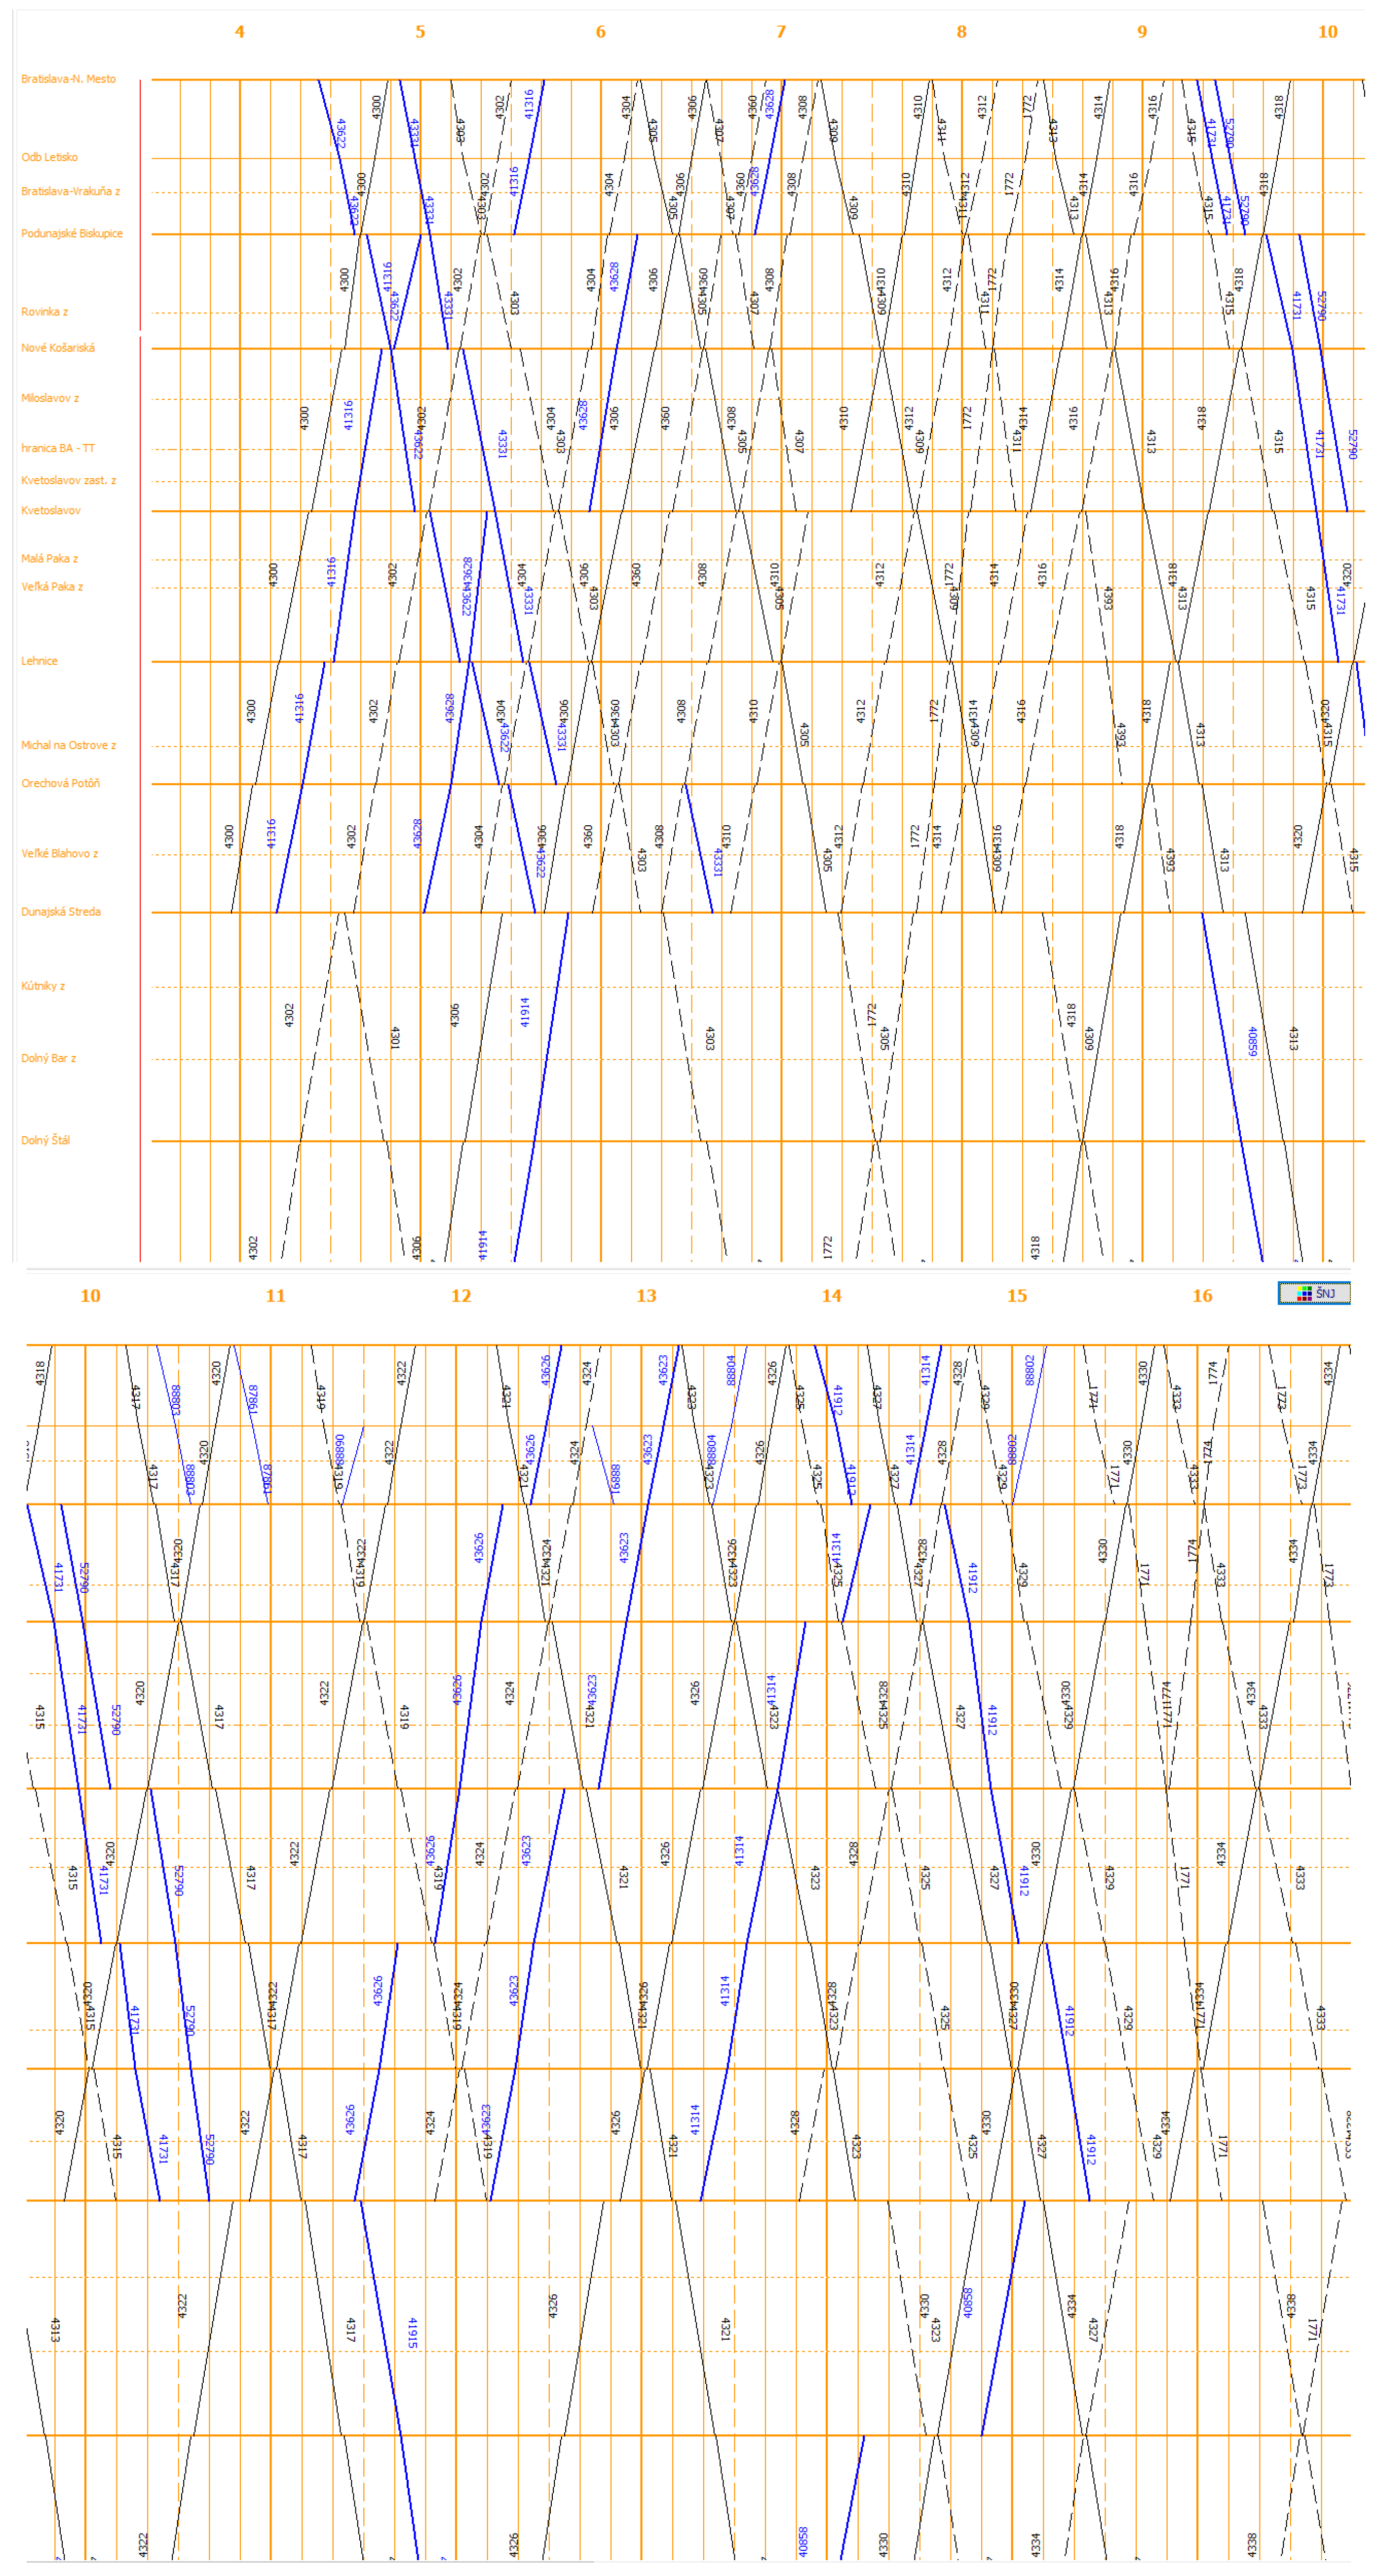
3.3.1. Illustration of All Trains in the Software Application
As part of the first partial step, it is necessary to mark all elements of the railway infrastructure on the mentioned railway line, including all railway stations and stops, in the software application. Subsequently, it is necessary to draw all trains (passenger and freight) that run on the mentioned railway line throughout the day. All parameters must be recorded in the context of the basic principles of train traffic diagram construction, including time data on the arrival, departure, or passage of the particular train. This will create the final train traffic diagram sheet. A section of the train traffic diagram is shown in
Figure 9.
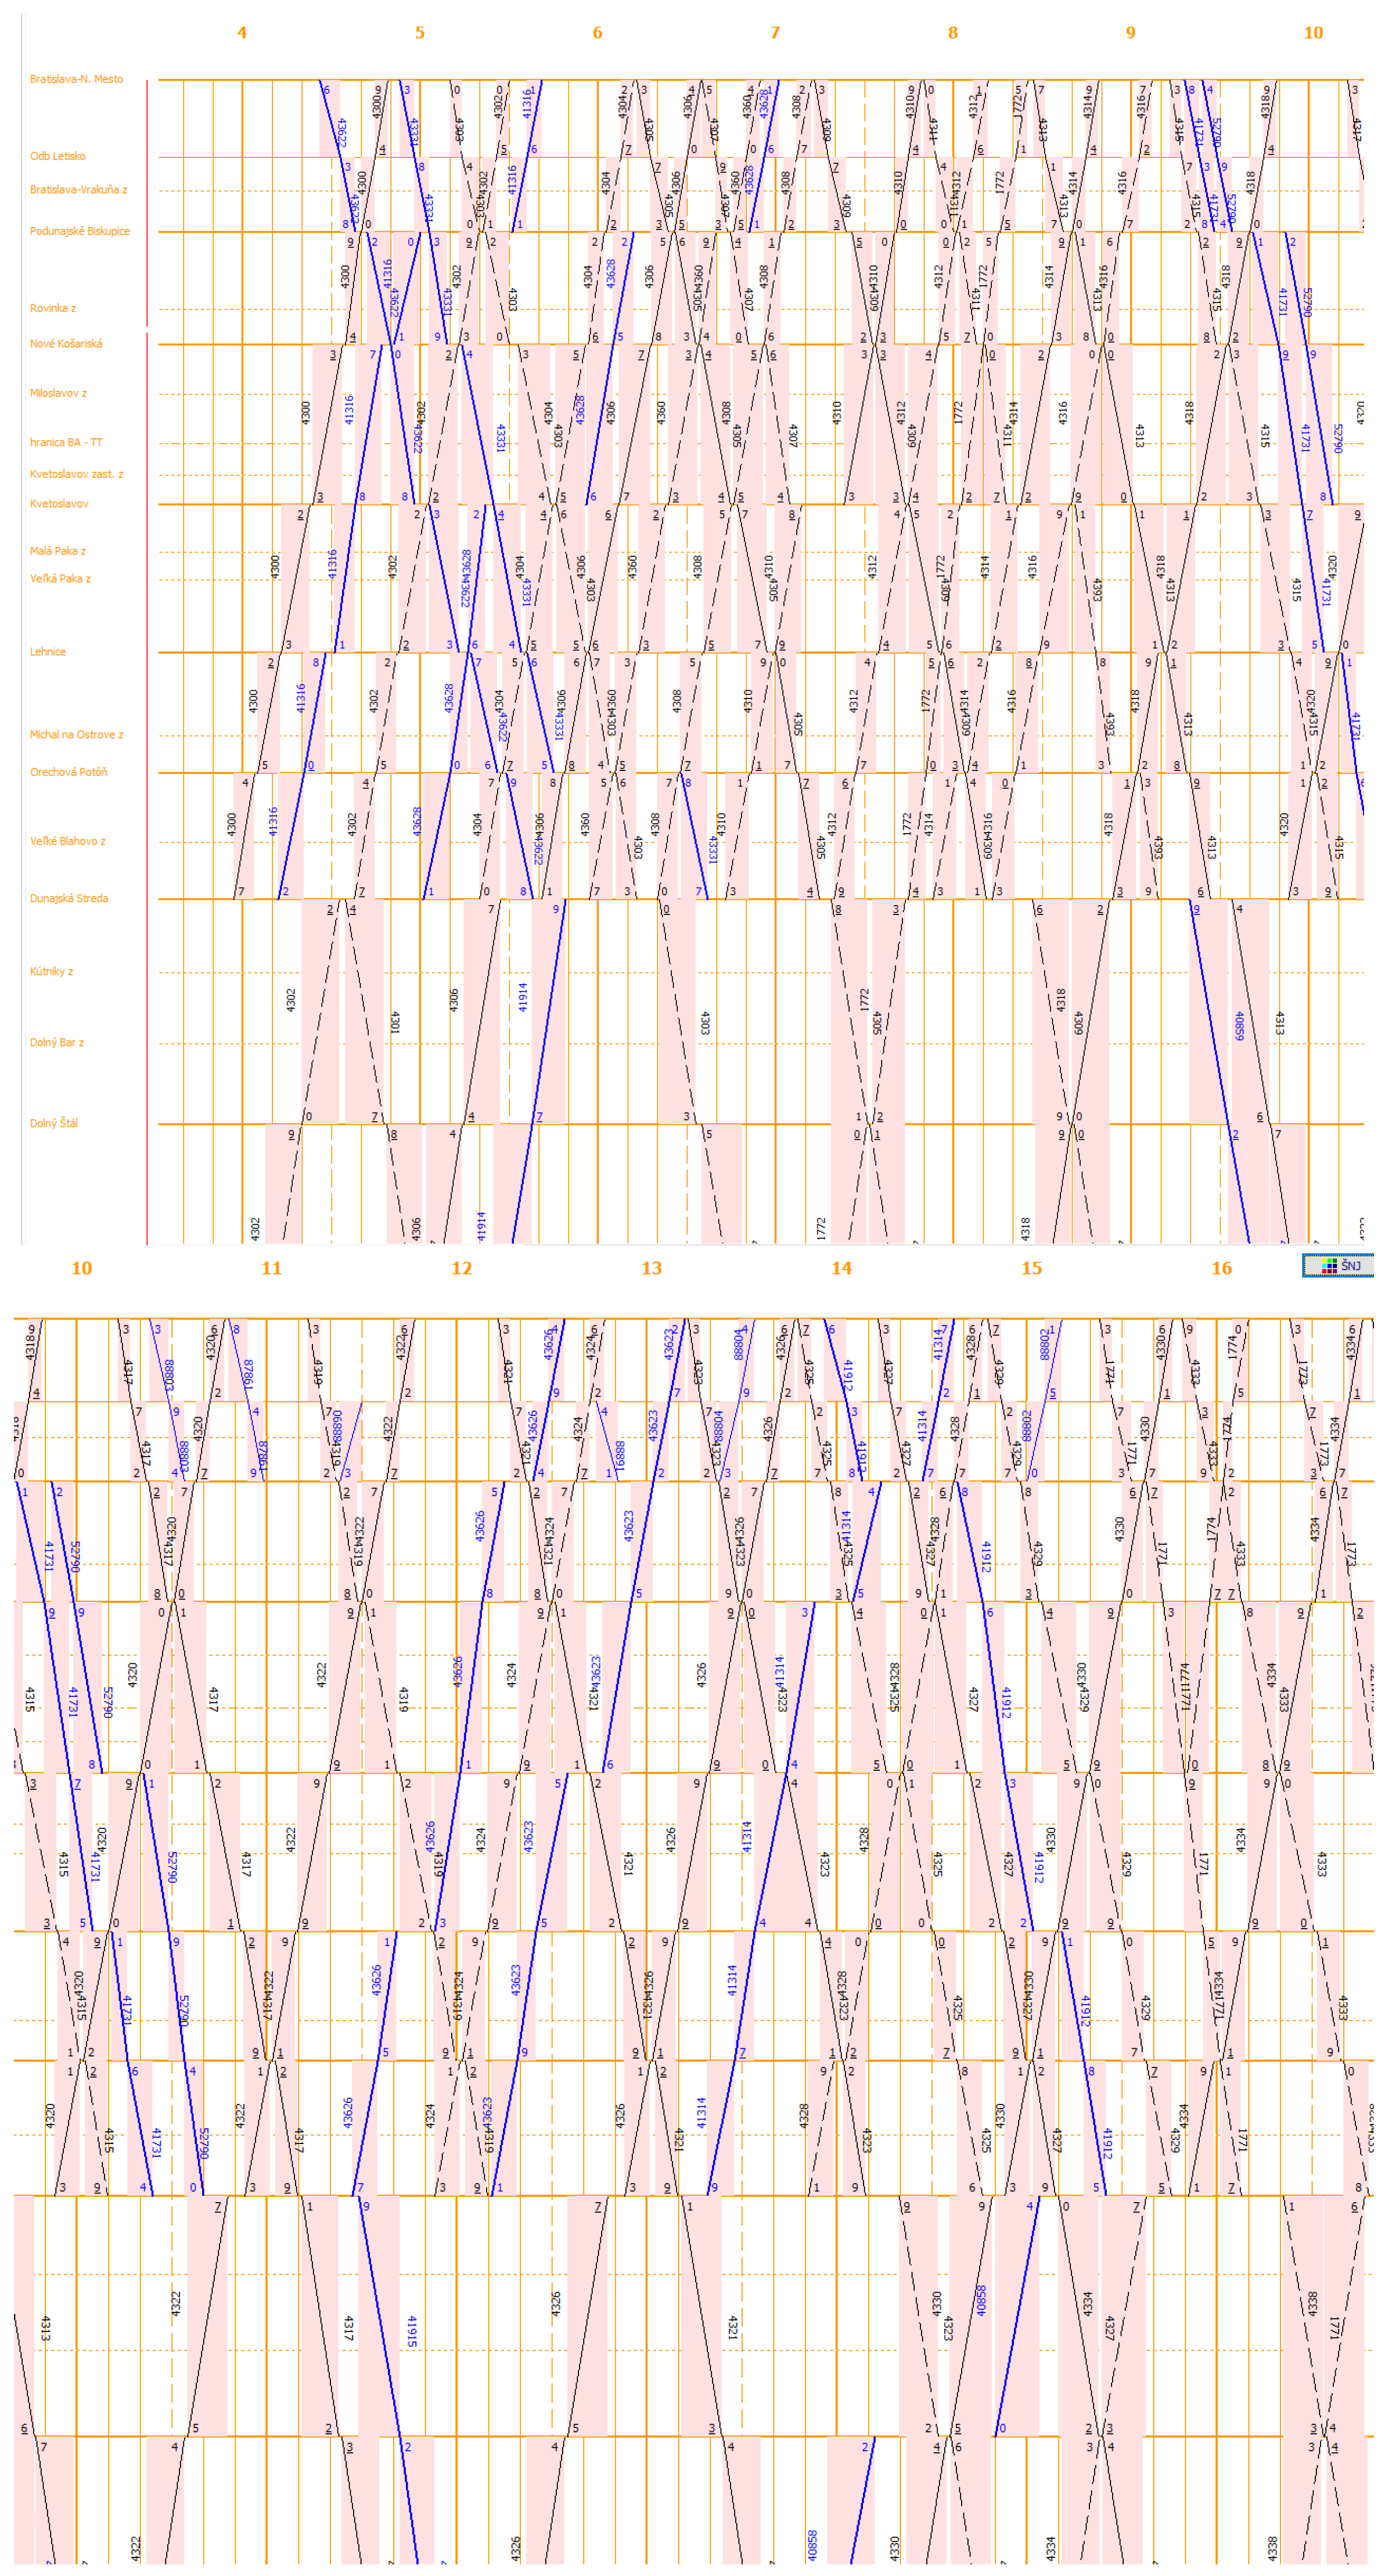
3.3.2. Adding the Occupancy “Reddish” Rectangles to Each Train
In the second partial step, certain reddish rectangles are added to the train traffic diagram sheet to the train run. Their number within one train is equal to the number of inter-station sections through which these trains pass. The vertical (longer) sides of the rectangle represent the inter-station section, and the horizontal (shorter) sides of the rectangle represent the train travel time in this section. Their content expresses the area occupied by specific inter-station sections. At the same time, this area represents the occupancy time of this section. As explained in
Section 2.2, this occupancy time (b) is the technological time of occupation by one train (calculated as an average train). This step is shown in
Figure 10.
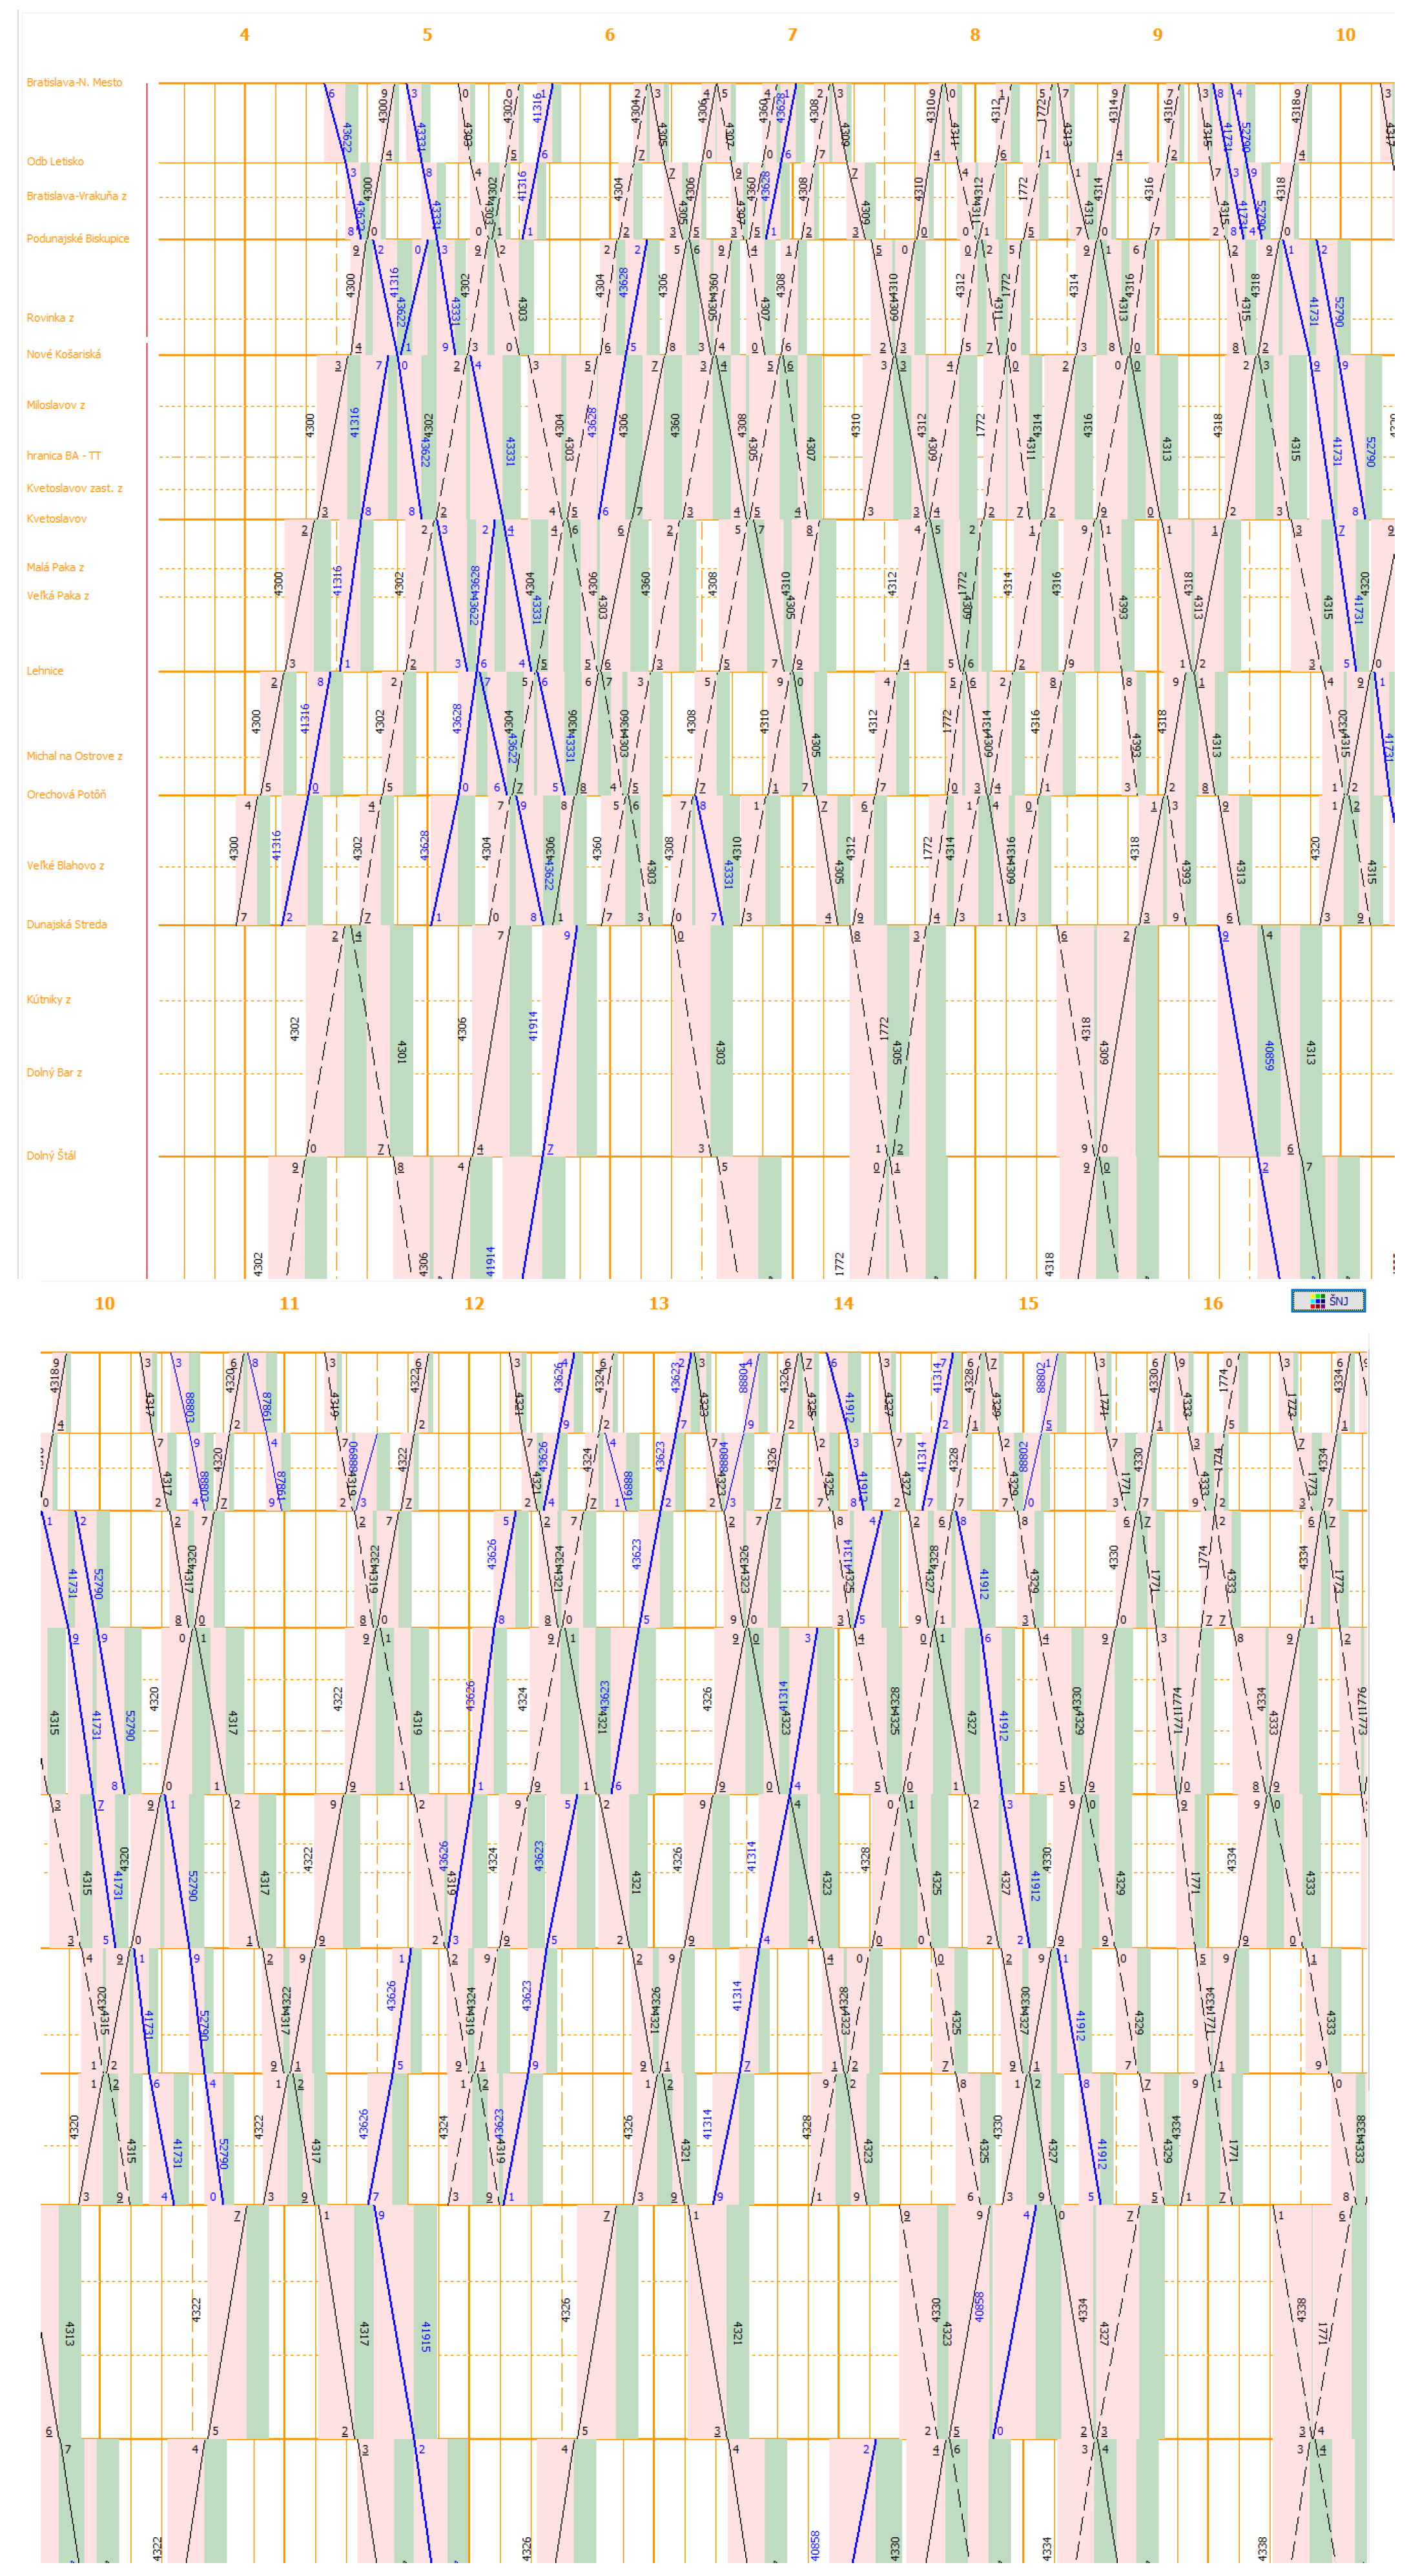
3.3.3. Adding the Buffer Time “Green” Rectangles to Each Train
The third partial step consists of adding a green rectangle to the right of each reddish rectangle in the train traffic diagram sheet, representing the buffer times. Buffer time is necessary to eliminate potential train delays. The length of the horizontal side of this rectangle should represent an average of 5–7 min of the buffer time. However, in practice, in the case of the trains on the mentioned railway line, the length of the buffer time is at least 1 min and a maximum of approximately 6 min. The average length of the buffer time is approximately 4 min; in some line sections, in the case of morning and afternoon peak traffic, it is even less (2–3 min), which is not sufficient. Therefore, it often happens that train delays are transferred in time to other trains at later time positions, and therefore the train traffic diagram is unstable. The third step is also shown in
Figure 11.
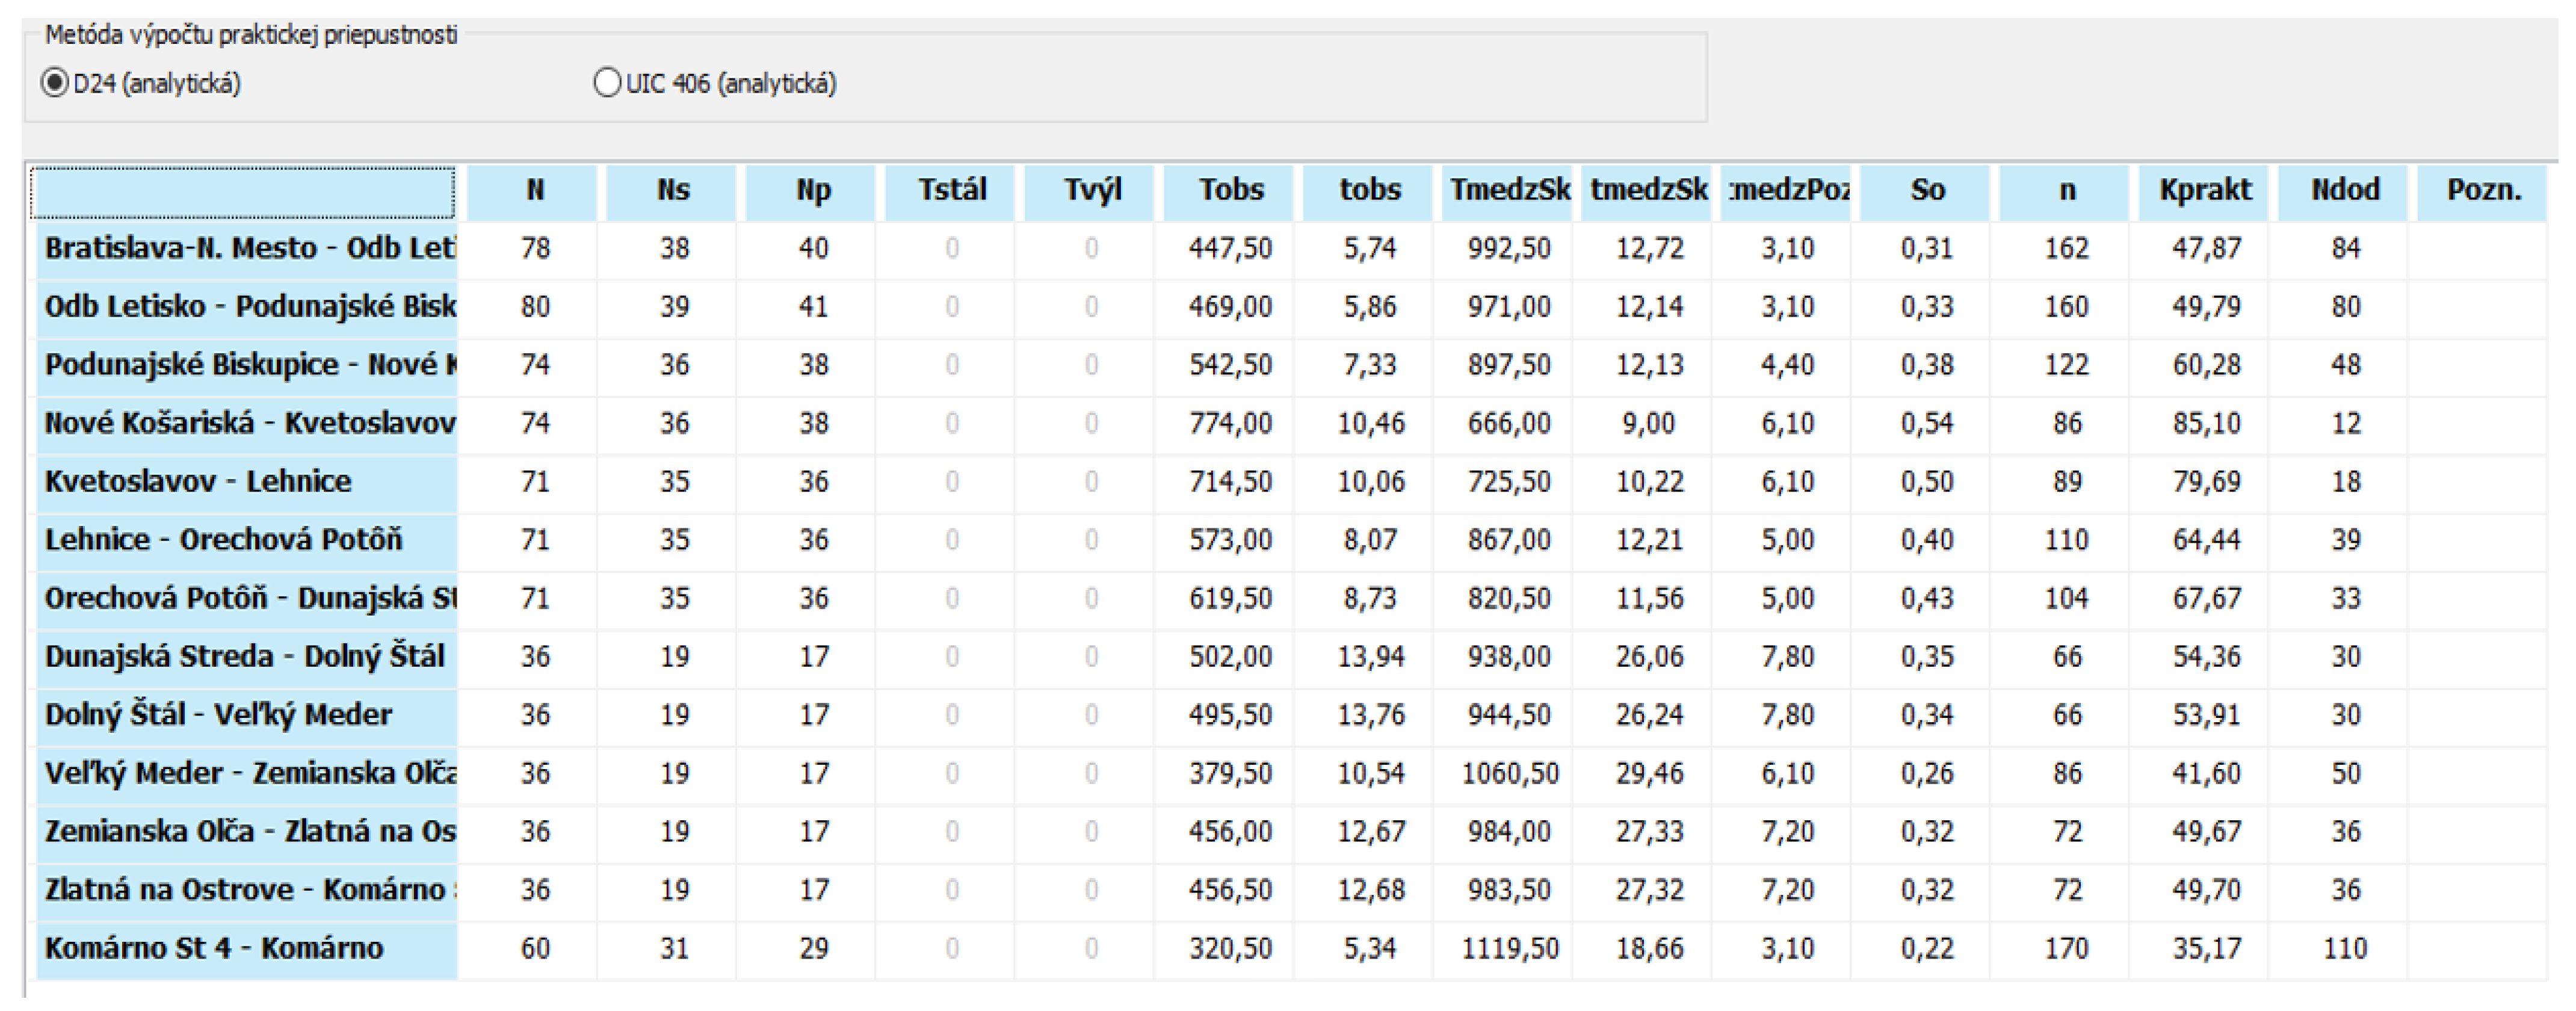
3.3.4. Capacity Calculation of Train Traffic Diagram with Constant Operating Interval of 0 min
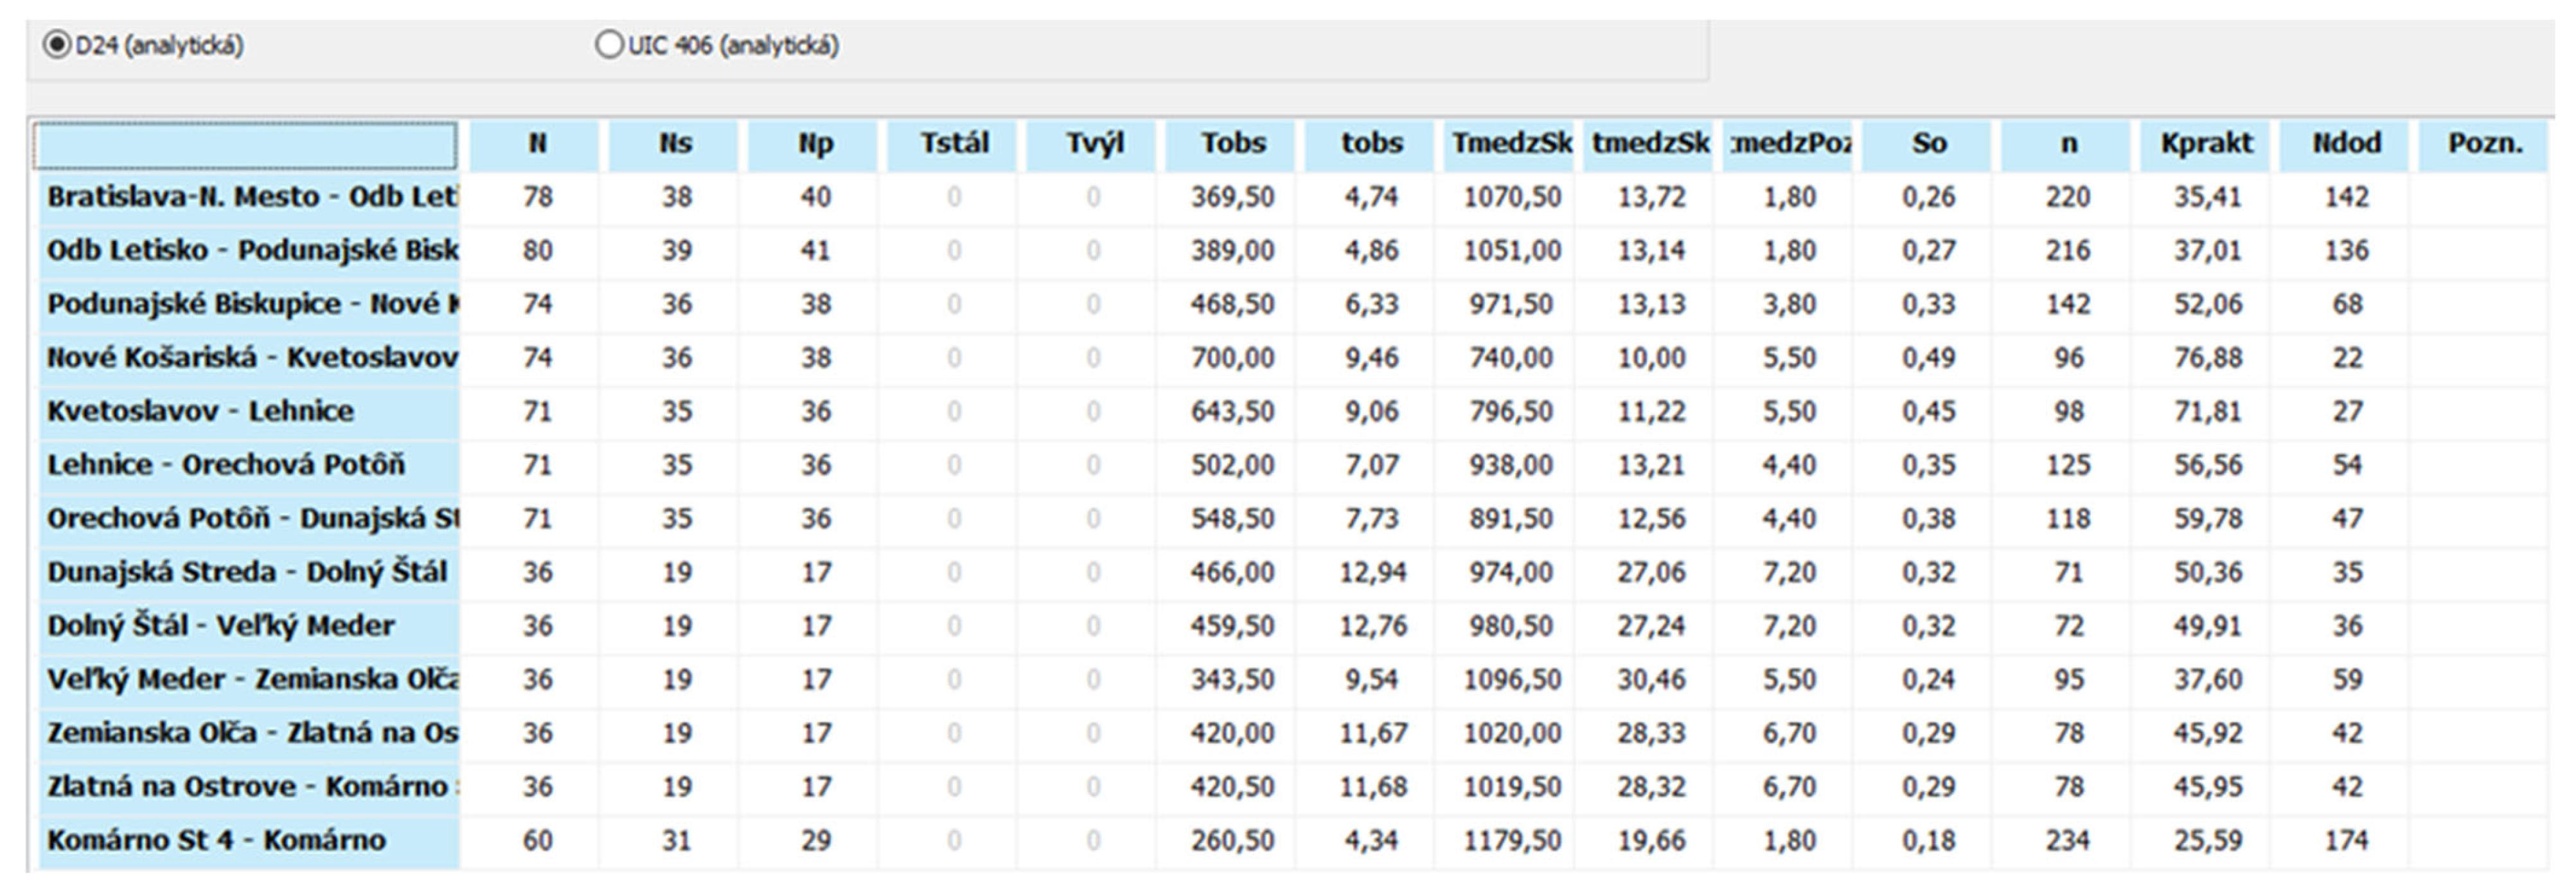
In the case of the fourth partial step, it is necessary to perform calculations in the software application. This involves calculating individual capacity indicators and practical throughput of individual track sections of the Bratislava–Komárno railway line using the analytical method. The most important relevant indicators are as follows:
- -
N—practical throughput efficiency (capacity),
- -
TmedzSk—the buffer time for the specific i-train [min],
- -
T medzPoz—the minimum needed buffer time [min],
- -
tobs—occupancy time (it can also be marked “b”—as in
Section 2.2).
All train traffic diagram calculations were calculated at a constant operating interval of 0 min. A sample of all calculations for an operating interval of 0 min is shown in
Figure 12.
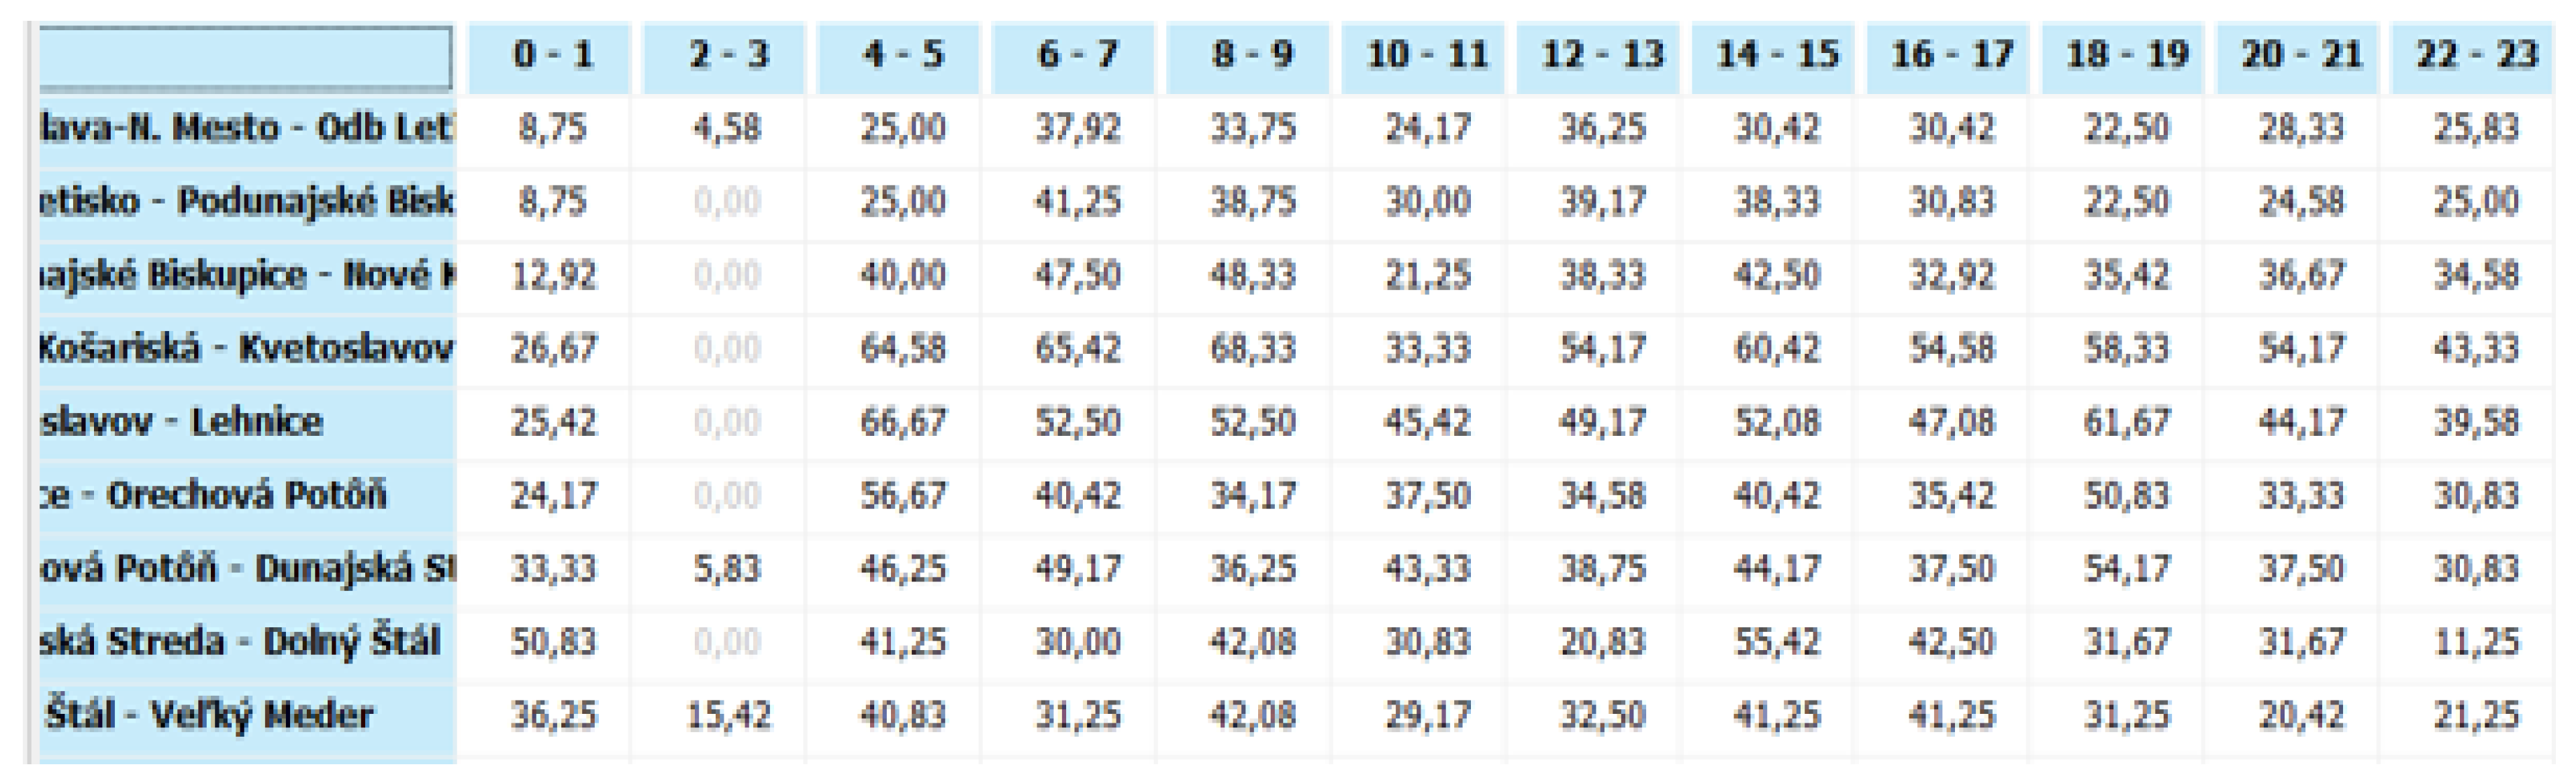
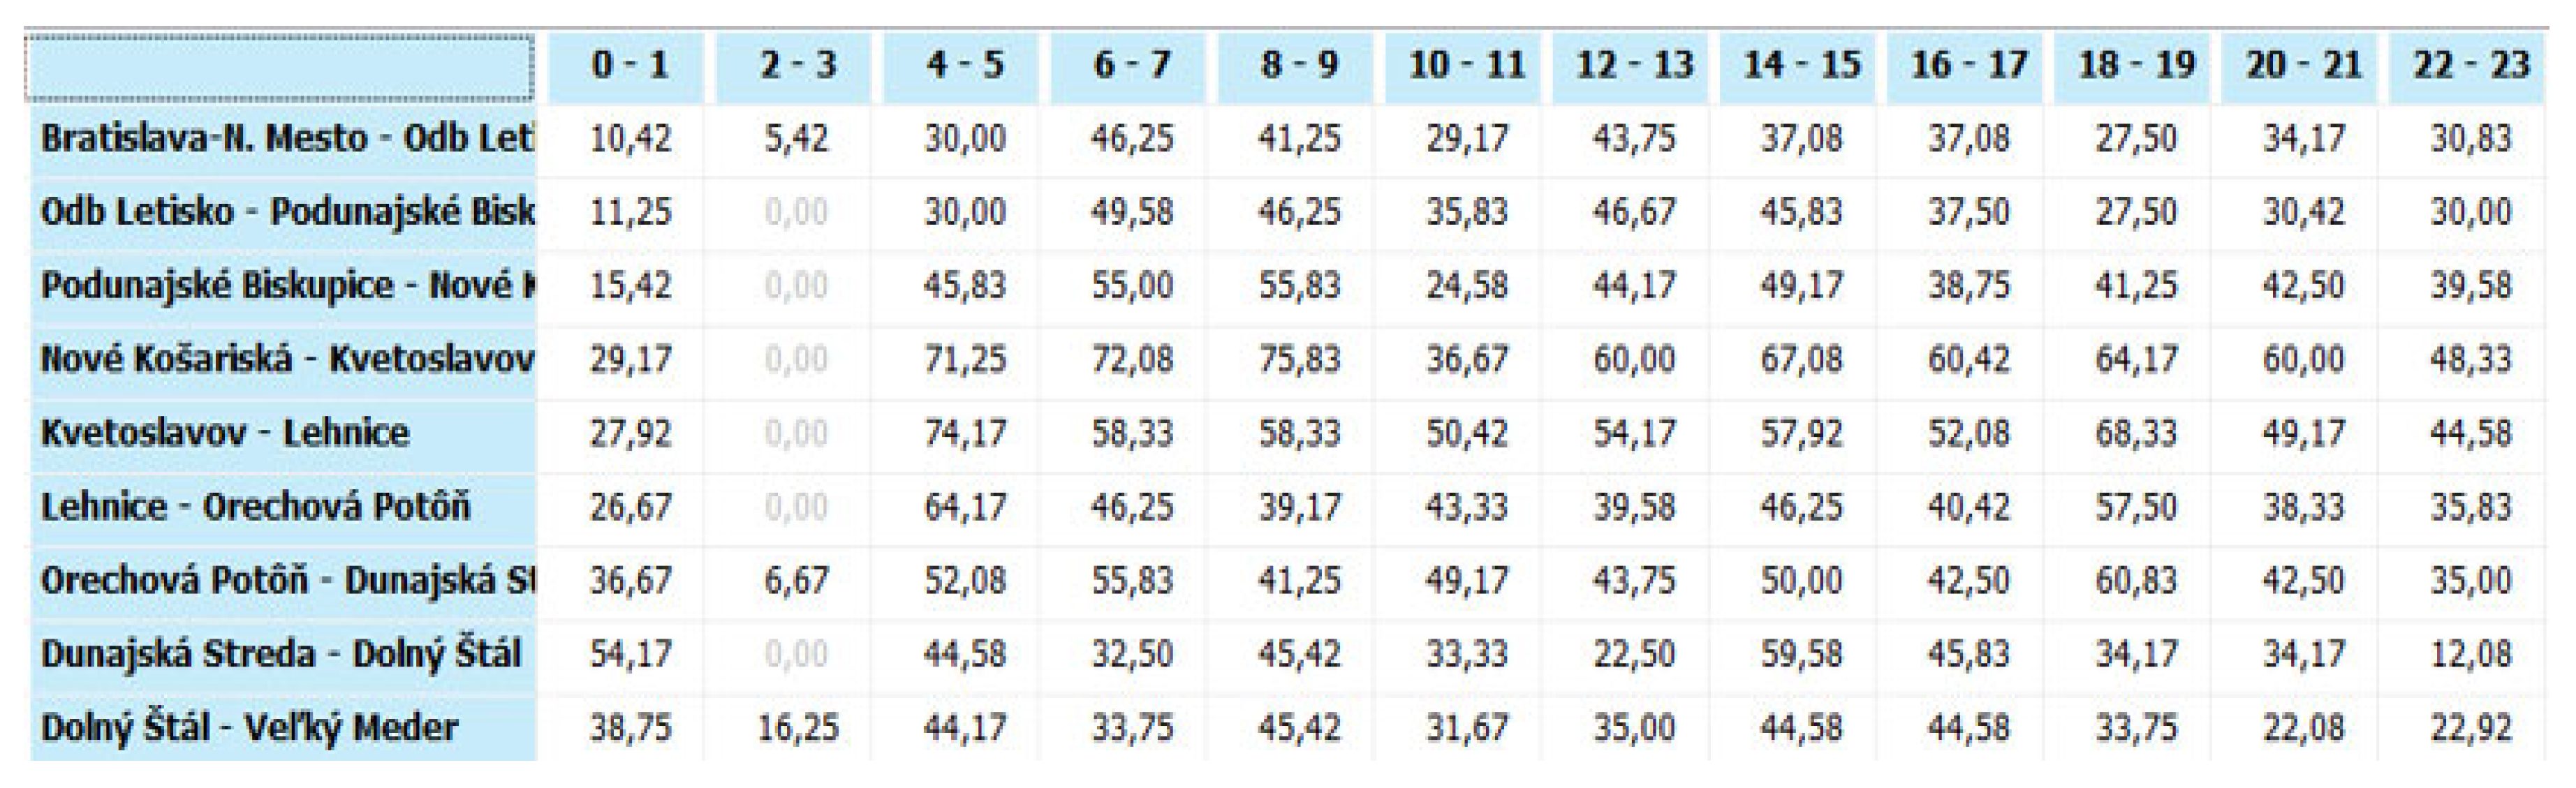
3.3.5. Decomposition of the Capacity Calculation into Two-Hour Zones with an Operating Interval of 0 min
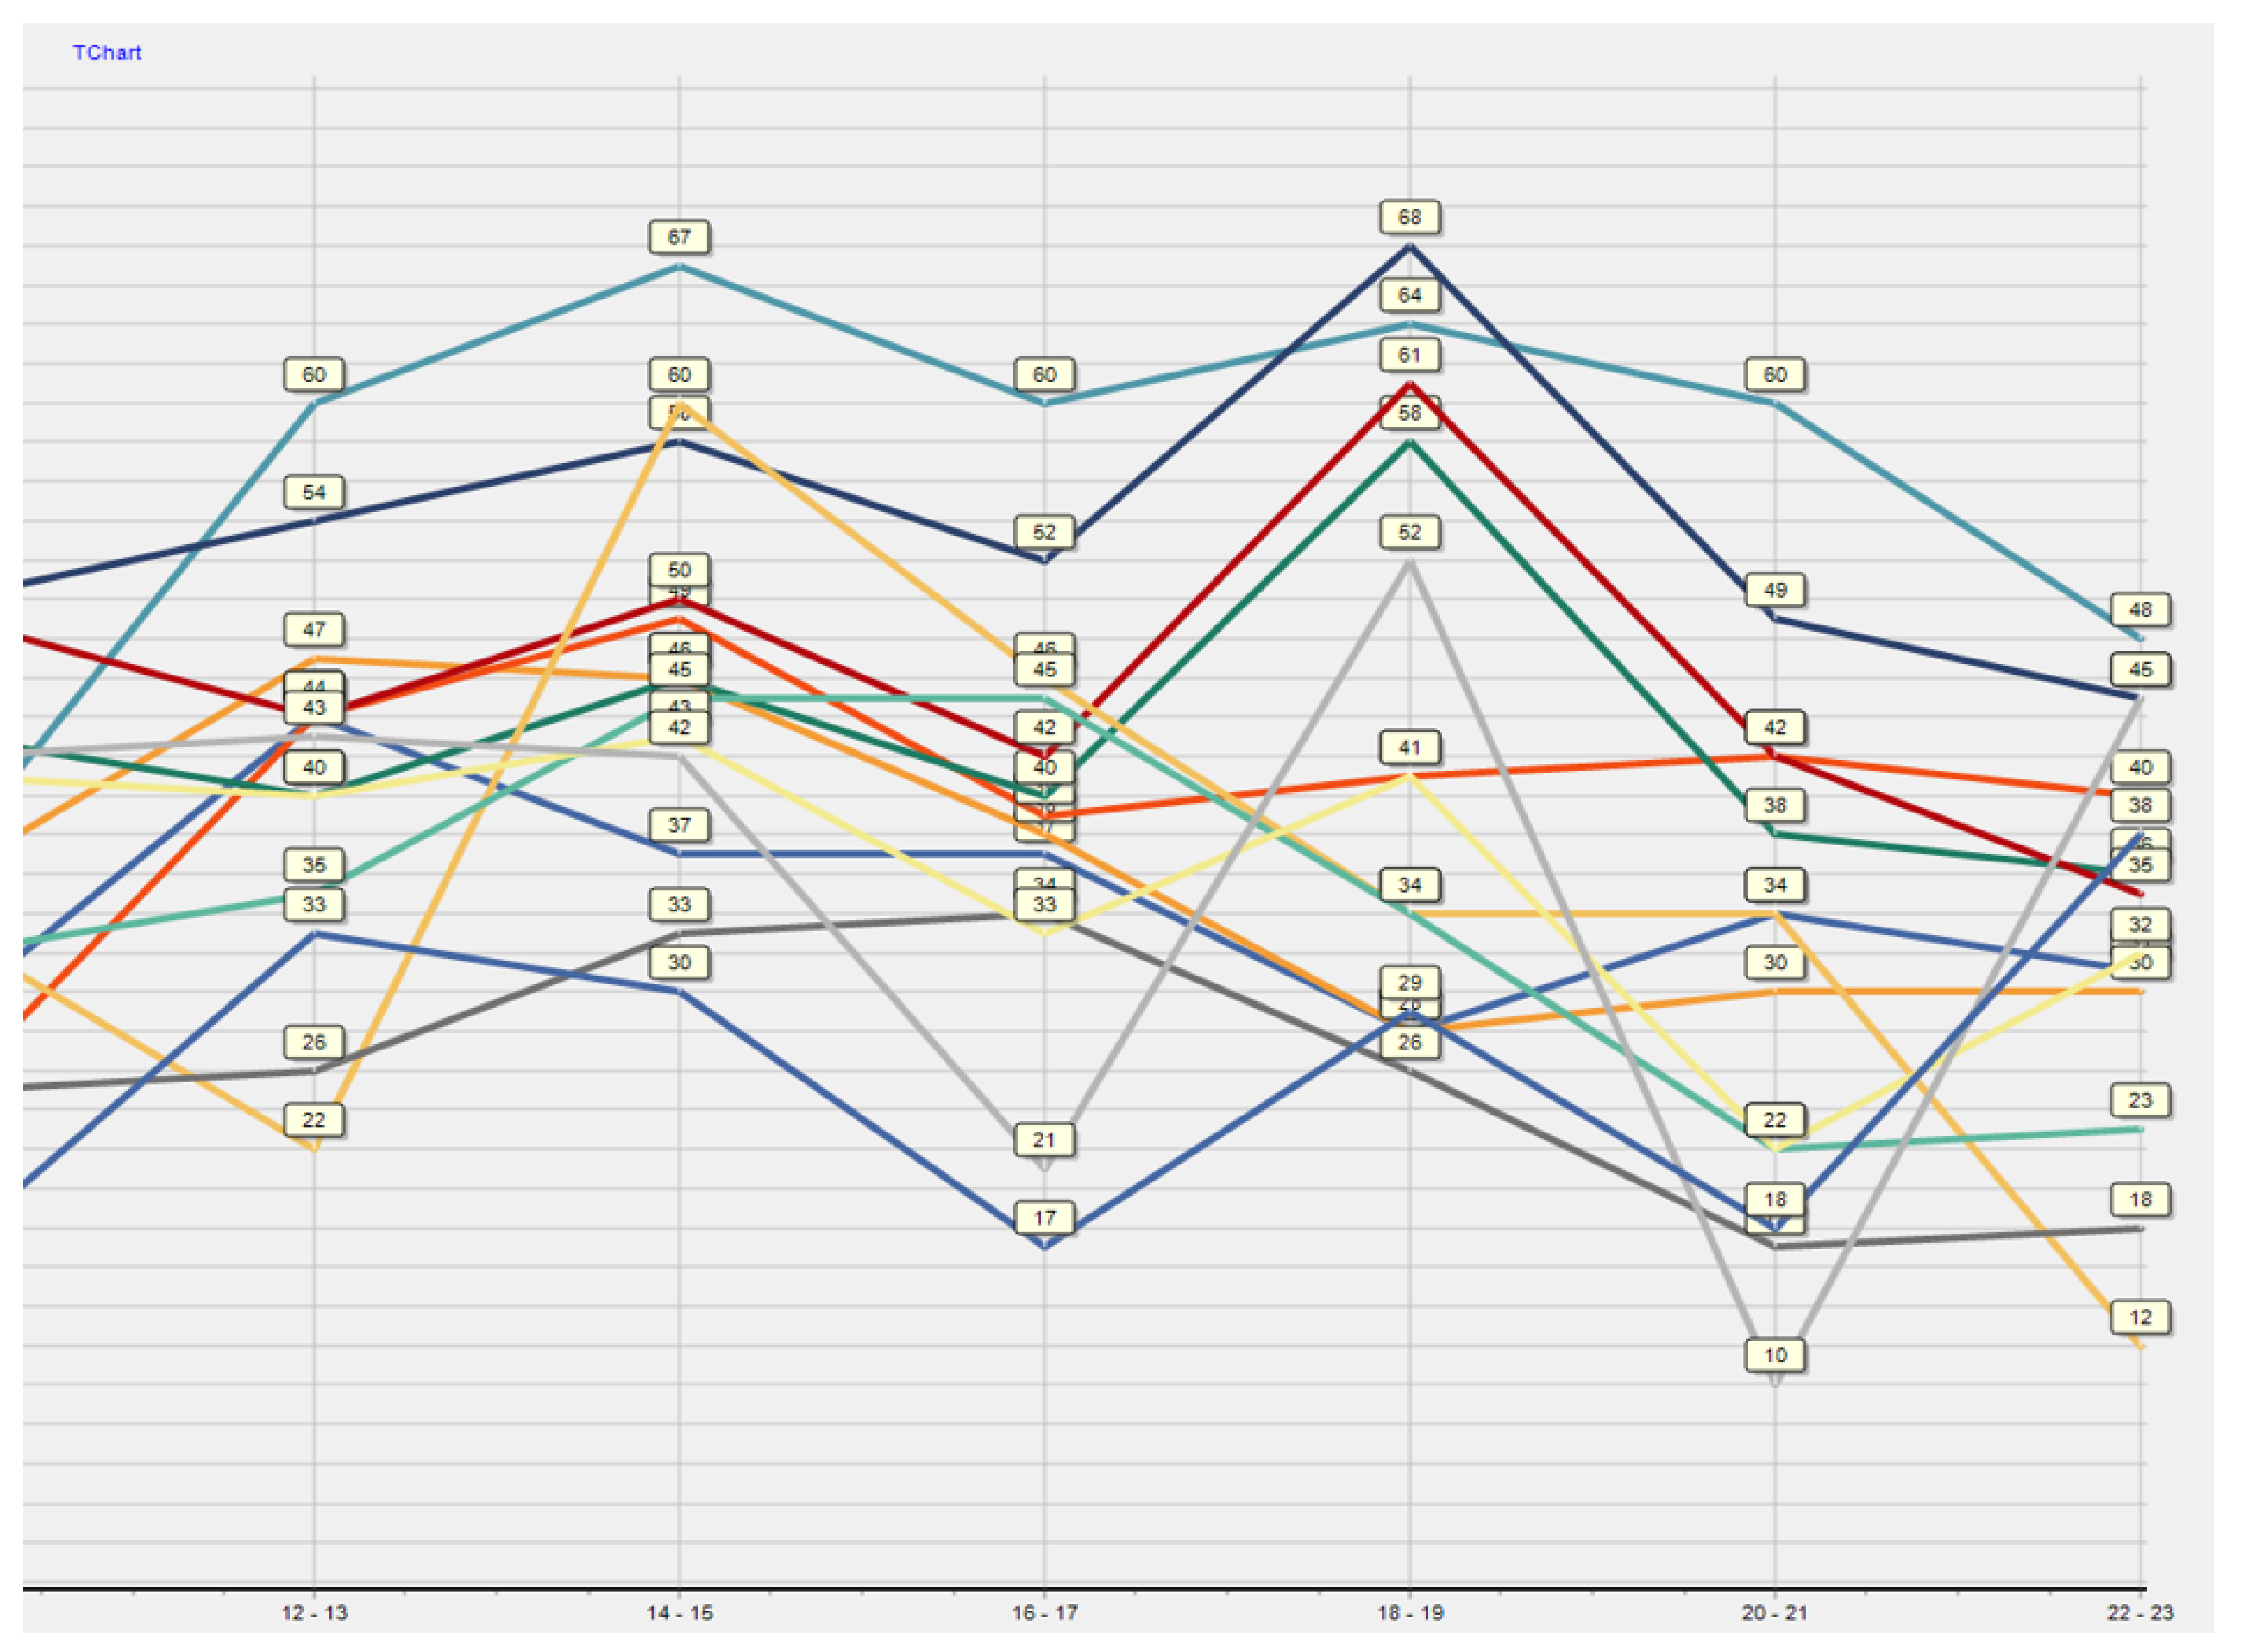
The fifth step requires certain elements of transport modelling and simulation. It will consist of the fact that the particular calculations of the railway line capacity parameters calculated in the fourth step will be divided into 2 h zones throughout the day and will be expressed as a percentage. This breakdown into two-hour windows will be implemented separately for each railway line section.
Figure 13 contains a section from the software application, where the individual columns show two-hour zones and the rows show individual railway line sections. Data are expressed in percentages.
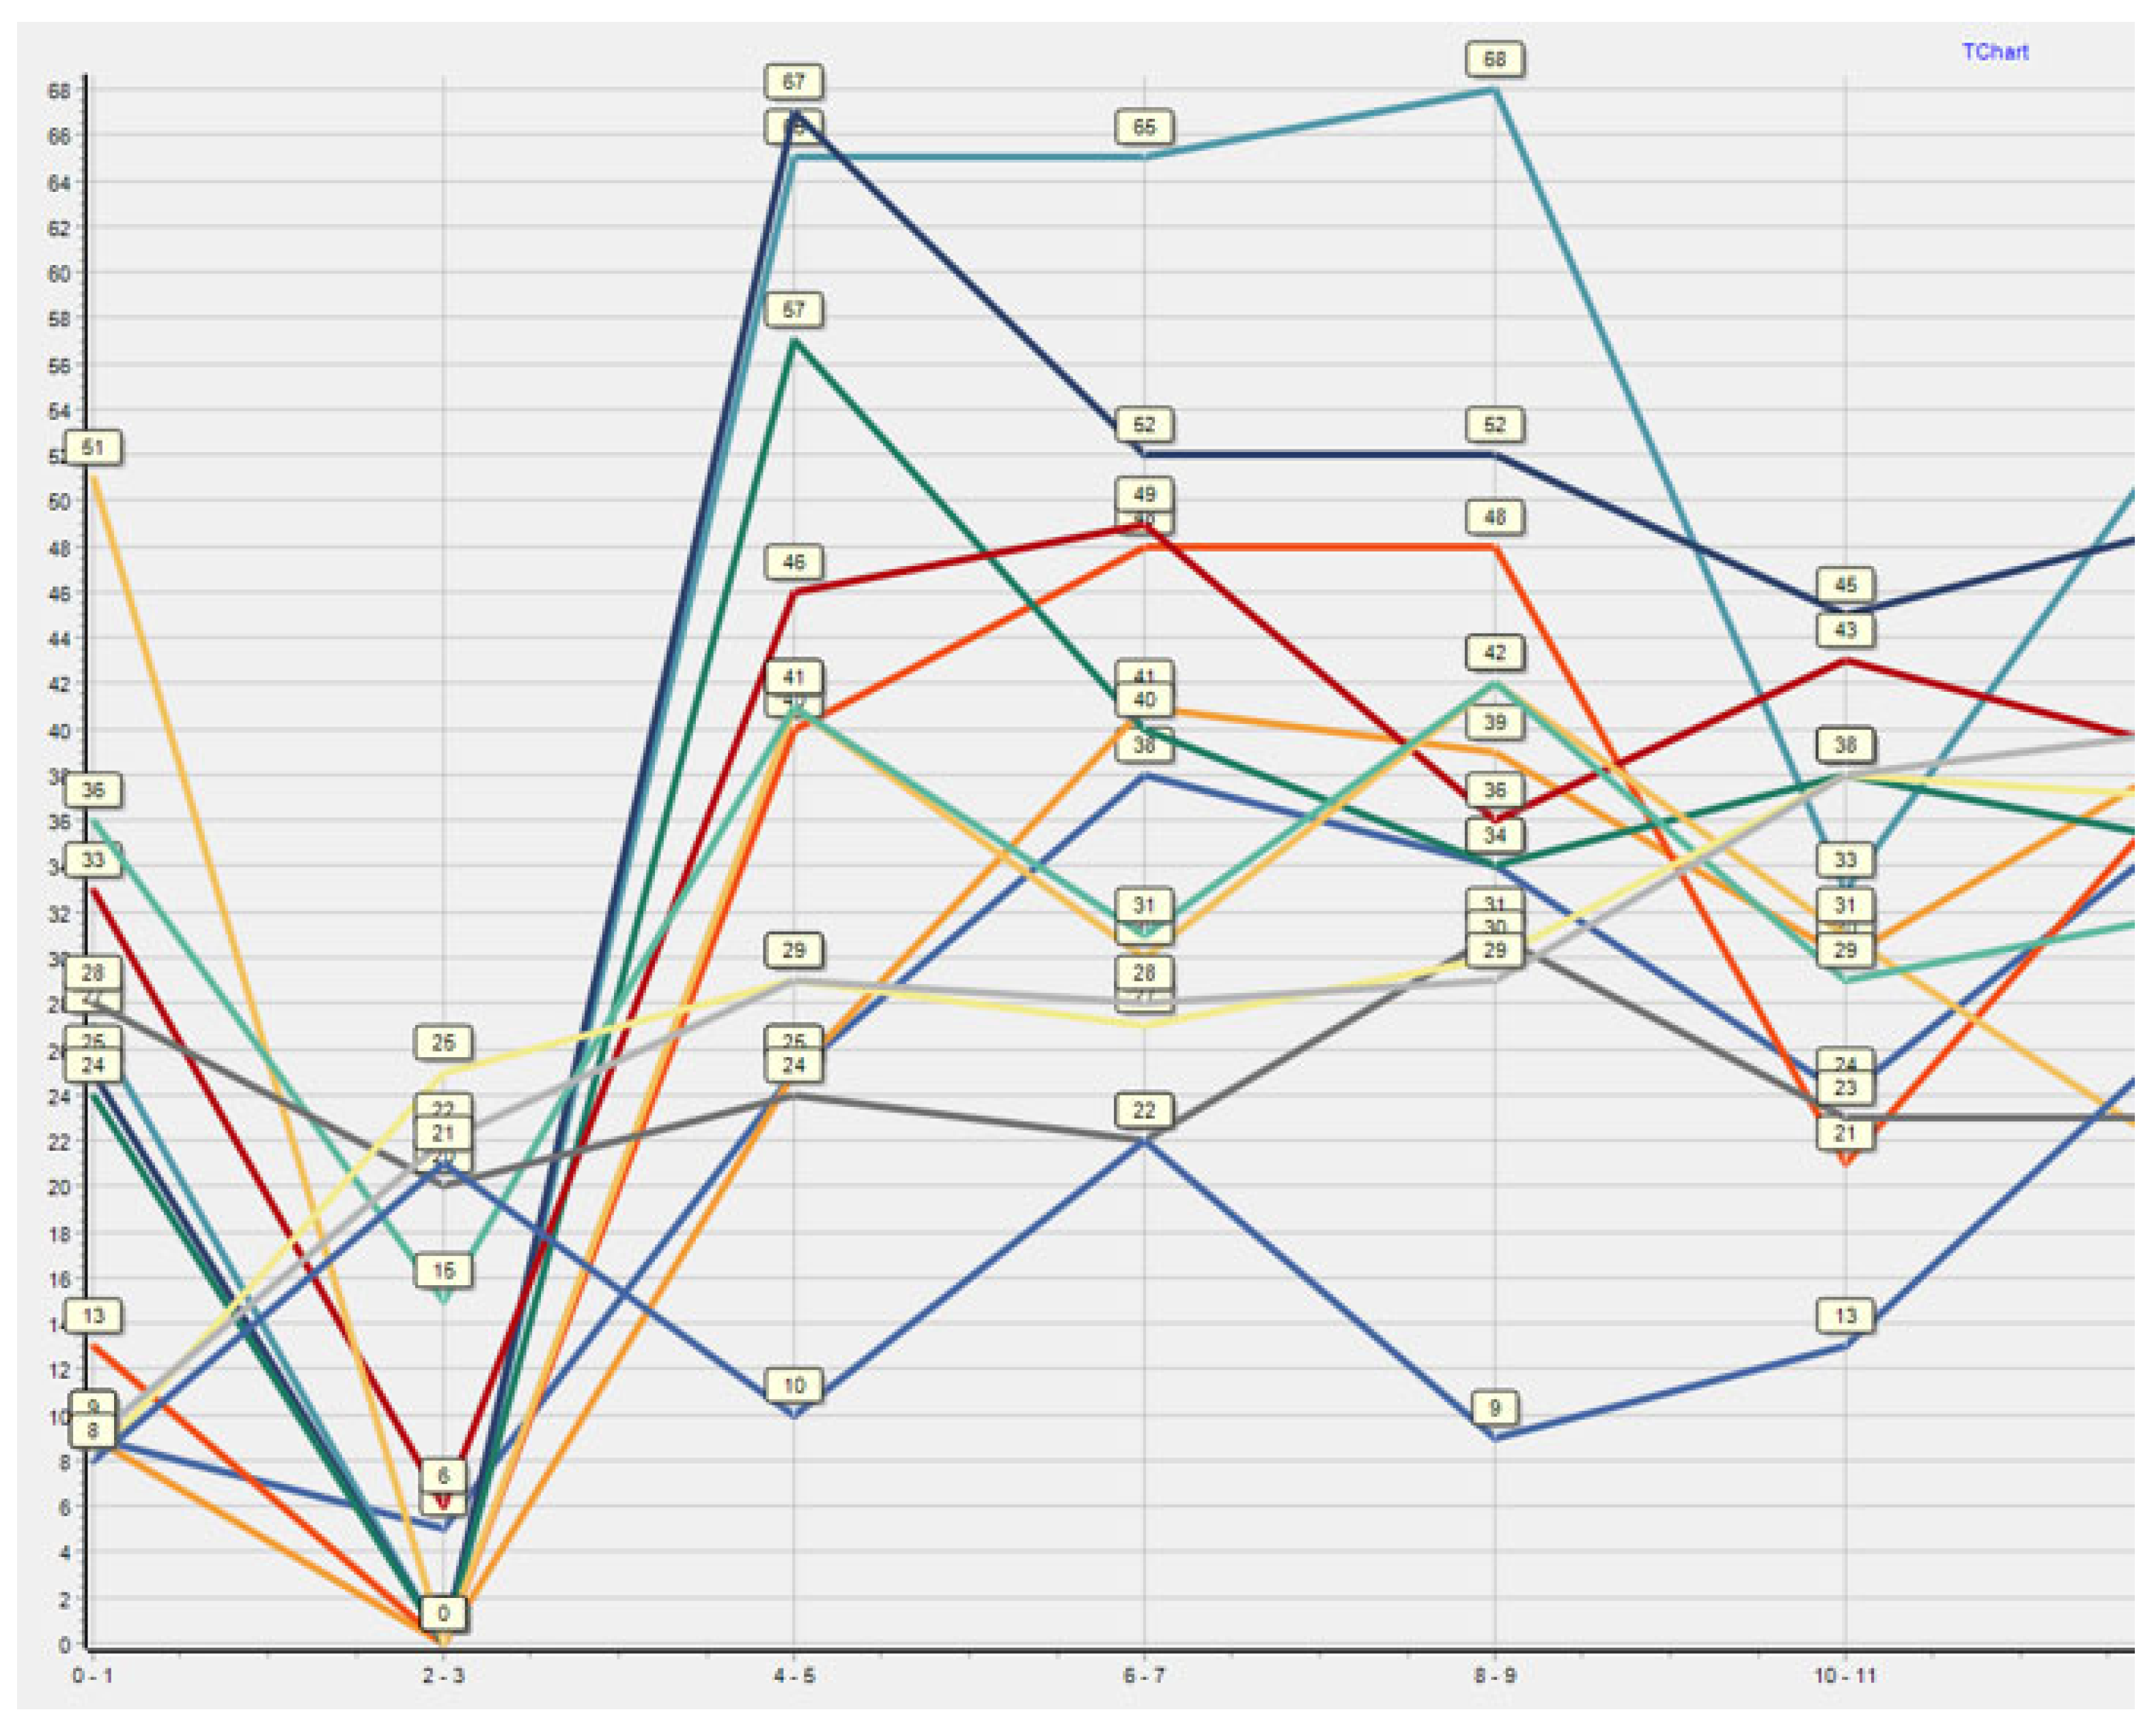
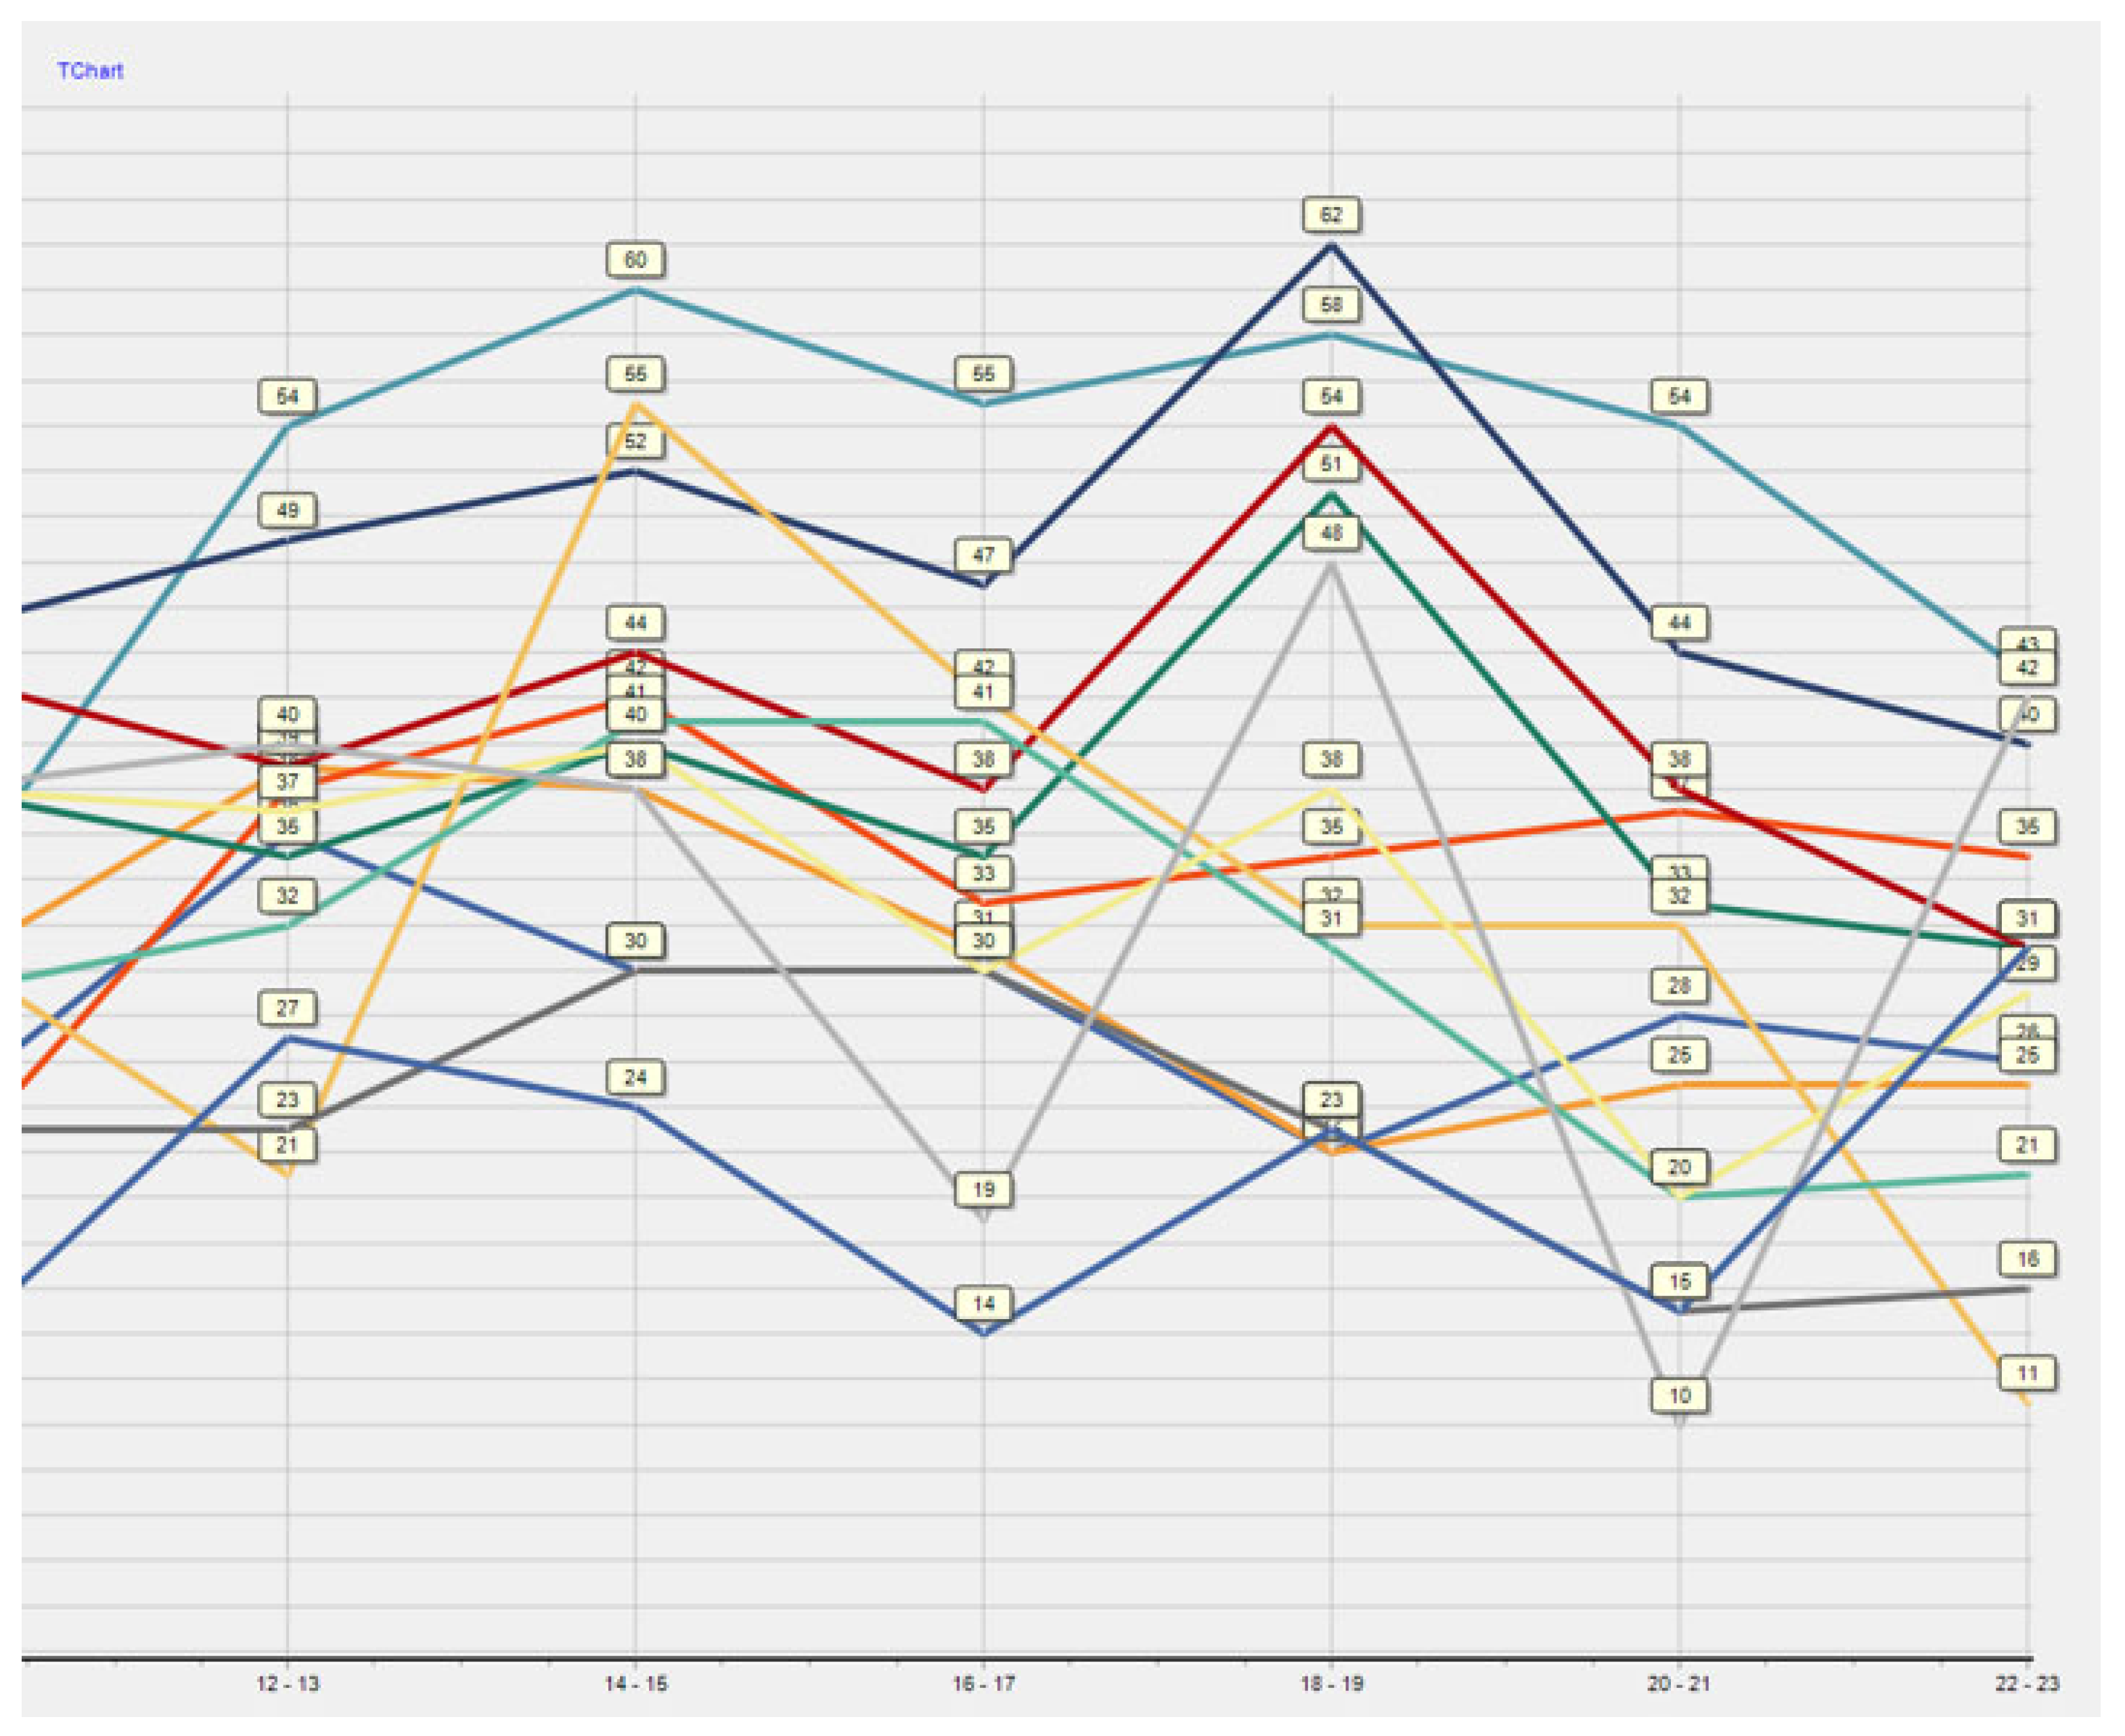
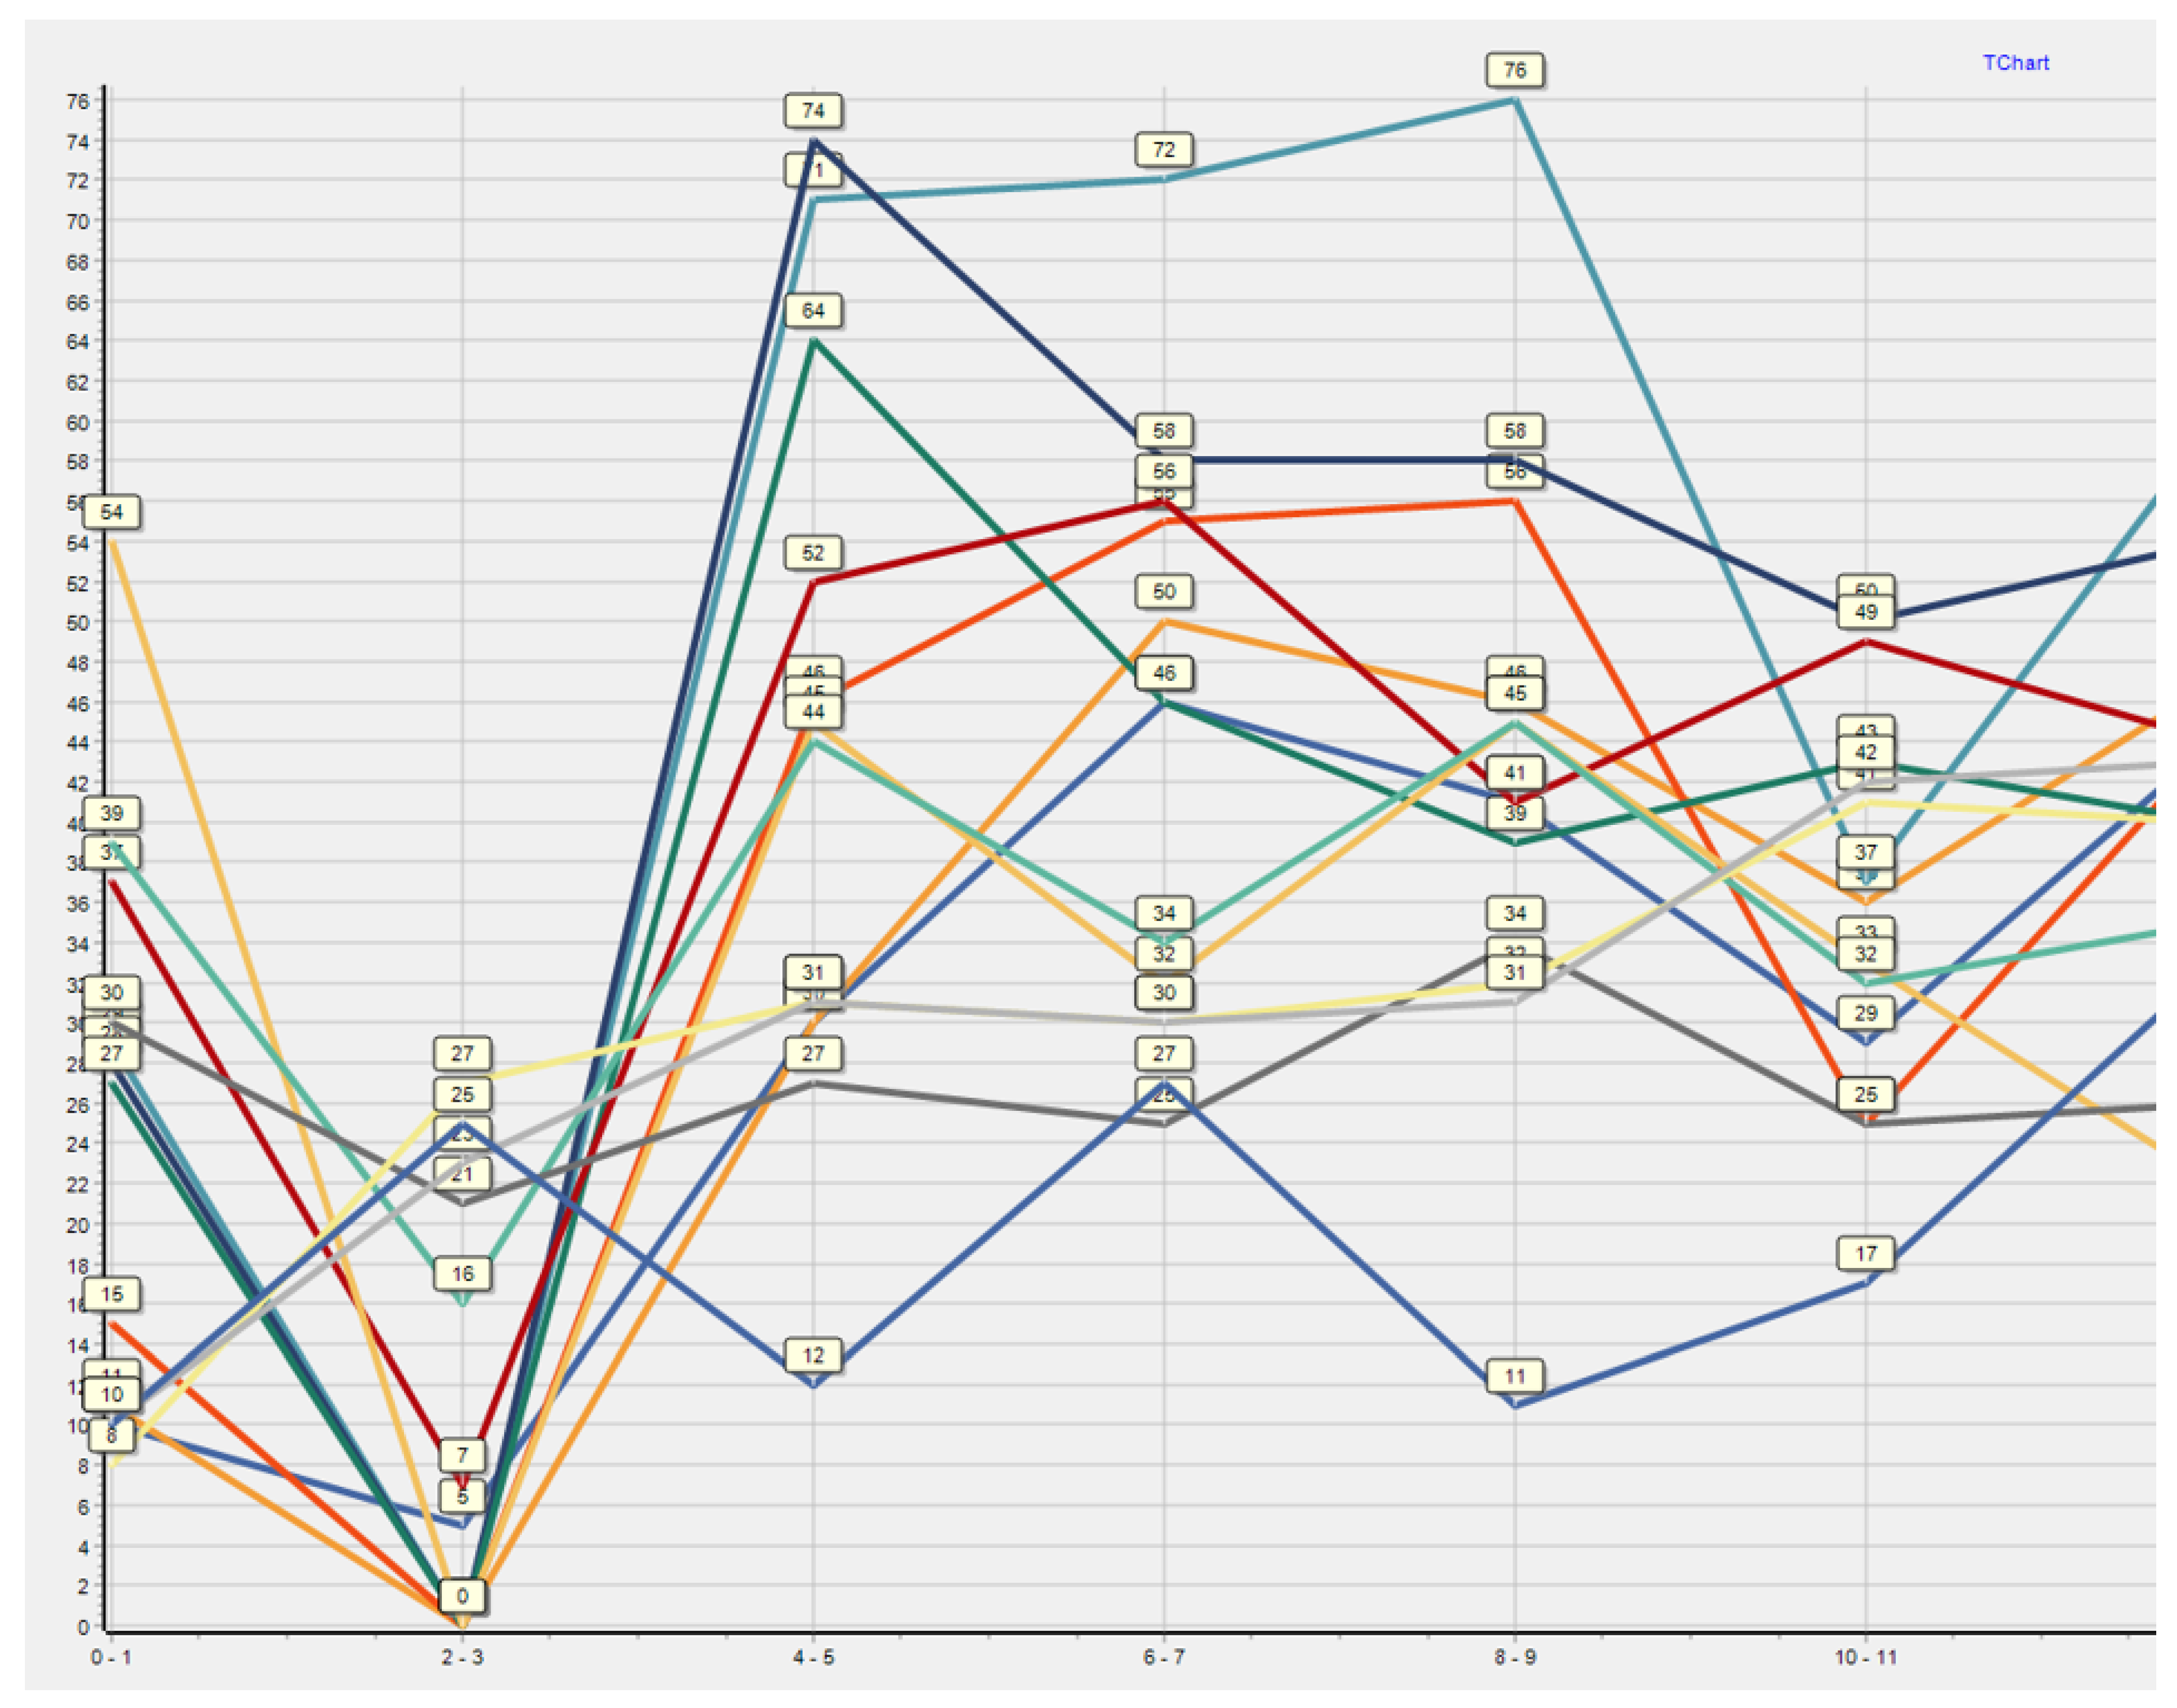
Subsequently,
Figure 14 and
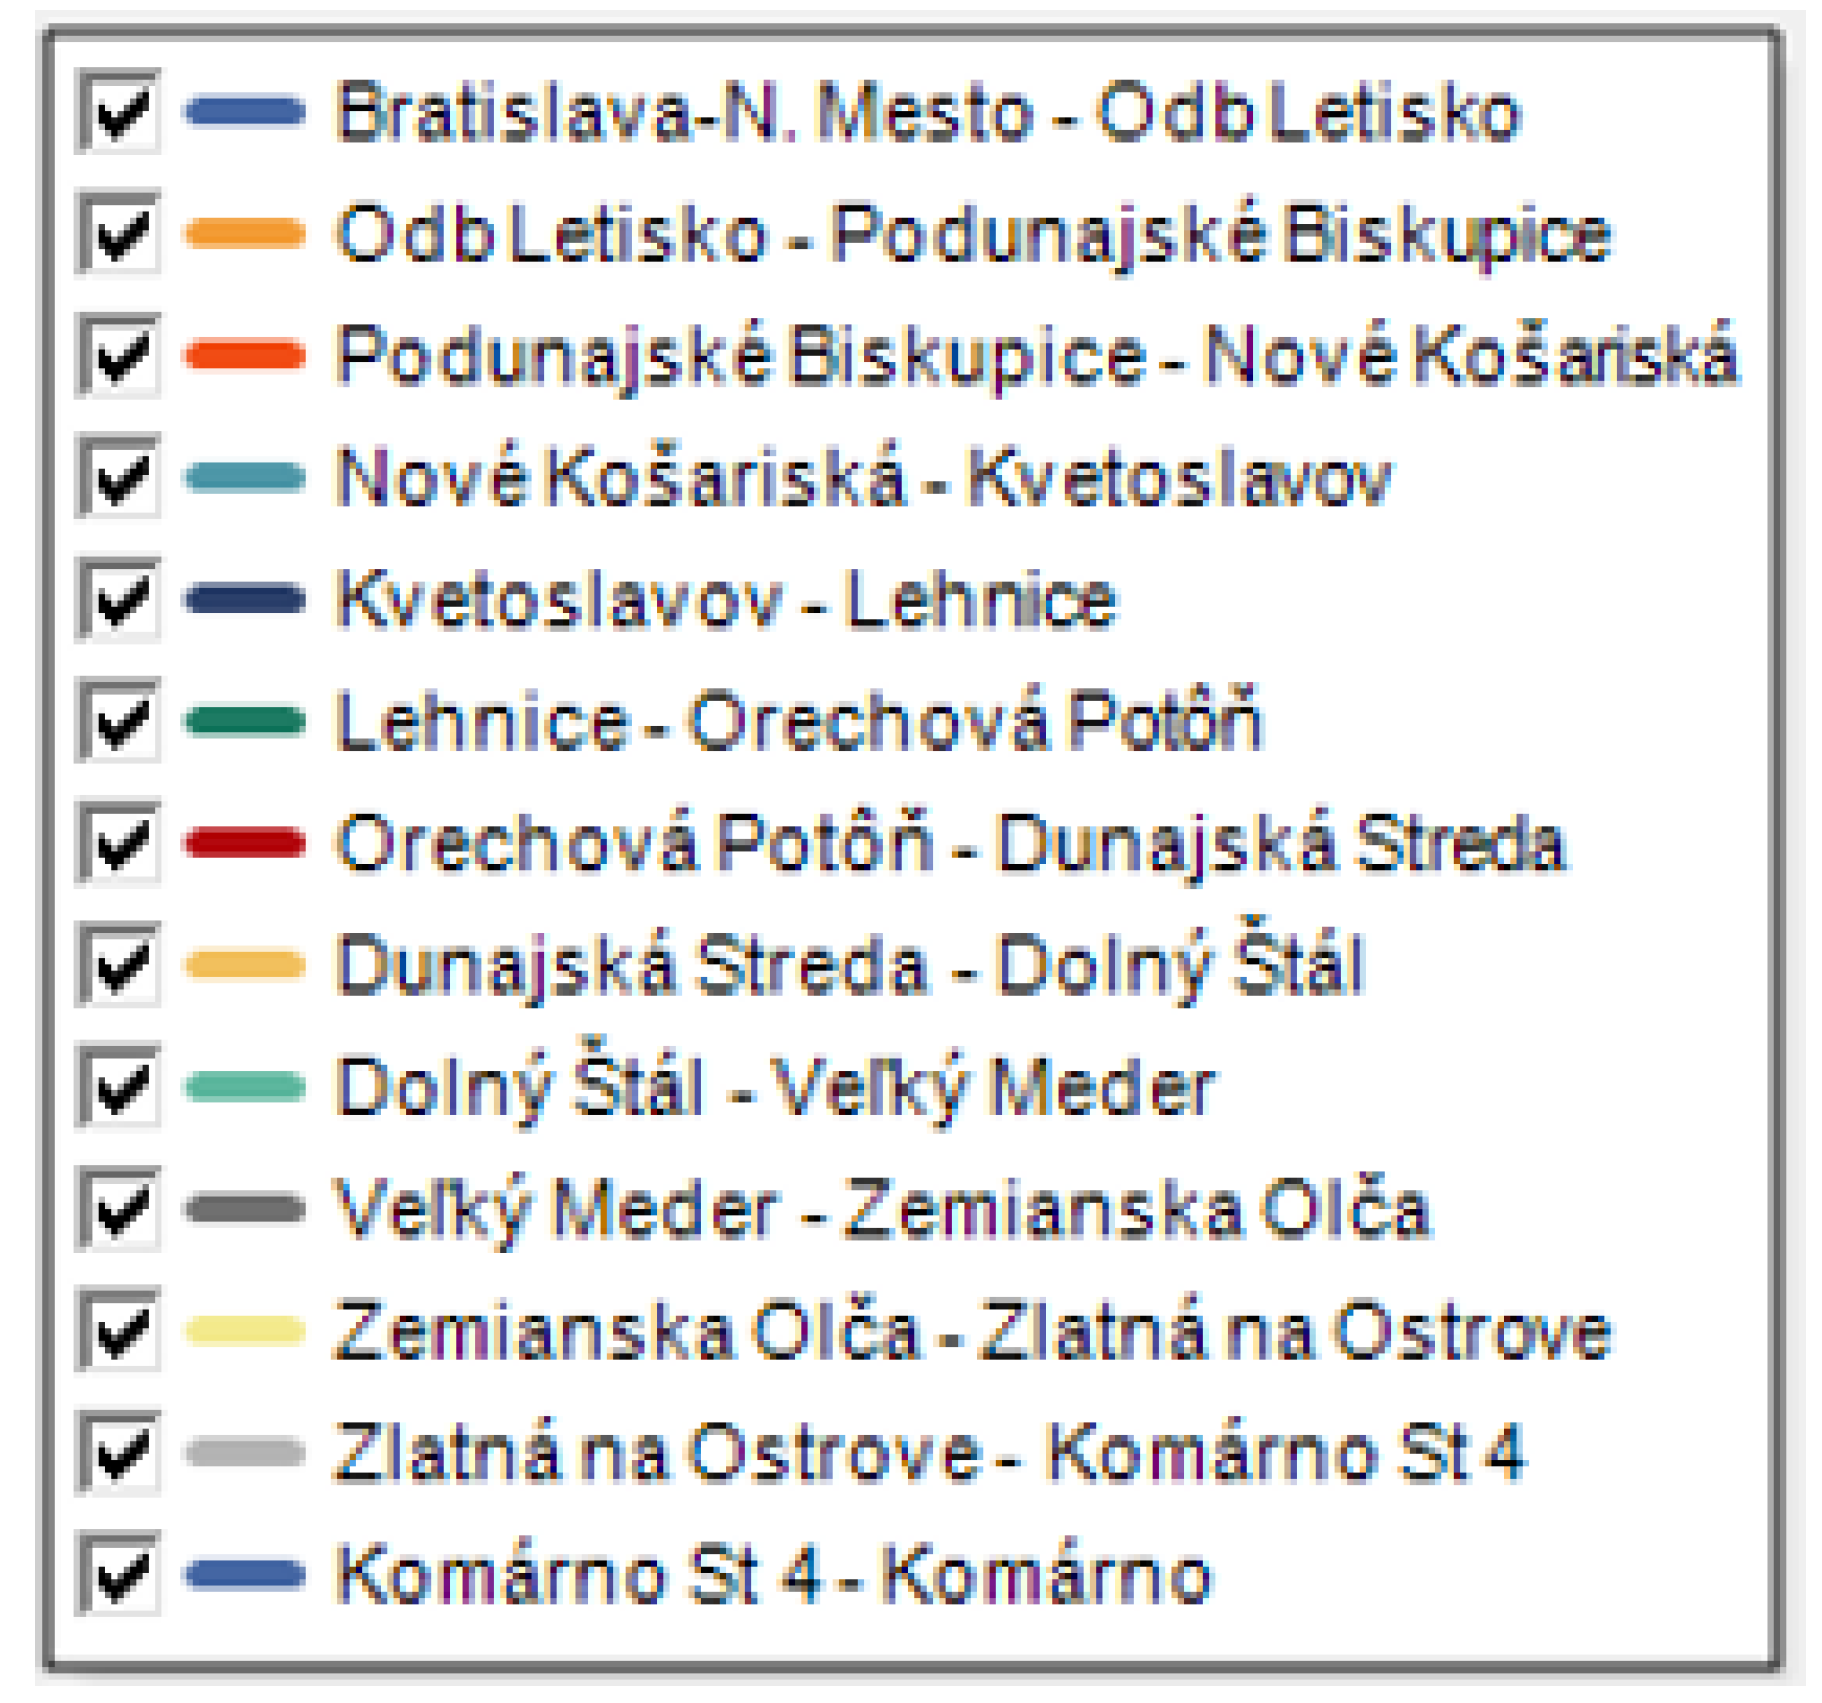
Figure 15 show a graphical representation of this decomposition, with the railway line sections connected by the same colour.
The assignment of colours to individual railway line sections is shown in
Figure 16.
3.3.6. Capacity Calculation of Train Traffic Diagram with Constant Operating Interval of 1 min
In the case of the sixth step, it is necessary to perform the same calculations in the software application as in
Section 3.3.4. However, the difference is that all calculations are calculated at a constant operating interval of 1 min. All these calculations are shown in
Figure 17.
3.3.7. Decomposition of the Capacity Calculation into Two-Hour Zones with an Operating Interval of 1 min
The last step will also consist of the fact that the particular calculations of the railway line capacity parameters calculated in the sixth step will be divided into 2 h zones throughout the day and will be expressed as a percentage. This breakdown into two-hour windows will be implemented separately for each railway line section. The principle is exactly the same as in
Section 3.3.5.
Figure 18 contains a section from the software application, where the individual columns show two-hour zones and the rows show individual railway line sections. Data are expressed in percentages.
Subsequently,
Figure 19 and
Figure 20 show a graphical representation of this decomposition, with the railway line sections connected by the same colour. The assignment of colours to individual railway line sections is also exactly the same as in
Section 3.3.5.
4. Discussion
Based on real case studies and examples from real traffic, it is necessary to make the train traffic diagram and capacity of the railway line more reliable and accessible to other operators and other modes of railway transport. The aim of the paper was to present a new methodology for determining railway line capacity on this railway line, whose capacity load of trains borders on the stability of the train traffic diagram and at the same time creates wider time slots during peak hours only for passenger transport, with the absence of places for freight transport. The methods of examining this line are generally valid for each railway line, while none of the lines on Slovak Railway network are as busy in terms of capacity as this presented line. In the case of further research by the authors and other publications, the methodology will be tested on other railway lines and the capacity of the railway lines will be compared with each other. The case study was situated on a frequented one-track railway line between Bratislava and Komárno. Based on a case study, where there are descriptions of real cases where for different reasons operation is restricted on selected days, a new methodology was developed to determine railway line throughput. In all cases, the rail transport has non-planned stops for some time. This situation was unacceptable for freight trains because the freight trains were stopped at the station for a long time at the expense of passenger trains.
To achieve the best results, we used a combination of graphical-analytical methods and software methods. In the software application, simulation and methods of transport modelling were used. With the modelling, we can better identify capacity and throughput of railway infrastructure and selected indicators of practical throughput than the coefficient of practical throughput, degree of usability. In addition, it is possible to better identify narrow places in the infrastructure. Decomposition to two hours helps to better identify transport peaks and narrow places [
35].
Our methodology is compared with methodology UIC 406, considering the buffer time. The UIC methodology considered only the needed time of occupation for the section without buffer time. It follows that our methodology has greater applicability on busy railway lines, mainly to maintain stability in the train traffic diagram, regarding the inclusion of the buffer time to create the train traffic diagram. In the case of beginning the delay at these railways with planned buffer time, it is possible to better reduce the delay and have better options for operating the transport.
A determination of buffer time can negatively influence the planning of the transport on one-track railway lines. To achieve a reliable train traffic diagram, there is a need to choose a suitable buffer time. With a suitable choice of buffer time, it is possible to avoid the congestion of the railway lines. On busy railway lines, it is difficult to choose a suitable buffer time with regard to railway line capacity. Restrictions can disturb adding new trains to the train traffic diagram.
In our case study, the results are that in all monitored cases, by using our methodology, the capacity and throughput on the monitored railway line are insufficient. Based on our research and results, a goal for the future should be to achieve better stability of operated train traffic diagrams. This goal is possible to achieve in many ways and through selected measures. The measures can be operational-organisational measures, construction-reconstruction, modernisation of stations or interstation security devices, etc. Operational and organizational measures include, for example, appropriate adjustment of the train traffic diagram in order to achieve better stability and quality. With a high-quality and stable schedule, it will be possible to achieve a more efficient method of transporting trains and thus more efficient railway operation. This is also related to the complex process of planning timetables on the entire railway line, which should be simpler after application of this method, as it will be possible to identify several bottlenecks on the railway infrastructure and within railway operations more effectively. Construction and reconstruction measures include measures that are more economically demanding, as they require investments in the modernization of the railway infrastructure. The construction measures can be double-track or partly double-track [
36].
The measures not only have an operational side but also have an economical side. Optimisation or rework of the train traffic diagram is the cheapest solution. However, while the construction-reconstruction measures or modernisation of station or interstation security devices are financially demanding, in some cases, these measures are necessary to achieve the required number of trains on the selected railway line. Even though the initial investment costs are very high, operational running costs for the manager of infrastructure can be lower than before modernisation. By modernising stations and interstation safety systems, it is possible to achieve lower numbers of operational crew and thus lower operational costs. Additionally, by modernisation, it is possible to reduce maintenance costs. Furthermore, for the manager of the infrastructure, new opportunities in inserting new trains into the train traffic diagram are provided. This solution can bring new sales for the manager of infrastructure from the operational benefits of an increased number of trains. With electrification, new electric vehicles can transport more freight or the same freight with fewer locomotives. In addition, by increasing line speed, it is possible to achieve increased speed of transportation of passengers or freight. For operators and passengers, reduced time of transportation is more advantageous [
37,
38].
The fee for using the infrastructure (CŽI) is composed of four parts. The parts of U1 and U2 are dependent on train kilometres, and parts of U3 and U4 are dependent on gross tonne kilometres. The U3 fee is multiplied by coefficient 1.2 for using a diesel vehicle on an electrified line. The last part is paid only for using electric vehicles. The total fee is calculated by the following formula:
where
U1 payment for ordering and allocation of capacity on a given line category,
U2 payment for the management and organisation of traffic on a given category of line,
U3 payment for ensuring the serviceability of the railway infrastructure on a given category of line,
U4 payment for the use of electrical power supply equipment for the supply of traction power [
38].
By implementation of our methodology, it is possible to increase the reliability of railway transport. However, by constructing a new train traffic diagram with our methodology, it is possible to achieve better reliability of railway transport on one-track railway lines. At the same time, there is no need for new railway constructions to achieve some measures, so by using our methodology, it is possible to save costs while achieving these measures. The outputs of the mentioned methodology and research should also be suitable for use in the case of eliminating various risks in railway operations, especially in defining short-term bottlenecks, train delays in the event of a track lockout, failure of a security device, emergency, accident, etc.
The risks of the methodology lie mainly in the fact that they are linked to software that may be susceptible to failure rates and various cyber-attacks.
The subject of future research will be based on our new methodology, proposing the next concrete measures to find new solutions to the problem of this line. This railway line is very busy, and it has the potential to increase the abundance of trains in regard to suburban areas and the potential to develop intermodal transport. Furthermore, this railway line has the potential to be a bypass line to the main railway lines if the need arises.
It will also be necessary to verify the methodology and the new progressive method for determining the capacity of railway infrastructure on other railway lines with different characteristics in future research. At the same time, it will be necessary to consider sensitivity analysis or probabilistic variables in order to take into account delays or interruptions in real operation in other types of research.
All scientific and research outputs have significant connections in the area of theoretical and practical benefits, especially in terms of contributions [
39,
40,
41]. There are multiple aspects of connections and synergistic effects; for example, it is possible to be inspired by reference [
42]. The most significant synergistic effects relate to the societal benefit, which is particularly significant in the case of high-quality and sustainable transport.
5. Conclusions
The paper is primarily oriented towards enriching science in the field of transport processes with a narrow focus on the capacity of railway infrastructure and introducing a unique method for its determination and a new methodological procedure. The paper is not primarily focused on comparing methods or simulating the throughput or capacity of track sections. The paper presents a specific example of how a train transport schedule can be compiled incorrectly on purpose, i.e., on the edge of stability and discriminatory towards other types of trains. We present that any method used to calculate the capacity indicators of infrastructure (track sections) will already show a “warning” for a significantly loaded—if not overloaded—schedule on the edge of its stability. One-track railway lines have very low reliability, mainly in lines with high performance where a delay is transmitted to other trains. For this reason, it is necessary to increase the reliability of railway transport. This can be achieved through efforts to increase the reliability of the train traffic diagram. Therefore, the square of occupation was added to train routes. Adding the buffer time to the rectangles of occupation has the effect of reducing the potential delay of the train, which it can move to the next train. The average buffer time is 4 min, with transport peak at 2–3 min, but this time is insufficient. In our case study we consider a monitored railway line with buffer times of 0, 1, and 2 min.
By using two hours decomposition with an operating interval of 0 min, the peak of used capacity about 66–68%. However, a selected operation interval of 0 min is not ideal for one-track railway lines but is usable for remote-controlled tracks. If the operating interval is 1 min, the peak capacity of railway infrastructure is used at 72–76%. However, by using an operational interval of 2 min, the peak of the capacity of the railway infrastructure used is 82–83%, which is a very high value. The maximum peak of capacity for the railway line is 75% using UIC [
3]. Use of more than 75% is considered a congested track. It follows that by using a 2 min operational interval, this railway line is congested, and to achieve better values, it is necessary to make some measures.
By planning the train traffic diagram with buffer times, it is possible to achieve sustainable and reliable transport. These changes have low requirements for investing in modernising the railway infrastructure, which is also a suitable method for regional railway lines where investment to modernise the railway line is not possible or is only possible in the long term.
The benefit from the theoretical side is to propose a new scientific method based on a new method of determination of railway line throughput. It is possible to achieve a synergic effect of determination of railway line throughput based on graphical, analytical, and software methods for determination of line throughput. The practical benefit of this study is better identification of narrow and problematic places on the railway infrastructure. This solution can be applied to all railway networks—not only in the Slovak Republic, because the outputs of the paper, including the methodology, are transnational, universal, and generally applicable.
These scientific and professional outputs will help us to identify bottlenecks in the capacity of the railway infrastructure. These are usually deterministic factors related to the traffic characteristics of a particular railway line (number of tracks, length of the interstation sections, number of stations with the possibility of crossing, etc.). Based on them, it is subsequently possible to determine travel times between individual stations, occupancy times, and other factors that affect the capacity of the railway line. Subsequently, we will be able to more effectively approach their hierarchy and set measures to eliminate them. After the implementation of these measures, it will be possible to increase the capacity of the railway infrastructure, meaning that more passenger and freight trains will be able to operate on the mentioned railway line. This will subsequently help to systematically develop railway transport as an ecological and environmentally acceptable mode of transport. Subsequently, this will have a significant contribution to the sustainable transport system as a whole because the entire transport system will be more efficient and sustainable, not only in the mentioned region but also in a national and international context.


