Article

The Co-Firing of Pine Biomass and Waste Coal in 100 and 600 MW Power Plants: A Sustainable Approach to Reduce GHG Emissions

Department of Mechanical Engineering, Georgia Southern University, Statesboro, GA 30460, USA
*
Author to whom correspondence should be addressed.
Sustainability 2025, 17(10), 4473; https://doi.org/10.3390/su17104473
Submission received: 24 November 2024 / Revised: 22 April 2025 / Accepted: 30 April 2025 / Published: 14 May 2025
(This article belongs to the Section Energy Sustainability)

Abstract

:
Climate change is a global issue that has gained much attention recently. Co-firing biomass with coal/waste coal reduces the electricity sector’s GHG emissions sustainably. This study uses commercial software to model waste coal and biomass co-firing in 100 MW and 600 MW power plants. The objective is to assess the effects of fluid types (subcritical and supercritical), plant capacities (100 MW and 600 MW), boiler types (pulverized coal and circulating fluidized bed boilers), biomass and waste coal co-firing ratios (0:100, 20:80, 40:60, 60:40, 80:20, and 100:0), and carbon capture and storage efficiencies (0%, 90%, 95%, and 97%) on performance parameters such as net plant efficiency, heat rate, net plant CO2 and SO2, and particulate matter emissions. The feedstocks selected for this investigation include anthracite waste coal and loblolly pine biomass. As the biomass fraction increases from 0% to 100%, co-fired power plants net efficiency increases by 3–8%. Supercritical plants had a 6% higher net plant efficiency than the subcritical plants. The study found that the biomass’s high heating value decreased the fuel flow rate and reduced plant CO2 emissions by 10–16%. With 100% biomass power plant feed and 90% carbon capture and storage efficiency, CO2 emissions drop by 83% and SO2 and PM emissions drop to zero.

1. Introduction

Climate change is one of the global challenges that is now generating lots of concern. The US’s utility-scale power plants produced 4243 billion kWh, or over 4.24 trillion kWh, in 2022. Fuels source data in utility-scale power generation such as coal (19.5%), natural gas (39.8%), nuclear (18.2%), and renewable energy sources (21.5%) indicate that fossil fuels account for about 60% of the total electricity produced in the US [1]. About 25% of all greenhouse gas (GHG) emissions in the US are emitted by the electricity sector as well as other end-use sectors like industries that utilize electricity [2]. In less than 200 years, human activity has raised the atmospheric concentration of CO2 by 50%, creating a new record for the global average atmospheric CO2 concentration of 420 ppm [3]. The US has set ambitious targets to mitigate the consequences of climate change, such as net-zero carbon emissions by 2050 [4] and carbon-emission-free electricity by 2035 [5].
In the US, coal is one of the primary fossil fuels used to produce electricity [1]. However, coal has an adverse impact on the environment at all phases of production, including mining, transportation, stacking, processing, and combustion. For example, the mining of coal has the potential to damage nearby plants and contaminate the land, air, and water [6]. The massive volumes of greenhouse gas emissions produced by burning coal are a major contributor to the phenomenon of global warming. On the other hand, the United States generates around 100 million tons of bituminous coal refuse, or 320 lbs., for every ton of coal sold [7]. The utilization of readily available coal refuse (waste coal) for power generation can reduce the net CO2 emissions because the mining process is not required. Additionally, the utilization of waste coal supports reclamation projects which will eliminate environmental problems such as acid mine drainage from the waste coal stockpiles and reclaim the land occupied by waste coal. Moreover, biomass-based power generation is expanding quickly due to its lower carbon footprint and ability to meet the net-zero carbon goal when carbon capture and storage (CCS) is implemented.
Several studies have been conducted on the performance and emission assessment of coal-fired, biomass-fired, and coal–biomass co-fired power plants. Dave et al. [8] studied a black coal (Surat Basin)-fired power plant with a gross electrical output of 600 MW operating at an 85% capacity factor. The utilized higher heating value (HHV) of black coal was measured at 20.14 MJ/kg. The analysis revealed that the net plant efficiency was 36.7% in the absence of CCS implementation and 26.7% with CCS adoption for the subcritical range. The net plant efficiency for the supercritical range was determined to be 39.2% without CCS integration and 29.1% with CCS integration. Additionally, it was discovered that the implementation of CO2 capture in these plants results in a decrease of around 10% in net plant efficiency and a more than twofold increase in the cost of electricity generation across all plants. Strube and Manfrida [9] conducted a study on the efficiency of a 500 MW pulverized coal power plant that utilized monoethanolamine (MEA) and ammonia as chemical solvents for capturing CO2 after combustion. The higher heating value (HHV) and lower heating value (LHV) of the coal were determined to be 27.06 MJ/kg and 25.87 MJ/kg, respectively. The study determined that the net plant efficiency of the plant, without integrating carbon capture technology, was 36.3%. The net plant efficiency for capture instances was determined to be 28.4% for MEA-based capture and 21.8% for ammonia-based capture. The study proposed that the most practical approach to upgrading current power plants is to implement the post-combustion capture method, as long as the levels of SOX and NOx are decreased to the necessary thresholds to minimize the degradation of the solvent. Tramošljika et al. [10] conducted a performance assessment of a potential advanced ultra-supercritical coal-fired power plant with a net plant capacity of 700 MW equipped with post-combustion CCS technology. They demonstrated that when the rate of CO2 removal was set at 90%, the net efficiency of the advanced ultra-supercritical unit integrated with CCS was found to be 36.8%. The net efficiency loss incurred was 10.8%, and the penalty on power generation amounts to 362.3 kilowatt-hours per metric ton of CO2 for the current state of CCS technology. The study also found that the absorption of CO2 by a 30% weight MEA solution leads to net efficiency losses ranging from 9.7% to 13.4%, depending on the heating duty and temperature of the reboiler. Although coal-based power generation dominated the energy sector over the years, the push for a zero-carbon energy economy led to the deployment of advanced biomass-based power generation.
Several studies have reported on the performance and emissions profiles of power plants that utilize biomass as a fuel source. Ghenai et al. [11] performed an analysis of the performance of biomass-fired power plants with a capacity of 10 MW in West Palm Beach, Florida. Their study utilized various forms of biomasses, including bagasse, corn stover, forest residues, and urban wood residues. The investigation revealed that the thermal efficiency of the biomass-fueled power plant ranged from 26.51% to 27.75%. The heat rate was determined to be between 12.29 and 12.87 MMBtu/MWh, and the capacity factor ranged from 83.34 to 84.74. Another study carried out by Brown et al. [12] evaluated the environmental performance of four newly constructed biomass plants situated in Altavista, Hopewell, Southampton, and Pittsylvania. The assessment was based on the estimated emissions of nitrogen oxides (NOX), sulfur dioxide (SO2), and carbon dioxide (CO2) produced per megawatt-hour (MWh) of electricity generated. These power facilities have been transformed from coal plants to exclusively using biomass fuel, specifically woody biomass or wood waste, as their source of fuel. The study demonstrated a decrease in NOX emissions by around 50–62% when comparing the emissions of NOX per MWh in 2012 with their rate in 2014 in Hopewell and Southampton. In comparison to the statistics from 2010, the Altavista power plant witnessed a reduction of 37% in NOX emissions in 2014 and a further reduction of 99% in 2016. Even though biomass-based power generation reduced GHG emissions significantly, storage and logistics are the major hurdles for large-scale advanced biomass-based power generation.
The co-firing of biomass and coal is a potential solution to decarbonize large-scale (typically > 300 MW) power plants. Numerous studies have focused on the modeling and performance of coal and biomass co-fired power plants with various boiler types and power plant capacities. To investigate important performance parameters like boiler efficiency, net plant efficiency, and combustion characteristics from the co-firing of different biomasses with two low-ranked coal samples based on an existing 500 MW pulverized coal-fired power plant, Mun et al. [13] used a commercial process simulator in their study. The results quantitatively demonstrate that co-firing biomass with coal decreases the net plant efficiency because biomass has a lower heating value (LHV) than coal. However, among both biomass and low-rank coal co-firing, the plant efficiency of torrefied biomass co-firing was the highest because of the increased energy density and enhanced grindability of the torrefied biomass. D. Cebrucean et al. [14] reported on a simplified form of a pulverized coal-fired power plant with biomass co-firing and integrated a post-combustion chemical absorption process for CO2 collection. The main parts of the plant were a pulverized coal (PC) boiler and a flue gas desulfurization (FGD) section, where coal and biomass were co-fired and particulate matter, NOx, and SO2 emissions were generated. These pollutants were removed using chemical absorption-based CCS technology. The study found that the net power plant efficiency of supercritical power plants was approximately 2.4% greater than that of conventional subcritical power plants. As a result, there was a roughly 6% decrease in CO2 emissions compared to subcritical units. When accounting for the carbon neutrality of the biomass source, the addition of biomass to the feed in power plants resulted in a CO2 emission reduction of around 28%. In a study by Andric et al. [15], two methods were explored to address two important aspects of power production: the carbon footprint and an emergency evaluation of coal biomass co-firing. The study also showed that including around 20 percent biomass into the combustion mixture reduces CO2 emissions by about 11–25 percent and energy flow by about 8–15 percent.
As discussed above, there have been several studies on the performance and emission characteristics of coal power plants [8,9,10], biomass-based power plants [11,12], and coal and biomass co-fired power plants [13,14,15]. To our knowledge, detailed assessments of waste coal (coal refuse) and pine biomass have not been reported in the literature. In addition, as discussed above, the major literature studies focused primarily on the effects of co-firing ratios of conventional coal and biomass on power plant performance. In this study, the effects of plant capacities (100 and 600 MW), boiler types (PC and CFB), fluid types (Subcritical and Supercritical), waste coal and biomass co-firing ratios (0:100, 20:80, 40:60, 60:40, 80:20, and 100:0), and CCS efficiencies (90, 95 and 97) on the performance of waste coal and pine biomass co-fired power plants are investigated.
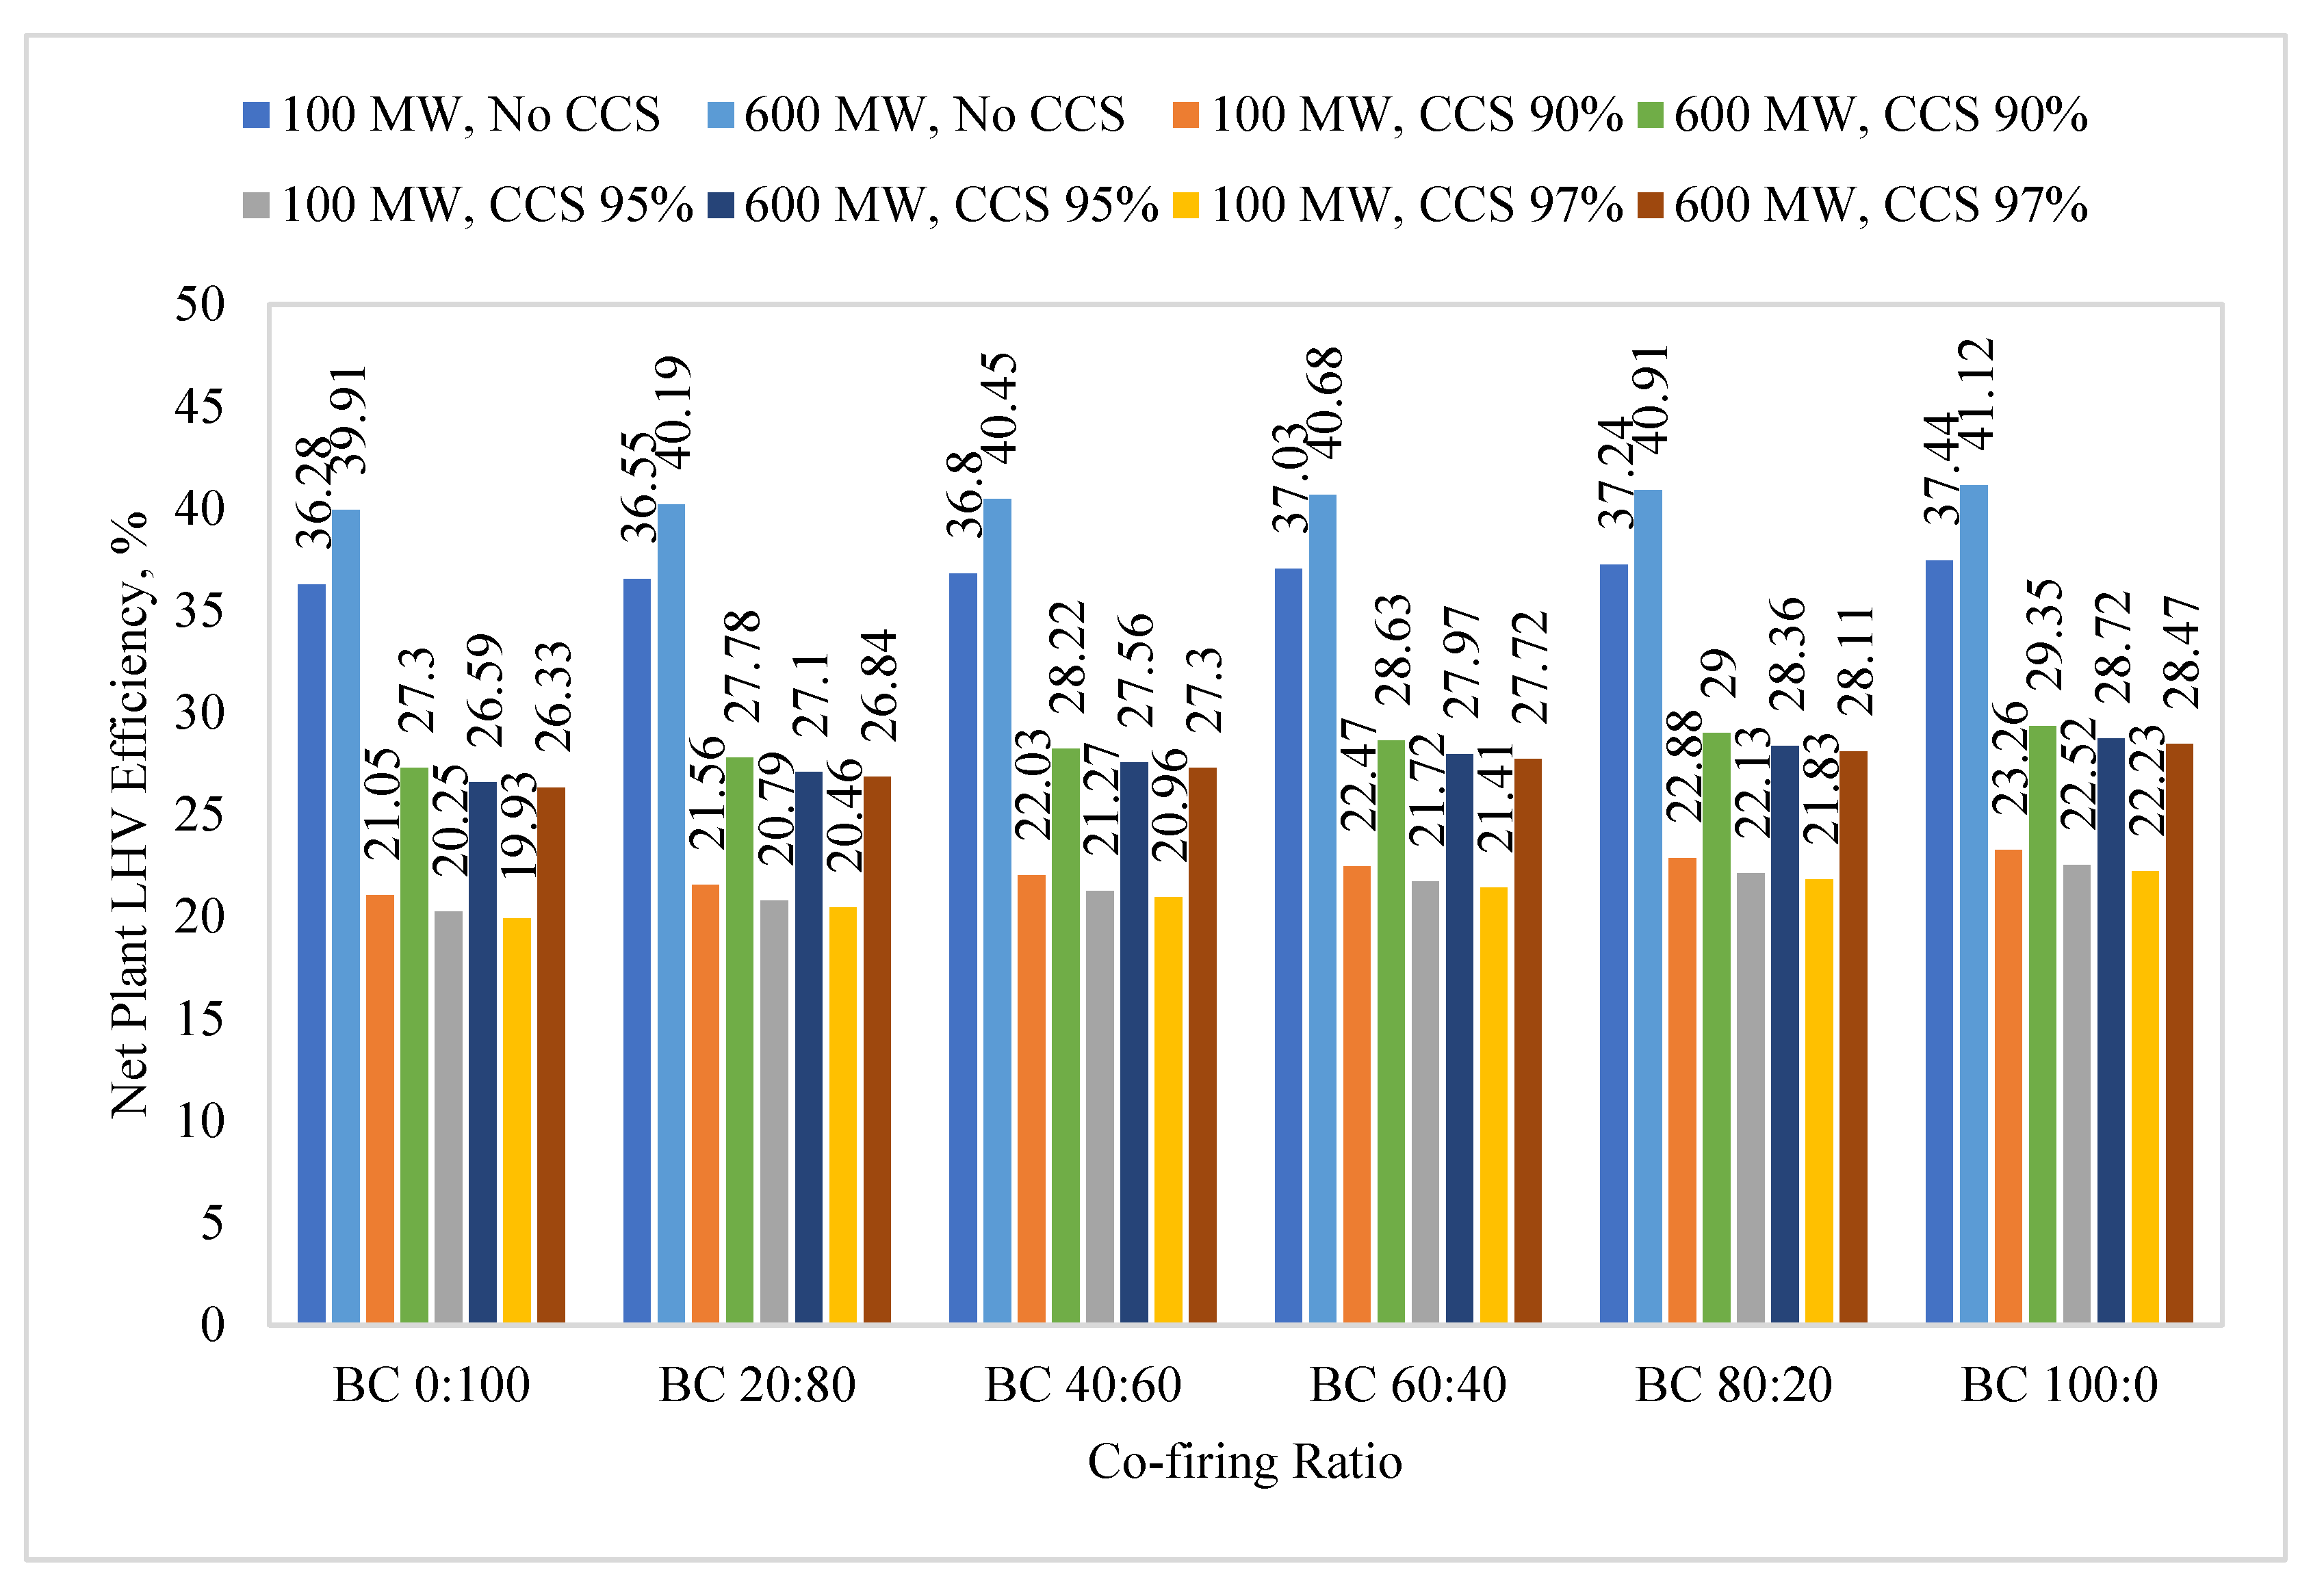
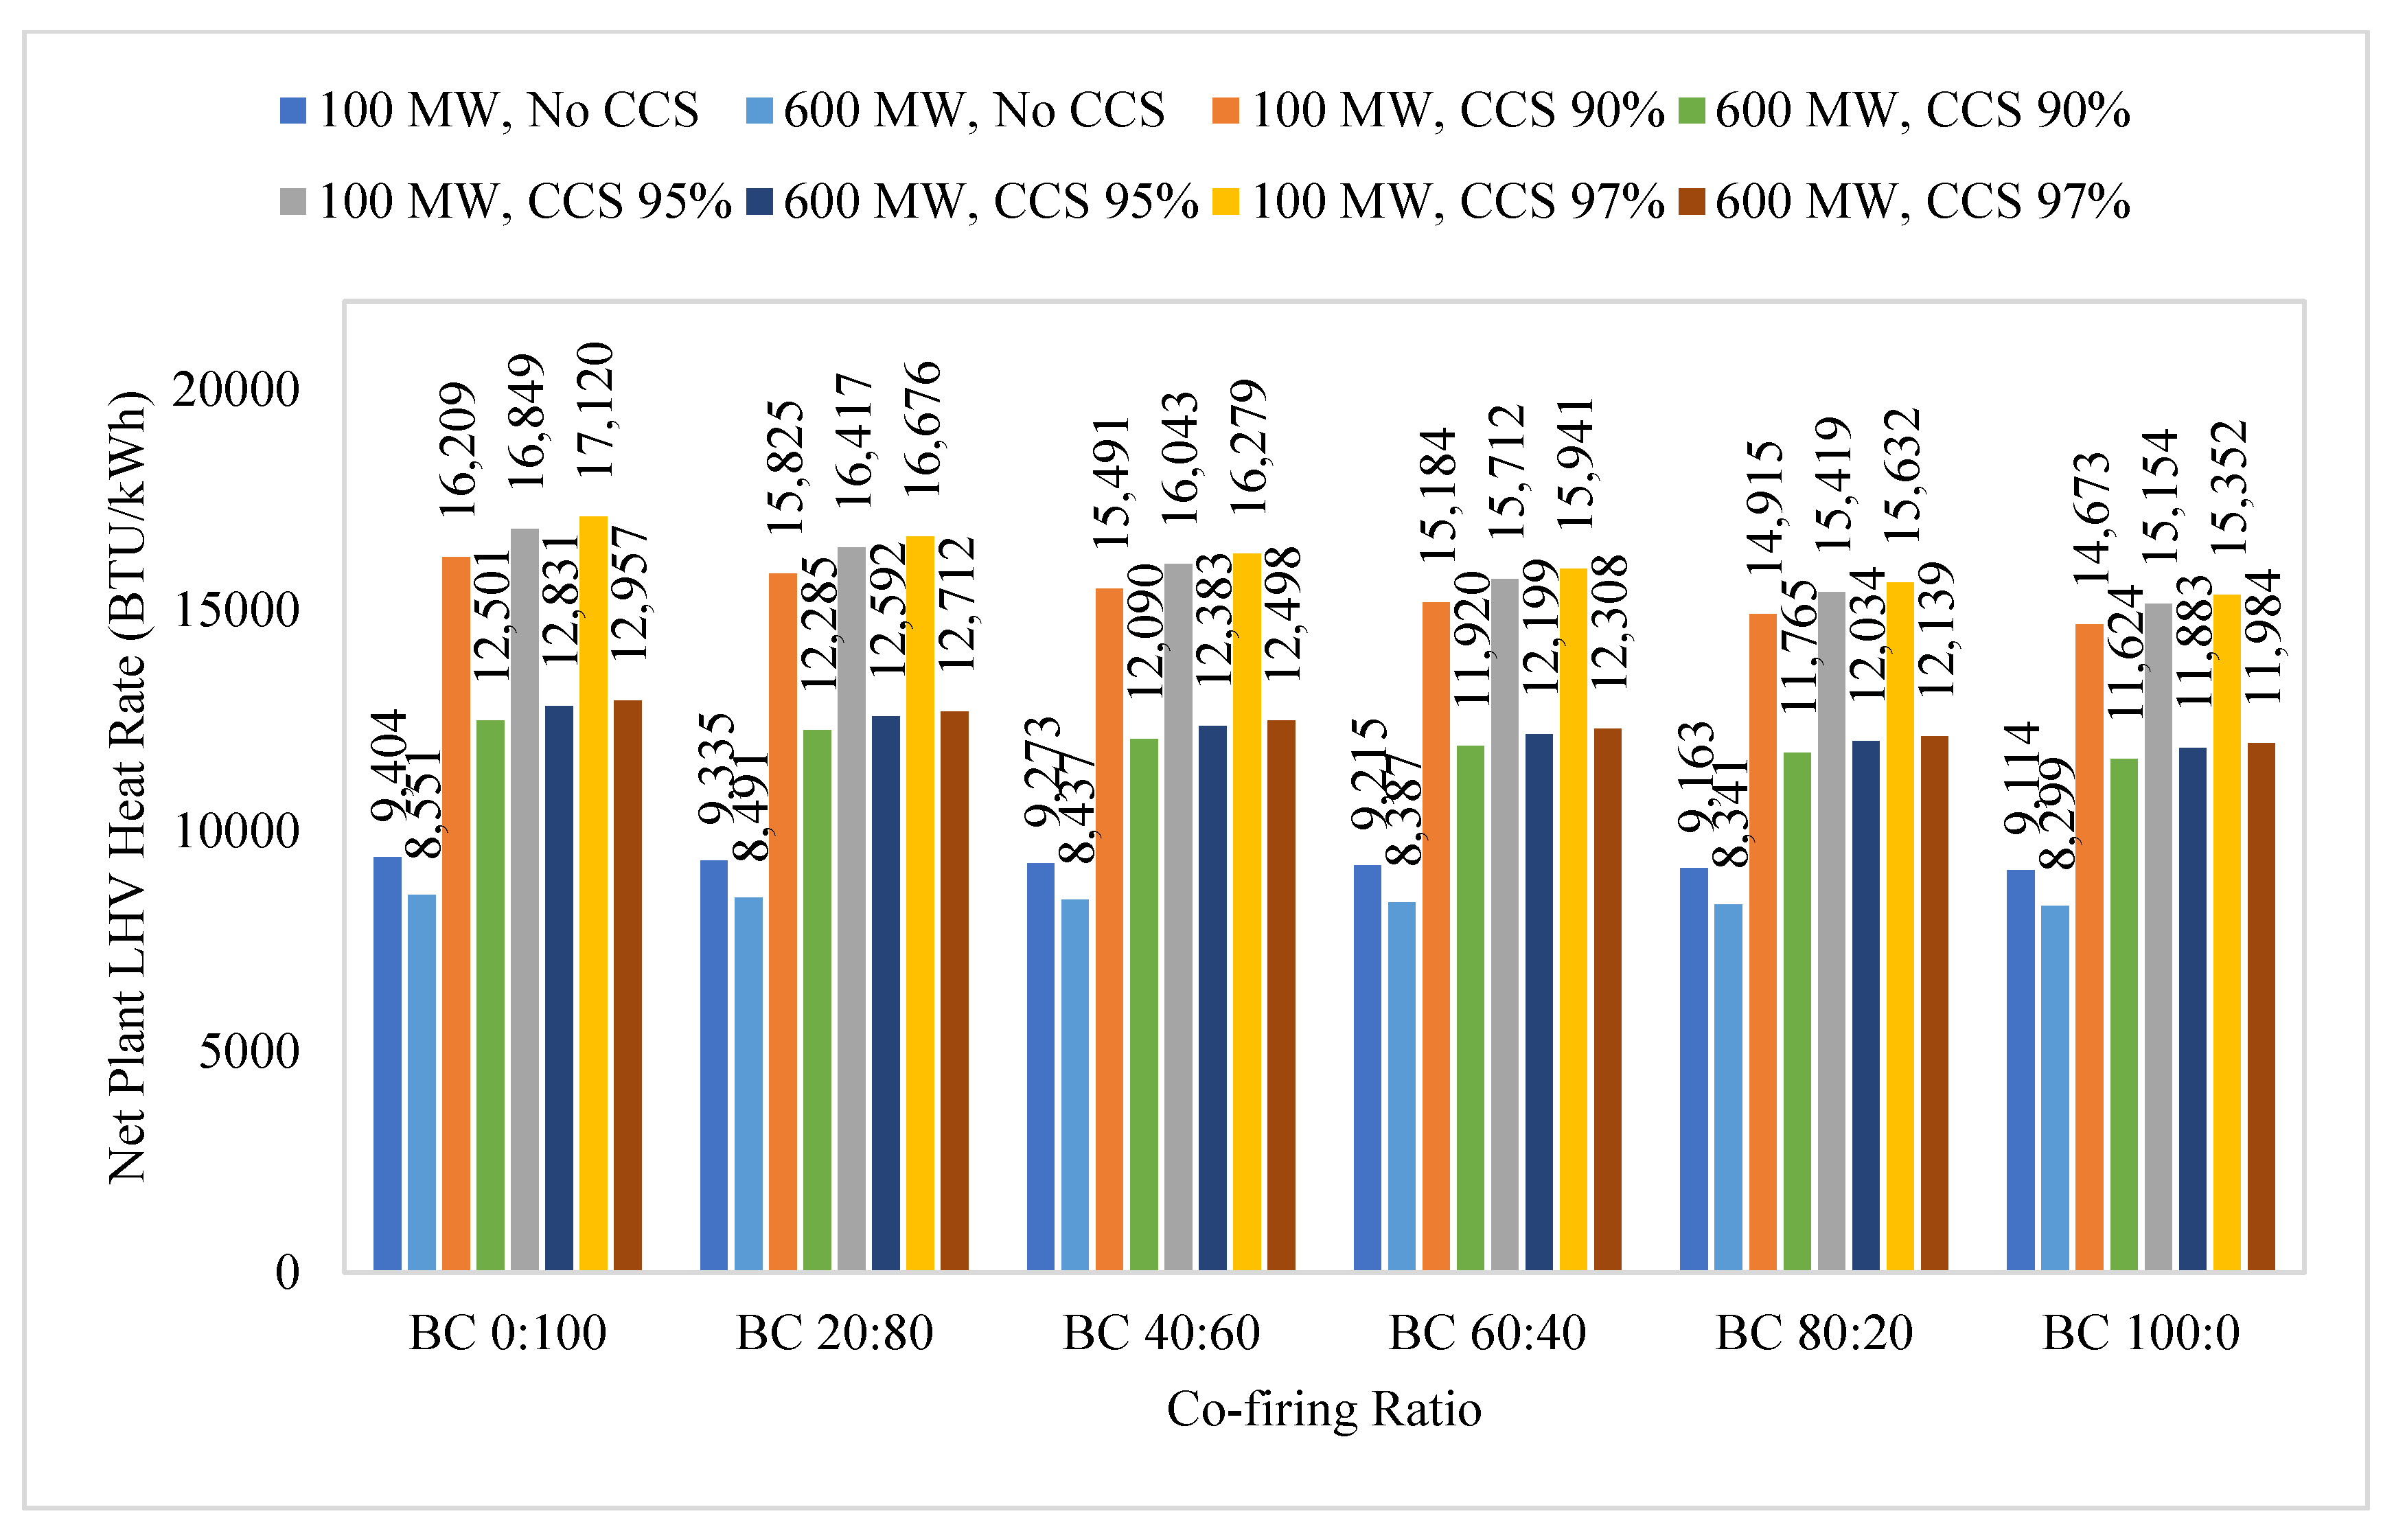
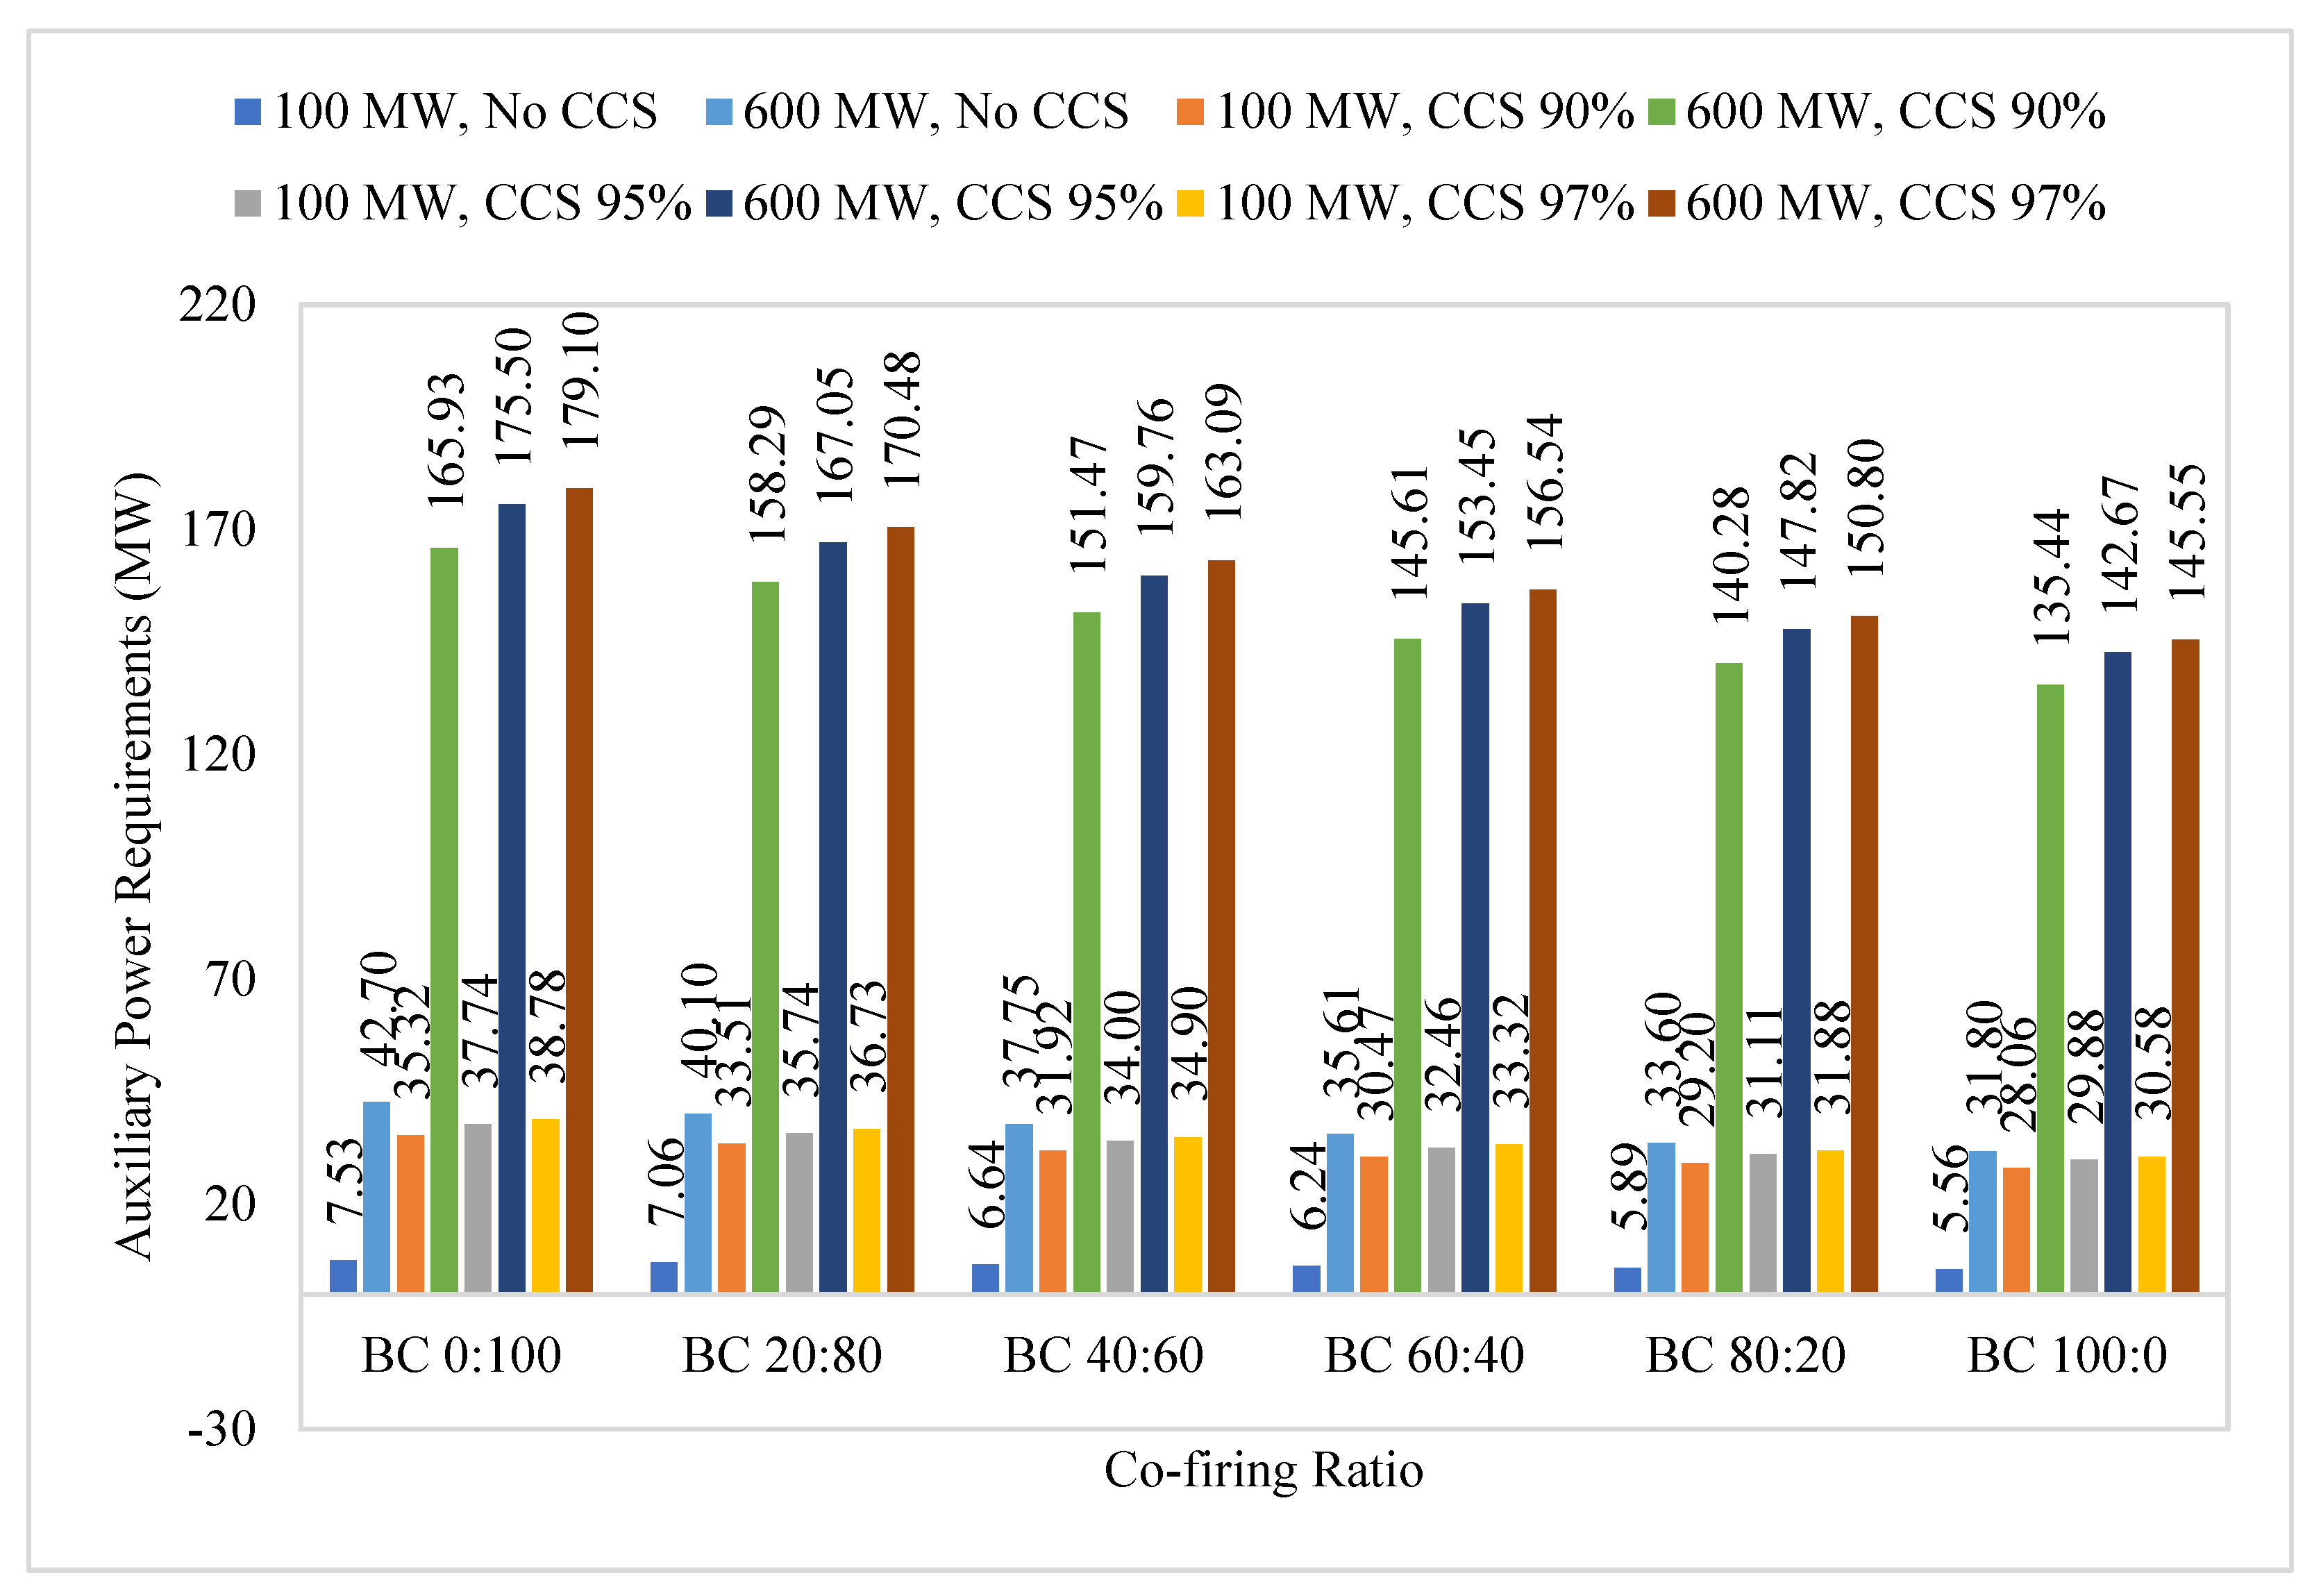
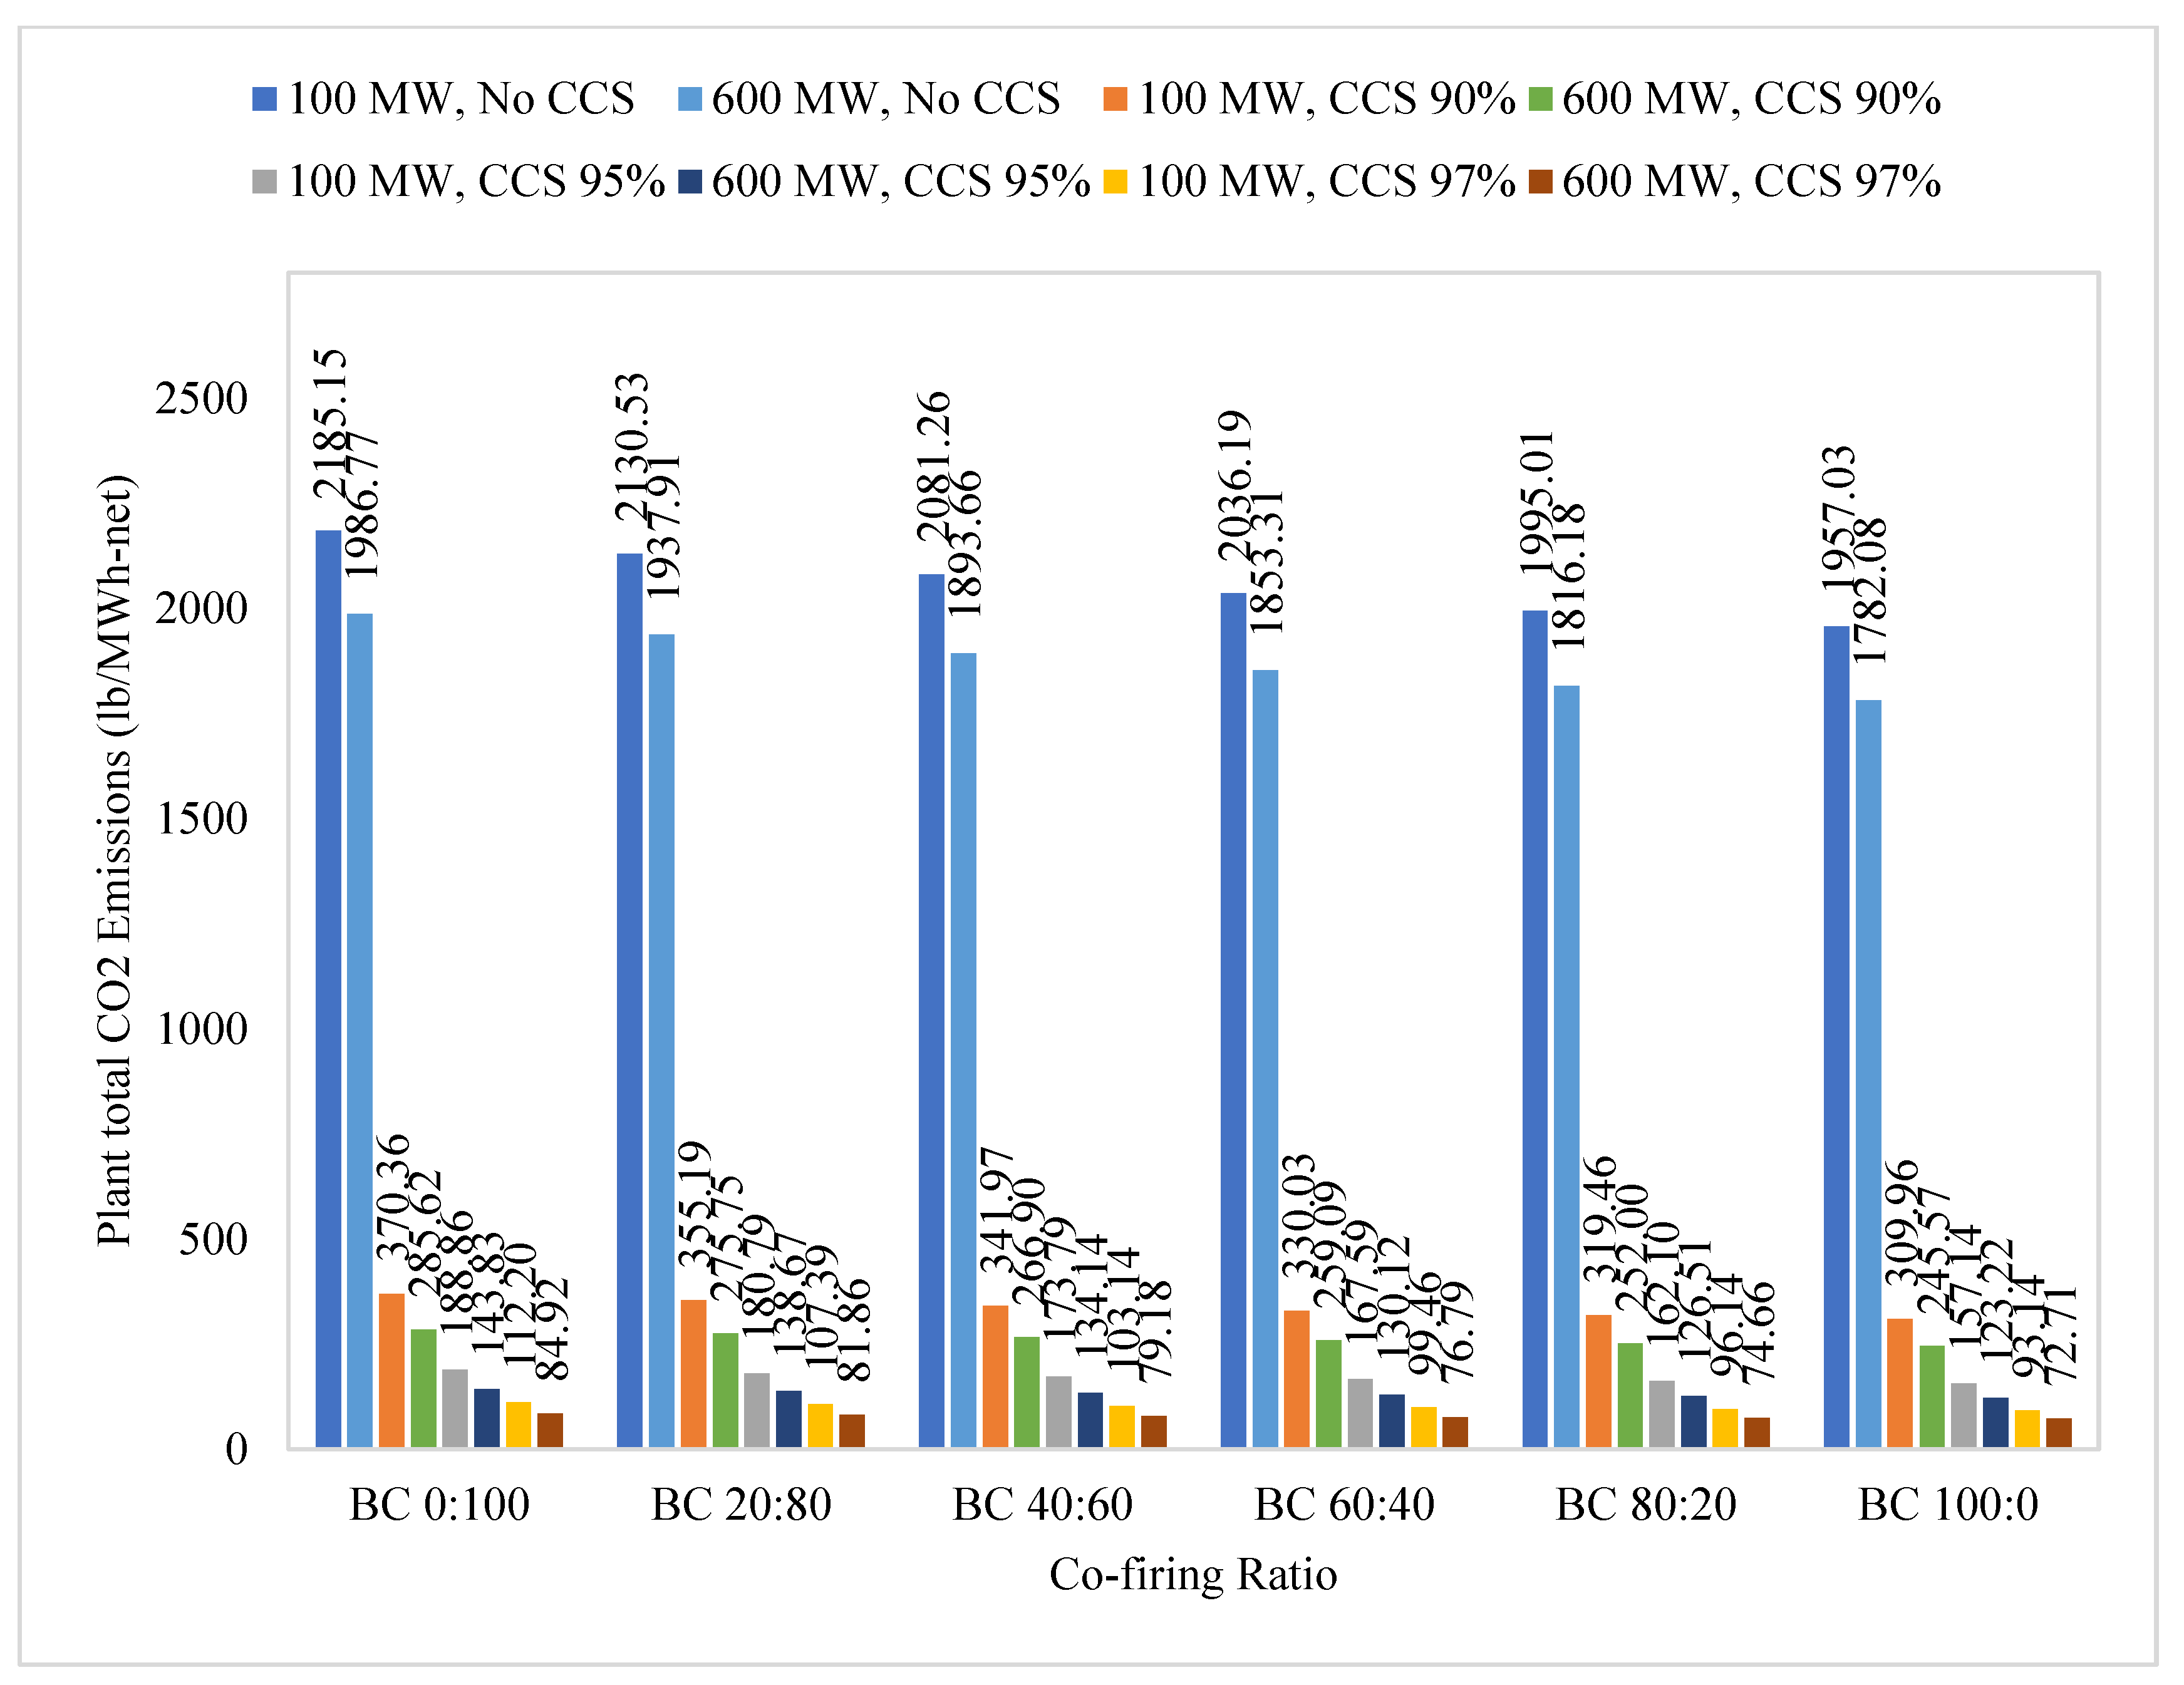
The objective of this study is to evaluate the performances of waste coal and biomass co-fired circulating fluidized bed (CFB)- and pulverized coal (PC)-fired power plants with net plant capacities of 100 MW and 600 MW. For 100 MW co-fired power plants, only subcritical phases have been considered, whereas both the subcritical and supercritical phases have been considered for the co-fired power plant with 600 MW net plant capacity. The key performance parameters considered for this study were gross power output, the net plant LHV/HHV heat rate, auxiliary and transformer losses, and net plant LHV/HHV efficiency. Additionally, important power plant emissions such as plant total CO2, particulate matter, and SO2 emissions were also considered and compared with different co-firing cases. The performance of the co-fired power plants was examined at biomass waste coal co-firing ratios of 0:100, 20:80, 40:60, 60:40, 80:20, and 100:0. Overall, the impacts of co-firing ratios, PC and CFB boiler types, CCS technology implementation, plant capacity, and subcritical and supercritical fluid types were taken into consideration when comparing the performance and emission characteristics of the co-fired power plants.

2. Materials and Methods

2.1. Characterization of Feedstocks

Anthracite waste culm and loblolly pine biomass were used as feedstocks for the performance assessment of the waste coal and biomass co-fired power plants. Loblolly pine was obtained from the Biomass Characterization Laboratory of Idaho National Laboratory. Anthracite waste culm was acquired from the Schuylkill County of Pennsylvania. Photographic views of the Loblolly pine and Anthracite waste culm are displayed in Figure 1.
A comprehensive characterization including ultimate, proximate, and ash analyses was performed by Hazen Research, Inc. (Golden, CO, USA) The characterization of the feedstocks is shown in Table 1.
Table 1 demonstrates that loblolly pine has a lower nitrogen content (0.08% db) than that of anthracite waste culm (0.63% db), which is important for reducing nitrogen-related emissions such as NOx. Compared to anthracite waste culm, the sulfur content in pine is incredibly low (0.01% db for pine biomass whereas 0.54% db for anthracite waste coal) which will reduce sulfur-related impurities. Pine’s ash content is negligible (1.26%, db) compared to anthracite waste culm (49% db). The low ash content of pine biomass would significantly reduce the costs related to the handling and management of ash. The heating value of pine biomass is higher compared to anthracite waste culm because the waste coal has approximately 50% (db) ash content. Therefore, loblolly pine is a suitable candidate for improving efficiency and reducing pollutants linked to sulfur and nitrogen in addition to carbon dioxide.
The site used in this study is located at Savannah River, Georgia, United States of America, where a plentiful supply of loblolly pine biomass is available, and an adequate amount of waste coal supply is anticipated from Pennsylvania. The ambient conditions of the study’s site along with the site characteristics are reported in Table 2.

2.2. Power Plant Model

An assessment of the waste coal and biomass co-fired power plants was performed using detailed heat and mass balances developed through a commercial power plant modeling software, i.e., STEAM-PRO (Thermoflow Inc., Jacksonville, FL, USA). The primary reason for the selection of the STEAM-PRO software (Version: Thermoflow 31) is that this software designs and predicts the performance parameters of conventional steam power plants based on the original equipment manufacturer (OEM) data of the power plant equipment. Thus, the STEAM-PRO modeling software has the capability of accurately designing conventional steam power plants, enabling the user to rapidly obtain the power plant configuration and the performance parameters at varying scenarios. STEAM-PRO also allows the user to model the CO2 capture system with the built-in function provided. For our studies, the 100 MW anthracite waste coal and loblolly pine biomass-based power plant for the subcritical case is analyzed, whereas both the subcritical and supercritical cases are assessed for the co-fired power plants with 600 MW plant capacities. The plant configurations considered include both the PC and CFB boilers. For the instances where CCS is implemented, three distinct carbon capture efficiencies of 90%, 95%, and 97% are used, and amine-based carbon capture commercial technology is incorporated. Figure 2 exhibits the process flow diagram (PFD) of 600 MW subcritical PC-fired power plants at a biomass/waste coal co-firing ratio of 60:40 with the incorporation of CCS at 90% carbon capture efficiency. The plant configuration includes a PC boiler, a single-reheat condensing steam turbine, and pressure turbines consisting of high-pressure turbines, low-pressure turbines, and intermediate-pressure turbines. In addition, the setup has a boiler feed pump, feedwater heaters, a water-cooled condenser with a mechanical draft cooling tower, an electrostatic precipitator (ESP), wet flue gas desulfurization (WFGD), and a carbon capture system. Steam properties were evaluated using IFC-67. The performance assessment of the 100 MW subcritical and 600 MW subcritical and supercritical power plants was performed at biomass-to-waste coal co-firing ratios of 0:100, 20:80, 40:60, 60:40, 80:20, and 100:0. For the performance and emission assessment of the co-fired power plants, significant power plant performance parameters such as net plant efficiency, net plant heat rate, and auxiliary power consumption were considered, whereas for the emission characteristic assessment, net plant CO2 emissions, net plant SO2 emissions, and net plant particulate matter (PM) emissions were considered. These power plant parameters signify the most important performance and emission parameters that are needed to accurately describe the performance and emissions of the power plant. Other power plant emissions, such as VOC and NOx, were excluded from this study due to the inadequacy of the STEAM-PRO modeling software to accurately assess these emissions. The net plant efficiency and heat rate were determined using the following equations.
Net   plant   efficiency = Electricity   output B o i l e r   h e a t   i n p u t
N e t   p l a n t   h e a t   r a t e = B o i l e r   h e a t   i n p u t E l e c t r i c i t y   o u t p u t
where
  • Net plant electricity efficiency is reported in %;
  • Electricity output is reported in kW;
  • Boiler heat input is reported in kJ/h.
The heating value (kJ/kg) is multiplied by the fuel flow rate (kg/h) to determine the boiler heat input. The electric efficiency and heat rate of the plant were measured using higher and lower heating values. The unit of measurement for electrical output is kW. Thus, the plant heat rate is reported in kJ/kWh. The term “plant heat rate” refers to the amount of energy needed to produce one kWh of electricity.
Figure 2. Process flow diagram (PFD) of a 600 MW subcritical CFB power plant at a co-firing ratio of 60:40 and 90% carbon capture efficiency.
Sustainability 17 04473 g002

2.3. Validation of the Power Plant Model

The validation of the developed STEAM-PRO models was performed using the data of the 660 MWe supercritical pulverized coal-fired power plant reported by Suresh et al. [16] and Hanak et al. [17]. This plant used coal as the feedstock. The configuration includes a boiler feed pump, an electrostatic precipitator (ESP), wet flue gas desulfurization (WFGD), five low-pressure and three high-pressure feedwater heaters, a single-reheat condensing steam turbine, a water-cooled condenser with a mechanical draft cooling tower, and a boiler feed pump. Table 3 represents the model validations expressed as percentages of error (%) between the model parameters and the published literature data. The STEAM-PRO models accurately predicted the performance parameters of the plant. The primary model parameters, including coal flow rate and plant efficiency, differed by five percent. The pressure, temperature, and flow rates of the steam turbine are all within 7%. The temperature variance of the feedwater was 8.4%, which is within the allowed limit for an industrial-scale unit.
The STEAM-PRO models were also validated using the hybrid poplar biomass and Illinois 6 coal co-fired power plant data reported in the techno-economic and lifecycle baseline report published by NETL [18], which are shown in Table 4 and Table 5 [19].
Table 3. Model vs. literature data of a 660 MW PC-fired power plant [19].
ParametersUnitLiterature [17]Model% Error
Gross PowerMW660660−0.04
Auxiliary PowerMWe*25-
Net Power OutputMW*634-
Net Plant HHV Efficiency%38.7640.764.91
Coal Flow Ratekg/s58.6158.03−1.00
Net Plant HHV Heat RatekJ/kWh*8832-
HP Turbine
     Inlet Pressurebar242.2242−0.08
     Inlet Temperature°C5375370.00
     Inlet Mass flow ratekg/s550.7562.82.15
IP Turbine
     Inlet Pressurebar42420.00
     Inlet Temperature°C5655650.00
     Inlet Mass flow ratekg/s466.2452.3−3.07
LP Turbine
     Inlet Pressurebar2.982.980.00
     Inlet Temperature°C215.6213.5−0.98
     Inlet Mass flow ratekg/s346324−6.79
     Outlet steam quality*0.930.871−6.77
Final Feedwater Temperature°C279.6305.38.42
* Not reported.
Table 4 and Table 5 demonstrate that the percentage errors for the coal flow rate, net power, gross power, steam turbine pressure, temperature, and flow rates, as well as net plant efficiency, which are all less than 4%. A maximum error of 11.8 percent was noted in auxiliary power consumption as a consequence of more than 10% error in the low-pressure steam turbine flow rate. These errors are primarily due to the difference between the default assumptions of the STEAM-PRO model and the parameters used in the published study. It is important to note that the STEAM-PRO estimation is based on the assumptions of several hundreds of input parameters of various equipment used in steam power plants. Although, the default assumptions of the STEAM-PRO model are based on the original equipment manufacturer (OEM) data of the steam power plant equipment, there are variations in equipment data based on the suppliers and operating conditions. These are the primary limitations and biases in the estimated results of this study.

3. Results and Discussion

The following sections examine the thermal efficiency and environmental impact of power plants co-firing anthracite waste coal and loblolly pine biomass. The performance characteristics of net plant efficiency, the net plant heat rate, and auxiliary power have been extensively analyzed and described in the following section. This discussion focuses on the substantial plant total emissions released by co-fired power plants, including carbon dioxide (CO2), sulfur dioxide (SO2), and particulate matter (PM) emissions.

3.1. Performance of the Power Plants

The performance assessment of the co-fired power plants has been evaluated by considering the net plant capacities, co-firing ratios, fluid types, combustion boiler types, and carbon capture efficiencies on key plant performance parameters, including net plant efficiency, net plant heat rate, and auxiliary power requirement.

3.1.1. Net Plant LHV Efficiency

The following analysis examines the effects of net plant capacities, co-firing ratios, fluid types, combustion boiler types, and carbon capture efficiencies on the net plant LHV efficiency of co-fired power plants.

Effects of Plant Capacities, Co-Firing Ratios, and Carbon Capture Efficiencies on Net Plant LHV Efficiency

Figure 3 represents the net plant efficiency of the 100 MW and 600 MW CFB subcritical power plants with varying biomass and waste coal ratios with or without the implementation of CCS technologies. The net plant efficiency of the power plants increases as the biomass fraction in the power plant feed increases for both the 100 MW and 600 MW configurations. The net plant efficiency of both the 100 MW and 600 MW CFB subcritical power plants increases by around 3–8%, depending on the co-firing and CCS configurations, as the biomass fraction in the power plant increases from 0% to 100%. The reason for this is that in this study, the loblolly pine biomass had a higher heating value (LHV: 18.4 MJ/kg) compared to anthracite waste coal (LHV: 15.1 MJ/kg). Consequently, increasing the proportion of biomass in the power plant feed leads to a higher net plant efficiency. The inclusion of the CCS system necessitates additional power for its operation, thereby leading to a reduction in the overall efficiency of the plant. Integrating CCS with 90% carbon capture efficiency leads to a roughly 37–43% reduction in net plant efficiency compared to scenarios where CCS is not implemented. Increasing carbon capture efficiency from 90% to 97% results in a further loss of around 3–6% in net plant efficiency. The net plant capacity of the co-fired power plant also influences the net plant efficiency of the power plant. The net plant efficiency of the power plant with a capacity of 600 MW is 10% higher in non-CCS instances and around 30% higher in CCS scenarios compared to power plants with a capacity of 100 MW. The results also align with NETL’s baseline study on the performance, economics, and impact on the environment of co-firing Illinois 6 coal with hybrid poplar biomass [18]. The NETL study found that a co-fired power plant with no CCS integration and with a capacity of 650 MW and 35% of its feedstock consisting of poplar biomass had a net plant efficiency of 39%. In comparison, our study showed that a co-fired power plant with a capacity of 600 MW and a biomass ratio of 40% had a net plant efficiency of 40.45%.

Effects of Fluid Types and Combustion Boiler Types on Net Plant LHV Efficiency

The supercritical power plants, in both CFB and PC configurations, demonstrate a superior net plant efficiency of approximately 6% higher compared to the subcritical configurations. This validates the use of a supercritical fluid in co-fired power plants instead of a subcritical fluid. It was also demonstrated that CFB-fired power plants yield a net plant efficiency value approximately 3% greater than that of PC-fired power plants, which was expected because of the high heat transfer rate in CFB boilers due to the fluidization effects. It may be inferred that the CFB-fired power plants would yield a greater net plant efficiency value compared to the PC-fired power plants. Similar trends have been observed for the co-fired plant configurations with higher carbon capture efficiencies. Table A1 in the Appendix A Section exhibits the comparison of the net plant LHV efficiency of the co-fired power plants based on fluid types and combustion boiler types.

3.1.2. Net Plant Heat Rate

The following analysis examines the effects of co-firing ratios, fluid types, combustion boiler types, and carbon capture efficiency on the net plant heat rate of co-fired power plants.

Effects of Net Plant Capacities, Co-Firing Ratios, and Carbon Capture Efficiencies on Net Plant Heat Rate

Figure 4 displays the net plant LHV heat rate of the 100 MW and 600 MW CFB subcritical co-fired power plants, showcasing different biomass and waste coal ratios and carbon capture efficiencies. The net plant heat rate drops as the co-firing ratio increases, regardless of configuration. When the biomass fraction in the power plant feeds increases from 0% to 100%, the net plant heat rate decreases by approximately 3–8%. This outcome is anticipated due to the observed correlation between an increase in the biomass fraction in the power plant feed and a subsequent improvement in the overall net plant efficiency. Consequently, the net plant heat rate decreases as the biomass ratio increases. When CCS systems are added to a co-fired power plant, the net plant heat rate increases by around 28–46%, depending on the co-firing ratios and CCS efficiency, compared to scenarios without CCS. This increase is further amplified when the carbon capture efficiency of the CCS system increases. This is because the integration of CCS necessitates additional energy for operation, resulting in a decline in the overall efficiency of the power plant. Thus, the net plant heat rate of the power plants increases. The plant capacity of co-fired power plants also impacts the net plant heat rate of these power plants. The net plant heat rate of 600 MW co-fired power plants without CCS integration is roughly 9–25% lower than that of 100 MW co-fired power plants, which is primarily due to higher efficiencies at larger plant capacities. This justifies the implementation of large-scale power plants, which reduce the levelized cost of electricity (LCOE).

Effects of Fluid Types and Combustion Boiler Types on Net Plant Heat Rate

In our assessment, both the CFB and PC designs of supercritical power plants have a lower net plant heat rate of around 5–6% compared to subcritical power plants. The comparison between supercritical power plants and subcritical power plants demonstrates the better net plant efficiency achieved by the former. Furthermore, the power plants with PC configurations had a higher net plant heat rate compared to the power plants with CFB designs, with a difference of around 2–4%. This suggests that CFB-configured power plants have a higher net plant efficiency than PC-configured power plants. Therefore, most modern power plants specifically for biomass and waste coal incorporate CFB. Comparable occurrences are noted for the 100 MW scenarios and scenarios with different carbon capture efficiency arrangements. Table A2 in the Appendix A Section illustrates the comparison of the net plant LHV heat rate of the co-fired power plants based on fluid types and combustion boiler types.

3.1.3. Auxiliary Power Requirements

The following analysis examines the effects of net plant capacities, co-firing ratios, fluid types, combustion boiler types, and carbon capture efficiencies on the auxiliary power requirements of biomass and waste coal co-fired power plants.

Effects of Net Plant Capacities, Co-Firing Ratios, and Carbon Capture Efficiencies on Auxiliary Power Requirements

Figure 5 illustrates the auxiliary power requirements of the 100 MW and 600 MW CFB subcritical co-fired power plants. The figure depicts the effects of net plant capacity, biomass and waste coal co-firing ratios, and carbon capture efficiencies on the auxiliary power requirements of the co-fired power plants. Observations indicate that when the biomass fraction in the power plant feed increases, i.e., the co-firing ratio, there is a gradual drop in the auxiliary power requirements. When the co-firing ratio is increased from 0% to 100%, the auxiliary power requirements are reduced by approximately 20–25%, depending on the carbon capture efficiency. The reason for this is that in this study, the loblolly pine biomass (LHV: 18.4 MJ/kg) has a greater heating value compared to anthracite waste coal (LHV: 15.1 MJ/kg). Consequently, by raising the biomass percentage in the power plant feed, the fuel flow rate needed to reach the target plant capacity decreases, thereby reducing the auxiliary power requirements. The auxiliary power needs of instances with carbon capture and storage requirements are approximately 2.8–3.6 times higher than those without a carbon capture system installed because CCS requires additional energy for its operation. The need for additional power increases even more as the carbon capture efficiency is enhanced in the co-fired power plants.

Effects of Fluid Types and Combustion Boiler Types on Auxiliary Power Requirements

The supercritical power plants in both the CFB and PC variants exhibit approximately 5–6% lower auxiliary power requirements compared to the subcritical power plants. Supercritical power plants have lower auxiliary loads compared to subcritical power plants because they are efficient. Supercritical power plants exhibit higher efficiencies because of several reasons. For example, supercritical plants typically operate at higher steam pressures and temperatures than subcritical plants, which leads to higher steam turbine output due to higher input steam enthalpies. Additionally, supercritical plants have lower heat loss due to a single phase of fluid. The efficiencies of steam turbines for supercritical fluid are superior compared to subcritical fluid-based turbines. Consequently, the efficiencies of supercritical plants are higher than those of subcritical plants. Furthermore, the power plants designed with PC-fired boilers have a higher need for auxiliary power compared to the power plants configured with CFB for both subcritical and supercritical fluid types, with an increase of approximately 7–9%. Since the efficiency of CFB boilers are higher than that of PC boilers, the auxiliary loads in CFB boilers are lower than those of PC boilers. The efficiency in CFB boilers is higher because of better mixing of air and fuel and heat transfer, which leads to nearly complete combustion. This supports the use of CFB-configured power plants instead of PC-configured power plants for a wide range of feedstocks such as waste coal and biomass in modern power plants. Table A3 in the Appendix A Section shows the comparison of the auxiliary power requirements of the 600 MW co-fired power plants based on fluid types and combustion boiler types with varying co-firing ratios.

3.2. Emissions of the Power Plants

The emission assessment of the pine biomass and anthracite waste coal co-fired power plants has been discussed with respect to the plant total emissions of the power plants such as CO2 emissions, SO2 emissions, and particulate matter (PM) emissions.

3.2.1. CO2 Emissions

The plant total CO2 emissions generated from the biomass–waste coal co-fired power plants have been analyzed with respect to the impacts of net plant capacities, biomass-waste coal co-firing ratios, fluid types, combustion boiler types, and the efficiencies of carbon capture and storage.

Effects of Net Plant Capacities, Co-Firing Ratios, and Carbon Capture Efficiencies on CO2 Emissions

Figure 6 depicts the plant total carbon dioxide (CO2) emissions produced by the furnaces of the 100 MW and 600 MW CFB subcritical co-fired power plants. The emissions are shown for different ratios of biomass–waste coal co-firing and various levels of carbon capture efficiencies. In all scenarios, the carbon dioxide emissions from the power plants drop as the proportion of biomass in the feed of the co-fired power plant rises. Increasing the biomass fraction from 0% to 100% reduces the plant total CO2 emissions by around 10–16%, primarily due to the reduced flow rate of biomass due to its high heating value. By implementing carbon capture and storage with 90% efficiency, the plant total CO2 emissions are significantly reduced by approximately 83% in all scenarios. Furthermore, increasing the carbon capture efficiency further decreases the plant total CO2 emissions generated by the co-fired power plants. This pattern is observed in all other arrangements, regardless of the biomass and waste coal co-firing ratios and carbon capture efficiencies. Furthermore, it is seen that the 600 MW co-fired power plants lead to a reduction in plant total CO2 emissions by around 9–24%, depending on the implementation of CCS and the efficiency of carbon capture, in comparison to the 100 MW co-fired power plants with the same configuration. The plant total CO2 emissions also align with NETL’s baseline report on the performance, economics, and environmental impacts of Illinois 6 coal and hybrid poplar biomass co-fired power plants [18]. In the baseline study, a 35% biomass co-fired power plant with 660 MW capacity and 90% carbon capture efficiency resulted in a CO2 emission of 234 lb/MWh-net, whereas in our study, a 600 MW co-fired power plant with 40% biomass as the feedstock and 90% carbon capture efficiency resulted in a plant total CO2 emission of 266.90 lb/MWh-net.

Effects of Fluid Types and Combustion Boiler Types on CO2 Emissions

Table 6 illustrates the impact of subcritical and supercritical fluids, as well as the effects of CFB- and PC-fired combustion boilers, in 600 MW co-fired power plants with variable ratios of biomass waste coal co-firing. The supercritical arrangements produce less plant total CO2 emissions of around 6% than their subcritical counterparts in all circumstances, essentially due to reduced fuel flow rates due to higher efficiencies. This indicates that the implementation of supercritical co-fired power plants not only enhances the overall efficiency of the plant but also leads to a reduction in plant total CO2 emissions. Furthermore, in all instances of co-firing, power plants that utilize PC-fired co-firing produce a greater amount of plant total CO2 emissions of approximately 2–3% compared to power plants that utilize CFB-fired co-firing due to higher fuel flow rates considering the low efficiency of PC boilers. These findings support the inclusion of CFB in advanced co-fired power plants because of their lower plant total CO2 emissions compared to PC-fired co-fired power plants.

3.2.2. SO2 Emissions

The plant total SO2 emissions generated from the biomass and waste coal co-fired power plants have been analyzed considering the impacts of net plant capacities, biomass-waste coal co-firing ratios, fluid types, combustion boiler types, and the efficiencies of carbon capture and storage.

Effects of Net Plant Capacities, Co-Firing Ratios, and Carbon Capture Efficiencies on SO2 Emissions

Table 7 illustrates the plant total SO2 emissions from the 100 MW and 600 MW CFB subcritical co-fired power plants. The emissions are shown for different co-firing ratios and carbon capture efficiencies. As depicted in Table 7, there is a significant drop in the plant total SO2 emissions from the co-fired power plants as the co-firing ratio increases. By raising the proportion of biomass from 0% to 100% in circumstances when carbon capture is not used, the plant total SO2 emissions from the power plant decreased by around 98%. This indicates that there are almost negligible amounts of plant total SO2 emissions in the scenario where 100% biomass is used. However, in each configuration, the CCS instances exhibit significantly lower levels of plant total SO2 emissions compared to the non-CCS cases. Integrating CCS with 90% carbon capture leads to a negligible amount of plant total SO2 emissions compared to scenarios without carbon capture. This phenomenon can be seen in all other configurations as well. It is important to note that when the net plant capacity is increased to 600 MW, the plant total SO2 emissions per unit MWh of electricity generated are reduced by approximately 7–9% depending on the co-firing ratios of the configurations. The primary reason for the reduction in plant total SO2 emissions at a larger net plant capacity is the reduced fuel flow rates due to the higher efficiencies of the scaled-up plants.

Effects of Fluid Types and Combustion Boiler Types on Net Plant SO2 Emissions

Figure 7 illustrates the effects of subcritical and supercritical fluid types, as well as different combustion boiler types, on the plant total emission of SO2 of 600 MW co-fired power plants. This study considers various co-firing ratios of biomass and waste coal. According to Figure 7, supercritical co-fired power plants have around 5–6% lower plant total SO2 emissions compared to subcritical co-fired power plants due to lower fuel flow rates favored by higher efficiencies of supercritical plants. In addition, the PC-fired co-fired power plants have significantly lower plant total SO2 emissions compared to the CFB-fired co-fired power plants, with a difference of nearly 10 times. This is because, in our configurations, CFB-fired facilities inject limestone along with fuel in the combustion zone. Due to its sulfur sorbent properties, limestone undergoes a reaction with sulfur dioxide, resulting in the formation of calcium sulfate (gypsum), a solid by-product that can be subsequently confined and removed. Thus, the CFB-configured co-fired power plants account for less plant total SO2 emissions than the PC-configured co-fired power plants.

3.2.3. Particulate Matter (PM) Emissions

The plant PM emissions generated from pine biomass and waste coal co-fired power plants have been analyzed considering the net plant capacities of the co-fired power plants; the impacts of biomass and waste coal co-firing ratios, fluid types, combustion boiler types, and plant capacities; and the efficiencies of carbon capture and storage.

Effects of Net Plant Capacities, Co-Firing Ratios, and Carbon Capture Efficiencies on PM Emissions

Table 8 illustrates the plant total PM emissions generated from the 100 MW and 600 MW CFB subcritical co-fired power plants. It is seen that increasing the biomass fraction in the co-fired power plants decreases the resulting plant total PM emissions in each of the configurations and significantly minimizes the plant total PM emissions when 100% biomass is incorporated in the co-fired power plants; that is, increasing the biomass fraction from 0% to 100% in the power plant feed decreases the PM emissions by around 97%. The primary reason for reducing the plant total PM emissions at higher co-firing ratios is the significantly low ash content of biomass (1.26% db) compared to waste coal (49.26% db). The implementation of CCS with 90% carbon capture efficiency results in a negligible amount of plant total PM emission, and it becomes even lower when the carbon capture efficiency of the CCS is increased. This phenomenon is observed in all the other cases with different configurations and co-firing ratios.

Effects of Fluid Types and Combustion Boiler Types on PM Emissions

Figure 8 depicts the effects of subcritical and supercritical fluid types and the combustion boiler used in the 600 MW biomass and waste coal co-fired power plants. As seen in Figure 8, the supercritical power plants result in a lower plant total PM emission value compared to the subcritical configurations by approximately 5–6%, predominantly due to lower fuel flow rates assisted by higher efficiencies. Additionally, the PC-fired power plants result in a lower plant total PM emissions value than the CFB-fired power plants by around 11%, mainly due to incomplete combustion attained by the improper mixing of air and fuel, thus resulting in lower combustion efficiencies of PC fired boiler. In comparison, CFB boilers have better air and fuel mixing and high heat transfer due to fluidization effects, leading to nearly complete combustion. These results show the compatibility of incorporating supercritical power plants over subcritical power plants and CFB-fired power plants over PC-fired power plants from a resulting plant total emission standpoint. Similar trends are observed in all other cases with varying configurations and co-firing ratios.

4. Conclusions

This study assessed the performance metrics and environmental impact of power plants that simultaneously co-fire anthracite waste coal and loblolly pine biomass. The power plants were assessed for a net plant capacity of 100 MW and 600 MW. Both subcritical and supercritical power plants, utilizing CFB (circulating fluidized bed) and PC (pulverized coal) combustion techniques, have been analyzed. Various combinations of pine biomass and waste coal co-firing such as 0:100, 20:80, 40:60, 60:40, 80:20, and 100:0 have been assessed, along with the incorporation of CCS technology at varying degrees of capture efficiencies (90%, 95%, and 97%). This study demonstrated an increase in efficiency of around 3–8% as the biomass fraction in the power plant increases from 0% to 100% due to the superior LHV of pine biomass over anthracite waste coal. The auxiliary power requirements decreased by around 26% as the proportion of biomass increased from 0% to 100%. The net plant heat rate of the power plants decreased by around 3–8% as the biomass ratio in the power plant increased from 0% to 100%. Furthermore, the supercritical co-fired power plants exhibited a higher net plant efficiency of around 6% compared to subcritical power plants, underscoring the significance of incorporating supercritical power plants to improve overall plant performance, particularly on a larger scale. It has been shown that by increasing the proportion of biomass from 0% to 100%, the plant total CO2 emissions from the plant are lowered by around 10–16%. Additionally, the implementation of carbon capture technology with 90% efficiency resulted in a substantial 83% decrease in plant total CO2 emissions for the same co-firing ratio of pine biomass and waste coal. This reduction could be further enhanced by improving the efficiency of carbon capture. The plant total emissions of sulfur dioxide (SO2) from the co-fired power plants decrease significantly as the proportion of biomass in the power plant feed grows and eventually become negligible when 100% biomass is utilized. By increasing the proportion of biomass in co-fired power plants, the plant total emissions of particulate matter (PM) are reduced in all configurations. When 100% biomass is used in these power plants, the plant total SO2 and PM emissions are approximately negligible. Overall, the highest thermal efficiency of 41.12% and the lowest heat rate of 8299 BTU/kWh are observed at the 600 MW CFB subcritical power plant at the 100% biomass ratio. However, logistics and transportation of feedstock, i.e., biomass, are the major challenges for a large-scale biomass-fired power plant. Therefore, the co-firing of 20 to 40% biomass is a recommended approach to mitigate GHG emissions in large-scale modern power plants. In this study, for non-CCS cases, the biomass and waste coal co-firing ratios of 20:80 and 40:60 provided efficiencies in the range of 36.55–36.8% and 40.19–40.45% and net plant LHV heat rates in the range of 9273–9335 BTU/kWh and 8437–8491 BTU/kWh, respectively, for the 100 and 600 MW CFB subcritical plants. For the CCS cases, using a combination of 20% biomass and 80% waste coal or 40% biomass and 60% waste coal resulted in efficiencies ranging from 20.46% to 22.03% and 26.84% to 28.22%, respectively, for the 100 MW and 600 MW plants. The net plant LHV heat rate for the 100 MW and 600 MW CFB subcritical plants varied between 15,491–16,676 BTU/kWh and 12,090–12,172 BTU/kWh, respectively, for the 100 MW and 600 MW plants. These values were dependent on the carbon capture efficiency of the CCS employed, which ranged from 90% to 97% carbon capture efficiency. These data are useful for developing new designs or retrofitting designs of waste coal and pine biomass-based commercial-scale co-fired power plants. In addition, these data provide basic information for evaluating the economic and environmental assessment of waste coal and biomass co-fired power plants.

Author Contributions

Conceptualization, P.R.B.; methodology, P.R.B.; software, P.R.B.; validation, P.R.B. and S.S.; formal analysis, S.S.; investigation, P.R.B. and S.S.; resources, P.R.B.; data curation, P.R.B. and S.S.; writing—original draft preparation, S.S.; writing—review and editing, P.R.B.; visualization, P.R.B.; supervision, P.R.B.; project administration, P.R.B.; funding acquisition, P.R.B. All authors have read and agreed to the published version of the manuscript.

Funding

This research was funded by Fossil Energy and Carbon Management, Department of Energy, grant number DE-FE0032185.

Institutional Review Board Statement

Not applicable.

Informed Consent Statement

Not applicable.

Data Availability Statement

The original contributions presented in this study are included in the article. Further inquiries can be directed to the corresponding author.

Acknowledgments

Prakash Bhoi serves as the principal investigator on this DOE grant. We greatly acknowledge the DOE’s funding support. This article is a revised and expanded version of a paper entitled (“Performance of Biomass and Waste Coal Co-Fired Power Generation”]), which was presented at the ASME 2023 Power Conference, POWER2023, 6–9 August 2023, Long Beach, CA, USA [19].

Conflicts of Interest

The authors declare no conflict of interest.

Appendix A

Table A1. Comparison of net plant LHV efficiency of the co-fired power plants based on fluid types and combustion boiler types.
Considered CasesBC 0:100BC 20:80BC 40:60BC 60:40BC 80:20BC 100:0
600 MW CFB Subcritical, CCS 90% (%)27.327.7828.2228.632929.35
600 MW CFB Supercritical, CCS 90% (%)28.9429.4329.8730.2930.6631.09
600 MW PC Subcritical, CCS 90% (%)26.4126.9127.3727.7828.1928.62
600 MW PC Supercritical, CCS 90% (%)28.0528.5228.9929.4229.8330.34
Table A2. Comparison of the net plant LHV heat rate of the co-fired power plants based on fluid types and combustion boiler types.
Considered CasesBC 0:100BC 20:80BC 40:60BC 60:40BC 80:20BC 100:0
600 MW CFB Subcritical, CCS 90% (BTU/kWh)12,50112,28512,09011,92011,76511,624
600 MW CFB Supercritical, CCS 90% (BTU/kWh)11,79111,59511,42311,26711,20410,974
600 MW PC Subcritical, CCS 90% (BTU/kWh)12,92012,68112,46912,28312,10411,922
600 MW PC Supercritical, CCS 90% (BTU/kWh)12,16411,96311,77111,59811,44011,246
Table A3. Comparison of the auxiliary power requirements of the 600 MW co-fired power plants based on fluid types and combustion boiler types with varied co-firing ratios.
Considered CasesBC 0:100BC 20:80BC 40:60BC 60:40BC 80:20BC 100:0
600 MW CFB Subcritical, CCS 90% (MW)165.93158.29151.47145.61140.28135.44
600 MW CFB Supercritical, CCS 90% (MW)157.00149.81143.54137.86132.86127.80
600 MW PC Subcritical, CCS 90% (MW)180.38171.67163.91157.24150.53143.15
600 MW PC Supercritical, CCS 90% (MW)169.94162.63155.22148.61142.47134.95

References

  1. EIA. Electricity Generation, Capacity, and Sales in the United States. 2023. Available online: https://www.eia.gov/energyexplained/electricity/electricity-in-the-us-generation-capacity-and-sales.php (accessed on 4 November 2024).
  2. EPA. Sources of Greenhouse Gas Emissions. 2023. Available online: https://www.epa.gov/ghgemissions/sources-greenhouse-gas-emissions#t1fn3 (accessed on 4 November 2024).
  3. NASA. Global Climate Change, Vital Signs of the Planet. 2023. Available online: https://climate.nasa.gov/vital-signs/carbon-dioxide/ (accessed on 4 November 2024).
  4. Kerry, J.; McCarthy, G. The Long-Term Strategy of the United States: Pathways to Net-Zero Greenhouse Gas Emissions by 2050; US Department of State and US Executive Office of the President: Washington, DC, USA, 2021.
  5. Donohoo-Vallett, P.; Ryan, N.; Wiser, R. On The Path to 100% Clean Electricity; U.S. Department of Energy: Washington, DC, USA, 2023.
  6. Pandey, B.; Gautam, M.; Agrawal, M. Greenhouse Gas Emissions From Coal Mining Activities and Their Possible Mitigation Strategies. In Environmental Carbon Footprints: Industrial Case Studies; Butterworth-Heinemann: Oxford, UK, 2018; pp. 259–294. [Google Scholar]
  7. Buttermore, W.; Simcoe, E.; Maloy, M. Characterization of Coal Refuse; West Virginia Univ., Coal Research Bureau: Morgantown, WV, USA, 1979. [Google Scholar]
  8. Dave, N.; Do, T.; Palfreyman, D.; Feron, P. Impact of liquid absorption process development on the costs of post-combustion capture in Australian coal-fired power stations. Chem. Eng. Res. Des. 2011, 89, 1625–16388. [Google Scholar] [CrossRef]
  9. Strube, R.; Manfrida, G. CO2 capture in coal-fired power plants—Impact on plant performance. Int. J. Greenh. Gas Control 2011, 5, 710–726. [Google Scholar] [CrossRef]
  10. Tramošljika, B.; Blecich, P.; Bonefačić, I.; Glažar, V. Advanced Ultra-Supercritical Coal-Fired Power Plant with Post-Combustion Carbon Capture: Analysis of Electricity Penalty and CO2 Emission Reduction. Sustainability 2021, 13, 801. [Google Scholar] [CrossRef]
  11. Ghenai, C.; Hachicha, A.A. Thermal Performance of Biomass-Fired Steam Power Plant. J. Therm. Sci. Eng. Appl. 2017, 9, 031002. [Google Scholar] [CrossRef]
  12. Brown, M.A.; Favero, A.; Thomas, V.M.; Banboukian, A. The economic and environmental performance of biomass as an “intermediate” resource for power production. Util. Policy 2019, 58, 52–62. [Google Scholar] [CrossRef]
  13. Mun, T.-Y.; Tumsa, T.Z.; Lee, U.; Yang, W. Performance evaluation of co-firing various kinds of biomass with low rank coals in a 500 MWe coal-fired power plant. Energy 2016, 115, 954–962. [Google Scholar] [CrossRef]
  14. Cebrucean, D.; Cebrucean, V.; Ionel, I. Modeling and performance analysis of subcritical and supercritical coal-fired power plants with biomass co-firing and CO2 capture. Clean Technol. Environ. Policy 2020, 22, 153–169. [Google Scholar] [CrossRef]
  15. Andrić, I.; Jamali-Zghal, N.; Santarelli, M.; Lacarrière, B.; Le Corre, O. Environmental performance assessment of retrofitting existing coal fired power plants to co-firing with biomass: Carbon footprint and energy approach. J. Clean. Prod. 2015, 103, 13–27. [Google Scholar] [CrossRef]
  16. Suresh, M.; Reddy, K.; Kolar, A.K. 3-E analysis of advanced power plants based on high ash coal. Int. J. Energy Res. 2010, 34, 716–735. [Google Scholar] [CrossRef]
  17. Hanak, D.P.; Biliyok, C.; Manovic, V. Evaluation and Modeling of Part-Load Performance of Coal-Fired Power Plant with Postcombustion CO2 Capture. Energy Fuels 2015, 29, 3833–3844. [Google Scholar] [CrossRef]
  18. Buchheit, K.L.; Lewis, E.; Mahbubani, K.; Carlson, D.R. Technoeconomic and Life Cycle Analysis for Bio-Energy with Carbon Capture and Storage (BECCS) Baseline; National Energy Technology Laboratory (NETL): Pittsburgh, PA, USA; Morgantown, WV, USA, 2021.
  19. Bhoi, P.; Sarkar, S.; Klinger, J. Performance of Biomass and Waste Coal Co-Fired Power Generation. In ASME Power Conference; American Society of Mechanical Engineers: New York, NY, USA, 2023; p. V001T05A003. [Google Scholar]
Figure 1. Photographic view of loblolly pine biomass (left) and anthracite waste coal (right).
Sustainability 17 04473 g001
Figure 3. Net plant efficiency (LHV) of 100 MW and 600 MW CFB subcritical power plants with varying co-firing ratios.
Sustainability 17 04473 g003
Figure 4. Net plant heat rate (LHV) of the 100 MW and 600 MW subcritical co-fired power plants with varying co-firing ratios and carbon capture efficiencies.
Sustainability 17 04473 g004
Figure 5. Auxiliary power requirements of the 100 MW and 600 MW CFB subcritical co-fired power plants with varying co-firing ratios and carbon capture efficiencies.
Sustainability 17 04473 g005
Figure 6. Plant total CO2 emissions of the 100 MW and 600 MW CFB subcritical co-fired power plants with varying co-firing ratios and carbon capture efficiencies.
Sustainability 17 04473 g006
Figure 7. Plant total SO2 emissions of the 600 MW co-fired power plants with varying co-firing ratios.
Sustainability 17 04473 g007
Figure 8. Plant total PM emissions of the 600 MW co-fired power plants with varying co-firing ratios.
Sustainability 17 04473 g008
Table 1. Characterization of feedstocks.
ParametersLoblolly PineAnthracite Gilberton (Waste Coal)
Ultimate analysis, % db
C50.5444.55
H5.921.46
O44.5913.55
N0.080.63
S0.010.54
Proximate analysis
Moisture, % wb7.736.62
Ash, % db1.2649.26
Volatile matter, % db79.176.79
Fixed carbon, % db19.5643.95
Higher heating value, MJ/kg19.915.6
Lower heating value, MJ/kg18.415.1
Density, kg/m3275.5841
Ash analysis, wt.%
Silica, SiO262.7656.94
Aluminum Oxide, Al2O35.5423.93
Titanium Dioxide, TiO20.181.33
Iron Oxide, Fe2O33.87.16
Calcium Oxide, CaO10.170.26
Magnesium Oxide, MgO4.020.71
Sodium Oxide, Na2O1.910.37
Potassium Oxide, K2O4.113.21
Phosphorous Pentoxide, P2O50.75< 0.01
Sulfur Trioxide, SO32.240.35
Chlorine0.010.02
Table 2. Ambient conditions and site characteristics.
ParameterValue
Altitude, m0
Ambient pressure, Pa101.35
Ambient temperature, °C15
Ambient relative humidity, %60
Ambient wet bulb temperature, °C10.82
Site cooling water temperature, °C15
Site allowable cooling water temperature rise, °C−7.78
Makeup water pressure, Pa344.74
Makeup water temperature, °C15
Table 4. Model vs. literature data of a 650 MW supercritical pulverized biomass-coal co-fired power plant at the co-firing ratio of 20:80 [19].
ParametersUnitLiterature [18]Model% Error
Gross PowerMW695689.20.84
Auxiliary PowerMW4539.711.82
Net Power OutputMW650649.50.08
Net Plant HHV Efficiency%39.639.470.33
Coal Flow Ratelb/h549,842551,749.8−0.35
Net Plant HHV Heat RateBTU/kWh86078645−0.44
HP Turbine
     Inlet PressurePSIA351535150.00
     Inlet Temperature°F110011000.00
     Inlet Mass flow ratelb/h4,218,5444,392,720−4.13
IP Turbine
     Inlet PressurePSIA6976970.00
     Inlet Temperature°F110011000.00
     Inlet Mass flow ratelb/h3,526,7243,620,880−2.67
LP Turbine
     Inlet PressurePSIA75750.00
     Inlet Temperature°F517534.9−3.46
     Inlet Mass flow ratelb/h3,039,1862,680,20011.81
     Outlet steam quality *
Final Feedwater Temperature°F555552.80.40
* Not reported.
Table 5. Model vs. literature data of a 650 MW supercritical pulverized biomass-coal co-fired power plant at the co-firing ratio of 0:100 [19].
ParametersUnitLiterature [18]Model% Error
Gross PowerMW685688.5−0.51
Auxiliary PowerMW3539.0−11.46
Net Power OutputMW650649.50.08
Net Plant HHV Efficiency%40.340.080.55
Coal Flow Ratelb/h472,037473,916.5−0.40
Net Plant HHV Heat RateBTU/kWh84738513−0.47
HP Turbine
     Inlet PressurePSIA35153568−1.51
     Inlet Temperature°F11001103.5−0.32
     Inlet Mass flow ratelb/h4,158,8344,390,200−5.56
IP Turbine
     Inlet PressurePSIA697710.9−1.99
     Inlet Temperature°F11001102.4−0.22
     Inlet Mass flow ratelb/h3,476,8063,617,640−4.05
LP Turbine
     Inlet PressurePSIA75750.00
     Inlet Temperature°F517534.9−3.46
     Inlet Mass flow ratelb/h2,996,1692,677,68010.63
     Outlet steam quality *0.9
Final Feedwater Temperature°F555590−6.31
* Not reported.
Table 6. Effects of fluid types and combustion boiler types on the 600 MW co-fired power plants with varying co-firing ratios.
Considered CasesBC 0:100BC 20:80BC 40:60BC 60:40BC 80:20BC 100:0
600 MW CFB Subcritical, CCS 90% (lb/MWhnet)288.62275.75266.90259.09252.00245.57
600 MW CFB Supercritical, CCS 90% (lb/MWhnet)269.43260.24252.20244.91238.37231.83
600 MW PC Subcritical, CCS 90% (lb/MWhnet)292.94282.75273.71265.73258.30251.14
600 MW PC Supercritical, CCS 90% (lb/MWhnet)275.79266.74258.39250.91244.13236.92
Table 7. Plant total SO2 emissions of the 100 MW and 600 MW CFB subcritical co-fired power plants with varying co-firing ratios and carbon capture efficiencies.
Considered CasesBC 0:100BC 20:80BC 40:60BC 60:40BC 80:20BC 100:0
100 MW, No CCS (lb/MWhnet)1.451.110.80.520.260.02
600 MW, No CCS (lb/MWhnet)1.311.010.730.470.240.02
100 MW, CCS 90% (lb/MWhnet)0.010.010.010.010.010.01
600 MW, CCS 90% (lb/MWhnet)0.010.010.010.010.010.01
100 MW, CCS 95% (lb/MWhnet)000000
600 MW, CCS 95% (lb/MWhnet)000000
100 MW, CCS 97% (lb/MWhnet)000000
600 MW, CCS 97% (lb/MWhnet)000000
Table 8. Plant total PM emissions of the 100 MW and 6000 MW CFB subcritical co-fired power plants with varying co-firing ratios and carbon capture efficiencies.
Considered CasesBC 0:100BC 20:80BC 40:60BC 60:40BC 80:20BC 100:0
100 MW, No CCS (lb/MWhnet)2.682.061.50.990.510.07
600 MW, No CCS (lb/MWhnet)2.431.881.370.90.470.07
100 MW, CCS 90% (lb/MWhnet)0.050.030.030.020.010
600 MW, CCS 90% (lb/MWhnet)0.040.030.020.010.010
100 MW, CCS 95% (lb/MWhnet)0.040.030.030.020.010
600 MW, CCS 95% (lb/MWhnet)0.040.030.020.010.010
100 MW, CCS 97% (lb/MWhnet)0.030.020.020.010.010
600 MW, CCS 97% (lb/MWhnet)0.030.020.020.010.010
Disclaimer/Publisher’s Note: The statements, opinions and data contained in all publications are solely those of the individual author(s) and contributor(s) and not of MDPI and/or the editor(s). MDPI and/or the editor(s) disclaim responsibility for any injury to people or property resulting from any ideas, methods, instructions or products referred to in the content.

