Abstract
In the process of social development, there is a contradiction between economic development and the ecological environment. Western countries were the first to experience the inverted U-shaped development model of “destruction first and compensation later”, and China is also facing similar problems. To reveal the formation mechanism and dynamic evolution of the inflection point of ecological environment changes in China, this paper combines the entropy weight method, the analytic hierarchy process, and quadratic curve fitting to construct the “Ecological Pressure Index—GDPP Model” and studies the inflection point of ecological pressure during China’s economic development from 2000 to 2022. The study shows that the key inflection point of China’s ecological environment pressure is between 2016 and 2017, which is mainly affected by multiple factors such as the economy, domestic and international situations, and policy adjustments. For example, the implementation of the “Supply-side Structural Reform” and the environmental protection supervision system has significantly reduced the pollution pressure. At the same time, the “inflection point” is applied to dynamically adjust the PSR model, revealing the stage transition of China’s environmental governance focus. For instance, from 2000 to 2016, end-of-pipe pollution treatment was dominant (for example, the weights of pollution emission indicators X5–X8 were relatively high), while after 2016, the focus of governance shifted to the restoration of ecological space (for example, the weight of nature reserves X22 was 2.759%). The theoretical contribution of this paper lies in proposing the concept of “Policy-driven EKC”, emphasizing the core role of policy intervention in the formation of the inflection point of the ecological environment. In addition, the dynamic adjustment of the PSR model using the “inflection point” better interprets China’s self-transformation in the development process and provides other developing countries with a Chinese solution of “institutional innovation first” and the “Policy-driven EKC—Chinese PSR Model” for reference in balancing economic growth and ecological protection.
1. Introduction
Driven by the waves of globalization and industrialization, the contradiction between economic development and ecological environment protection has always been a major challenge faced by various countries [1,2,3]. For example, the intensification of greenhouse gas emissions and human activities has led to climate change, loss of biodiversity, and ecosystem degradation [4,5]. Western countries generally experienced the inverted U-shaped development model of “pollution first, treatment later” during the process of industrialization [6,7]. This model has not only caused serious damage to the ecological environment but also exerted great pressure on sustainable social development.
Take the United Kingdom as an example. The Industrial Revolution in the 19th century brought about rapid economic growth, but at the same time, it also triggered serious air pollution and water pollution problems. The “foggy city” phenomenon in London was once a typical portrayal of environmental deterioration during the industrialization process. The city shrouded in smog not only affected the health of residents but also posed a severe challenge to the sustainable development of the city [8,9]. Similarly, the United States also experienced serious air pollution in the middle of the 20th century (such as the Los Angeles photochemical smog incident) [10,11]. These historical experiences show that the contradiction between economic development and ecological environment protection is an inevitable issue in the process of industrialization.
As the world’s second-largest economy, China is also confronted with the above-mentioned problems. Especially after the implementation of the reform and opening-up policy in 1978, with the development of China’s industrialization and urbanization, it has brought severe pressure on the ecological environment [12,13]. The Chinese government has attempted to find a balance between economic development and ecological protection through a series of policy interventions and institutional innovations. For example, the “Beautiful China” strategy was proposed in 2012, and the “Healthy China” strategy was put forward in 2015, which has since specified a specific direction for China’s ecological environment protection. Policies such as the “Supply-side Structural Reform” [14] and the “Environmental Protection Supervision System” [15] implemented since 2016 have significantly reduced the pollution pressure and promoted the improvement of the ecological environment [16]. Therefore, how to achieve the sustainability of the ecological environment in the process of economic development has become an urgent problem to be solved at present.
Although existing studies have pointed out that there is a nonlinear relationship between economic development and the ecological environment (such as the classic EKC theory [17]), in the specific context of China, the dynamic evolution of this relationship and the way to identify its inflection point are still unclear. Especially against the backdrop of global climate and situation changes and domestic policy adjustments, the changing trend of China’s ecological environmental pressure and its feedback mechanism on economic development remain to be explored in depth. In addition, most of the existing studies focus on the environmental changes in a single pollutant or in a local area (such as CO2 [18]), lacking a comprehensive and systematic analysis of the ecological environment across the country.
Therefore, this study combines the entropy weight method, the analytic hierarchy process, and quadratic curve fitting to construct the “Ecological Pressure Index—GDPP” model and further uses the inflection point to conduct a segmented dynamic analysis of the PSR model [19,20,21], focusing on answering the following questions: (1) When will the inflection point of China’s ecological environment pressure occur? (2) What is the formation mechanism of the inflection point? (3) Before and after the turning point, how will the focus and policy path of environmental governance change?
In this paper, the inflection point is defined as the key point at which the pressure on the ecological environment changes from increasing to decreasing, and its formation is jointly affected by multiple factors such as the economy, policies, and technology. Specifically, the inflection point is calculated with the normalized value of GDPP as the abscissa, marking the nonlinear relationship between economic development and the pressure on the ecological environment. When the GDPP reaches a certain critical value, the pressure on the ecological environment begins to change from increasing to decreasing, and this critical point is the inflection point.
However, it is worth noting that China has a vast territory, and there are significant differences in the levels of economic development and ecological environment conditions among regions [22]. The eastern coastal areas are economically developed with a relatively optimized industrial structure, and the pressure on the ecological environment mainly comes from the high-density population and high-intensity economic activities [23,24]. In contrast, the economic development in the central and western regions is relatively lagging behind, and the industrial structure is still dominated by resource-based and heavy chemical industries. The pressure on the ecological environment is more reflected in the contradiction between resource development and ecological protection [25]. This regional difference has an important impact on the dynamic evolution of the national ecological environment pressure and also poses challenges for the formulation and implementation of policies.
Therefore, this study focuses on the relationship between urbanization and the ecological environment at the overall level of China, aiming to reveal the nonlinear relationship between the two from a macro perspective. Against the backdrop of global climate change and sustainable development, China’s experience in ecological environment governance not only provides useful references for other developing countries but also contributes oriental wisdom to global ecological governance.
2. Dataset and Methodology
2.1. Data Sources
The 29 types of data used in this paper mainly come from the China Statistical Yearbook, the China Environmental Statistical Yearbook, and the China Rural Statistical Yearbook.
Among them, the climate physical risk index is sourced from relevant literature [26], and the areas of various land use types are obtained from the Resource Sharing Service Platform of the National Ecological Data Center (https://www.nesdc.org.cn/).
The comprehensive pollution degree of solid waste, the comprehensive pollution degree of waste gas, and the comprehensive pollution degree of wastewater are the comprehensive results calculated by the entropy weight method and the AHP after normalizing the data of various pollutant indicators from the China Environmental Statistical Yearbook. Among them, the solid waste pollution indicators include the generation amount of industrial solid waste, the amount of industrial solid waste dumped and discarded, and the storage amount of industrial solid waste; the waste gas pollution indicators include the sulfur dioxide content and the emission amount of industrial smoke and dust; and the wastewater pollution indicators include the COD content, the heavy metal content, and the volatile phenol content.
2.2. Research Methods
2.2.1. Data Processing
- (1)
- Normalization of Indicator Data
Normalization (Equation (1)):
where Z is the normalization coefficient, X is the original data, max(X) is the maximum value of the original data, and min(X) is the minimum value of the original data.
- (2)
- Comprehensive Weighting Method
In this study, a combined weighting method that integrates the Entropy Weight Method and the Analytic Hierarchy Process (AHP) is employed to determine the comprehensive weight (Wc). This approach combines the objective weight (derived from real data) and subjective judgment (based on practical experience). By doing so, it not only mitigates the influence of both subjective and objective biases but also enhances the accuracy and reliability of the evaluation results [27].
- Entropy Weight Method
Since each evaluation index generally has different dimensions and attributes and cannot be directly compared and calculated, the data must be standardized [28]. The influence of the indicators can be divided into positive influence and negative influence. In the case of positive influence, a higher value indicates a better ecological environment in China, while in the case of negative influence, a lower value indicates a better ecological environment.
First of all, an n × m matrix X (n represents the number of samples, and m represents the number of indicators) is established as follows (Equation (2)):
The second step is to classify and standardize the indicators (Equations (3) and (4)) as follows:
The third step is to calculate the probability (Equation (5)) and information entropy (Equation (6)) of the indicators as follows:
where , and Ej is the information entropy of the j-th indicator.
Finally, the weight of each evaluation index according to the information entropy (Equation (7)) is calculated as follows:
- Analytic Hierarchy Process (AHP)
The core idea of the AHP is to decompose a complex problem into multiple levels. By constructing a judgment matrix, it quantifies the relative importance of various factors. Then, through mathematical calculations, the weights of each factor are obtained. Finally, the alternative solutions are ranked to select the optimal solution [29]. The AHP usually divides the problem into the following three levels:
- ⮚
- Objective Level: The ultimate goal of decision-making (for example, selecting the best investment project).
- ⮚
- Criterion Level: Multiple indicators that affect the objective (such as cost, benefit, risk, etc.).
- ⮚
- Alternative Level: Specific alternative solutions (such as different investment projects).
In this study, the evaluation of relevant indicators was conducted and guided by the relevant experts from the Institute of Environmental Planning and Design of Nanjing University.
The specific methods are as follows:
The first step is to construct the judgment matrix. Firstly, an n × n judgment matrix A is constructed according to the criterion level. Then, based on the opinions of experts, 1–9 indices are used to quantify the relative importance of n indices. aij represents the importance of the i-th index relative to the j-th index, and the matrix A is completed (Equation (8)).
The second step is to calculate the weight vector. Firstly, we calculated the sum of each column of the matrix A (Equation (9)), and then carried out the normalization processing (Equation (10)).
The third step is to calculate the maximum eigenvalue . Firstly, the sum of each row of the matrix A (Equation (11)) was calculated and then (Equation (12)) was obtained.
The fourth step is to conduct a consistency check on the matrix. The index CI was introduced as follows (Equation (13)):
When CI = 0, the judgment matrix has complete consistency; the higher the value of CI, the worse the consistency of the matrix.
The fifth step is to calculate the consistency ratio CR of the matrix A (Equation (14)) as follows:
If CR < 0.1, the judgment matrix has satisfactory consistency.
If CR ≥ 0.1, it is necessary to readjust the judgment matrix to ensure the consistency of subjective judgment.
Where, the value of RI is the average random consistency index, which is related to the order of the matrix. The common values are presented in Table 1.

Table 1.
The value of RI.
Finally, if the consistency check is passed, the weight vector will be the relative weight (Wj) of each index in the criterion layer.
In this study, for the convenience of calculation, a step-by-step hierarchical calculation method is adopted. First, the indicators of each subsystem in the PSR model are classified, and a first-level criterion layer is created. The first-level indicators within the criterion layer, such as “resource consumption” and “pollution emissions”, are in the pressure subsystem. Then, the relative weights Wj1 of the first-level indicators are calculated through the AHP. Subsequently, the first-level indicators are taken as the second-level criterion layer, and an AHP analysis is carried out on the indicators within the second-level criterion layer. For example, the indicator “National Coal Consumption (X1)” in the pressure subsystem and the relative weights Wj2 of each indicator are obtained. Finally, the hierarchical weights (Wj) of each second-level indicator are obtained through the following calculation (Equation (15)):
- The comprehensive weight (Wc) (Equation (16)) is as follows:
- (3)
- AIC and BIC
AIC (Akaike Information Criterion) and BIC (Bayesian Information Criterion) are two effective methods for weighing the complexity of the estimated model and the goodness of fit of the model. The smaller the values of both, the better the model-fitting effect. The specific calculation formulas are as follows [30] (Equations (17) and (18)):
where is the value of the log-likelihood function of the optimal parameter obtained by maximum likelihood estimation or maximum a posteriori probability estimation; and K is the number of parameters, which is used to penalize the complexity of the model.
where is the same as above; and K × is the penalty term for the model complexity in the BIC. Here, K is the number of parameters, and n is the number of trials for each subject.
2.2.2. Fitting of the “Ecological Pressure Index”—GDPP Model (Inflection Point Judgment)
- (1) Construction of the “Ecological Pressure Index”
In this study, by reviewing the Chinese Yearbooks over the years and relevant studies, the ecological and environmental situations in the historical development of China were considered and summarized from three aspects: resource consumption, pollution emissions, and climate change risks. The specific indicators are as follows.
In terms of resource consumption, the specific indicators of “National coal consumption”, “Impervious surface area of urban construction land”, “Population size” and “Total sown area of crops” were screened out. Among them, “National Coal Consumption” represents the consumption of natural resources such as fossil fuels in China. The “Impervious surface area of urban construction land” reflects the consumption of land resources caused by urban expansion during the urbanization process. “Population size” and “Total sown area of crops” represent the consumption of various resources due to population expansion.
In terms of pollution emission, specific indicators such as “Comprehensive pollution degree of solid waste”, “Comprehensive pollution degree of waste gas”, “Comprehensive pollution degree of wastewater”, and “Amount of pesticide and fertilizer application” were screened out. Among them, the “Comprehensive pollution degree of solid waste”, “Comprehensive pollution degree of waste gas”, and “Comprehensive pollution degree of wastewater” represent the pressure exerted on the environment by pollutants during China’s industrialization process. The “Amount of pesticide and fertilizer application” represents the pressure indirectly imposed on the environment due to the increased demand for resources following population expansion.
In terms of climate change risks, specific indicators of the “climate physical risk index (CPRI)” and “CO2 emissions” were screened out. It is mainly considered that CO2 will exacerbate climate warming, which in turn will intensify the occurrence of extreme climate events. Therefore, the above two indicators were selected.
In conclusion, the above ten indicators constitute the “Ecological Pressure Index”, and the historical data of these ten indicators from 2000 to 2022 were recorded, as shown in Table 2.
Table 2.
The indicators in the “Ecological Pressure Index”.
- (2) Calculation of Weights Using the Entropy Weight Method: The historical data of the ten indicators were processed using the entropy weight method to determine the weight of each indicator (all treated as negative indicators), denoted as Wi.
- (3) Calculation of Weights Using the AHP: The historical data of the ten indicators were processed using the AHP to determine the weight of each indicator, denoted as Wj.
- (4) Calculation of Comprehensive Weights: The product of the entropy weight of each indicator and the weight calculated by the AHP is denoted as WC. That is, WC = Wi × Wj.
- (5) Calculation of the “Ecological Pressure Index”: Normalize the data of each indicator (19), and then calculate according to the weight of each indicator (20). Since the pressure indicators are negative indicators, the lower the negative value is, the smaller the pressure on the ecological environment is.where Zij is the result of normalizing the data of Xij, min (Xij) is the minimum value of the j-th indicator, and max (Xij) is the maximum value of the j-th indicator.where P is the value of the “Ecological Pressure Index”; Zij is the normalized value of the indicator; and Wcj is the comprehensive weight of the j-th indicator.
- (6) Normalization of the Gross Domestic Product per Capita (GDPP) from 2000 to 2022, denoted as N-GDPP.
- (7) Conducting the following analysis on the data of P and N-GDPP:
- Linear regression and quadratic model fitting: In SPSSAU (https://spssau.com/index.html (accessed on 21 March 2025), the value of P as the Y-axis and N-GDPP as the X-axis is taken, and tests of adjusted R2, AIC and BIC on the fitting models are conducted, respectively.
- Threshold effect analysis: In R-Studio (4.0.5), the value of p as the Y-axis and N-GDPP as the X-axis is taken, and inflection point analysis is performed using the threshold effect analysis package.
- (8) Judgment of the inflection point:
- In the regression analysis, for the equation with the highest goodness of fit, the maximum point is found according to the point where the first derivative is 0, that is, f′(x) = 0, and determine the inflection point.
- In the threshold effect analysis, the analysis results of the R package are checked.
2.2.3. Construction of China’s Comprehensive Ecological and Environmental Evaluation System
- (1) Construction of China’s Ecological and Environmental Evaluation System
According to the inflection point analysis results in Section 2.2.2, and combined with the classic PSR (Pressure–State–Response) theory, the historical development of China’s environment is divided into two stages. And according to the entropy weight method and the AHP, the comprehensive weight of the stages is calculated. The first stage is the period when the pursuit of GDP leads to ecological pressure, and the second stage is the period when the pursuit of GDP improves the industrial structure and alleviates the pressure on the ecological environment.
Based on the literature and the China Statistical Yearbooks over the years, a comprehensive evaluation system for China’s ecological environment has been constructed, which is divided into two stages. The first stage is the period when the pursuit of GDP causes environmental pressure, and the second stage is the period when GDP growth optimizes the industrial structure and alleviates environmental pressure, as shown in Table 3.
Table 3.
China’s comprehensive ecological and environmental evaluation system.
The pressure subsystem represents the negative impact of natural and human disturbances on the sustainable development of the social–ecological system. Therefore, from the aspects of resource consumption, pollution emissions, climate change risks and economic development, indicators such as “Impervious surface area of urban construction land” and “Total sown area of crops” are selected to represent the pressure indicators.
The state subsystem represents the state of the social–ecological system after being disturbed by natural and human factors. Therefore, it is considered from the aspects of natural resources, environmental quality and social economy. The areas of forest land, grassland and water area are used as specific indicators of natural resources. The area of non-first-class marine water quality and the comprehensive air pollution degree represent the environmental quality. The area of affected farmland and the Engel’s coefficient represent the social economy.
The response subsystem represents a series of measures taken by human beings to promote the sustainable development of the social–ecological system, such as environmental protection investment and scientific and technological investment. Therefore, it is considered from the aspects of natural resources, environmental governance and social economy. Among them, “The area of nature reserves” and “The area of artificial afforestation” are used as the representative indicators of China’s efforts in natural resource restoration; the indicators such as “investment in environmental pollution control” and “Comprehensive utilization rate of industrial solid waste” are used to represent China’s environmental governance; and the “R&D investment” represents the indicator of China’s investment in social economy to protect the environment.
- (2) The parameters of each subsystem of the two segments of the PSR model and the comprehensive evaluation index of China’s ecological environment are calculated (Equations (21) and (22)).where EEAi includes the pressure system, the state system, and the response system; Zij is the normalized value of the indicator; and Wcj is the comprehensive weight of the j-th indicator (when calculating the pressure subsystem, the GDPP in the second stage is taken as a negative value; in the remaining subsystems, the values of negative indicators are taken as negative numbers, and the values of positive indicators remain unchanged).where EEA is the comprehensive evaluation index of China’s ecological environment; Zij is the normalized value of the indicator; and Wcj is the comprehensive weight of indicator j (when calculating the parameters of EEA, the values of negative indicators are taken as negative numbers, and the values of positive indicators remain unchanged).
3. Results
3.1. “Ecological Pressure Index”—GDPP Model Fitting
3.1.1. Calculation of Indicator Weights in the “Ecological Pressure Index”
After calculation, the indicator weights of the “Ecological Pressure Index” are shown in Figure 1. Among them, the “The comprehensive pollution degree of waste gas (X6)” has the largest weight, with a comprehensive weight (Wc) of 2.452%; the “Total sown area of crops (X4)” has the smallest weight, with Wc being 0.048%. The Wc values of solid waste (X5) and coal consumption (X1) are also relatively large. With the increase in China’s population and the development of industrialization, the living standards have been gradually improved, and the demand for resources has increased, leading to an increase in the pressure on the ecological environment [31,32].
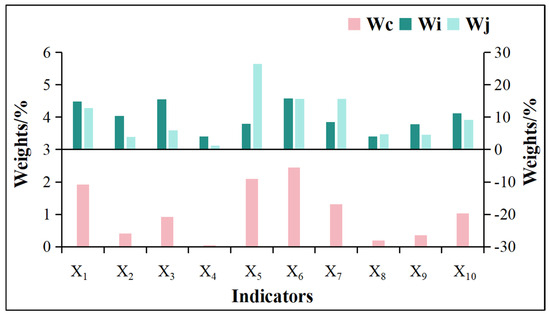
Figure 1.
Comprehensive weights of each indicator of the “Ecological Pressure Index”. Xn is shown in Table 2. Wc is the comprehensive weight, Wi is the weight obtained from the entropy weight method analysis, and Wj is the weight obtained from the AHP. The value of Wc refers to the left axis; the values of Wi and Wj refer to the right axis.
3.1.2. Linear and Quadratic Model Fitting
Through model fitting, it is found that the linear model is Y = 1.724X + 4.296; and the quadratic model is Y = 3.847 + 5.620X − 4.266X2. The quadratic model has higher adjusted R2, AIC, and BIC values, which are 0.724, 26.616, and 30.022, respectively (Figure 2).
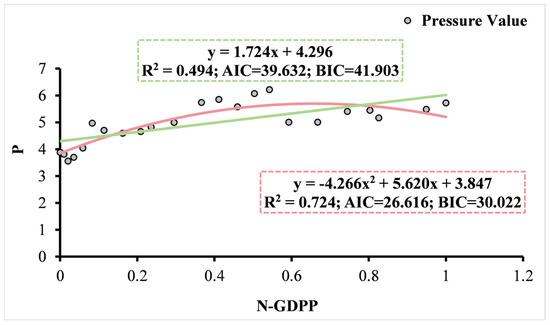
Figure 2.
Model fitting results. The green straight line and box represent the results of linear regression; the red curve and box represent the results of quadratic fitting. The content within the square brackets represents the specific fitting result.
3.1.3. Threshold Effect Analysis
Through the threshold effect analysis, it is found that the inflection point is 0.411, and the result of the likelihood ratio test is significant (Table 4).
Table 4.
Results of the threshold effect analysis.
3.1.4. The Judgment of Inflection Point
The point where f′(x) = 0 for the quadratic model in Section 3.1.2 is calculated, which is (0.659, 9.398); then, based on the positions of the annual values on the fitted model, it is determined that the inflection point year is approximately between 2016 and 2017. However, the analysis in Section 3.1.3 shows that the inflection point is between 2011 and 2012. In order to clarify the inflection point, the following comparative analysis is carried out:
- The transformation of the economic structure from being dominated by the industrial sector to being dominated by the service sector has significantly reduced the pressure on the ecological environment. The growth rate of the proportion of the tertiary industry in China from 2016 to 2017 was larger than that from 2011 to 2012, which were 1.1% and 0.9%, respectively. However, the proportion of the tertiary industry exceeded 50% in 2017 (Figure 3), which indicates the optimization of China’s industrial structure. Specifically, the rapid development of the tertiary industry has reduced the dependence on high-pollution and high-energy-consuming industrial sectors, thereby reducing pollutant emissions (Figure 4).
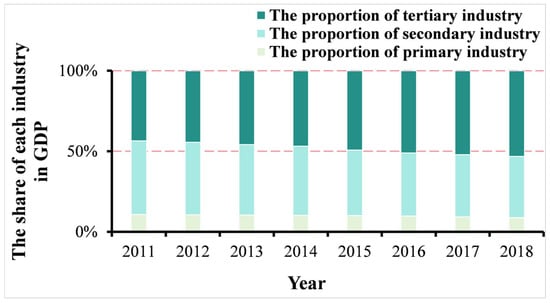 Figure 3. The proportion of the total output value of the primary, secondary, and tertiary industries in each year to the total GDP of that year.
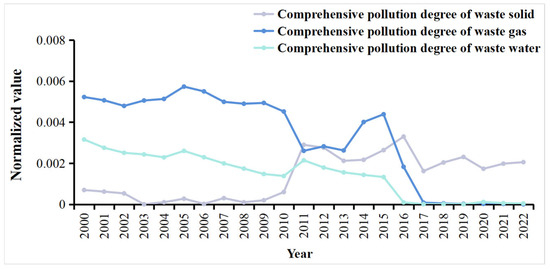 Figure 4. Changes in the indicators of the “Ecological Pressure Index”.At the same time, China has carried out strategic adjustments to the industrial chain, gradually withdrawing from the final assembly links with low added value and instead focusing on the high added value links of the East Asian value chain to compete with Japan and South Korea. Meanwhile, China has strengthened industrial cooperation with the Association of Southeast Asian Nations (ASEAN), providing intermediate goods to the ASEAN region and allowing ASEAN to be responsible for the assembly work with lower technical content and added value [33]. Since the China–US trade frictions, China’s investment in the ASEAN region in 2017 exceeded 211.6 billion US dollars, among which the manufacturing industry accounted for more than 35% [34]. To a certain extent, this has reduced the number and scale of Chinese factories, greatly alleviating the environmental damage caused by industrial production.
 - In the policy field, the Chinese government has placed greater emphasis on the strategies of green development and the Beautiful China Initiative. In 2012, the Chinese government first put forward the “Beautiful China” strategy [35]. In 2015, the Chinese government proposed the “Supply-side Structural Reform” system [14], which not only improved the quality and quantity of China’s economic growth but also had a profound impact on ecological and environmental protection [36,37]. Specifically, through eliminating backward production capacity and optimizing the industrial structure, the supply-side structural reform has significantly reduced the dependence on high-pollution and high-energy-consuming industries, thus reducing the pressure on the ecological environment. For example, in 2016, the State Council of China issued documents to promote the resolution of excess capacity in the steel and coal industries [38,39]. Hebei Province continued to implement the “6643” project (that is, by 2017, reducing 60 million tons of steel, 61 million tons of cement, 40 million tons of standard coal, and 36 million weight boxes of glass production capacity). Shandong Province focused on eight industries, including steel, cement, flat glass, electrolytic aluminum, ships, oil refining, tires, and coal, and made full use of market mechanisms, economic means, and legal measures to resolve excess capacity, creating room for the development of advanced productive forces [40]. These measures have not only optimized the industrial structure but also significantly reduced pollutant emissions [41,42]. As of 2017, more than 700 polluting and non-compliant steel enterprises were shut down [43], and 2688 coal mines were closed [44,45]. The comprehensive pollution degree of exhaust gas has significantly decreased (Figure 4). In the same year, China’s newly revised “Environmental Protection Law” was officially implemented, which is known as the “strictest environmental protection law in history” [46]. The implementation of this law not only provides stronger legal support for environmental protection but also further promotes the public’s continuous attention to and participation in environmental issues [47].In 2016, the State Council of China issued the Notice on the Comprehensive Work Plan for Energy Conservation and Emission Reduction during the 13th Five-Year Plan period. For example, in terms of promoting the optimization of the energy structure, the document suggested strengthening the safe, green development and clean, efficient utilization of coal; promoting the use of high-quality coal and clean coal; advancing the conversion from coal to gas and from coal to electricity; and encouraging the use of high-quality energy sources such as renewable energy, natural gas, and electricity to replace coal. Developing renewable energy sources such as island solar energy, offshore wind energy, tidal energy, and wave energy according to local conditions has promoted the continuous improvement of environmental quality [48,49]. The long-term effects of these measures have gradually emerged, driving the continuous optimization of the energy structure.During the same period, environmental protection inspections were officially launched in 2016. The central environmental protection inspections first started as a pilot in Hebei Province [50] and then completed the full coverage inspection of 31 provinces (autonomous regions and municipalities directly under the Central Government) across the country within one year [15], and since 2018, “follow-up inspections” and special inspections have been carried out [51]. The environmental protection inspection system has not only optimized China’s environmental governance system but also greatly enhanced the intensity of environmental protection [52], promoting the continuous improvement of the ecological environment. The long-term effect of the environmental protection inspection system lies in its sustainability and consistency, making environmental supervision a normal state and further consolidating the achievements of environmental governance [53]. Overall, although policies have a lag effect, the synergistic effect of these policy tools has not only improved the environmental quality in the short term but also provided support for long-term sustainable development, contributing to the formation of the inflection point in 2017.
In conclusion, 2016–2017, as the inflection point of China’s environmental status, is more scientific and reasonable. During 2016–2017, the economic growth rate was relatively fast, and the industrial structure was better. Coupled with the implementation of policies and systems such as the supply-side structural reform and environmental protection inspections, the pollution emissions of high-pollution and high-energy-consuming industries have been significantly reduced, promoting the continuous improvement of the ecological environment. The systematicness, intensity, and effectiveness of the policies all reached a higher level in 2017. Therefore, 2017 is more suitable as the inflection point of China’s environmental status.
3.2. Indicators Weight Analysis
According to the inflection point judgment results in Section 3.1.4, the time span is divided into two periods (from 2000 to 2016 and from 2017 to 2022). After calculation, the weight analysis results of the 29 indicators involved in China’s comprehensive ecological and environmental evaluation system in the two periods are shown in Figure 5.
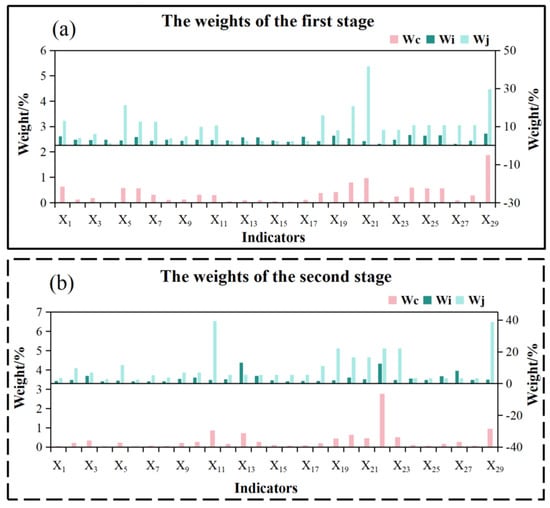
Figure 5.
The changes in the weights of each indicator in PSR during the two stages. Subfigure (a) shows the changes in the weights of each indicator in the first stage, (b) shows the changes in the weights of each indicator in the second stage. Xn is shown in Table 3. Wc is the comprehensive weight, Wi is the weight obtained from the entropy weight method analysis, and Wj is the weight obtained from the AHP. The value of Wc refers to the left axis; the values of Wi and Wj refer to the right axis.
In the first period, the indicator “R&D Investment (X29)” has the largest proportion of the comprehensive weight, and the sown area of crops (X4) has the smallest proportion, which are 1.878% and 0.037%, respectively. Among them, there are nine indicators with weights greater than 0.5%, namely X1, X5, X6, X20, X21, X24, X25, X26, and X29.
In the second period, the indicator “The area of nature reserves (X22)” has the largest proportion, accounting for 2.759%. There are only 6 indicators whose weights exceed 0.5%.
This indicates that during the process of economic development, at different stages, the economy has different and relatively large impacts on the ecology and other aspects of society.
3.3. Pressure Subsystem
In the first stage (from 2000 to 2016), the pressure value of China’s ecological environment showed a fluctuating upward trend. This indicates that during the process of pursuing GDP growth, China’s economic and social development has had a negative impact on the ecological environment. In the second stage (from 2017 to 2022), the pressure dropped to a relatively low level (Figure 6a).
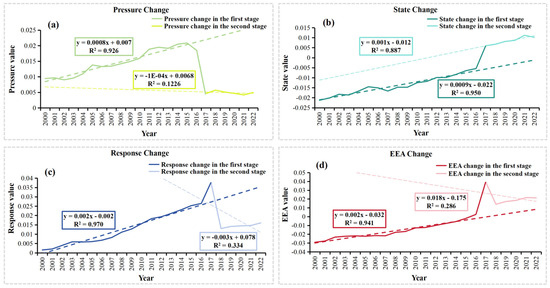
Figure 6.
The changes in the index of each system in PSR. Subfigure (a) represents the annual changes in pressure, (b) represents the annual changes in state, (c) represents the annual changes in response, (d) represents the annual changes in EEA. The line segments and the boxes of the same color correspond one by one. The content within the box represents the specific outcome of the linear fitting.
3.4. State Subsystem
In the first stage, the state value showed a fluctuating growth, and the growth rate was slow. The slope of the linear fitting was 0.0009. In the second stage, the state value grew relatively rapidly and reached a relatively high level, with the slope of the linear fitting being 0.001 (Figure 6b).
3.5. Response Subsystem
In the first stage, the response value showed an upward trend.
In the second stage, there was a relatively obvious decline in 2018 (Figure 6c).
3.6. Comprehensive Evaluation Index of China’s Ecological Environment (EEA)
From 2000 to 2022, the EEA as a whole showed an upward trend (Figure 6d).
4. Discussion
This paper studies the structural relationship between China’s economic development and the changes in the ecological environment from 2000 to 2022, focusing on the inflection point of the changes in the ecological environment and its formation causes. Through the entropy weight method, the AHP, and quadratic model fitting, it is found that the inflection point is between 2016 and 2017. Moreover, the inflection point is further applied to dynamize the PSR model, explaining the change in China’s governance focus from end-of-pipe pollution control to ecological space restoration before and after the inflection point. These results are of great significance for understanding the dynamic changes in the ecological environment during China’s rapid urbanization and economic development.
The “inflection point” occurred in the 2016–2017 period, the result of a combination of international, economic, policy and technological factors. Against the backdrop of changes in the international situation (such as the “China–US trade war”), China’s industrial structure has demonstrated strong resilience, with the proportion of the tertiary industry exceeding 50%. At the same time, due to issues such as sandstorms, smog, and industrial pollution in China, the public’s health level has declined, and medical costs have increased [54]. These factors have triggered serious discussions about the deterioration of the ecological environment and demands for improvement, prompting the Chinese government to formulate the strategies of “Beautiful China” and “Healthy China”. Subsequently, by adjusting domestic economic and environmental protection policies (such as the “Supply-side Structural Reform” and the “New Environmental Protection Law”), China has successfully alleviated domestic economic and environmental pressures. Thus, it can be seen that both domestic and international pressures have, to a certain extent, contributed to the formation of the “inflection point” in China.
The results of this study confirm the traditional Environmental Kuznets Curve (EKC) theory [55] and discover the inverted U-shaped relationship between economic development and the ecological environment. At the same time, this study enriches the EKC theory. It is believed that the traditional EKC theory tends to emphasize the self-regulation of the market while ignoring policy interventions [56] (such as the environmental protection inspection system and the “Supply-side Structural Reform”); and it also discovers the “asymmetry” of China’s inflection point (for example, the comprehensive air pollution degree and the comprehensive pollution degree of exhaust gas have improved, but carbon emissions have not reached their peak). For instance, the reduction in excess capacity in China’s steel and coal industries can quickly improve air quality, but the transformation of the energy structure will take a longer time. It can be seen that policy interventions can significantly shorten the cycle of “pollution first, treatment later”.
Therefore, based on the EKC theory, this study proposes the concept of the “Policy-driven EKC” to correct the traditional theory’s excessive reliance on market spontaneity and further proposes the “Policy-driven EKC—China’s PSR Model” (Figure 7). Based on the normal laws of ecological and environmental changes, this model also has broader explanatory power and can serve as a reference for the ecological and environmental changes in other countries and regions around the world.
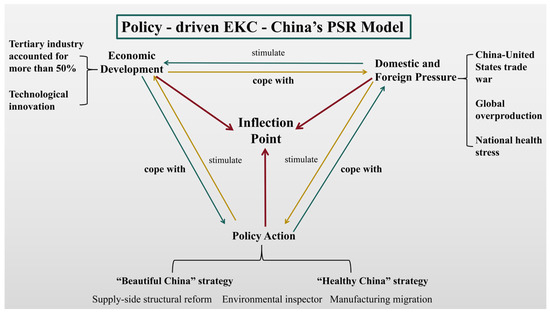
Figure 7.
Policy-driven EKC—China’s PSR Model.
Compared with the existing literature, this paper does not simply categorize economic factors as either positive or negative influencing factors. Instead, it conducts segmented calculations and discussions based on the inflection point, which is different from most of the existing articles that apply the PSR model for research [57,58,59].
There are significant differences in the comprehensive weights of the indicators of each subsystem in the two stages within the PSR model.
In the pressure subsystem, in the early stage, the indicator “National Coal Consumption” had the largest weight, indicating that China’s early economic development was overly dependent on resource-based industries, such as heavy industries like coal, steel, and chemical engineering, while the development of service industries, high-tech industries, etc., was relatively lagging behind [60]. Moreover, coal has long occupied a dominant position in the energy consumption structure, leading to pollutant emissions and exerting great pressure on the environment [61].
In the later stage, GDPP (X11) was the indicator with the largest weight in the pressure index and showed a large change (from 0.299% to 0.873%), reflecting that the excessive pursuit of economic development in the early stage had a great impact on the environment, such as the large generation of “three wastes” during industrialization and the occupation of land by construction projects like real estate.
However, with the sound development of the economy, the improvement of the industrial structure, etc., and accompanied by the development of ecological technology, the pressure in the second stage decreased significantly.
In the state subsystem, the core pressure of the state subsystem in the early stage originated from the direct pollution (such as waste gas and wastewater) brought about by industrialization and urbanization after the pursuit of economic development (X21). The indicators with higher weights (such as the comprehensive air pollution degree and the area of marine water quality other than category I) directly reflected the accumulation effect of pollutants [62,63]; the governance measures mainly focused on end-of-pipe treatment (such as shutting down polluting enterprises and installing treatment facilities), with the goal of curbing the trend of environmental deterioration.
In the later stage, with the “environmental protection inspections” and the “Supply-side Structural Reform” significantly reducing pollution sources and alleviating the pollution pressure, the improvement of the state subsystem relied more on ecological restoration measures (for example, the area of nature reserves (X22) increased from 0.079% to 2.759%, and the comprehensive weight of artificial afforestation measures (X23) jumped to 0.512%). This indicates that the governance goal has been upgraded from “reducing environmental damage” to “rebuilding ecological resilience”.
In addition, the increase in the weight of the Engel coefficient also means an improvement in the living standards of the Chinese people, and the public’s awareness of environmental protection has also been enhanced accordingly, with more attention paid to the experience brought by the ecological environment. It deeply reflects the transformation from “treating the symptoms” to “treating the root cause”. The increase in the slope (from 0.0009 to 0.001) also shows that a series of environmental protection measures implemented around 2016 have played a decisive role.
In the response subsystem, the weight of “The area of nature reserves” in the later stage jumped to 2.759%, indicating a policy shift towards the protection of ecological space; the weight of the “Comprehensive Utilization Rate of Industrial Solid Waste” also increased significantly in the later stage, indicating that the problems of wastewater and waste gas have received attention, while the treatment of solid wastes remains an issue (Figure 4), even in the world [64,65], such as the “Great Pacific Garbage Patch” in the North Pacific Ocean [66].
The decline in the response index in 2018 was affected by external shocks. The GDP growth rate slowed down, and environmental protection investment shrank, reflecting the impact of economic fluctuations on the “response” link; after 2019, the implementation of the “Foreign Investment Law” to expand domestic demand reflected the role of policy flexibility in the stability of the system [67,68].
The overall increase in China’s Comprehensive Ecological and Environmental Assessment Index (EEA) indicates that the ecological environment is generally improving. It can be seen that the efforts made by China in multiple fields have achieved results, such as the vigorous promotion and development of new energy vehicles [69,70] and the development and utilization of renewable energy sources such as wind energy and photovoltaics [71].
However, in the later stage, it decreased relatively rapidly in 2018 compared with 2017. This was mainly affected by the “China–US trade war” [72], and the value of US imports from China decreased by about 0.4% [73]. China responded by expanding domestic demand, increasing investment in infrastructure construction, promoting consumption upgrading, and actively expanding trade cooperation, laying the foundation for the steady recovery of the EEA.
In the future, China needs to continue to strengthen ecological and environmental protection and policy improvement, such as upgrading solid waste treatment technology, improving energy utilization efficiency, increasing the development of renewable energy sources, expanding domestic demand, optimizing the industrial structure, and enhancing the ability to resist external risks.
This study focuses on the relationship between urbanization and the ecological environment at the overall level of China, aiming to explore the nonlinear relationship between the two from a macro perspective. Although it has not been able to delve into specific cities or regions, this macro perspective helps to reveal the overall trends and policy impacts at the national level. However, China has a vast territory, and there are significant differences in economic development and environmental conditions among regions.
Future research can be further refined to specific regions or cities to explore regional differences. For example, it can study the differences between the eastern coastal areas and the central and western regions or the differences between large cities and small and medium-sized cities. Such regional research will help to have a deeper understanding of the complex relationship between urbanization and the ecological environment and provide a reference for local governments to formulate more targeted policies.
Compared with the study by Chenxu Wang et al. [74], this study identifies the period from 2016 to 2017 as the turning point of China’s ecological environment pressure. The emergence of this turning point is not only related to economic growth but also closely associated with changes in the international situation and domestic policy adjustments, such as the implementation of the “Supply-side Reform” and the environmental supervision system. The study by Chenxu Wang et al. identifies 2011 [74] as the turning point in the relationship between human activities and environmental quality. After that, the human–nature relationship gradually shifted from conflict and degradation to coordination.
This difference may stem from the different analytical frameworks and data processing methods in the two articles. Chenxu Wang et al. [74] comprehensively considered the dynamic changes in the intensity of human activities and environmental quality, while this study focuses more on the direct impact of policy interventions on environmental pressure. Chenxu Wang et al. [74] used a random forest model to identify the impacts of natural conditions, socioeconomic conditions, and geographical location conditions on the human–nature relationship and found that after 2011, socioeconomic factors (such as rural cultural service expenditure and urban fixed asset investment) became the main driving factors. In contrast, this study analyzes the environmental governance logic in different stages through the PSR model and discovers that policy interventions and industrial structure optimization are the key factors.
Both studies reveal the dynamic changes in the relationship between human activities and the ecological environment during China’s urbanization process and emphasize the crucial role of policy interventions in improving environmental quality. Chenxu Wang et al. [74], through the analysis of high-resolution HAI (Human Activity Intensity) and EQI (Environmental Quality Index), reveal the spatio-temporal dynamic changes and their driving factors between human activities and environmental quality, providing a scientific basis for regional sustainable development. This study, by analyzing the impact of policy interventions on the turning point of the ecological environment through the PSR model, proposes the “Policy-driven EKC” theory, offering a new perspective for understanding China’s ecological environment governance.
The conclusions of the two studies complement each other, jointly emphasizing the importance of policy interventions in balancing economic development and ecological environmental protection. The research results of this article provide theoretical support for understanding the periodic characteristics of China’s ecological environment governance, while the research results of Chenxu Wang et al. [74] provide practical guidance for the implementation of regional ecological projects and the improvement of the human–nature relationship.
Globally, Brazil, as the largest economy in Latin America, is also facing significant environmental pressure. Vieira and Silva (2024) pointed out that Brazil aims to achieve zero deforestation and degradation (ZDD) in the Amazon region from 2023 to 2030. Despite a series of actions taken by the Brazilian government, its policies have obvious deficiencies in terms of implementation intensity and coverage and have failed to effectively eliminate deforestation and degradation [75].
Compared with Brazil, the intensity and effect of policy intervention in China are more remarkable. China’s “Supply-side Structural Reform” and “environmental protection inspection system” have effectively reduced pollution pressure and promoted the continuous improvement of the ecological environment. These policies are implemented with great intensity and wide coverage. Thanks to the centralized system, they can be implemented promptly and effectively. However, the implementation and coordination of policies in Brazil are insufficient. Protected areas and indigenous lands are often poorly managed due to a lack of personnel and infrastructure.
In terms of economic structure, the Brazilian economy is dominated by agriculture and resource-based industries, exerting considerable pressure on the natural ecological environment. Despite the adoption of protective measures, agricultural expansion and illegal mining remain the main causes of deforestation and ecological degradation. China is different. With the increase in the proportion of the tertiary industry and the elimination of high-pollution and high-energy-consuming industries, the economic growth model is transforming towards a green and sustainable direction, providing a more solid economic foundation for policy implementation.
China’s experience in ecological environment governance shows that policy intervention plays a key role in ecological environment governance. Under favorable economic conditions and strong policy enforcement, China has achieved a turning point in ecological environmental pressure in a short period through strong policy intervention (as mentioned in this article, the turning point in China was from 2016 to 2017). Brazil’s ZDD goal provides a new perspective for global ecological environment governance. Although Brazil has deficiencies in policy enforcement and coordination, its sustainable regional management and integrated departmental policies are worth learning from.
The limitations of this study also lie in the data coverage. For example, the lack of soil pollution data may lead to an underestimation of the pressure from agricultural non-point sources. In future research, the DPSIR model [76] can be integrated, incorporating global driving forces (international carbon neutrality cooperation initiatives) and health impact indicators. At the same time, machine learning can be utilized to predict the heterogeneity of regional inflection points.
5. Conclusions
Through the dynamic PSR model, this study reveals the dynamic evolution mechanism of the ecological environment pressure and the causes of the inflection point during China’s urbanization process from 2000 to 2022.
The main contributions include: proposing the concept of the “Policy-driven EKC”, which corrects the traditional theory’s excessive reliance on market spontaneity; providing a new methodology for long-term environmental assessment through the dynamic weighting (segmented calculation) of the PSR model; offering China’s experience of “breaking first and then establishing” for developing countries to balance economic growth and ecological protection, that is, quickly curbing pollution through institutional rigidity (such as environmental protection inspections), and then restoring the resilience of the ecosystem through ecological investment (such as artificial afforestation), and also providing the “Policy-driven EKC-China PSR Model” for reference. China’s experience shows that achieving the inflection point of the ecological environment requires the collaborative efforts of policies, technologies, and society, contributing the Eastern wisdom of “giving priority to institutional innovation” to global climate governance [77].
Author Contributions
R.A. collected the data and wrote the paper, X.H. gave guidance on the specific analysis of the paper results, and S.S. gave guidance on the basic data analysis; both parties participated in the final revision and finalization of the paper. All authors have read and agreed to the published version of the manuscript.
Funding
This research received no external funding.
Institutional Review Board Statement
This study does not require ethical approval.
Informed Consent Statement
This study does not involve research on human patients or any other related studies.
Data Availability Statement
Data are available in the public dataset on Mendeley Data, with the DOI link [https://doi.org/10.17632/5gnz6fpv3p.1]. The R Package is available in the public dataset on Mendeley Data, with the DOI link [https://doi.org/10.17632/xf82rz5hd3.1].
Acknowledgments
We would like to express our gratitude to Yang Zhang, Shuaibing He, Xiang-xiang Yang, Liang Zhong, Shengjie Yang and Miao Dong from the School of Life Sciences at Nanjing University for their valuable guidance and assistance. We also extend our sincere thanks to the reviewers for their diligent efforts. This article is dedicated to presenting China’s solutions for balancing economic development with ecological protection to the world, and we hope to contribute our modest share to the global ecological conservation endeavor. This research did not receive any specific grant from funding agencies in the public, commercial, or not-for-profit sectors.
Conflicts of Interest
The authors declare that they have no known competing financial interests or personal relationships that could have appeared to influence the work reported in this paper.
References
- Chen, P. Industrialization and pollution: The long-term Impact of early-life exposure on human capital formation. J. Public Econ. 2025, 241, 105270. [Google Scholar] [CrossRef]
- Klobučar, G.; Selak, A.; Stipaničev, D.; Repec, S.; Vucić, M.; Bojanić, K.; Šiljeg, M.; Hudina, S.; Weigelt, D.M. Seasonal variability and risk evaluation of emerging organic contaminants in european river: Linking in silico and in vitro approaches to prioritize hazardous EOCs. Environ. Res. 2025, 268, 120840. [Google Scholar] [CrossRef]
- Xiang, Q.; Fan, D.D.; Zhu, L.M.; Zhang, T.S.; Shen, D.N.; Wang, H.; Dong, B. Weighted comprehensive risk assessment and pollution analysis of long-term printing and dyeing sludge landfills in an industrialized chinese city. Environ. Pollut. 2025, 367, 125665. [Google Scholar] [CrossRef] [PubMed]
- Li, C.; Wang, W.X.; Wang, K.X.; Wang, Y.S.; Zhang, M. Responses of greenhouse gas emissions to increased precipitation events in different ecosystems: A meta-analysis. Catena 2024, 246, 108400. [Google Scholar] [CrossRef]
- Mokany, K.; Giljohann, K.M.; Ware, C. Reporting the biodiversity impacts of greenhouse gas emissions. Glob. Change Biol. 2023, 30, e17037. [Google Scholar] [CrossRef]
- Grossman, G.M.; Krueger, A.B. Economic growth and the environment. Q. J. Econ. 1995, 110, 353–377. [Google Scholar] [CrossRef]
- Stern, D.I. The rise and fall of the Environmental Kuznets Curve. World Dev. 2004, 32, 1419–1439. [Google Scholar] [CrossRef]
- Cui, C.Z. Research on the Clean Air Act of 1956 in Britain. Master’s Thesis, Henan University, Kaifeng, China, 2018. Available online: https://kns.cnki.net/kcms2/article/abstract?v=32-8vZI681JbLVqGMO_cDpipNDKExqkv_tRl4R2SYzEgB5r_ZcLJVAYver64aXza2TNqyrph4xK-Lsyw3RSCaNMH1A-x_zyU3ozak4wQ4RP1d-141-tD3MBgisVPSOFkd6TVyzXewHx0hRs2-0sfGA8pglcQiD_eJ_lBMRgf_YKcBw8YDMu1uxeSUu8HS8qqf3fqvmrDCQs=&uniplatform=NZKPT&language=CHS (accessed on 6 January 2025). (In Chinese).
- Peter, B. The Big Smoke (Routledge Revivals): A History of Air Pollution in London since Medieval Times; Methuen: London, UK, 1987; p. 202. [Google Scholar] [CrossRef]
- Lu, W.F.; Xiao, X.D.; Zhang, T.; Chen, X.; Liu, X.Y. How western countries tackle air pollution. Hist. Bimon. 2018, 4, 4–26. Available online: https://kns.cnki.net/kcms2/article/abstract?v=32-8vZI681J2yicvfFLbrNSXRkPK4N0XPObSFKDf2ZAiW9cPvmayyGTl54_6zcz_NsvzWEvYUiDmLVF--6YJwanhoG1JM2GYoaFKKwnyCPHD8fPSIGt3vkO_5qFx4HRxjTaRs8bf5Ngzq1zMFsMn8HTKjPvLYFjcL5YMNY2XmJbpz5CDGQyV--h5cDp4YvQN4zjyTuT6pTo=&uniplatform=NZKPT&language=CHS (accessed on 6 January 2025). (In Chinese).
- Diem, J.E. The 1970 Clean Air Act and termination of rainfall suppression in a U.S. urban area. Atmos. Environ. 2013, 75, 141–146. [Google Scholar] [CrossRef]
- Liang, L.W.; Wang, Z.B.; Li, J.X. The effect of urbanization on environmental pollution in rapidly developing urban agglomerations. J. Clean. Prod. 2019, 237, 117649. [Google Scholar] [CrossRef]
- Xu, Z.P.; Luo, J. Sustainable Urbanization: Unpacking the Link Between Urban Clusters and Environmental Protection. Sustainability 2025, 17, 873. [Google Scholar] [CrossRef]
- Central People’s Government of the People’s Republic of China. Notice on Issuing the Circular “The Core Connotation of ‘Supply-Side Reform’ Is Deepening Reform to Liberate Productive Forces”. Available online: https://www.gov.cn/zhengce/2016-01/22/content_5035336.htm (accessed on 6 January 2025). (In Chinese)
- Xinhua News Agency. The Central Environmental Inspection Has Shown Great Power: Within Two Years from 2016 to 2017, It Achieved Full Coverage of all 31 Provinces in the Country. Available online: http://www.xinhuanet.com/politics/2017-11/07/c_1121916536.htm (accessed on 6 January 2025). (In Chinese).
- Zhao, H.F.; Li, S.Y. The Influence of Central Environmental Inspection on Overcapacity of Manufacturing Enterprises—Based on An Empirical Analysis of the Multiphase Difference-in-Differences Model. J. Beijing Inst. Technol. (Soc. Sci. Ed.) 2021, 23, 17–29. (In Chinese) [Google Scholar] [CrossRef]
- Naqvi, R.A.; Almohsen, B.; Sohail, A. Modeling the Environmental Kuznets Curve: A stochastic approach using economic and climate data. J. Environ. Manag. 2025, 373, 123108. [Google Scholar] [CrossRef] [PubMed]
- Li, J.B.; Huang, X.J.; Chuai, X.W.; Yang, H. The impact of land urbanization on carbon dioxide emissions in the Yangtze River Delta, China: A multiscale perspective. Cities 2021, 116, 103275. [Google Scholar] [CrossRef]
- Lu, Y.Y.; Fang, G.X.; Deng, M.J.; Fang, G.H.; Zhu, Z.; Sun, C.G.; Yang, Z. Ecological health assessment of riparian zone of Yangtze River based on trapezoid cloud model in Jiangsu Province, China. Ecol. Indic. 2024, 169, 112796. [Google Scholar] [CrossRef]
- Tavosi, M.; Vafakhah, M.; Sadeghi, S.H.; Shekohideh, H.; Moosavi, V. Comparative assessment of Watershed Hydrological Health (WHH) using multi-criteria decision-making approach based on PSR framework. J. Environ. Manag. 2025, 373, 123833. [Google Scholar] [CrossRef]
- Wan, Z.Y.; Zhao, C.Y.; Zhu, J.T.; Ma, X.F.; Chen, J.Z.; Wang, J.H. Assessment and prediction of coastal ecological resilience based on the Pressure–State–Response (PSR) Model. Land 2024, 13, 2130. [Google Scholar] [CrossRef]
- Liu, H.M.; Wang, L.; Wang, J.Z.; Ming, H.T.; Wu, X.K.; Xu, G.; Zhang, S.W. Multidimensional spatial inequality in China and its relationship with economic growth. Humanit. Soc. Sci. Commun. 2024, 11, 1415. [Google Scholar] [CrossRef]
- Peng, R.X.; Liu, T.; Cao, G.Z. Spatial pattern of urban economic resilience in eastern coastal China and industrial explanation. Geogr. Res. 2021, 40, 1732–1748. (In Chinese) [Google Scholar] [CrossRef]
- Ma, L. Green industrial transformation path of Chinese coastal areas based on coupling types of industrial development with environment. Geogr. Res. 2018, 37, 1587–1598. (In Chinese) [Google Scholar] [CrossRef]
- Zhang, R.G.; Qiu, Q.W.; Yan, Y.H. Industrial Development and Spillover Effects in Western Resource-based Regions: A Study Based on the Two Dimensions of Time and Space. Sci. Technol. Prog. Policy 2022, 39, 87–94. (In Chinese) [Google Scholar] [CrossRef]
- Guo, K.; Ji, Q.; Zhang, D.Y. A dataset to measure global climate physical risk. Data Brief 2024, 54, 110502. [Google Scholar] [CrossRef] [PubMed]
- Afrane, S. Prioritizing Waste-to-Energy Technologies in Ghana Using Multi-Criteria Decision Analysis. Master’s Thesis, Tianjin University, Tianjin, China, 2021. (In Chinese). [Google Scholar]
- Bernhard, W.; Harald, V. Evaluating sustainable forest management strategies with the Analytic Network Process in a Pressure-State-Response framework. J. Environ. Manag. 2008, 88, 1–10. [Google Scholar] [CrossRef]
- Robygd, J.; Harrie, L.; Martin, T. Spatial multi criteria analysis of ground conditions in early stages railway planning using analytical hierarchy process applied to viaduct-type rail in Southern Sweden. Eng. Geol. 2025, 348, 107962. [Google Scholar] [CrossRef]
- Guo, M.Q.; Pan, W.K.; Hu, C.P. Methods of model comparison in cognitive modeling. Adv. Psychol. Sci. 2024, 32, 1736–1756. (In Chinese) [Google Scholar] [CrossRef]
- Cafaro, P.; Hansson, P.; Götmark, F. Overpopulation is a major cause of biodiversity loss and smaller human populations are necessary to preserve what is left. Biol. Conserv. 2022, 272, 109646. [Google Scholar] [CrossRef]
- Elsen, P.R.; Monahan, W.B.; Merenlender, A.M. Topography and human pressure in mountain ranges alter expected species responses to climate change. Nat. Commun. 2020, 11, 1974. [Google Scholar] [CrossRef]
- Institute of World Economics and Politics Chinese Academy of Social Sciences. Will China Lose Its Status as the World’s Factory?—The New Trend of International Industrial Transfer and China’s Policy Choices. Available online: http://www.iwep.org.cn/xscg/xscg_sp/202406/t20240611_5758052.shtml (accessed on 6 January 2025). (In Chinese).
- Central People’s Government of the People’s Republic of China. Expert: Cooperation Between China and BIMP-EAGA Enjoys Broad Prospects. Available online: https://www.gov.cn/xinwen/2018-05/08/content_5289250.htm (accessed on 6 January 2025). (In Chinese)
- Central People’s Government of the People’s Republic of China. Report of the 18th National Congress of the Communist Party of China. Available online: https://www.gov.cn/ldhd/2012-11/17/content_2268826_5.htm (accessed on 6 January 2025). (In Chinese)
- Zhuang, X.D.; Fu, W.B. Does cutting overcapacity increase corporate risk-taking? Evidence from supply-side structural reform in China. Environ. Dev. Sustain. 2025, 1–31. [Google Scholar] [CrossRef]
- Yan, K.; Zhang, Z.Y.; Yang, L.S.; Cao, Y.Q.; Shan, Y.W. Capital generates green: Evidence from China’s national innovation system policy. Int. Rev. Financ. Anal. 2024, 91, 103033. [Google Scholar] [CrossRef]
- Central People’s Government of the People’s Republic of China. Notice on Issuing the Circular “Opinions of the State Council on Resolving Overcapacity and Achieving Distress Relief in the Steel Industry”. Available online: https://www.gov.cn/gongbao/content/2016/content_5045931.htm (accessed on 6 January 2025). (In Chinese)
- Central People’s Government of the People’s Republic of China. Notice on Issuing the Circular “Opinions of the State Council on Resolving Overcapacity and Achieving Distress Relief in the Coal Industry”. Available online: https://www.gov.cn/gongbao/content/2016/content_5045944.htm (accessed on 6 January 2025). (In Chinese)
- State Council of the People’s Republic of China. The Implementation of Supply-Side Structural Reform Through Reform Measures in Various Regions. Available online: https://baike.baidu.com/item/%E5%90%84%E5%9C%B0%E5%8C%BA%E4%BB%A5%E6%94%B9%E9%9D%A9%E4%B8%BE%E6%8E%AA%E8%90%BD%E5%AE%9E%E4%BE%9B%E7%BB%99%E4%BE%A7%E7%BB%93%E6%9E%84%E6%80%A7%E6%94%B9%E9%9D%A9%E6%83%85%E5%86%B5/19688425?fr=aladdin (accessed on 6 January 2025). (In Chinese).
- Xia, D.; Zhang, L. Coupling coordination degree between coal production reduction and CO2 emission reduction in coal industry. Energy 2022, 258, 124902. [Google Scholar] [CrossRef]
- Shi, S.X.; Li, H.; Tang, H.S.; Liu, Y. A study of the impact of de-capacity policies on industry capacity utilization paths: Evidence from the Chinese steel industry. PLoS ONE 2023, 18, e0295613. [Google Scholar] [CrossRef]
- China Steel Network. [Breaking News] Over 700 Steel Companies have been Shut Down! The Full List Is Exposed! Available online: https://www.sohu.com/a/168382734_141885 (accessed on 6 January 2025). (In Chinese).
- in-en.com. Focus|In 2016, a total of 1,688 Coal Mines Were Shut Down Nationwide (with List Attached). Available online: https://www.sohu.com/a/121659419_505851 (accessed on 6 January 2025). (In Chinese).
- Sohu.com. In 2017, These 1,000 Coal Mines Will Be Closed (with List Attached)! Available online: http://mt.sohu.com/business/d20170421/135538001_117460.shtml (accessed on 6 January 2025). (In Chinese).
- Central Government Portal Website, The Environmental Protection Law of the People’s Republic of China Came into Effect on January 1, 2015. Available online: https://www.gov.cn/xinwen/2014-04/25/content_2666328.htm (accessed on 6 January 2025). (In Chinese)
- Wang, J. Interpretation and Application of Public Participation in the Newly-Revised Environmental Protection Law. Environ. Prot. 2014, 42, 20–22. (In Chinese) [Google Scholar] [CrossRef]
- State Council of the People’s Republic of China. Notice on Issuing the Comprehensive Work Plan for Energy Conservation and Emission Reduction During the 13th Five-Year Plan Period. Available online: https://www.gov.cn/zhengce/zhengceku/2017-01/05/content_5156789.htm (accessed on 6 January 2025). (In Chinese)
- Liu, G.Y.; Huo, Z.M.; Wan, H.; Zucaro, A.; Fiorentino, G.; Lu, Y.Q.; Yang, Q. Evaluation of carbon sink and photovoltaic system carbon reduction along roadside space. J. Clean. Prod. 2024, 477, 143812. [Google Scholar] [CrossRef]
- Central People’s Government of the People’s Republic of China. The Central Environmental Protection Inspection Team Provides Feedback on the Inspection Results to Hebei Province. Available online: https://www.gov.cn/xinwen/2016-05/03/content_5070077.htm (accessed on 6 January 2025). (In Chinese)
- Central People’s Government of the People’s Republic of China. The First Batch of the Central Environmental Protection Inspection “Look-Back” Has Completed the Feedback Work on the Inspection. Available online: https://www.gov.cn/hudong/2018-10/25/content_5334239.htm (accessed on 6 January 2025). (In Chinese)
- Zhou, Y.; Feng, H.Y.; Chen, X.L. The deterrent effect of the Central Environmental Protection Inspection and the improvement of China’s environmental governance mechanism. Econ. Dyn. 2021, 8, 33–48. Available online: https://kns.cnki.net/kcms2/article/abstract?v=RN_8baVbY4cgeH5z5bD-ds5zewviPyfQ5OnU9u0LqS-lt6ziBHCMOqPiK-7uRxnxV-y4wfjZa-T6YkEYBZJE2Hw09AjcJblRfSMTRHhTZ94zmvi2nRQHa_dOe2gqwKXeY5KfGqGaq1qxmV5fVDHKkwtRmKu_nHp7tT9mjkm9jY4ip0nBTFfz6g==&uniplatform=NZKPT&language=CHS (accessed on 20 April 2025). (In Chinese).
- Wang, L.; Liu, X.F.; Xiong, Y. Central Environmental Protection Inspector and Air Pollution GovernanceAn Empirical Analysis Based on Micro-panel Data of Prefecture-level Cities. China Ind. Econ. 2019, 10, 5–22. Available online: https://kns.cnki.net/kcms2/article/abstract?v=cwBM1amFwwMqPeBOlBHA4LpcOk3qO8Rzjk8VkaopIcPWRoXnHcsiDH0z3Z8XuSvdSBiMvxtHJtCJzGVjGSoys3xpP53Rol4vZBdtpF6jZpNZO0d_r6wGCwSWeSXjhy7hMt10GjDu7VRlv_EoksGD_43BBKtBnDp_mSbzOEIUFwxCeLNvCZA4Xg==&uniplatform=NZKPT&language=CHS (accessed on 20 April 2025). (In Chinese).
- Zhou, M.J.; Hu, W.Q.; Yang, S.Y.; Zhu, X.; Zhao, C.C.; Bai, Z.Y. Spatial-temporal analysis of PM2.5-related health impact and economic losses in China from 2000 to 2017. J. Cent. China Norm. Univ. (Nat. Sci.) 2021, 55, 110–120. (In Chinese) [Google Scholar] [CrossRef]
- Wu, H.Y.; Ding, B.W.; Liu, L.; Zhou, L.; Meng, Y.; Zheng, X.J. Have agricultural land-use carbon emissions in China peaked? An analysis based on decoupling theory and spatial EKC Model. Land 2024, 13, 585. [Google Scholar] [CrossRef]
- Carson, R.T. The Environmental Kuznets Curve: Seeking empirical regularity and theoretical structure. Rev. Environ. Econ. Policy 2010, 4, 3–23. [Google Scholar] [CrossRef]
- Song, Z.H.; Zhu, N.; Yang, D.J.; He, D. Ecological security evaluation and prediction for coal resource cities based on the PSR Model: A case study of Xuzhou, China. Sustainability 2024, 16, 8461. [Google Scholar] [CrossRef]
- Li, J.H.; Pei, W.J.; Li, Y.H.; Liu, S.X.; Chen, Y.C.; Wang, B.; Chen, L.H.; Fan, K.; Zhang, J.S. Evaluating and diagnosing ecosystem health of the “three-lake” watershed in Yuxi, Yunnan, China from 2010 to 2020 by PSR-KDE. Environ. Res. 2024, 258, 119406. [Google Scholar] [CrossRef]
- Zhou, S.B.; Ye, J.Y.; Li, J.X.; Zhang, G.Q.; Duan, Y.Q. Identifying intrinsic drivers to changes in riparian ecosystem services by using PSR framework: A case study of the Grand Canal in Jiangsu, China. Environ. Dev. 2022, 43, 100728. [Google Scholar] [CrossRef]
- China National People’s Congress (NPC) Website. The Situation and Reflections on China’s Resource and Environmental Issues from a Global Perspective. Available online: http://www.npc.gov.cn/npc/c2/c189/c222/201905/t20190522_30268.html (accessed on 6 January 2025). (In Chinese)
- Central People’s Government of the People’s Republic of China. China’s Energy Policy. 2012. Available online: https://www.gov.cn/zhengce/2012-10/24/content_2615791.htm (accessed on 6 January 2025). (In Chinese)
- Evenset, A.; Hallanger, I.G.; Tessmann, M.; Warner, N.; Ruus, A.; Borgå, K.; Gabrielsen, G.W.; Christensen, G.; Renaud, P.E. Seasonal variation in accumulation of persistent organic pollutants in an arctic marine benthic food web. Sci. Total Environ. 2016, 542, 108–120. [Google Scholar] [CrossRef]
- Du, X.L.; Liu, F.; Jiang, R.Y.; Tian, D.X.; Zheng, Z.D.; Sheng, H.H. The accumulation process of pollutants in deposited particles of different sizes on different roads in Beijing, China. Environ. Geochem. Health 2024, 47, 19. [Google Scholar] [CrossRef] [PubMed]
- Oo, P.Z.; Prapaspongsa, T.; Strezov, V.; Huda, N.; Oshita, K.; Takaoka, M.; Ren, J.; Halog, A.; Gheewala, S.H. The role of global waste management and circular economy towards carbon neutrality. Sustain. Prod. Consum. 2024, 52, 498–510. [Google Scholar] [CrossRef]
- Dangi, M.B.; Malla, O.B.; Cohen, R.R.H.; Khatiwada, N.R.; Budhathoki, S. Life cycle assessment of municipal solid waste management in Kathmandu city, Nepal—An impact of an incomplete data set. Habitat Int. 2023, 139, 102895. [Google Scholar] [CrossRef]
- Marc, L. Plastic, Ahoy! Investigating the Great Pacific Garbage Patch. Science 2014, 346, 1175. [Google Scholar]
- Central People’s Government of the People’s Republic of China. Foreign Investment Law of the People’s Republic of China. Available online: https://www.gov.cn/xinwen/2019-03/20/content_5375360.htm (accessed on 6 January 2025). (In Chinese)
- Hong, J.J.; Chen, Y.; Yang, Z.H. Strategic Considerations for China’s Industrial Transfer: Characteristics, Motivations and Policy Outlook. Econ. Trade China 2024, 7, 11–21. Available online: https://kns.cnki.net/kcms2/article/abstract?v=RNPVX-4KY7gwwYYgbrZTIcBA3Eefc2seSwwIJfd7dUeq7HOrqoOQSlVf2JnQDjEdlimtqq2ryoxiaquJNMyPG-m9760eq1UVLbt4FMU9RrobJ5NqfHJBwtVVk4Gpr0vxagezhr5D8P-eNF314UkUaGzD2r7J4-UI6Uf7y7s9rOn6qBANeZYumg==&uniplatform=NZKPT&language=CHS (accessed on 21 April 2025). (In Chinese).
- Central Government Portal Website. Notice on the Fiscal Support Policies for the Promotion and Application of New Energy Vehicles from 2016 to 2020. Available online: https://www.gov.cn/xinwen/2015-04/29/content_2855040.htm (accessed on 6 January 2025). (In Chinese)
- Wang, S.; Wang, J.; Cheng, J.R. Does the promotion and application of new energy vehicles contribute to the reduction of carbon intensity? A quasi-natural experiment analysis. Sustain. Futures 2025, 9, 100455. [Google Scholar] [CrossRef]
- Ren, K.P.; Tang, X.; Huang, C.; Willerström, J.; Höök, M. Prospective metal requirements assessment of China’s wind-power and photovoltaics: Implications for emerging anthropogenic mines. Resour. Conserv. Recycl. 2025, 215, 108088. [Google Scholar] [CrossRef]
- Bissoondoyal-Bheenick, E.; Do, H.; Hu, X.L.; Zhong, A. Sentiment and stock market connectedness: Evidence from the U.S—China Trade War. Int. Rev. Financ. Anal. 2022, 80, 102031. [Google Scholar] [CrossRef]
- The Country Reports Website of the Ministry of Commerce of the People’s Republic of China. An Overview of U.S. Merchandise Trade and Sino-U.S. Bilateral Trade in 2018. Available online: https://countryreport.mofcom.gov.cn/record/view.asp?news_id=63499 (accessed on 6 January 2025). (In Chinese)
- Wang, C.; Liu, Y.; Chen, J.; Yu, C. Turning points of the relationship between human activity and environmental quality in China. Sustain. Cities Soc. 2025, 119, 106123. [Google Scholar] [CrossRef]
- Vieira, I.C.G.; Silva, J.M.C.d. Zero deforestation and degradation in the Brazilian Amazon. Trends Ecol. Evol. 2024, 39, 413–416. [Google Scholar] [CrossRef] [PubMed]
- Liu, W.; Chen, L.; Luo, F.J.; Zhao, Y.F.; Li, X.; Zeng, X.L. Novel assessment of china’s cobalt supply chain resilience based on DPSIR Model and machine learning. Resour. Conserv. Recycl. 2025, 215, 108107. [Google Scholar] [CrossRef]
- Dasgupta, S.; Laplante, B.; Wang, H.; Wheeler, D. Confronting the Environmental Kuznets Curve. J. Econ. Perspect. 2003, 16, 147–168. [Google Scholar] [CrossRef]
Disclaimer/Publisher’s Note: The statements, opinions and data contained in all publications are solely those of the individual author(s) and contributor(s) and not of MDPI and/or the editor(s). MDPI and/or the editor(s) disclaim responsibility for any injury to people or property resulting from any ideas, methods, instructions or products referred to in the content. |
© 2025 by the authors. Licensee MDPI, Basel, Switzerland. This article is an open access article distributed under the terms and conditions of the Creative Commons Attribution (CC BY) license (https://creativecommons.org/licenses/by/4.0/).