
The Nonlinear Relationship Between Urbanization and Ecological Environment in China Under the PSR (Pressure-State-Response) Model: Inflection Point Identification and Policy Pathways


Abstract

1. Introduction
2. Dataset and Methodology
2.1. Data Sources
2.2. Research Methods
2.2.1. Data Processing
- (1)
- Normalization of Indicator Data
- (2)
- Comprehensive Weighting Method
- Entropy Weight Method
- Analytic Hierarchy Process (AHP)
- ⮚
- Objective Level: The ultimate goal of decision-making (for example, selecting the best investment project).
- ⮚
- Criterion Level: Multiple indicators that affect the objective (such as cost, benefit, risk, etc.).
- ⮚
- Alternative Level: Specific alternative solutions (such as different investment projects).
- The comprehensive weight (Wc) (Equation (16)) is as follows:
- (3)
- AIC and BIC
2.2.2. Fitting of the “Ecological Pressure Index”—GDPP Model (Inflection Point Judgment)
- (1) Construction of the “Ecological Pressure Index”
- (2) Calculation of Weights Using the Entropy Weight Method: The historical data of the ten indicators were processed using the entropy weight method to determine the weight of each indicator (all treated as negative indicators), denoted as Wi.
- (3) Calculation of Weights Using the AHP: The historical data of the ten indicators were processed using the AHP to determine the weight of each indicator, denoted as Wj.
- (4) Calculation of Comprehensive Weights: The product of the entropy weight of each indicator and the weight calculated by the AHP is denoted as WC. That is, WC = Wi × Wj.
- (5) Calculation of the “Ecological Pressure Index”: Normalize the data of each indicator (19), and then calculate according to the weight of each indicator (20). Since the pressure indicators are negative indicators, the lower the negative value is, the smaller the pressure on the ecological environment is.where Zij is the result of normalizing the data of Xij, min (Xij) is the minimum value of the j-th indicator, and max (Xij) is the maximum value of the j-th indicator.where P is the value of the “Ecological Pressure Index”; Zij is the normalized value of the indicator; and Wcj is the comprehensive weight of the j-th indicator.
- (6) Normalization of the Gross Domestic Product per Capita (GDPP) from 2000 to 2022, denoted as N-GDPP.
- (7) Conducting the following analysis on the data of P and N-GDPP:
- Linear regression and quadratic model fitting: In SPSSAU (https://spssau.com/index.html (accessed on 21 March 2025), the value of P as the Y-axis and N-GDPP as the X-axis is taken, and tests of adjusted R2, AIC and BIC on the fitting models are conducted, respectively.
- Threshold effect analysis: In R-Studio (4.0.5), the value of p as the Y-axis and N-GDPP as the X-axis is taken, and inflection point analysis is performed using the threshold effect analysis package.
- (8) Judgment of the inflection point:
- In the regression analysis, for the equation with the highest goodness of fit, the maximum point is found according to the point where the first derivative is 0, that is, f′(x) = 0, and determine the inflection point.
- In the threshold effect analysis, the analysis results of the R package are checked.
2.2.3. Construction of China’s Comprehensive Ecological and Environmental Evaluation System
- (1) Construction of China’s Ecological and Environmental Evaluation System
- (2) The parameters of each subsystem of the two segments of the PSR model and the comprehensive evaluation index of China’s ecological environment are calculated (Equations (21) and (22)).where EEAi includes the pressure system, the state system, and the response system; Zij is the normalized value of the indicator; and Wcj is the comprehensive weight of the j-th indicator (when calculating the pressure subsystem, the GDPP in the second stage is taken as a negative value; in the remaining subsystems, the values of negative indicators are taken as negative numbers, and the values of positive indicators remain unchanged).where EEA is the comprehensive evaluation index of China’s ecological environment; Zij is the normalized value of the indicator; and Wcj is the comprehensive weight of indicator j (when calculating the parameters of EEA, the values of negative indicators are taken as negative numbers, and the values of positive indicators remain unchanged).
3. Results
3.1. “Ecological Pressure Index”—GDPP Model Fitting
3.1.1. Calculation of Indicator Weights in the “Ecological Pressure Index”
3.1.2. Linear and Quadratic Model Fitting
3.1.3. Threshold Effect Analysis
3.1.4. The Judgment of Inflection Point
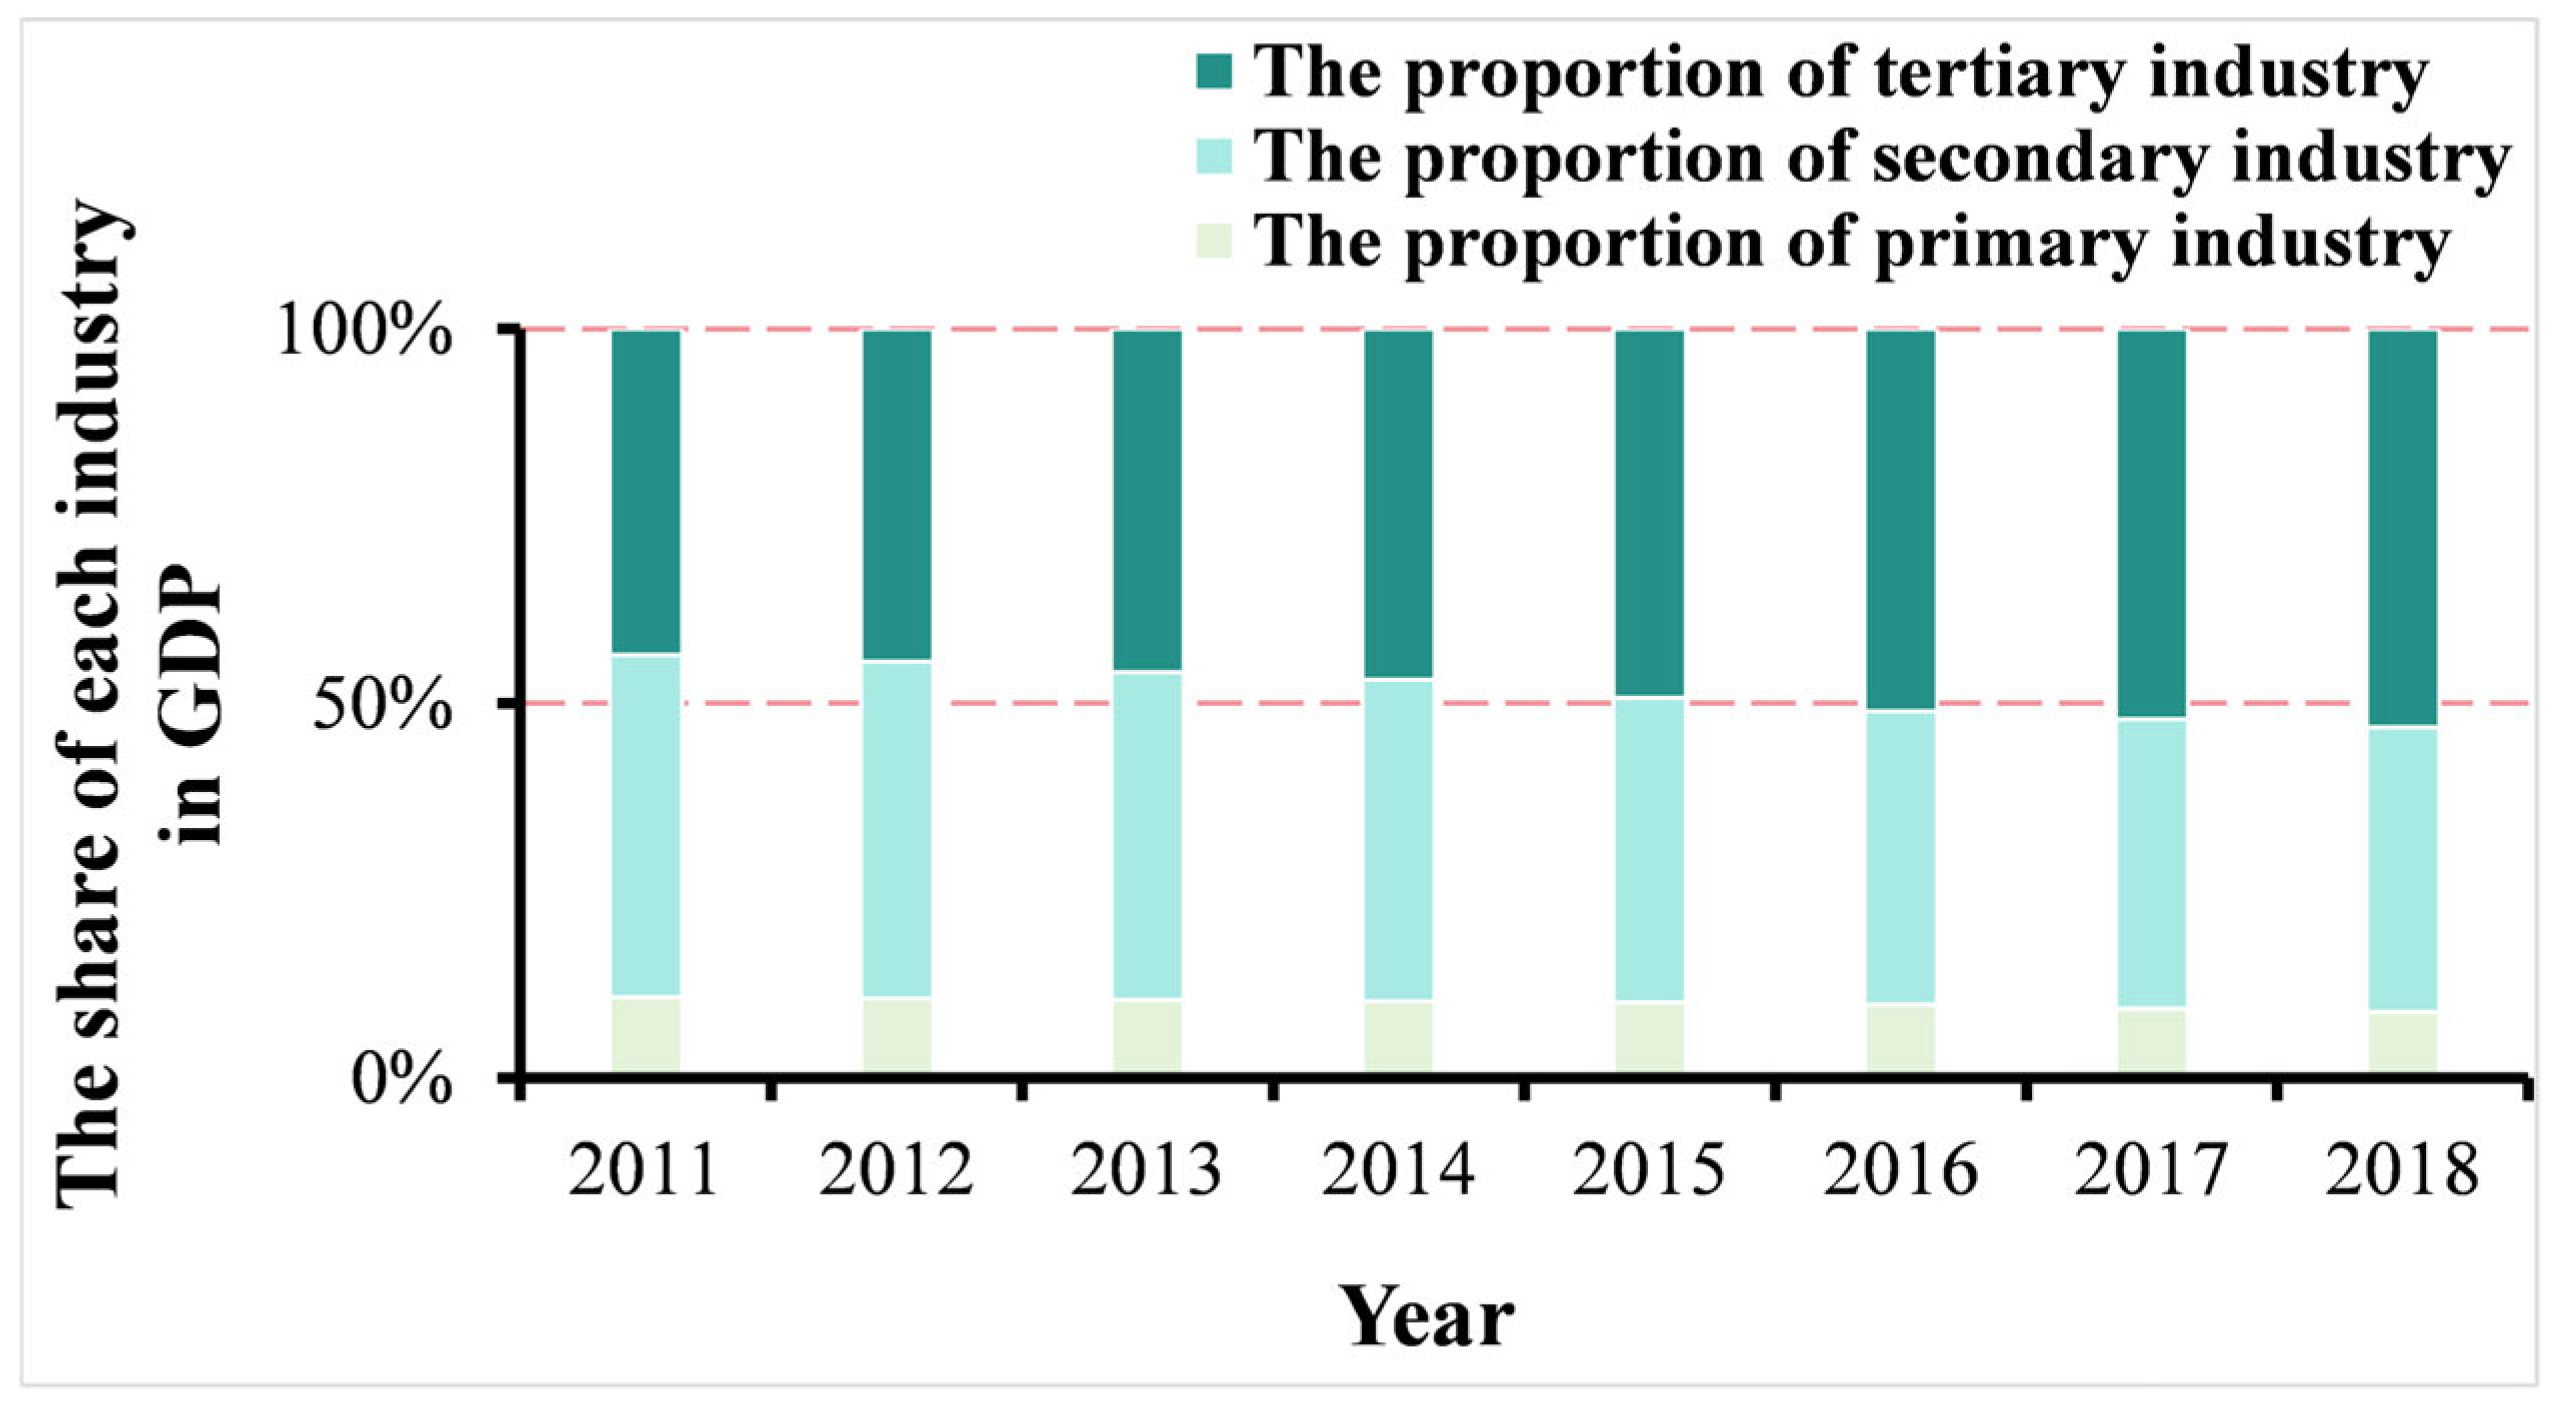
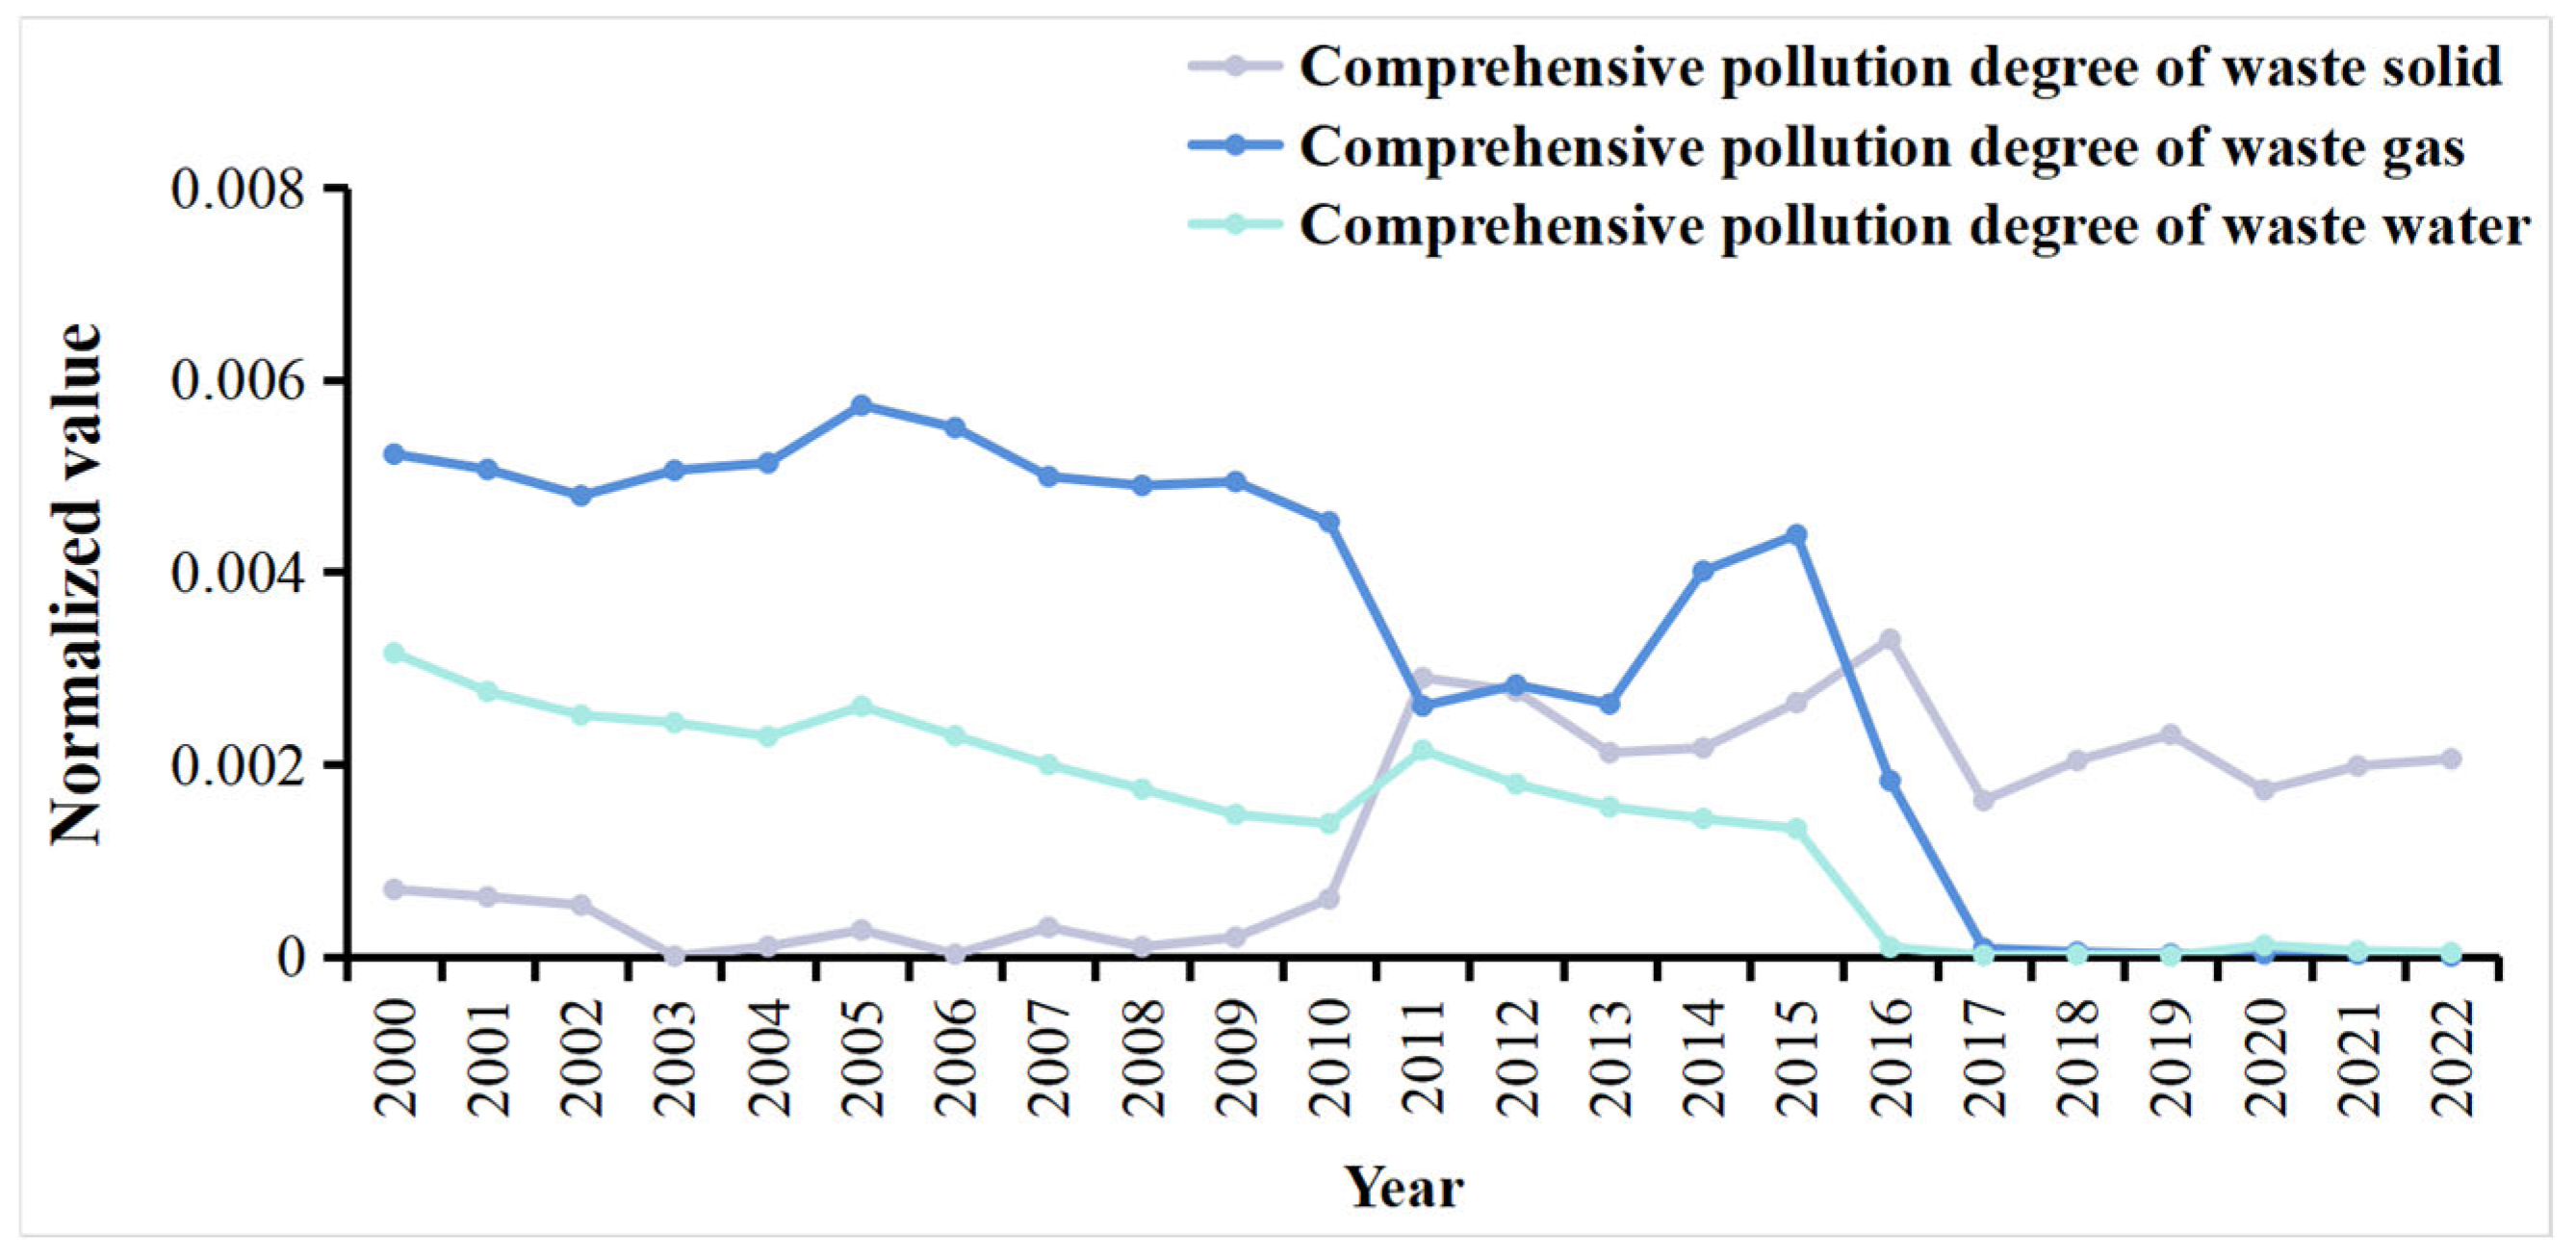
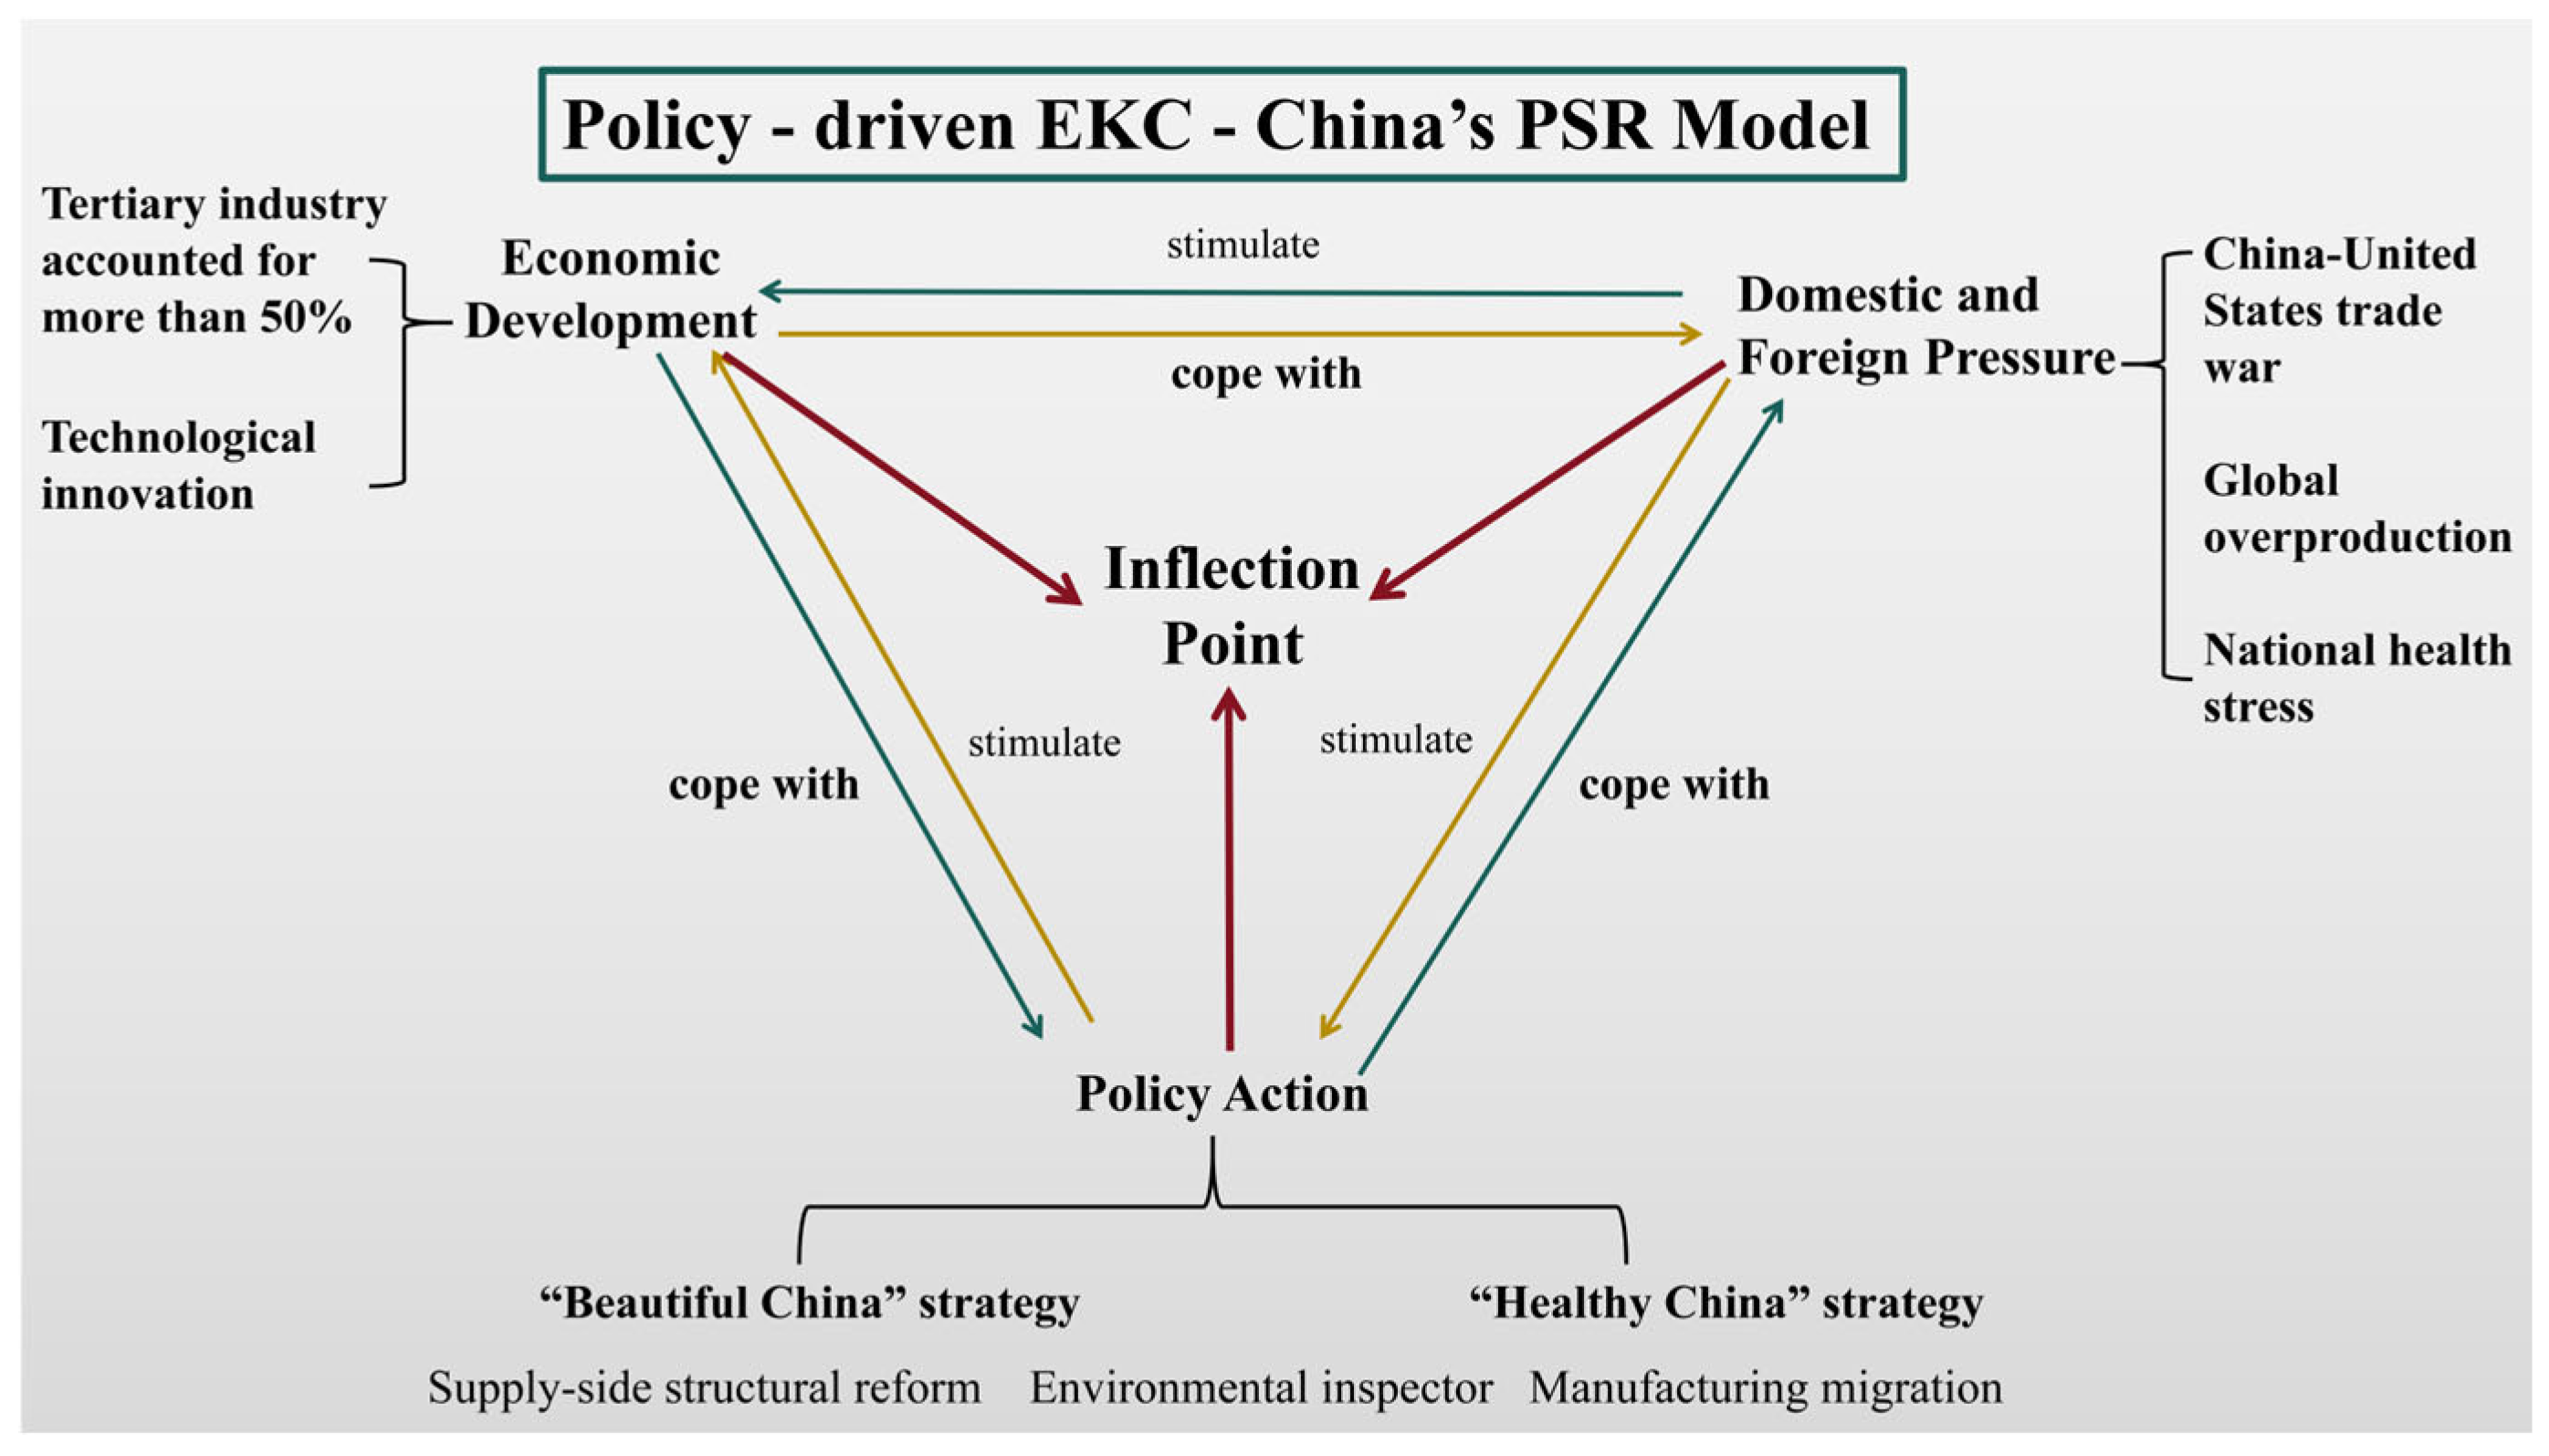
- The transformation of the economic structure from being dominated by the industrial sector to being dominated by the service sector has significantly reduced the pressure on the ecological environment. The growth rate of the proportion of the tertiary industry in China from 2016 to 2017 was larger than that from 2011 to 2012, which were 1.1% and 0.9%, respectively. However, the proportion of the tertiary industry exceeded 50% in 2017 (Figure 3), which indicates the optimization of China’s industrial structure. Specifically, the rapid development of the tertiary industry has reduced the dependence on high-pollution and high-energy-consuming industrial sectors, thereby reducing pollutant emissions (Figure 4).At the same time, China has carried out strategic adjustments to the industrial chain, gradually withdrawing from the final assembly links with low added value and instead focusing on the high added value links of the East Asian value chain to compete with Japan and South Korea. Meanwhile, China has strengthened industrial cooperation with the Association of Southeast Asian Nations (ASEAN), providing intermediate goods to the ASEAN region and allowing ASEAN to be responsible for the assembly work with lower technical content and added value [33]. Since the China–US trade frictions, China’s investment in the ASEAN region in 2017 exceeded 211.6 billion US dollars, among which the manufacturing industry accounted for more than 35% [34]. To a certain extent, this has reduced the number and scale of Chinese factories, greatly alleviating the environmental damage caused by industrial production.
- In the policy field, the Chinese government has placed greater emphasis on the strategies of green development and the Beautiful China Initiative. In 2012, the Chinese government first put forward the “Beautiful China” strategy [35]. In 2015, the Chinese government proposed the “Supply-side Structural Reform” system [14], which not only improved the quality and quantity of China’s economic growth but also had a profound impact on ecological and environmental protection [36,37]. Specifically, through eliminating backward production capacity and optimizing the industrial structure, the supply-side structural reform has significantly reduced the dependence on high-pollution and high-energy-consuming industries, thus reducing the pressure on the ecological environment. For example, in 2016, the State Council of China issued documents to promote the resolution of excess capacity in the steel and coal industries [38,39]. Hebei Province continued to implement the “6643” project (that is, by 2017, reducing 60 million tons of steel, 61 million tons of cement, 40 million tons of standard coal, and 36 million weight boxes of glass production capacity). Shandong Province focused on eight industries, including steel, cement, flat glass, electrolytic aluminum, ships, oil refining, tires, and coal, and made full use of market mechanisms, economic means, and legal measures to resolve excess capacity, creating room for the development of advanced productive forces [40]. These measures have not only optimized the industrial structure but also significantly reduced pollutant emissions [41,42]. As of 2017, more than 700 polluting and non-compliant steel enterprises were shut down [43], and 2688 coal mines were closed [44,45]. The comprehensive pollution degree of exhaust gas has significantly decreased (Figure 4). In the same year, China’s newly revised “Environmental Protection Law” was officially implemented, which is known as the “strictest environmental protection law in history” [46]. The implementation of this law not only provides stronger legal support for environmental protection but also further promotes the public’s continuous attention to and participation in environmental issues [47].In 2016, the State Council of China issued the Notice on the Comprehensive Work Plan for Energy Conservation and Emission Reduction during the 13th Five-Year Plan period. For example, in terms of promoting the optimization of the energy structure, the document suggested strengthening the safe, green development and clean, efficient utilization of coal; promoting the use of high-quality coal and clean coal; advancing the conversion from coal to gas and from coal to electricity; and encouraging the use of high-quality energy sources such as renewable energy, natural gas, and electricity to replace coal. Developing renewable energy sources such as island solar energy, offshore wind energy, tidal energy, and wave energy according to local conditions has promoted the continuous improvement of environmental quality [48,49]. The long-term effects of these measures have gradually emerged, driving the continuous optimization of the energy structure.During the same period, environmental protection inspections were officially launched in 2016. The central environmental protection inspections first started as a pilot in Hebei Province [50] and then completed the full coverage inspection of 31 provinces (autonomous regions and municipalities directly under the Central Government) across the country within one year [15], and since 2018, “follow-up inspections” and special inspections have been carried out [51]. The environmental protection inspection system has not only optimized China’s environmental governance system but also greatly enhanced the intensity of environmental protection [52], promoting the continuous improvement of the ecological environment. The long-term effect of the environmental protection inspection system lies in its sustainability and consistency, making environmental supervision a normal state and further consolidating the achievements of environmental governance [53]. Overall, although policies have a lag effect, the synergistic effect of these policy tools has not only improved the environmental quality in the short term but also provided support for long-term sustainable development, contributing to the formation of the inflection point in 2017.
3.2. Indicators Weight Analysis
3.3. Pressure Subsystem
3.4. State Subsystem
3.5. Response Subsystem
3.6. Comprehensive Evaluation Index of China’s Ecological Environment (EEA)
4. Discussion
5. Conclusions
Author Contributions
Funding
Institutional Review Board Statement
Informed Consent Statement
Data Availability Statement
Acknowledgments
Conflicts of Interest
References
- Chen, P. Industrialization and pollution: The long-term Impact of early-life exposure on human capital formation. J. Public Econ. 2025, 241, 105270. [Google Scholar] [CrossRef]
- Klobučar, G.; Selak, A.; Stipaničev, D.; Repec, S.; Vucić, M.; Bojanić, K.; Šiljeg, M.; Hudina, S.; Weigelt, D.M. Seasonal variability and risk evaluation of emerging organic contaminants in european river: Linking in silico and in vitro approaches to prioritize hazardous EOCs. Environ. Res. 2025, 268, 120840. [Google Scholar] [CrossRef]
- Xiang, Q.; Fan, D.D.; Zhu, L.M.; Zhang, T.S.; Shen, D.N.; Wang, H.; Dong, B. Weighted comprehensive risk assessment and pollution analysis of long-term printing and dyeing sludge landfills in an industrialized chinese city. Environ. Pollut. 2025, 367, 125665. [Google Scholar] [CrossRef] [PubMed]
- Li, C.; Wang, W.X.; Wang, K.X.; Wang, Y.S.; Zhang, M. Responses of greenhouse gas emissions to increased precipitation events in different ecosystems: A meta-analysis. Catena 2024, 246, 108400. [Google Scholar] [CrossRef]
- Mokany, K.; Giljohann, K.M.; Ware, C. Reporting the biodiversity impacts of greenhouse gas emissions. Glob. Change Biol. 2023, 30, e17037. [Google Scholar] [CrossRef]
- Grossman, G.M.; Krueger, A.B. Economic growth and the environment. Q. J. Econ. 1995, 110, 353–377. [Google Scholar] [CrossRef]
- Stern, D.I. The rise and fall of the Environmental Kuznets Curve. World Dev. 2004, 32, 1419–1439. [Google Scholar] [CrossRef]
- Cui, C.Z. Research on the Clean Air Act of 1956 in Britain. Master’s Thesis, Henan University, Kaifeng, China, 2018. Available online: https://kns.cnki.net/kcms2/article/abstract?v=32-8vZI681JbLVqGMO_cDpipNDKExqkv_tRl4R2SYzEgB5r_ZcLJVAYver64aXza2TNqyrph4xK-Lsyw3RSCaNMH1A-x_zyU3ozak4wQ4RP1d-141-tD3MBgisVPSOFkd6TVyzXewHx0hRs2-0sfGA8pglcQiD_eJ_lBMRgf_YKcBw8YDMu1uxeSUu8HS8qqf3fqvmrDCQs=&uniplatform=NZKPT&language=CHS (accessed on 6 January 2025). (In Chinese).
- Peter, B. The Big Smoke (Routledge Revivals): A History of Air Pollution in London since Medieval Times; Methuen: London, UK, 1987; p. 202. [Google Scholar] [CrossRef]
- Lu, W.F.; Xiao, X.D.; Zhang, T.; Chen, X.; Liu, X.Y. How western countries tackle air pollution. Hist. Bimon. 2018, 4, 4–26. Available online: https://kns.cnki.net/kcms2/article/abstract?v=32-8vZI681J2yicvfFLbrNSXRkPK4N0XPObSFKDf2ZAiW9cPvmayyGTl54_6zcz_NsvzWEvYUiDmLVF--6YJwanhoG1JM2GYoaFKKwnyCPHD8fPSIGt3vkO_5qFx4HRxjTaRs8bf5Ngzq1zMFsMn8HTKjPvLYFjcL5YMNY2XmJbpz5CDGQyV--h5cDp4YvQN4zjyTuT6pTo=&uniplatform=NZKPT&language=CHS (accessed on 6 January 2025). (In Chinese).
- Diem, J.E. The 1970 Clean Air Act and termination of rainfall suppression in a U.S. urban area. Atmos. Environ. 2013, 75, 141–146. [Google Scholar] [CrossRef]
- Liang, L.W.; Wang, Z.B.; Li, J.X. The effect of urbanization on environmental pollution in rapidly developing urban agglomerations. J. Clean. Prod. 2019, 237, 117649. [Google Scholar] [CrossRef]
- Xu, Z.P.; Luo, J. Sustainable Urbanization: Unpacking the Link Between Urban Clusters and Environmental Protection. Sustainability 2025, 17, 873. [Google Scholar] [CrossRef]
- Central People’s Government of the People’s Republic of China. Notice on Issuing the Circular “The Core Connotation of ‘Supply-Side Reform’ Is Deepening Reform to Liberate Productive Forces”. Available online: https://www.gov.cn/zhengce/2016-01/22/content_5035336.htm (accessed on 6 January 2025). (In Chinese)
- Xinhua News Agency. The Central Environmental Inspection Has Shown Great Power: Within Two Years from 2016 to 2017, It Achieved Full Coverage of all 31 Provinces in the Country. Available online: http://www.xinhuanet.com/politics/2017-11/07/c_1121916536.htm (accessed on 6 January 2025). (In Chinese).
- Zhao, H.F.; Li, S.Y. The Influence of Central Environmental Inspection on Overcapacity of Manufacturing Enterprises—Based on An Empirical Analysis of the Multiphase Difference-in-Differences Model. J. Beijing Inst. Technol. (Soc. Sci. Ed.) 2021, 23, 17–29. (In Chinese) [Google Scholar] [CrossRef]
- Naqvi, R.A.; Almohsen, B.; Sohail, A. Modeling the Environmental Kuznets Curve: A stochastic approach using economic and climate data. J. Environ. Manag. 2025, 373, 123108. [Google Scholar] [CrossRef] [PubMed]
- Li, J.B.; Huang, X.J.; Chuai, X.W.; Yang, H. The impact of land urbanization on carbon dioxide emissions in the Yangtze River Delta, China: A multiscale perspective. Cities 2021, 116, 103275. [Google Scholar] [CrossRef]
- Lu, Y.Y.; Fang, G.X.; Deng, M.J.; Fang, G.H.; Zhu, Z.; Sun, C.G.; Yang, Z. Ecological health assessment of riparian zone of Yangtze River based on trapezoid cloud model in Jiangsu Province, China. Ecol. Indic. 2024, 169, 112796. [Google Scholar] [CrossRef]
- Tavosi, M.; Vafakhah, M.; Sadeghi, S.H.; Shekohideh, H.; Moosavi, V. Comparative assessment of Watershed Hydrological Health (WHH) using multi-criteria decision-making approach based on PSR framework. J. Environ. Manag. 2025, 373, 123833. [Google Scholar] [CrossRef]
- Wan, Z.Y.; Zhao, C.Y.; Zhu, J.T.; Ma, X.F.; Chen, J.Z.; Wang, J.H. Assessment and prediction of coastal ecological resilience based on the Pressure–State–Response (PSR) Model. Land 2024, 13, 2130. [Google Scholar] [CrossRef]
- Liu, H.M.; Wang, L.; Wang, J.Z.; Ming, H.T.; Wu, X.K.; Xu, G.; Zhang, S.W. Multidimensional spatial inequality in China and its relationship with economic growth. Humanit. Soc. Sci. Commun. 2024, 11, 1415. [Google Scholar] [CrossRef]
- Peng, R.X.; Liu, T.; Cao, G.Z. Spatial pattern of urban economic resilience in eastern coastal China and industrial explanation. Geogr. Res. 2021, 40, 1732–1748. (In Chinese) [Google Scholar] [CrossRef]
- Ma, L. Green industrial transformation path of Chinese coastal areas based on coupling types of industrial development with environment. Geogr. Res. 2018, 37, 1587–1598. (In Chinese) [Google Scholar] [CrossRef]
- Zhang, R.G.; Qiu, Q.W.; Yan, Y.H. Industrial Development and Spillover Effects in Western Resource-based Regions: A Study Based on the Two Dimensions of Time and Space. Sci. Technol. Prog. Policy 2022, 39, 87–94. (In Chinese) [Google Scholar] [CrossRef]
- Guo, K.; Ji, Q.; Zhang, D.Y. A dataset to measure global climate physical risk. Data Brief 2024, 54, 110502. [Google Scholar] [CrossRef] [PubMed]
- Afrane, S. Prioritizing Waste-to-Energy Technologies in Ghana Using Multi-Criteria Decision Analysis. Master’s Thesis, Tianjin University, Tianjin, China, 2021. (In Chinese). [Google Scholar]
- Bernhard, W.; Harald, V. Evaluating sustainable forest management strategies with the Analytic Network Process in a Pressure-State-Response framework. J. Environ. Manag. 2008, 88, 1–10. [Google Scholar] [CrossRef]
- Robygd, J.; Harrie, L.; Martin, T. Spatial multi criteria analysis of ground conditions in early stages railway planning using analytical hierarchy process applied to viaduct-type rail in Southern Sweden. Eng. Geol. 2025, 348, 107962. [Google Scholar] [CrossRef]
- Guo, M.Q.; Pan, W.K.; Hu, C.P. Methods of model comparison in cognitive modeling. Adv. Psychol. Sci. 2024, 32, 1736–1756. (In Chinese) [Google Scholar] [CrossRef]
- Cafaro, P.; Hansson, P.; Götmark, F. Overpopulation is a major cause of biodiversity loss and smaller human populations are necessary to preserve what is left. Biol. Conserv. 2022, 272, 109646. [Google Scholar] [CrossRef]
- Elsen, P.R.; Monahan, W.B.; Merenlender, A.M. Topography and human pressure in mountain ranges alter expected species responses to climate change. Nat. Commun. 2020, 11, 1974. [Google Scholar] [CrossRef]
- Institute of World Economics and Politics Chinese Academy of Social Sciences. Will China Lose Its Status as the World’s Factory?—The New Trend of International Industrial Transfer and China’s Policy Choices. Available online: http://www.iwep.org.cn/xscg/xscg_sp/202406/t20240611_5758052.shtml (accessed on 6 January 2025). (In Chinese).
- Central People’s Government of the People’s Republic of China. Expert: Cooperation Between China and BIMP-EAGA Enjoys Broad Prospects. Available online: https://www.gov.cn/xinwen/2018-05/08/content_5289250.htm (accessed on 6 January 2025). (In Chinese)
- Central People’s Government of the People’s Republic of China. Report of the 18th National Congress of the Communist Party of China. Available online: https://www.gov.cn/ldhd/2012-11/17/content_2268826_5.htm (accessed on 6 January 2025). (In Chinese)
- Zhuang, X.D.; Fu, W.B. Does cutting overcapacity increase corporate risk-taking? Evidence from supply-side structural reform in China. Environ. Dev. Sustain. 2025, 1–31. [Google Scholar] [CrossRef]
- Yan, K.; Zhang, Z.Y.; Yang, L.S.; Cao, Y.Q.; Shan, Y.W. Capital generates green: Evidence from China’s national innovation system policy. Int. Rev. Financ. Anal. 2024, 91, 103033. [Google Scholar] [CrossRef]
- Central People’s Government of the People’s Republic of China. Notice on Issuing the Circular “Opinions of the State Council on Resolving Overcapacity and Achieving Distress Relief in the Steel Industry”. Available online: https://www.gov.cn/gongbao/content/2016/content_5045931.htm (accessed on 6 January 2025). (In Chinese)
- Central People’s Government of the People’s Republic of China. Notice on Issuing the Circular “Opinions of the State Council on Resolving Overcapacity and Achieving Distress Relief in the Coal Industry”. Available online: https://www.gov.cn/gongbao/content/2016/content_5045944.htm (accessed on 6 January 2025). (In Chinese)
- State Council of the People’s Republic of China. The Implementation of Supply-Side Structural Reform Through Reform Measures in Various Regions. Available online: https://baike.baidu.com/item/%E5%90%84%E5%9C%B0%E5%8C%BA%E4%BB%A5%E6%94%B9%E9%9D%A9%E4%B8%BE%E6%8E%AA%E8%90%BD%E5%AE%9E%E4%BE%9B%E7%BB%99%E4%BE%A7%E7%BB%93%E6%9E%84%E6%80%A7%E6%94%B9%E9%9D%A9%E6%83%85%E5%86%B5/19688425?fr=aladdin (accessed on 6 January 2025). (In Chinese).
- Xia, D.; Zhang, L. Coupling coordination degree between coal production reduction and CO2 emission reduction in coal industry. Energy 2022, 258, 124902. [Google Scholar] [CrossRef]
- Shi, S.X.; Li, H.; Tang, H.S.; Liu, Y. A study of the impact of de-capacity policies on industry capacity utilization paths: Evidence from the Chinese steel industry. PLoS ONE 2023, 18, e0295613. [Google Scholar] [CrossRef]
- China Steel Network. [Breaking News] Over 700 Steel Companies have been Shut Down! The Full List Is Exposed! Available online: https://www.sohu.com/a/168382734_141885 (accessed on 6 January 2025). (In Chinese).
- in-en.com. Focus|In 2016, a total of 1,688 Coal Mines Were Shut Down Nationwide (with List Attached). Available online: https://www.sohu.com/a/121659419_505851 (accessed on 6 January 2025). (In Chinese).
- Sohu.com. In 2017, These 1,000 Coal Mines Will Be Closed (with List Attached)! Available online: http://mt.sohu.com/business/d20170421/135538001_117460.shtml (accessed on 6 January 2025). (In Chinese).
- Central Government Portal Website, The Environmental Protection Law of the People’s Republic of China Came into Effect on January 1, 2015. Available online: https://www.gov.cn/xinwen/2014-04/25/content_2666328.htm (accessed on 6 January 2025). (In Chinese)
- Wang, J. Interpretation and Application of Public Participation in the Newly-Revised Environmental Protection Law. Environ. Prot. 2014, 42, 20–22. (In Chinese) [Google Scholar] [CrossRef]
- State Council of the People’s Republic of China. Notice on Issuing the Comprehensive Work Plan for Energy Conservation and Emission Reduction During the 13th Five-Year Plan Period. Available online: https://www.gov.cn/zhengce/zhengceku/2017-01/05/content_5156789.htm (accessed on 6 January 2025). (In Chinese)
- Liu, G.Y.; Huo, Z.M.; Wan, H.; Zucaro, A.; Fiorentino, G.; Lu, Y.Q.; Yang, Q. Evaluation of carbon sink and photovoltaic system carbon reduction along roadside space. J. Clean. Prod. 2024, 477, 143812. [Google Scholar] [CrossRef]
- Central People’s Government of the People’s Republic of China. The Central Environmental Protection Inspection Team Provides Feedback on the Inspection Results to Hebei Province. Available online: https://www.gov.cn/xinwen/2016-05/03/content_5070077.htm (accessed on 6 January 2025). (In Chinese)
- Central People’s Government of the People’s Republic of China. The First Batch of the Central Environmental Protection Inspection “Look-Back” Has Completed the Feedback Work on the Inspection. Available online: https://www.gov.cn/hudong/2018-10/25/content_5334239.htm (accessed on 6 January 2025). (In Chinese)
- Zhou, Y.; Feng, H.Y.; Chen, X.L. The deterrent effect of the Central Environmental Protection Inspection and the improvement of China’s environmental governance mechanism. Econ. Dyn. 2021, 8, 33–48. Available online: https://kns.cnki.net/kcms2/article/abstract?v=RN_8baVbY4cgeH5z5bD-ds5zewviPyfQ5OnU9u0LqS-lt6ziBHCMOqPiK-7uRxnxV-y4wfjZa-T6YkEYBZJE2Hw09AjcJblRfSMTRHhTZ94zmvi2nRQHa_dOe2gqwKXeY5KfGqGaq1qxmV5fVDHKkwtRmKu_nHp7tT9mjkm9jY4ip0nBTFfz6g==&uniplatform=NZKPT&language=CHS (accessed on 20 April 2025). (In Chinese).
- Wang, L.; Liu, X.F.; Xiong, Y. Central Environmental Protection Inspector and Air Pollution GovernanceAn Empirical Analysis Based on Micro-panel Data of Prefecture-level Cities. China Ind. Econ. 2019, 10, 5–22. Available online: https://kns.cnki.net/kcms2/article/abstract?v=cwBM1amFwwMqPeBOlBHA4LpcOk3qO8Rzjk8VkaopIcPWRoXnHcsiDH0z3Z8XuSvdSBiMvxtHJtCJzGVjGSoys3xpP53Rol4vZBdtpF6jZpNZO0d_r6wGCwSWeSXjhy7hMt10GjDu7VRlv_EoksGD_43BBKtBnDp_mSbzOEIUFwxCeLNvCZA4Xg==&uniplatform=NZKPT&language=CHS (accessed on 20 April 2025). (In Chinese).
- Zhou, M.J.; Hu, W.Q.; Yang, S.Y.; Zhu, X.; Zhao, C.C.; Bai, Z.Y. Spatial-temporal analysis of PM2.5-related health impact and economic losses in China from 2000 to 2017. J. Cent. China Norm. Univ. (Nat. Sci.) 2021, 55, 110–120. (In Chinese) [Google Scholar] [CrossRef]
- Wu, H.Y.; Ding, B.W.; Liu, L.; Zhou, L.; Meng, Y.; Zheng, X.J. Have agricultural land-use carbon emissions in China peaked? An analysis based on decoupling theory and spatial EKC Model. Land 2024, 13, 585. [Google Scholar] [CrossRef]
- Carson, R.T. The Environmental Kuznets Curve: Seeking empirical regularity and theoretical structure. Rev. Environ. Econ. Policy 2010, 4, 3–23. [Google Scholar] [CrossRef]
- Song, Z.H.; Zhu, N.; Yang, D.J.; He, D. Ecological security evaluation and prediction for coal resource cities based on the PSR Model: A case study of Xuzhou, China. Sustainability 2024, 16, 8461. [Google Scholar] [CrossRef]
- Li, J.H.; Pei, W.J.; Li, Y.H.; Liu, S.X.; Chen, Y.C.; Wang, B.; Chen, L.H.; Fan, K.; Zhang, J.S. Evaluating and diagnosing ecosystem health of the “three-lake” watershed in Yuxi, Yunnan, China from 2010 to 2020 by PSR-KDE. Environ. Res. 2024, 258, 119406. [Google Scholar] [CrossRef]
- Zhou, S.B.; Ye, J.Y.; Li, J.X.; Zhang, G.Q.; Duan, Y.Q. Identifying intrinsic drivers to changes in riparian ecosystem services by using PSR framework: A case study of the Grand Canal in Jiangsu, China. Environ. Dev. 2022, 43, 100728. [Google Scholar] [CrossRef]
- China National People’s Congress (NPC) Website. The Situation and Reflections on China’s Resource and Environmental Issues from a Global Perspective. Available online: http://www.npc.gov.cn/npc/c2/c189/c222/201905/t20190522_30268.html (accessed on 6 January 2025). (In Chinese)
- Central People’s Government of the People’s Republic of China. China’s Energy Policy. 2012. Available online: https://www.gov.cn/zhengce/2012-10/24/content_2615791.htm (accessed on 6 January 2025). (In Chinese)
- Evenset, A.; Hallanger, I.G.; Tessmann, M.; Warner, N.; Ruus, A.; Borgå, K.; Gabrielsen, G.W.; Christensen, G.; Renaud, P.E. Seasonal variation in accumulation of persistent organic pollutants in an arctic marine benthic food web. Sci. Total Environ. 2016, 542, 108–120. [Google Scholar] [CrossRef]
- Du, X.L.; Liu, F.; Jiang, R.Y.; Tian, D.X.; Zheng, Z.D.; Sheng, H.H. The accumulation process of pollutants in deposited particles of different sizes on different roads in Beijing, China. Environ. Geochem. Health 2024, 47, 19. [Google Scholar] [CrossRef] [PubMed]
- Oo, P.Z.; Prapaspongsa, T.; Strezov, V.; Huda, N.; Oshita, K.; Takaoka, M.; Ren, J.; Halog, A.; Gheewala, S.H. The role of global waste management and circular economy towards carbon neutrality. Sustain. Prod. Consum. 2024, 52, 498–510. [Google Scholar] [CrossRef]
- Dangi, M.B.; Malla, O.B.; Cohen, R.R.H.; Khatiwada, N.R.; Budhathoki, S. Life cycle assessment of municipal solid waste management in Kathmandu city, Nepal—An impact of an incomplete data set. Habitat Int. 2023, 139, 102895. [Google Scholar] [CrossRef]
- Marc, L. Plastic, Ahoy! Investigating the Great Pacific Garbage Patch. Science 2014, 346, 1175. [Google Scholar]
- Central People’s Government of the People’s Republic of China. Foreign Investment Law of the People’s Republic of China. Available online: https://www.gov.cn/xinwen/2019-03/20/content_5375360.htm (accessed on 6 January 2025). (In Chinese)
- Hong, J.J.; Chen, Y.; Yang, Z.H. Strategic Considerations for China’s Industrial Transfer: Characteristics, Motivations and Policy Outlook. Econ. Trade China 2024, 7, 11–21. Available online: https://kns.cnki.net/kcms2/article/abstract?v=RNPVX-4KY7gwwYYgbrZTIcBA3Eefc2seSwwIJfd7dUeq7HOrqoOQSlVf2JnQDjEdlimtqq2ryoxiaquJNMyPG-m9760eq1UVLbt4FMU9RrobJ5NqfHJBwtVVk4Gpr0vxagezhr5D8P-eNF314UkUaGzD2r7J4-UI6Uf7y7s9rOn6qBANeZYumg==&uniplatform=NZKPT&language=CHS (accessed on 21 April 2025). (In Chinese).
- Central Government Portal Website. Notice on the Fiscal Support Policies for the Promotion and Application of New Energy Vehicles from 2016 to 2020. Available online: https://www.gov.cn/xinwen/2015-04/29/content_2855040.htm (accessed on 6 January 2025). (In Chinese)
- Wang, S.; Wang, J.; Cheng, J.R. Does the promotion and application of new energy vehicles contribute to the reduction of carbon intensity? A quasi-natural experiment analysis. Sustain. Futures 2025, 9, 100455. [Google Scholar] [CrossRef]
- Ren, K.P.; Tang, X.; Huang, C.; Willerström, J.; Höök, M. Prospective metal requirements assessment of China’s wind-power and photovoltaics: Implications for emerging anthropogenic mines. Resour. Conserv. Recycl. 2025, 215, 108088. [Google Scholar] [CrossRef]
- Bissoondoyal-Bheenick, E.; Do, H.; Hu, X.L.; Zhong, A. Sentiment and stock market connectedness: Evidence from the U.S—China Trade War. Int. Rev. Financ. Anal. 2022, 80, 102031. [Google Scholar] [CrossRef]
- The Country Reports Website of the Ministry of Commerce of the People’s Republic of China. An Overview of U.S. Merchandise Trade and Sino-U.S. Bilateral Trade in 2018. Available online: https://countryreport.mofcom.gov.cn/record/view.asp?news_id=63499 (accessed on 6 January 2025). (In Chinese)
- Wang, C.; Liu, Y.; Chen, J.; Yu, C. Turning points of the relationship between human activity and environmental quality in China. Sustain. Cities Soc. 2025, 119, 106123. [Google Scholar] [CrossRef]
- Vieira, I.C.G.; Silva, J.M.C.d. Zero deforestation and degradation in the Brazilian Amazon. Trends Ecol. Evol. 2024, 39, 413–416. [Google Scholar] [CrossRef] [PubMed]
- Liu, W.; Chen, L.; Luo, F.J.; Zhao, Y.F.; Li, X.; Zeng, X.L. Novel assessment of china’s cobalt supply chain resilience based on DPSIR Model and machine learning. Resour. Conserv. Recycl. 2025, 215, 108107. [Google Scholar] [CrossRef]
- Dasgupta, S.; Laplante, B.; Wang, H.; Wheeler, D. Confronting the Environmental Kuznets Curve. J. Econ. Perspect. 2003, 16, 147–168. [Google Scholar] [CrossRef]


| Matrix Order | 1 | 2 | 3 | 4 | 5 | 6 | 7 | 8 | 9 |
| RI | 0 | 0 | 0.58 | 0.9 | 1.12 | 1.24 | 1.32 | 1.41 | 1.45 |
| “Ecological Pressure Index” | ||
|---|---|---|
| Indicators | Contribution (Positive/Negative) | |
| Resource consumption | National coal consumption (X1) | - |
| Impervious surface area of urban construction land (X2) | - | |
| Population size (X3) | - | |
| Total sown area of crops (X4) | - | |
| Pollution emissions | Comprehensive pollution degree of solid waste (X5) | - |
| The comprehensive pollution degree of waste gas (X6) | - | |
| The comprehensive pollution degree of wastewater (X7) | - | |
| Amount of pesticide and fertilizer application (X8) | - | |
| Climate change risks | CPRI (X9) | - |
| CO2 emissions (X10) | - | |
| Subsystems | Indicators | Unit | Contribution in the First Stage | Contribution in the Second Stage | |
|---|---|---|---|---|---|
| Pressure | Resource consumption | National coal consumption (X1) | 108 Tons | - | - |
| Impervious surface area of urban construction land (X2) | % | - | - | ||
| Population size (X3) | 108 People | - | - | ||
| Total sown area of crops (X4) | 103 Hectares | - | - | ||
| Pollution emissions | The comprehensive pollution degree of solid waste (X5) | - | - | - | |
| The comprehensive pollution degree of waste gas (X6) | - | - | - | ||
| The comprehensive pollution degree of wastewater (X7) | - | - | - | ||
| Amount of pesticide and fertilizer application (X8) | 104 Tons | - | - | ||
| Climate change risks | CPRI (X9) | - | - | - | |
| CO2 emissions (X10) | 104 Tons | - | - | ||
| Economic development | GDPP (X11) | Yuan | - | + | |
| State | Natural resources | Total amount of water resources (X12) | 108 m3 | + | + |
| National forest coverage rate (X13) | % | + | + | ||
| The area of forest land (X14) | % | + | + | ||
| The area of grassland (X15) | % | + | + | ||
| The area of water (X16) | % | + | + | ||
| The area of wetland (X17) | % | + | + | ||
| Environmental quality | The area of non-first-class marine water quality (X18) | km2 | - | - | |
| The comprehensive air pollution degree (X19) | - | - | - | ||
| Social economy | The farmland area affected by the disaster (X20) | 103 Hectares | - | - | |
| The Engel coefficient (X21) | - | - | - | ||
| Response | Natural resources | The area of nature reserves (X22) | 104 Hectares | + | + |
| The area of artificial afforestation (X23) | 104 Hectares | + | + | ||
| environmental governance | Number of wastewater and exhaust gas treatment equipment sets (X24) | Set | + | + | |
| Operating costs of wastewater and exhaust gas treatment equipment (X25) | 108 Yuan | + | + | ||
| Investment in environmental pollution control (X26) | 108 Yuan | + | + | ||
| Comprehensive utilization rate of industrial solid waste (X27) | % | + | + | ||
| Total area for drainage improvement and soil erosion control (X28) | 104 Hectares | + | + | ||
| Social economy | Investment in R&D (X29) | 1012 Yuan | + | + |
| Outcome | The Effect Size | 95%CI | p Value |
|---|---|---|---|
| Model 1: Fitting model by standard linear regression | 1.724 | (1.012~2.436) | 0.0001 |
| Model 2: Fitting model by two-piecewise linear regression | - | - | - |
| Inflection point | 0.411 | - | - |
| <0.411 | 4.648 | (3.523~5.773) | 0 |
| >0.411 | −0.713 | (−1.684~0.258) | 0.166 |
| p for likelihood ratio test | - | - | <0.001 |
Disclaimer/Publisher’s Note: The statements, opinions and data contained in all publications are solely those of the individual author(s) and contributor(s) and not of MDPI and/or the editor(s). MDPI and/or the editor(s) disclaim responsibility for any injury to people or property resulting from any ideas, methods, instructions or products referred to in the content. |
© 2025 by the authors. Licensee MDPI, Basel, Switzerland. This article is an open access article distributed under the terms and conditions of the Creative Commons Attribution (CC BY) license (https://creativecommons.org/licenses/by/4.0/).
Share and Cite
An, R.; Hu, X.; Sun, S. The Nonlinear Relationship Between Urbanization and Ecological Environment in China Under the PSR (Pressure-State-Response) Model: Inflection Point Identification and Policy Pathways. Sustainability 2025, 17, 4450. https://doi.org/10.3390/su17104450
An R, Hu X, Sun S. The Nonlinear Relationship Between Urbanization and Ecological Environment in China Under the PSR (Pressure-State-Response) Model: Inflection Point Identification and Policy Pathways. Sustainability. 2025; 17(10):4450. https://doi.org/10.3390/su17104450
Chicago/Turabian StyleAn, Ruofei, Xiaowu Hu, and Shucun Sun. 2025. "The Nonlinear Relationship Between Urbanization and Ecological Environment in China Under the PSR (Pressure-State-Response) Model: Inflection Point Identification and Policy Pathways" Sustainability 17, no. 10: 4450. https://doi.org/10.3390/su17104450
APA StyleAn, R., Hu, X., & Sun, S. (2025). The Nonlinear Relationship Between Urbanization and Ecological Environment in China Under the PSR (Pressure-State-Response) Model: Inflection Point Identification and Policy Pathways. Sustainability, 17(10), 4450. https://doi.org/10.3390/su17104450