1. Introduction
The building sector is one of the most significant contributors to global carbon emissions, accounting for approximately 40% of total emissions and representing a substantial threat to both the environment and human health [
1]. In light of global climate goals and increasing environmental concerns, improving the energy performance of buildings has become a priority. This includes reducing their energy consumption and enabling buildings to act as energy producers. Such strategies enhance energy self-sufficiency and resilience, contributing to the broader transition toward a low-carbon economy. However, energy-related improvements must be carefully balanced with indoor environmental quality (IEQ), as research shows that physical parameters such as visual comfort, air quality, lighting, and acoustics significantly influence occupant satisfaction and well being [
2].
Efforts to decarbonize the built environment align with several United Nations Sustainable Development Goals (SDGs), particularly Goal 7 (Affordable and Clean Energy), Goal 11 (Sustainable Cities and Communities), and Goal 13 (Climate Action) [
3]. Achieving these goals requires the integration of sustainable technologies and design strategies that reduce reliance on external energy sources while enhancing the quality of urban life.
Building overheating is a critical challenge that has emerged in recent years, worsened by climate change. In this context, external shading devices are essential for enhancing indoor quality and visual comfort while reducing the demand for air conditioning. Moreover, in densely built urban environments, these elements can serve a dual purpose by protecting against noise pollution, which is increasingly recognized as impacting human health and productivity.
In addition to their shading and acoustic benefits, light-blocking façade elements can be adapted to support energy generation technologies. For example, they can serve as mounting platforms for photovoltaic (PV) panels, contributing to the production of clean electricity. This has led to growing interest in building-integrated photovoltaics (BIPVs), which are often installed on façades in densely built-up cities with limited roof space.
However, this multifunctionality creates competition for façade space. As the demand for renewable energy solutions grows, BIPV or BIPV/T systems are often prioritized over other architectural components. This competition highlights the need for integrated design strategies that combine multiple functions, such as shading, acoustic protection, and electricity generation, into a single architectural element. Addressing this challenge is central to the development of innovative, sustainable building technologies and is the focus of this study.
Research Focus and Justification
In the presented article, the shading system of an office room located in Poland (51° N latitude) is optimized based on three essential factors: visual comfort, which relates to the quantity and quality of natural light entering the room; acoustic comfort, which refers to the indoor sound environment, including noise levels and reverberation time; and electricity generation, which concerns the amount and efficiency of power produced by the PV panels mounted on the shading fins. This study aims to develop and evaluate a multifunctional shading solution that simultaneously enhances indoor environmental quality and supports renewable energy generation in a Central European climatic context.
The optimization process utilizes a multi-objective optimization algorithm that accounts for the trade-offs and synergies among these factors to identify the optimal design and configuration of the shading system.
Applying a shading system made up of sloped horizontal fins results in acoustic wave reverberation, which is not present with an uncovered façade. Acoustic energy striking a building envelope travels into rooms (offices, workplaces) through windows, window frames, and mounting gaps. Additional reverberation amplifies this undesirable effect, increasing internal background noise in a workplace. The article offers a solution for reducing both reverberation and direct noise penetration into office interiors, backed by graphical and computational analysis.
Shading devices have become increasingly essential components of sustainable building design, particularly in temperate climates, where buildings must adapt to seasonal variations in solar exposure, temperature, and daylight availability. The multifunctionality of shading systems—facilitating enhanced visual comfort, glare control, and even acoustic mitigation—renders them central to current efforts to improve indoor environmental quality and reduce energy consumption.
Recent research underscores the impact of well-designed shading devices on thermal and visual comfort. For instance, Hou and Luo [
4] demonstrated through a parametric case study in a temperate continental climate (NC, USA) that optimized shading devices can significantly reduce solar gains while improving indoor radiant temperatures throughout the year. These findings support the potential of shading to deliver stable conditions without compromising daylight availability. Similarly, Evola, Gullo, and Marletta [
5] analyzed a range of shading solutions applied to an existing office building in Southern Italy and found that external shading effectively mitigated both overheating and glare while maintaining sufficient levels of natural light indoors.
Although it is commonly assumed that northern latitudes experience harsher climates with limited solar exposure, recent findings challenge this notion. For example, Czachura [
6], in a study conducted in Sweden—a country located further north than Poland—demonstrated that external shading devices remain fully justified, even in cold climates. The study introduced new indices to evaluate the combined daylight and energy performance of shaded buildings, and the results emphasized the dual benefits of shading systems in reducing glare and cooling demand, particularly in cold yet sunny environments. Likewise, Cellai et al. [
7] assessed shading configurations across various European locations—including Berlin, Milan, Florence, and Athens—measuring visual and acoustic impacts. Their study emphasized the necessity of climate-responsive and functionally adaptive shading systems to optimize comfort in diverse urban environments.
Despite these advancements, the simultaneous optimization of visual, energy, and acoustic comfort remains underexplored, particularly regarding façade-integrated shading systems in office buildings situated in temperate zones. This study addresses this gap by developing and testing a multifunctional shading system aimed at balancing these competing performance objectives. In doing so, it contributes to the growing body of research that promotes integrated, climate-sensitive design strategies within contemporary architecture.
2. State of the Art
The authors conducted a systematic literature review on daylight management, electricity production, and acoustic analysis. The data for the literature review were sourced from international scientific databases, including Web of Science (WoS) and Scopus, with the last search conducted on 15 January 2025. The authors examined the titles and abstracts of similar studies to identify candidate search terms (“keywords”). The search strategy for all databases included papers with the keywords “daylight”, “PV electricity production”, and “acoustic analysis”.
The scientific method outlined in the paper includes the simulation of shading elements, and references from these simulations are also included. The study selection process was multistage. Screening titles and abstracts enabled the identification of potential studies for inclusion. It became evident that “daylight” and “PV electricity production” have been subjects of numerous studies in building engineering over the past 20 years. The studies included in the state of the art are presented in their respective sub-chapters.
2.1. Sources on Daylight Analysis
Given the extensive body of research on daylighting issues, the analysis of daylighting literature has been limited to relatively recent studies focusing on horizontal shading elements such as fins, ribs, and louvers.
Sharma and Kaushik investigated the effectiveness of both vertical and horizontal louvers in enhancing visual comfort. Their study highlighted the importance of optimal louver configurations for daylighting and glare control [
8]. Mangkuto et al. focused on horizontal louvers in tropical climates to meet LEED v4.1 standards, emphasizing optimal slat configurations for energy efficiency and daylight metrics [
9]. Catto, Lucchino, and Goia explored horizontal louvers in double-skin façades, contributing to control strategies for optimizing louver performance in various architectural contexts [
10]. Double-skin façades consist of two layers of glazing separated by a ventilated air cavity, which improves insulation, enhances natural ventilation, and contributes to better acoustic and thermal performance. Shading devices can be installed within this cavity, protecting them from harmful external conditions. Hassooni and Kamoona studied a horizontal louver system in a hospital in Najaf, Iraq, demonstrating its effectiveness in reducing radiation exposure [
11]. Shen and Han evaluated two modular shading systems, a conventional horizontal louver and a deformable triangular element, for daylighting and glare control, showing the potential of modular strategies for kinetic façades [
12]. De Bem et al. presented a low-cost responsive louver system tested in a bioclimatic building chamber, highlighting its effectiveness in improving thermal and illuminance management [
13]. Kim and Han at Chonnam National University analyzed advanced horizontal louvers made of electrochromic modules, which adjust their transmittance to meet LEED v4.1 daylight criteria [
14]. Norouziasas et al. evaluated the ISO/DIS 52016-3 standard for adaptive façades, finding that fixed horizontal shading performed better than dynamic Venetian blinds controlled by the standard algorithm [
15]. In 2024, the co-author of the presented study published an article on vertical kinetic shading systems (KSSs), showing quantitative efficiency but falling short on qualitative metrics [
16].
Motion-based horizontal kinetic shading systems utilizing shape memory and bi-stable flexible materials have also received attention. Naeem et al. demonstrated the potential of shape-memory alloy (Nitinol) springs in horizontal louvers to enhance thermal comfort and reduce energy consumption [
17]. Vazquez and Duarte investigated bi-stable flexible materials actuated by a shape-memory alloy (SMA) for optimizing flap positions in bi-stable KSSs, providing innovative solutions for adaptive building envelopes [
18]. For a summary, see
Table 1.
2.2. Sources on BIPV
The idea of building-integrated photovoltaic/thermal (BIPV/T) systems emerged in the early 1990s. Nowadays, this concept is even more appealing due to its potential to support the design of net-zero energy buildings by utilizing solar energy for integrated electricity and hot water production. In modern urban environments, most buildings are high-rises with limited space for PV installation; therefore, the concept of façades with BIPV systems offers an appropriate alternative solution.
Chatzipanagi et al. presented the results of a demonstrative building-integrated photovoltaic (BIPV) installation in Lugano, where five BIPV modules were investigated under various integrations with existing systems in multiple variants of PV panel inclinations and technologies [
19]. Virtuani and Strepparava tested the usefulness of a model describing the daily performance ratio of amorphous (a-Si) and crystalline silicon (c-Si) PV panels for a BIPV installation located at Supsi [
20]. Ravyts et al. focused on the efficiency of BIPV systems, considering the conversion losses in the converters and cabling at the voltage level, depending on the solar cell technology [
21]. Li and Ma presented a method for estimating the performance of a real solar cell after colorization, emphasizing that the façade is a decorative element of the building. Their study demonstrates the design criteria and evaluation method for the practical implementation of PV panels with high visual perceptibility [
22].
Lefevre et al. presented a numerical approach to precompute static configurations of PV panels, considering shading obstacles, such as chimneys or tree shade, and identifying the characteristic positions that consistently yielded higher electricity production [
23]. Vulkan et al. conducted 3D modeling of the shadows cast by buildings. The algorithm proposed by the authors can model the shadows cast on vertical or horizontal surfaces, given a database of obstacles representing buildings in the form of extruded polygons and the sun’s position at any desired time interval. The methodology’s usefulness is demonstrated in a case study neighborhood in Rishon LeZion, Israel, with diverse building typologies [
24]. Klugmann-Radziemska and Rudnicka presented the experimental setup of a BIPV system located in Poland. The authors measured monthly irradiance and electricity generated by the PV installation, comparing them to data obtained from the PV-GIS system. The comprehensive analysis concluded that the partial soft shading from the nearby park decreased energy yield for the tested BIPV installation [
25].
In dense urban areas, the optimal configuration of a BIPV system may not be available, so Chen et al. demonstrated that a wide range of photovoltaic installation angles causes negligible annual energy losses [
26]. Barbón et al. also considered the energy losses caused by deviations from the tilt angle and the orientation of the PV installation concerning the optimal position [
27]. The authors showed that non-ideal tilt and azimuth angles can lead to acceptable levels of electricity production, proving that a photovoltaic system installed in a south orientation with deviations of up to 10° in relation to the optimum tilt angle has minimal influence on energy losses. Ramtin et al. presented a numerical approach to enhance the efficiency of the BIPV/T thermoelectric system. They investigated the impact of irradiance, wind speed, and inlet air temperature on electrical and thermal exergy efficiency. The studied system was optimized using a combined optimization method based on artificial intelligence and conventional optimization methods, allowing the results to be evaluated and applied in various geographical locations [
28], as shown in
Table 2.
2.3. Sources on Acoustic Attenuation
High technological development is accompanied by pollution from toxins, chemicals, and noise [
29]. A 2017 ranking by Mimi Hearing Technologies GmbH showed that cities like Barcelona and Paris are among the ten noisiest places in the world [
30]. The European Environmental Agency seeks all possible noise reduction means, including proper road finishing, quiet tires, electric cars, encouraging walking and cycling, and zoning peaceful areas, particularly green spaces [
31]. Therefore, even small contributions matter.
To positively impact the health of building users, scientists study façade design in detail, examining various aspects, particularly user comfort, as explored by Shum and Zhong [
32] and Vandenbogaerde et al. [
33]. The Böke team [
34] analyzed a range of fin-based shading systems, including one that closes when detecting noise pollution outside the building. The research groups led by Balasbaneh et al. [
35] and Li et al. [
36] focused on windows to prevent noise propagation inside buildings. Hence, façades that absorb sound perform better in urban noise reduction than those that reflect it. Kirmm et al. conducted various tests on façade-fixed blinds in multiple positions and created a series of 1:10 scale models to simulate noisy urban environments. Kirmm proved that “a structured surface can reduce environmental noise by around 3 dB, according to tests on models on a scale of 1:50 and 1:100” [
37,
38]. Busa et al. [
39] tested building balconies, overhangs, and other similar structures in combination with sound-absorbing cladding, yielding promising results, particularly for balcony ceilings. Zuccherini and the team [
40] conducted a promising experimental study on a four-story office test building. The researchers used small-scale shading louvers modified with a 7 mm thick polyurethane conglomerate as the absorbing material. Despite the fin areas having highly limited surfaces, the team achieved promising results. “This experimental investigation demonstrates the possibility of efficiently using sound absorbing shading devices to reduce average SPL [Sound Pressure Level—own explanation] over building façades” [
40]. Thus, we assume that investigating the acoustic absorbance of the shaded side of the panels is worthwhile [
40], as shown in
Table 3.
3. Paper Objectives
The presented study aims to evaluate the effectiveness of static sloped horizontal fins (i.e., horizontal shading elements angled upwards at 45° relative to the window) through a multi-criteria analysis of visual comfort, electricity production, and acoustic attenuation in a south-facing office room with an area of 72 m2. This study employs computer simulations for daylight and electricity production, along with graphical diagrams for sound attenuation. All calculations were conducted for a case study in Wroclaw, Poland (51° north latitude).
The effectiveness of the applied shading system was verified against the following criteria:
Visual comfort. Visual comfort was evaluated using the Useful Daylight Illuminance (UDI) metric, which is the most effective as it excludes “over-illumination” hours. This is crucial for a south-facing façade. The Daylight Glare Probability (DGP) for the analyzed scenarios was also calculated.
Electricity generation is the amount of electricity generated by PV panels covering the horizontal shading fins, which slope at a 45 ° angle.
Noise attenuation. In the sound propagation analysis, the authors examined a version of the horizontal fin lined with sound-absorbing material on its underside (bottom surface). The diagrams graphically verify the potential for sound reflection attenuation through horizontal shading fins.
According to the methodology presented below, the authors assumed that it is possible to determine the optimal number and position of horizontal shading fins to achieve the best outcomes in the abovementioned criteria.
4. Method
This study utilized a multistage simulation and graphical verification procedure to assess the effectiveness of static horizontal shading fins in a south-facing office room while also optimizing energy generation (PV) and noise attenuation.
Simulation and Verification Procedure
The simulation procedure was performed in three stages as follows:
In the first stage, four variants with differently positioned horizontal shading fins were evaluated from the visual comfort perspective using computer simulation—the Radiance version 5.4a engine for daylight simulations embedded in the software Ladybug Tools 1.6.1 for Rhino ver. 7/Grasshopper. The authors focused on defining the optimum number and width of horizontal fins sloped at a 45° angle. The primary metrics used to verify visual comfort were Useful Daylight Illuminance (UDI) and Daylight Glare Probability (DGP). The optimization procedure aimed to maximize the average UDI in the 300–3000 lux range for the largest possible room area.
In the second stage, after determining the optimal number and position of fins in the visual comfort study, the efficiency of the PV installation was calculated. The assumption was that if fixed fins provided adequate visual comfort, their upper surface could be covered by PV panels, an idea previously used by the authors in an earlier paper [
41].
In the third stage, after establishing the final geometry of the shading fins, the authors verified the acoustic attenuation potential of the façade geometry, assuming the underside (bottom surface) of the fin would be lined with different types of sound-absorbing material. This stage utilized a graphical ray tracing method of subsequent sound reflections to minimize second, third, and subsequent sound reflections.
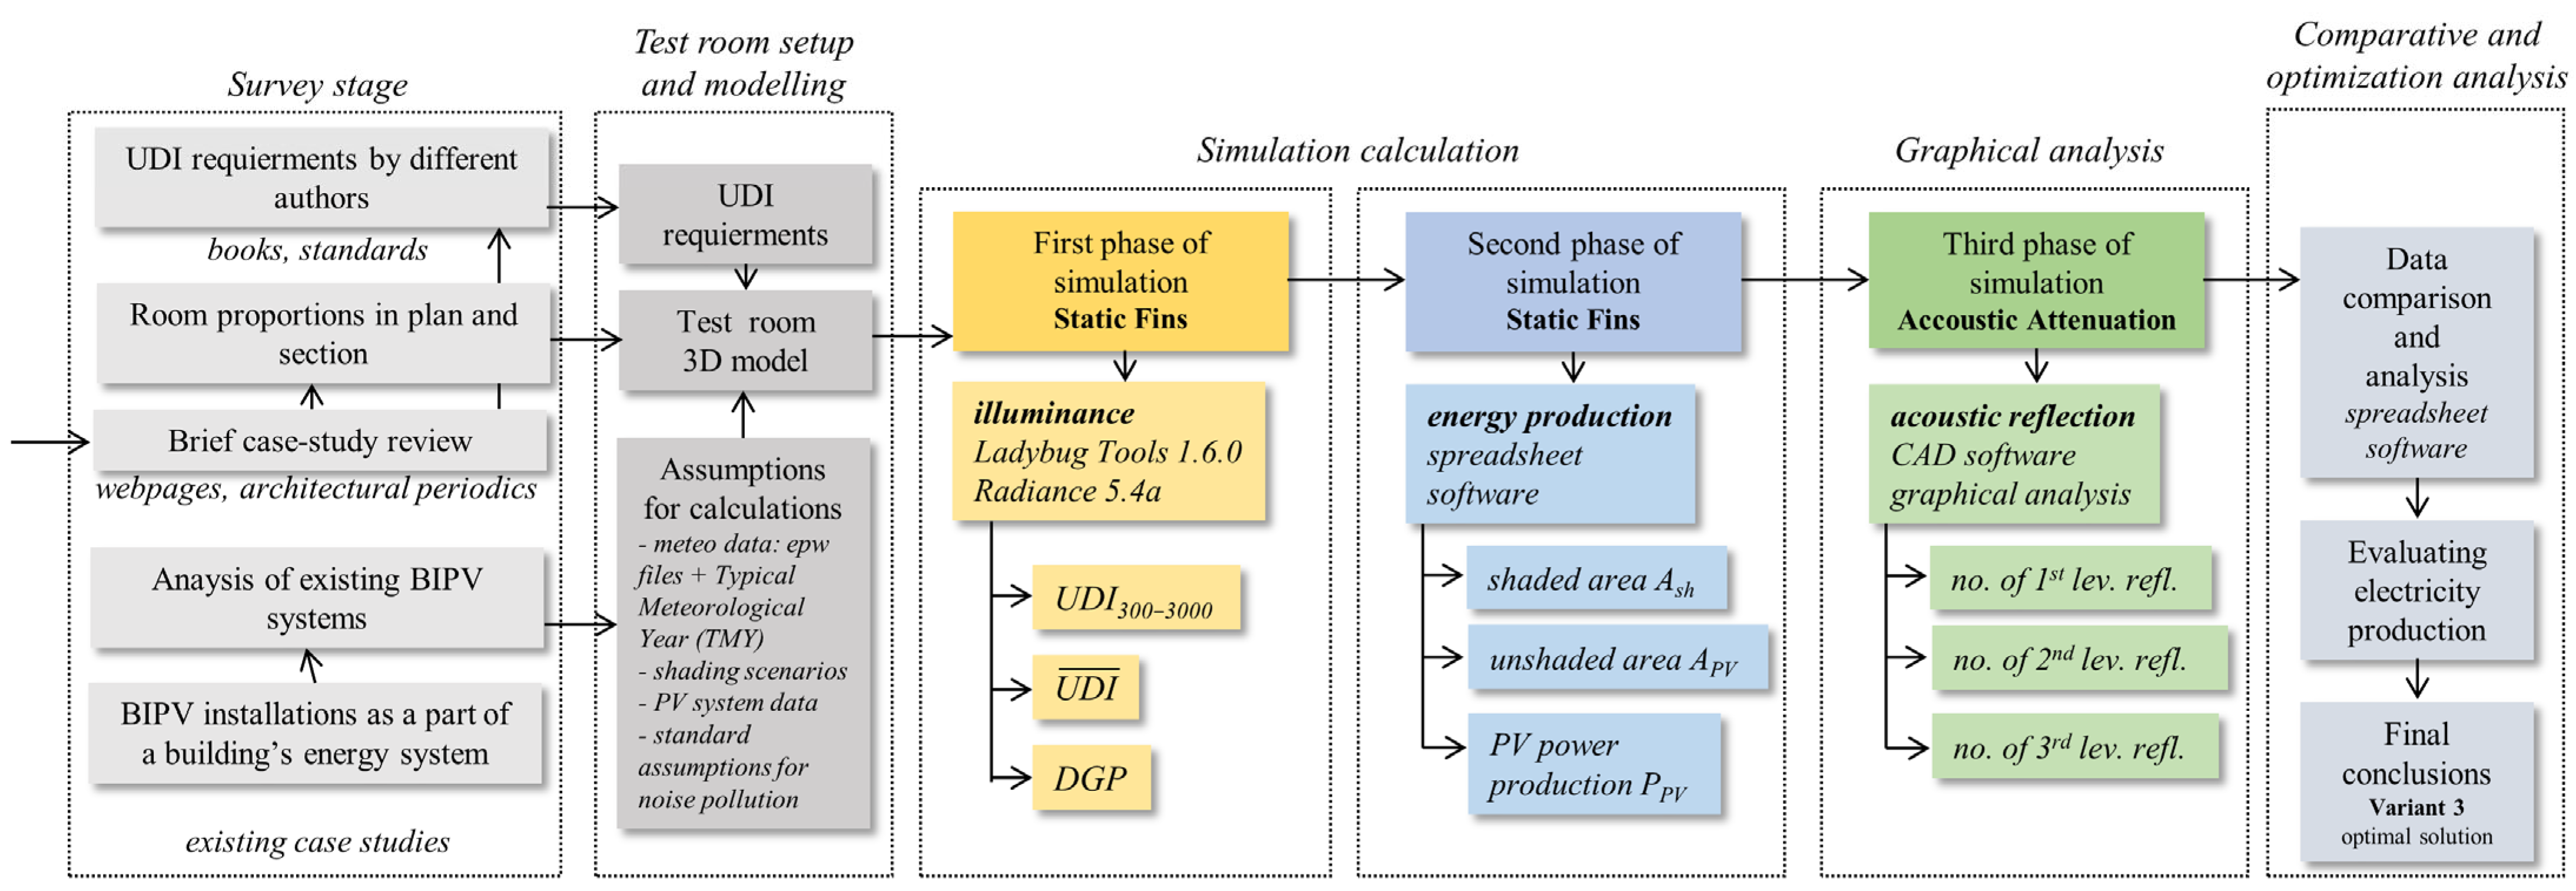
Figure 1 provides a schematic diagram illustrating the steps of the procedure clearly and concisely, offering a visual summary of the methodology applied in this study.
5. Innovative Character of the Paper
The paper includes several innovations in studying sloped horizontal fins in office environments. The key innovations include the following:
Multifunctional Shading Systems. These multifunctional systems address various aspects of building sustainability and urban living quality, representing a novel approach compared to traditional single-function shading systems.
Optimal Configuration of Fins. The research identifies and optimizes the configuration of sloped horizontal fins to achieve the best balance between visual comfort and energy production, minimizing self-shading effects.
Integration with Photovoltaic Panels. PV technology is integrated into the shading system, a forward-thinking innovation that aligns with the increasing demand for sustainable building solutions.
Acoustic Attenuation Through Shading Systems. The paper introduces the implementation of sound-absorbing materials on the underside of the fins to minimize noise propagation into the building and utilizes graphical acoustic ray tracing—a method seldom employed in the context of shading system analysis.
Comprehensive Simulation Approach. This study employs a rigorous simulation methodology, integrating daylight, energy production, and acoustic analysis.
While the individual components of the proposed system—such as photovoltaic panels, horizontal shading fins, and sound-absorbing materials—are not novel by themselves, the innovation presented in this study lies in their integrated application and performance-driven optimization. The research introduces a multifunctional system that simultaneously addresses visual comfort, energy generation, and acoustic attenuation within a unified design. This approach reflects a methodological and systemic innovation relevant to office buildings in temperate urban environments. Although the system has not yet been physically implemented, the design was developed and simulated in detail, using defined dimensions and boundary conditions, to ensure its feasibility for future real-world applications.
6. Room Configuration and Simulation Environment Parameters
6.1. Room and Fins’ Dimensional Parameters
The test room analyzed in this study is a 12 × 6 m office room (72 m
2 area, 6 m depth) with a height/clearance of 4.0 m. The test room features side glazing with full-height windows facing directly south. Due to the façade’s orientation, the authors decided to simulate anti-solar Pilkington Sun-cool™ OW 50/25 glass, which has a daylight transmittance of 0.52, as specified by Pilkington [
42]. The simulated rectangular fins of varying widths are positioned 0.6 m from the façade’s surface and are sloped at an angle of 45°. The 3D model of the office room was created using Rhino v7.
In daylight, a façade without shading (no fins, n = 0) served as the reference for all subsequent simulations. Next, three different combinations of fins were analyzed and gradually optimized to achieve the best results in terms of visual comfort. It should be noted that from the early stages of the research, it became evident that the shading fin should be positioned at an angle of approximately 45° relative to the glazing surface. This angle was selected based on the typical average solar altitude during the simulation period (June–July) in Wroclaw, Poland (51°N). Solar elevation at this latitude during peak working hours is approximately 42–45°, making this angle optimal for reducing glare and direct sunlight exposure while maximizing the usable surface for PV panels.
The daylight parameters were simulated for four variants of fins as follows:
No daylight management system;
Single 1 m wide horizontal fin at an angle of 45°;
Double 1 m wide horizontal fin at an angle of 45°;
Three 0.5 m wide fins at an angle of 45°.
In the context of acoustics, for the graphical analyses, the test building is assumed to be a three-story structure with a ground floor and two additional floors featuring fins distributed according to Variants 3 and 4.
6.2. Timeframe
The daylight simulation encompasses the longest sunlight days in Wroclaw, from June 9 to July 8, spanning 21 working days during office hours (9:00 A.M. to 5:00 P.M.) and totaling 168 working hours within this defined period. This timeframe features the longest days and the strongest sun irradiation, representing a potential worst-case scenario for the assumed location. The analysis period (21 days × 8 h) was chosen to average the weather data and minimize the influence of individual overcast days on the final results.
6.3. Geographical Location
All calculations were conducted for Wrocław, Poland (located in Central Europe at 51° North latitude). The Institute of Meteorology and Water Management—National Research Institute provided the most up-to-date weather data (in *.epw format compatible with EnergyPlus from the version 1.0) as well as the Typical Meteorological Year (TMY) dataset for Wrocław [
43].
6.4. Local Climate
Poland has a temperate climate with distinct seasonal variations, featuring cold winters and warm summers. These climatic conditions significantly affect both indoor thermal comfort and energy consumption in office buildings. During the winter months, maintaining thermal comfort demands substantial heating, while in summer, cooling systems may be necessary to ensure occupant well being, especially in buildings with south-facing glazed façades. Consequently, energy demand in Polish office buildings fluctuates considerably throughout the year, with increasing attention being paid to the summer season due to overall climate warming and the growing number of hours with direct solar radiation during summer months. This seasonal variability highlights the importance of designing energy-efficient buildings that sustain adequate indoor environmental quality under diverse weather conditions.
6.5. Assumptions for Daylight Simulation
The authors used Ladybug Tools 1.6.0 within the Rhino 7/Grasshopper environment, utilizing the Radiance ver. 5.4a engine for all daylight simulations.
Figure 2 shows the simulation setup, and
Table 4 shows the Radiance parameters of the room surfaces and shading fins.
The authors used two daylight metrics to evaluate visual comfort: (i) Useful Daylight Illuminance (UDI300–3000/168) and (ii) Daylight Glare Probability (DGP).
The
UDI300–3000/168 metric specifies the percentage of time (within a predefined time frame of 168 h) during which a given virtual sensor detects illuminance within the range of 300–3000 lux. In 2017, Boubekri and Lee published a paper titled “
A Comparison of Four Daylighting Metrics in Assessing the Daylighting Performance of Three Shading Systems” [
44], influencing the authors’ selection of this metric. Originally, UDI was proposed by Nabil and Mardaljevic in 2005 in the paper titled “
Useful Daylight Illuminance: A New Paradigm for Assessing Daylight in Buildings” [
45]. Although Nabil and Mardaljevic stated, “UDI represents the annual occurrence of daylight illuminances falling within the given range” [
45].
The authors used the UDI metric to verify visual comfort over the predefined period of 168 h. Additionally, commonly available software allows for calculating UDI using real, location-specific weather data, making this metric superior to others and bringing the simulation closer to real-world conditions.
It is also important to note that there is an ongoing scientific discourse about the minimum and maximum threshold levels that should be used in the UDI metric. Suk [
46] published a review of different glare discomfort thresholds, presented in tabular form below. This review convinced the authors that the thresholds of 300 and 3000 lux are optimal (see
Table 5).
The values of
UDI300–3000/168 were simulated based on the illuminance (
Eh) at the work plane, 0.85 m above floor level, using 288 virtual sensors (a grid of 24 × 12, approximately four sensors per m
2) over a 168 h simulated time frame. The results of the
UDI300–3000/168 simulations at the work plane level are presented as a statistical analysis of
UDI300–3000/168 values in the paper, while the spatial false-color distribution of
UDI300–3000/168 values is provided in the
Supplementary Materials.
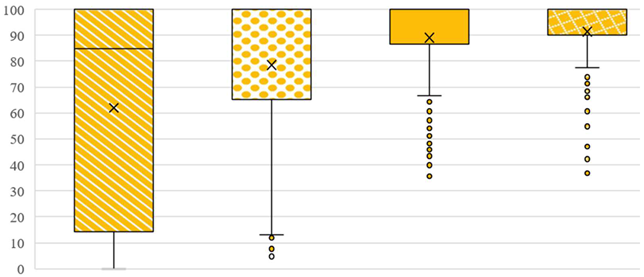
The statistical distribution of UDI300–3000/168 values for the four computed variants is presented as a box plot. Additionally, the following statistical measures are provided: (i) the average (), (ii) the median (), (iii) the standard deviation (σUDI), and (iv) the maximum value (UDImax). These values were calculated for the final UDI300–3000/168 distribution. Moreover, the uniformity of useful daylight illuminance (UUDI)was also calculated by dividing the minimal value of useful daylight illuminance (UDImin) by the average value of useful daylight illuminance (). The statistical analysis allows for easy comparison of the presented variants.
The other metric used in the evaluation of daylight comfort was Daylight Glare Probability (DGP), expressed as a percentage as in Formula (1), where
Ev is the vertical eye illuminance (lux);
Ls is the luminance of the source (cd/m
2); ω
s is the solid angle of the source; and
P is the position indexed by
i as follows:
Jan Wienold first defined this metric at the Fraunhofer Institute for Solar Energy Systems [
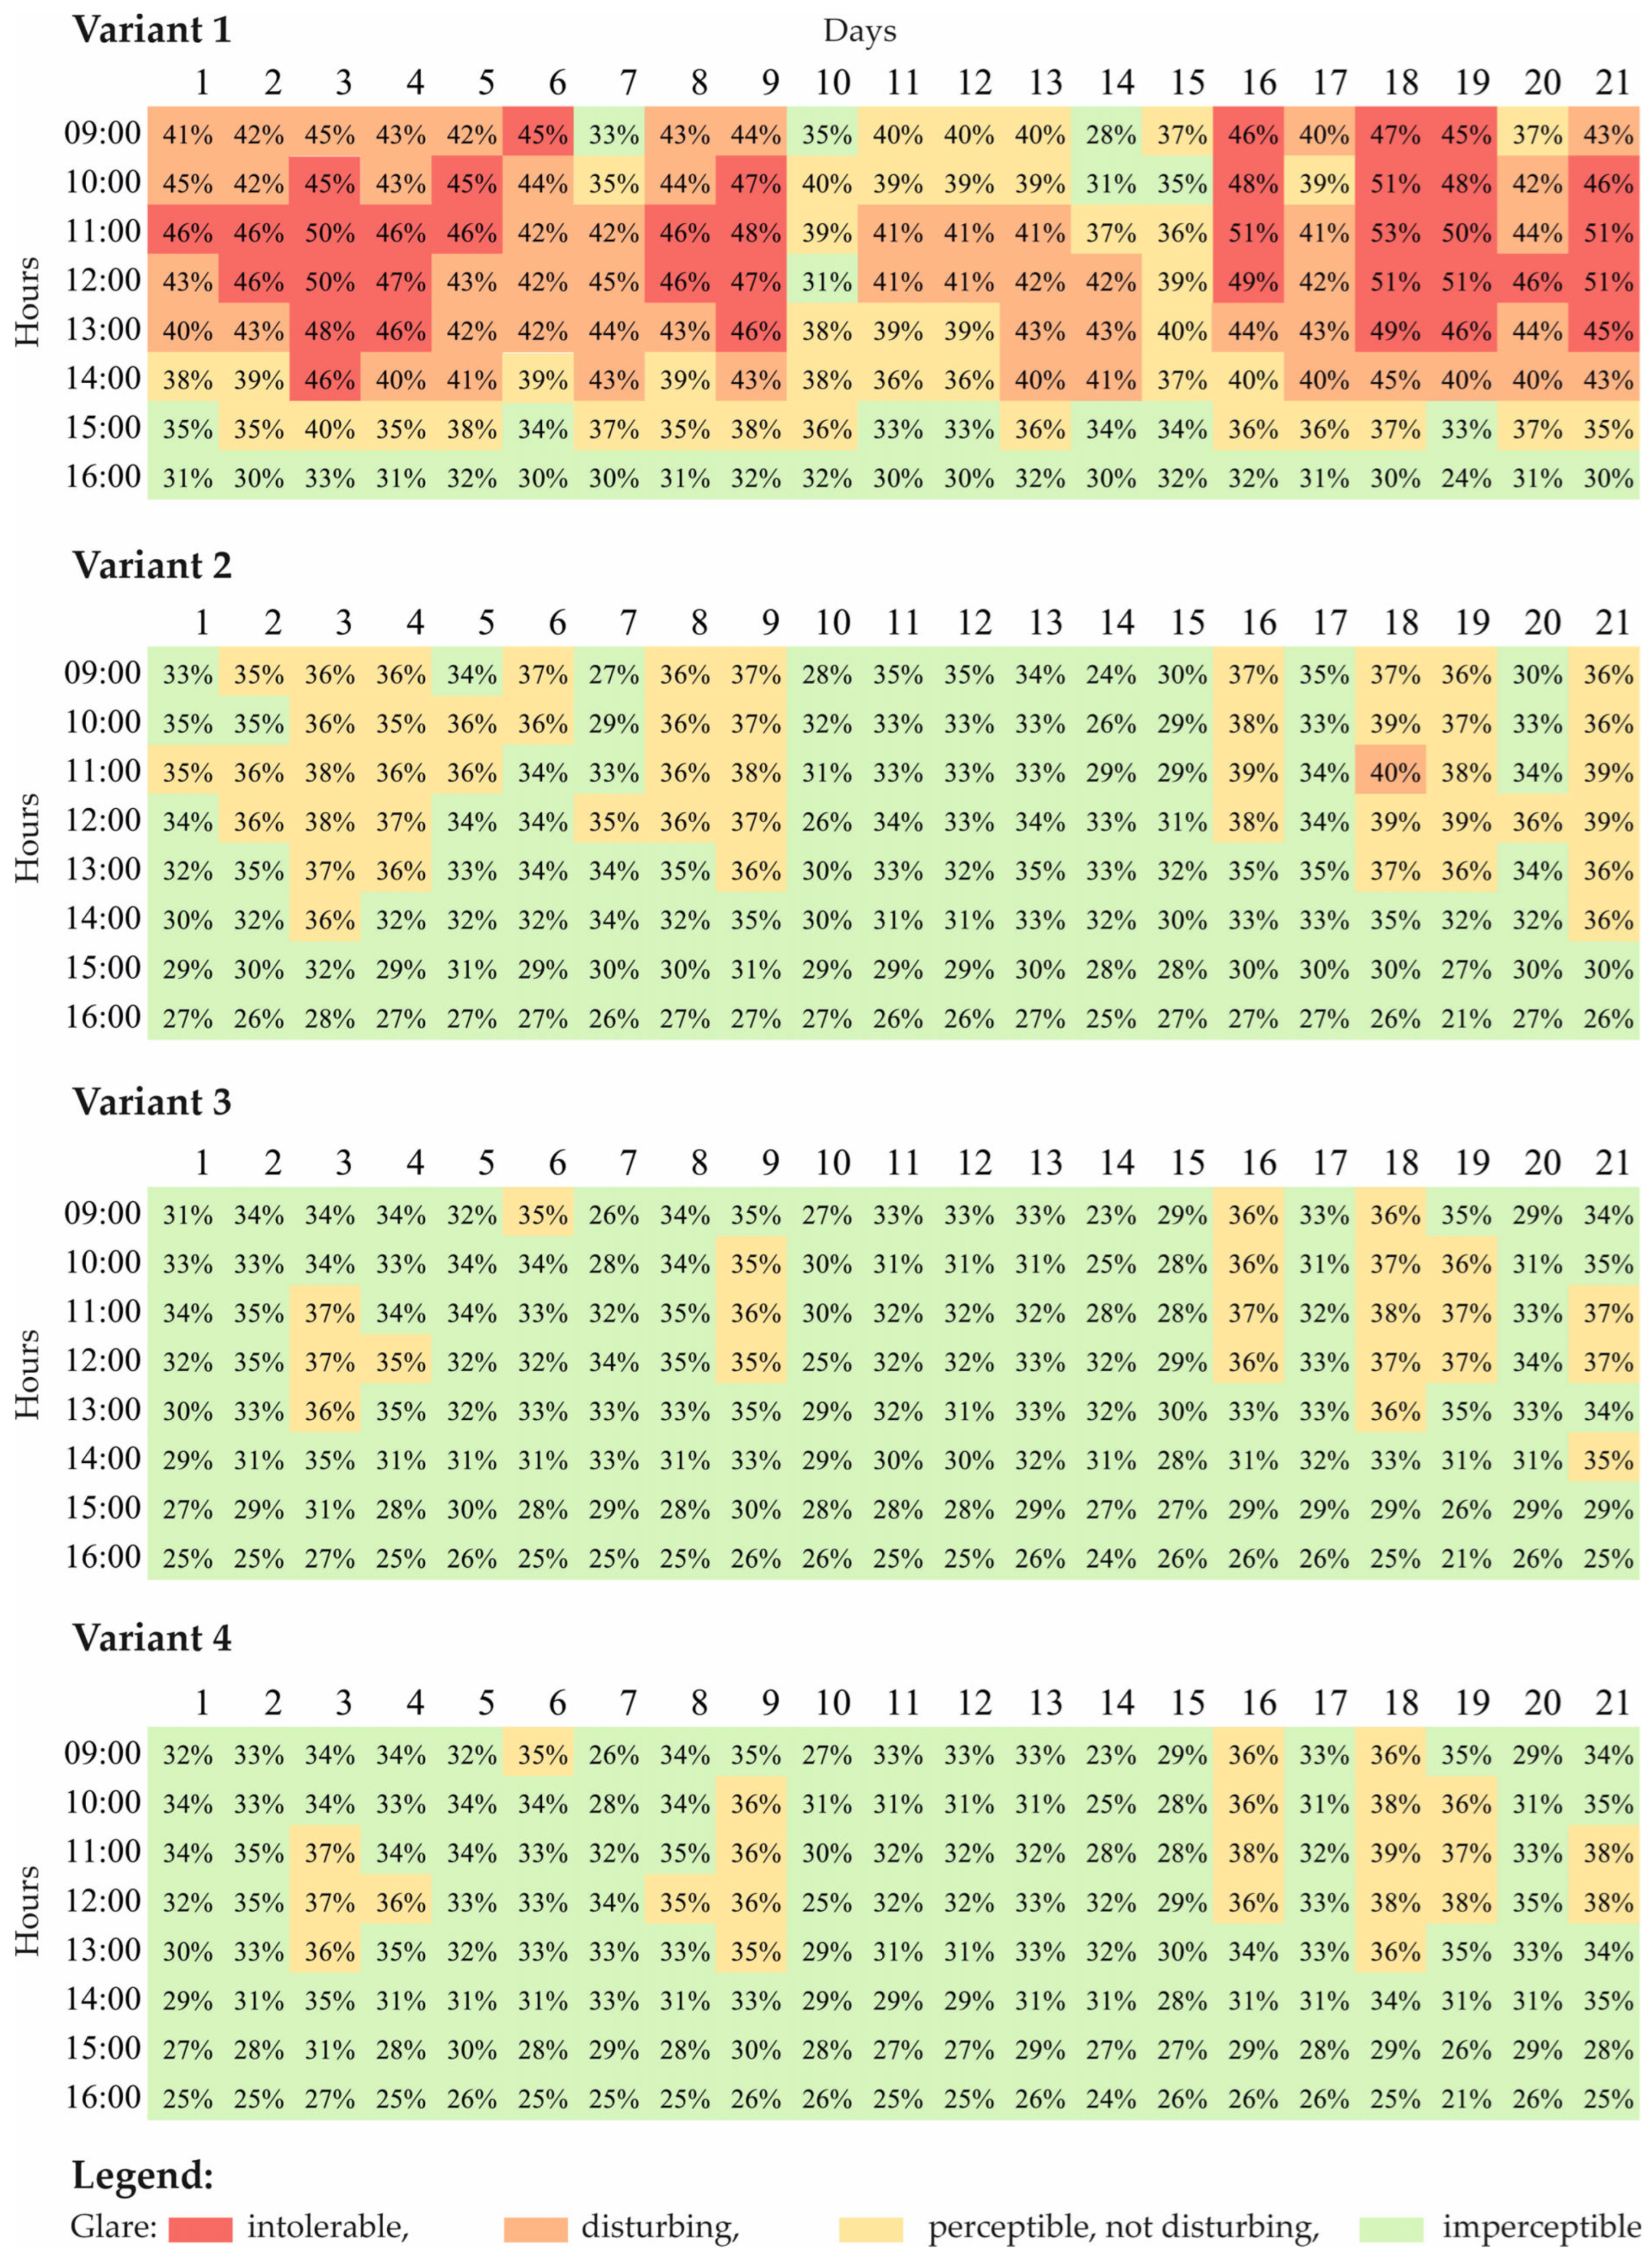
51]. Generally, a higher DGP number indicates a higher probability of glare. A DGP above 35% is rated as a “perceptible, non-disturbing” glare, while a DGP above 45% is considered an “intolerable” glare, as addressed by [
51].
In the presented article, the authors departed from displaying DGP (Daylight Glare Probability) image-based false-color diagrams for a specific hour and a day. Instead, utilizing the most recently added component within the Ladybug Tools 1.6.0 software (HB Imageless Annual Glare), the authors calculated the DGP value for each hour over a specified time range. This recipe uses the imageless glare method developed by N. Jones to estimate glare at each sensor that is “caused by direct views to the sun and sky” [
52]. DGP values can be computed much faster than the time needed to render images for each view under every sky condition, as is typically required by traditional image-based glare calculation methods. Also, for these 168 h, the authors specified the percentage of time during which the glare value fell within the above-defined categories (see
Table 6). Additionally, diagrams showing DGP values for each hour over the 21 days analyzed are provided in
Table 7 for further illustration.
6.6. Assumptions for Energy Simulation
In the presented case study, the authors analyzed the possibility of producing electricity using a PV installation consisting of monocrystalline panels [
53,
54]. This panel type is popular in domestic and industrial systems due to its relatively low price, high energy conversion factor, and low operating costs. The manufacturer’s product warranty is 12 years, with a power warranty of 90% and 80% of the nominal output power after 10 and 25 years, respectively. The equation describes the PV power production
PPV as follows:
The considered panel’s standard test conditions are
GSTC = 1000 W/m
2, cell temperature
TSTC = 25 °C, and AM1.5G. The cell temperature
TNOCT = 45 °C is measured under normal operating conditions:
GNOCT = 800 W/m
2, ambient temperature
Ta,NOCT = 20 °C, wind speed of 1 m/s, and AM1.5G. The following equation describes the current cell temperature
Tcell [
55]:
The cell temperature
Tcell changes with solar radiation
GI, so the calculations of electricity production were performed for 1 h time intervals, applying the meteorological data collected in the Typical Meteorological Year (TMY) database for Wroclaw City, Poland [
43]. The formula parameters are clearly defined in the “Nomenclature” table at the end of the article.
6.7. Assumptions for Acoustic Attenuation
The authors assumed that the back surface of the fins (turned towards the façade) can serve a sound-absorbing function. The authors investigated acoustic wave propagation from the source of the sound. Huygens’ principle suggests that when a wave propagating through air encounters a solid obstacle with a smooth surface (such as a fin), the material absorbs some of the wave’s energy. In contrast, the majority of the energy is reflected off the surface [
56,
57]. As the angle of incidence equals the angle of reflection [
58], the authors used a graphical method to determine the number of sound waves that reach the façade and the number that bounce off.
The authors assumed the height of the linear source in the cross-section to be 30 cm from the level of the asphalt street, which is the average height of the car engine in a standard vehicle (approximately 60 cm) and the height of the tire rubbing against the road surface (approximately 0 cm). The distance of the linear source from the edge of the building was also averaged, and they assumed 200 cm for the width of the sidewalk, 10 cm for the curb width, 50 cm for the road gauge, and 100 cm for the distance from the position of the car engine in a standard vehicle. Also, the absorbing material is theoretically “perfectly” acoustic energy absorbing.
7. Results
The results of this study present a comprehensive analysis of the data collected and include the key findings. The authors have organized this chapter into several sections, each detailing specific aspects of the investigation. By systematically presenting the results, the authors aim to provide a robust foundation for the subsequent discussion and interpretation, emphasizing the significance of the findings.
7.1. Daylight Simulation
The visual comfort simulation process consisted of four consecutive phases described above in
Section 6.1. First, the office room was simulated without any shading device (Variant 1). Second, a single 1 m wide fin at an angle of 45° and a height of 300 cm above the floor was introduced (Variant 2), providing evident improvement in both
UDI300–3000/168 and DGP values but still remaining unsatisfactory. Third, to further increase
UDI300–3000/168 and reduce DGP, an additional 1 m wide fin was introduced 100 cm above the floor (Variant 3). To verify the correctness of the previous outcome, a fourth variant (Variant 4) was simulated, featuring three 0.5 m wide fins at 100, 200, and 300 cm above the floor. This configuration slightly improved the metric values, providing visual comfort in almost all virtual sensors.
7.1.1. UDI
Variant 1. The simulation results for Variant 1, which lacks any daylight management system and glare protection, show relatively low UDI300–3000/168 values ( = 61.45%) and a very high probability of glare. There are 39 h of intolerable glare (DGP > 45%) and 53 h of disturbing glare within the 168 h test period. Near the façade, UDI300–3000/168 values are as low as 0%, indicating that this part of the work plane is over-illuminated for 100% of the working hours. Only the back of the room, 6 m away from the façade, which constitutes 37% of the room area, achieves visual comfort 100% of the time. The standard deviation is high, at 41.64, and the box plot shows a large spread, with outliers reaching 0% UDI.
Variant 2. Introducing a single 1 m wide horizontal fin at an angle of 45° significantly improved visual comfort. The mean increased by 27.32%, from 61.45% to 78.24%. DGP analysis shows zero hours of intolerable glare. UDI300–3000/168 values near the façade increased to 18%, while 56% of the room’s area (162 out of 288 sensors) achieved visual comfort 100% of the time.
Variant 3. Adding a second 1 m wide horizontal fin at a height of 100 cm above the floor further improved the results, particularly near the façade, where UDI300–3000/168 values reached 99%. The mean increased to 88.78%, the standard deviation dropped to 20.26, and 56% of the work plane was correctly illuminated for 100% of the time. All values of DGP for sensor “A” were in the “perceptible, not disturbing” and “imperceptible” range.
Variant 4. Variant 4 introduced three 0.5 m wide fins. This configuration slightly improved the mean
by 2.59%, from 88.78% to 91.08%, with the same DGP hourly distribution as Variant 3. Although the fins were more evenly distributed in height, their thinner profile blocked approximately the same amount of light in terms of visual comfort, as reflected by the
UDI300–3000/168 results. A slight improvement was observed in the correctly illuminated area, with 61% of the work plane being correctly daylit for 100% of the time compared to 56% in Variant 3 (see
Table 6).
The = 100% in Variants 2 to 4 indicates that at least 144 UDI300–3000/168 values equaled 100%. This demonstrates that all shading strategies were effective. Even though the remaining UDI300–3000/168 values fell between 0 and 100, their effect on the median is negligible, as most or half of the values are clustered at the upper bound (100%).
Also, the analysis of the first quartile reinforces the conclusions from the above. For Variant 1, the 25th percentile is 14.73, meaning 25% of the values are below this, suggesting many low daylight exposure instances. In contrast, for Variant 4, the 25th percentile is 90.33, indicating that even the lower quartile has a relatively high level of daylight exposure, reflecting much better conditions overall.
7.1.2. DGP
The calculations revealed that the most significant glare risk occurs in a room without any protection against solar radiation in Variant 1. In Variant 2, the conditions improve significantly, although one of the 168 h remains affected by disturbing glare. In Variants 3 and 4, the number of hours at risk of glare decreases to zero. Throughout the entire analyzed period, the
DGP values fall within the “perceptible, not disturbing” or “imperceptible” range. The exact distribution of glare values for point “A”, corresponding to sensor 131, is shown in
Figure 3.
Variants 2 through 4 were also compared using other criteria to define the optimal solution. In Variant 2, the fin area that could be covered with PV panels is 12 m2, while in Variant 3, the area is doubled to 24 m2. Although Variant 4 performs only 1.1% better in visual comfort, the area available for PV coverage is 25% smaller than in Variant 3 (18 m2 vs. 24 m2). Therefore, the authors confidently state that considering various criteria for evaluating the façade’s shading, the optimal Variant 3 provides visual comfort and maximizes the yield from electricity production.
7.2. Electricity Production
Selecting Variant 3 as the optimal solution for the case study, the authors considered fixed sloped horizontal fins that are always oriented towards the south and inclined at an angle of 45° to the façade’s surface. Each shading fin is constructed from six monocrystalline panels with standard geometrical dimensions (H/W/D) of 1960 × 991 × 40 mm. The maximum power of a single PV panel is
Pmax = 350 Wp. Thus, the total number of PV panels for two horizontal shading fins is
N = 12. The total electrical power of the considered BIPV system is 4.2 kWp. For the considered PV panels, the temperature coefficient of
Pmax is equal to γ = −0.38 %/°C, and the panel’s efficiency under STC is 18%. The inverter and wire efficiencies are η
inv = 0.97 and η
wire = 0.99, respectively [
54]. The details of the analyzed PV installation are presented in
Table 7.
Based on the Typical Meteorological Year (TMY) database for Wrocław, Poland [
43], electricity production calculations were conducted for 30 days (June 9–July 8) between 09:00 A.M. and 05:00 P.M. Meteorological data were monitored at one-hour intervals, so global irradiance (
GI) and ambient temperature (
Ta,DBT) were treated as fixed values during each interval. In this approach, the unit of solar irradiance (W/m
2) is identical to the unit of energy (Wh/m
2).
During these 30 days, the average global irradiance for 8 h was 2.92 kWh/m2, while the 24 h average was 4.25 kWh/m2. This indicates that the PV panels are exposed to almost 68.9% of the daily solar irradiance during office hours (09:00 A.M.–05:00 P.M.), justifying the calculation of electricity production solely for these hours. The total electricity generated by the 12 PV panels over 30 days was 369.38 kWh during the 8 h daily operation and 541.57 kWh when considering continuous 24 h performance over the same timeframe. The mean overall energy conversion efficiency was 17.6%, which aligns with the theoretical panel efficiency under standard test conditions (STCs) of 18%. The annual electricity production from the 12-panel PV installation is 4.67 MWh, a significant component of the BIPV system.
In the considered variant, the shading fins are oriented to the south and are fixed with a vertical distance of 2 m between them. The authors estimated the potential shading effect of the upper panel on the lower one, which could influence the electricity production of the lower PV panels. Calculations showed that the shading effect on the lower fin occurs only for a few days around the summer solstice (June 21st in Poland) and covers approximately 2% of the lower fin surface. On other days, the fins do not shade each other. This serves as an additional argument for choosing Variant 3 as the optimal solution in electricity production.
7.3. Acoustic Attenuation
The acoustic simulation assumes that the test room is located on the second floor of a three-story structure, facing a busy street that serves as a potential noise source. The test room features fins distributed according to Variants 3 and 4, as determined in
Section 6.1. The floor height is four meters, and the finished ceiling slab measures 40 cm. The following diagrams illustrate two theoretical cases as follows:
Case S1: The shaded side of the fin covers sound-reflective material for Variants 3 and 4, as described in
Section 6.1 (
Figure 4).
Case S2: The shaded side of the fin covers sound-absorbing material for Variants 3 and 4, as described in
Section 6.1 (
Figure 5).
The authors considered direct sound from a linear source, such as car traffic from a road in front of the building. Previously analyzed shading fins covered with PV panels and the glazed façade are considered “obstacles” in the acoustic analysis. The reflections from obstacles up to the third level (higher sound reflections are simplified to an n-level) were graphically analyzed in a street cross-section. For clarity, each ray represents the path and direction of the analyzed sound waves and is perpendicular to the wavefront. In both case S1 and case S2, 36 acoustic waves were graphically analyzed, radiating from a linear source, represented as a point in cross-section (LS1). Below, the authors present the results of the graphical acoustic analysis for direct and reflected waves from the façade with fins in Variants 3 and 4. The drawing demonstrates the assumptions described in
Section 6.7.
Since the acoustic energy hitting the façade tends to propagate into the rooms through windows, window frames, and all mounting gaps, its amount is crucial. Transparent building elements and their envelopes are always less isolating than solid structural walls, usually fitted with thermal insulation. If not present initially, air gaps appear over the years of building usage due to technical wear and tear. Therefore, the authors calculated the direct sound waves and their reflections from the fins hitting the façade for Variants 3 and 4, presented in the following juxtaposition, as shown in
Table 8.
The number of additional sound bounces from the fins was significant for both variants, totaling 38 and 31, respectively. In both Variants 3 and 4, in case S1, the inner background noise produced by road traffic would increase, resulting from the bounces off the surface of the fins. Reflections towards the sidewalk suggest that traffic noise would be magnified for pedestrians, which is also undesirable. Thus, the authors decided to analyze Variants 3 and 4 in case S2, where the back side of the fins is covered with “perfectly” sound-absorbing material, as shown in
Figure 5.
Though this study is theoretical, it is worth looking at it from a practical angle. Acoustic absorption of a particular material is typically measured as a surface area multiplied by an absorption coefficient, which varies depending on frequency. In the article, metric sabins express the sound absorption provided by a selected surface, where one metric sabin is the absorption from a 1 m
2 open window [
58]. Depending on density, each material has a different absorption coefficient [
59,
60]. The authors prepared a comparison, as shown in
Table 9, of several examples of surface sound absorbance for fins with a unit area of 1 m
2 in sabins. The juxtaposition shows the possibilities and range of changes in acoustic absorbance parameters depending on the type of materials used and the frequency, revealing the limitations of the practical performance (further discussed in the conclusions).
The comparison of the initial data for acoustic absorbance per 1 m2 in sabins of additionally covered fins with differentiated materials shows an increase in range from 96% up to 99%—depending on frequency and material.
The conclusions present possible benefits in absorbing the traffic noise and are worth further investigation. Case S2, with sound-absorbing material on the back side of fins in Variants 3 and 4, demonstrates a significant reduction in acoustic energy around the façade and eliminates unwanted phenomena, totaling 0 in both analyzed cases. Therefore, the authors conclude that fins equipped with absorbing material on the back side will help reduce the acoustic energy reaching the building surface from linear noise sources, such as roadways. To determine which variant allows the least energy to penetrate the office interior, the authors counted the number of acoustic waves reaching the façade directly. In the analyzed case S2, the authors found no bounces off the fins, resulting in a Σ
b = 0; see
Table 10.
The analysis (
Figure 4,
Table 8) shows that fins in Variant 3 protect more of the façade surface from noise exposure, as fewer direct acoustic waves hit the façade’s surface. It was also important to investigate the surface area of the absorbing material, which is directly dependent on the surface area of the back side of the fins. A fin length of 12 m per floor was calculated (
Table 11).
The analysis (
Figure 5,
Table 11) shows that Variant 3 provides more surface area for sound-absorbing material. Regarding the acoustics of workspaces, the conclusions from
Table 8 and
Table 10 indicate that Variant 3 is more suitable for further studies.
8. Discussion and Conclusions
This study investigated four configurations of sloped horizontal shading fins to determine the optimal solution for enhancing visual comfort, energy efficiency, and acoustic attenuation in an office space. Variant 3—comprising two horizontal fins, each 1 m wide and sloped at a 45° angle—was identified as the most effective option across all evaluated parameters.
8.1. Key Quantitative Findings
Daylight performance: Variant 3 achieved a nearly optimal UDI300–3000 of 88.78% (UDI300–3000 increased from 53.12% to 95.75%), with 0 h of disturbing glare (DGP from 50% to 27%), compared to 144 h in Variant 1.
Energy generation: Variant 3 enabled annual production of 4.67 MWh from 12 photovoltaic panels, representing a significant energy contribution for urban BIPV applications.
Acoustic performance: The extended fin surface effectively covered sound-absorbing materials, reducing façade noise exposure. While standard absorbers underperform in low frequencies (125–250 Hz), this study suggests supplementing with bass traps.
8.2. Design Guidelines
Fins should be sloped (preferably at 45°) to optimize daylight uniformity and glare reduction.
Fins should be placed at multiple vertical levels (e.g., 100 cm, 200 cm, 300 cm above floor level) to distribute daylight evenly and support both acoustic and solar integration.
Fin dimensions should allow dual functionality—a lower surface dedicated to acoustic absorption and an upper surface reserved for PV installation.
Spacing must be optimized to prevent self-shading and maintain high energy production.
The results of this study support a set of practical design guidelines for enhancing office environments in temperate climates. Sloped horizontal fins can significantly improve visual comfort by reducing glare and achieving uniform daylight distribution. Simultaneously, these shading elements can serve as platforms for photovoltaic panels, contributing to on-site energy generation, and when lined with sound-absorbing material on the shaded side, they can reduce façade-related noise propagation. Based on the simulations, designers are encouraged to integrate such multifunctional fins early in the building design. The geometry—including fin width, inclination angle, and spacing from the façade—should be carefully evaluated and optimized through simulation before installation to ensure the best performance across visual, acoustic, and energy criteria.
While not analyzed in this study, using commercially available PV panels and standard absorptive materials (e.g., fiberglass boards) suggests that implementation costs would be moderate relative to the energy savings and noise comfort benefits.
8.3. Replicability
These findings are particularly relevant for office buildings situated in temperate or mixed climates with comparable solar and acoustic exposure patterns. Utilizing local climate data in simulations ensures that the results can be applied to similar urban environments where façade optimization faces restrictions due to limited installation space and strict performance requirements.
8.4. Broader Implications
The proposed solution demonstrates a multifunctional approach to façade design, integrating daylight management, renewable energy production, and noise mitigation within a single architectural element. Variant 3 contributes meaningfully to developing sustainable, high-performance workspaces by improving occupant comfort while reducing energy dependency.
In summary, this study demonstrates that implementing Variant 3—consisting of two 1 m wide sloped horizontal fins positioned at a 45° angle—offers a highly effective, multifunctional solution for improving office building performance. This configuration significantly enhances visual comfort by increasing uniform daylight distribution and reducing glare, achieving a UDI300–3000/168 of 95.8% and lowering DGP to 27%. It also provides a generous surface area for photovoltaic integration, enabling the annual production of approximately 4.67 MWh of clean energy while minimizing self-shading losses through optimized spacing. From an acoustic perspective, Variant 3 maximizes façade coverage with absorbent surfaces, eliminating sound wave reflections and improving the interior sound environment. Altogether, these findings confirm that when carefully designed, sloped horizontal fins can simultaneously meet daylighting, energy, and noise control goals. The proposed shading system exemplifies a holistic, scalable strategy for sustainable office design in urban settings, enhancing occupant comfort and building efficiency.
An essential advantage of the proposed sloped horizontal fin system is its potential for retrofit applications. Since the fins are designed as external, independently supported elements, they can be mounted onto existing façades without requiring significant structural alterations. This makes the solution particularly attractive for upgrading older office buildings, which often suffer from poor daylight control, excessive glare, and a lack of renewable energy integration.
By enabling visual comfort improvements, acoustic attenuation, and on-site electricity generation in a single intervention, the system offers a practical pathway for enhancing the sustainability and performance of existing building stock, aligning with broader goals of urban regeneration and energy transition.
8.5. Limitations of This Study
This study has several limitations that should be considered. Firstly, the analysis relies heavily on computer simulations for daylight, energy production, and acoustic attenuation, which may not fully capture real-world complexities. The results are specific to Wroclaw, Poland, and may vary significantly in different geographic locations with distinct climatic conditions and solar angles. The acoustic analysis primarily addresses sound-absorbing materials on the back side of the fins, without extensive exploration of other potential noise sources and interactions with various building materials. The economic feasibility and return on investment for implementing the proposed solutions were not evaluated.
Moreover, this study focused on visual and acoustic comfort, neglecting other important aspects of occupant comfort, such as thermal comfort and indoor air quality. Lastly, the research used current technology and materials; future advancements could impact the findings and recommendations. Addressing these limitations in future research can offer a more comprehensive understanding and validation of the proposed solutions. These limitations suggest several avenues for future research, as outlined below.
8.6. Future Research
The key innovation of this study lies in the integrated optimization of sloped horizontal fins that serve multiple functions: improving visual comfort, attenuating urban noise, and generating electricity through building-integrated photovoltaics. While these aspects have been explored individually in prior research, this study combines them into a single, multifunctional shading solution tailored for office environments in temperate climates. Moreover, the use of graphical acoustic ray tracing in the context of external shading analysis represents a novel methodological contribution.
Building upon the innovative integration of daylight control, energy generation, and acoustic comfort presented in this study, future research should aim to further develop adaptive and intelligent shading systems that respond dynamically to both daily and seasonal changes in solar exposure. Such systems hold the potential to redefine façade performance standards, enabling real-time optimization for comfort and energy efficiency. Furthermore, in-depth investigations into long-term durability and material resilience, including weather resistance, acoustic integrity, and maintenance cycles, will be critical for sustainable performance. Lastly, assessing the economic viability and lifecycle value of these integrated solutions will provide essential data to support their scalability and adoption in contemporary architectural practice, especially within the context of smart and climate-resilient building design.
Author Contributions
Conceptualization, M.B. and P.R.; methodology, M.B., J.J. and P.R.; daylight simulation and data analysis, M.B.; PV simulation and data analysis, P.R. and D.B.; numerical calculation of mean value, P.R.; writing—original draft preparation, M.B. and P.R.; writing—review and editing, M.B. and P.R.; acoustic attenuation and analysis, J.J.; daylight visualization, M.B.; supervision, M.B. All authors have read and agreed to the published version of the manuscript.
Funding
This research received no external funding. The authors are employed at Wrocław University of Science and Technology, and their research work was supported as part of their regular academic duties under institutional employment.
Institutional Review Board Statement
Not applicable.
Informed Consent Statement
Not applicable.
Data Availability Statement
All relevant data supporting the findings of this study are included in the
Supplementary File, which is provided with this article.
Acknowledgments
The authors would like to express their gratitude to Wrocław University of Science and Technology for providing the institutional environment and resources that supported the completion of this research. We also thank all colleagues and technical staff whose insights and assistance contributed to this work.
Conflicts of Interest
The authors declare no conflicts of interest. The authors declare no competing interests relevant to this review.
Nomenclature
| Symbol | Unit | Description |
| UDI300–3000/168 | [%] | useful daylight illuminance in the range of 300–3000 lux in the specified period of 168 h |
| [%] | mean UDI for final distribution |
| σUDI | [-] | the standard deviation for final UDI distribution |
| [%] | median of UDI |
| Q1 | [-] | first quartile, the 25th percentile |
| UUDI | [-] | UDI uniformity for final distribution |
| DGP | [%] | daylight glare probability |
| Eh | [lux] | illuminance at the horizontal surface of the work plane |
| GI | [W/m2] | global irradiance |
| GNOCT | [W/m2] | global irradiance under normal operating conditions (NOCTs) |
| GSTC | [W/m2] | global irradiance in standard test conditions (STCs) |
| n | [-] | number of shading fins |
| N | [-] | the total number of PV panels |
| PPV | [W] | PV power production |
| Pmax | [W/panel] | rated maximum power |
| Ta,DBT | [°C] | ambient temperature of the dry-bulb thermometer |
| Ta,NOCT | [°C] | ambient temperature under normal operating cell temperature (NOCT) |
| Tcell | [°C] | current cell temperature |
| TNOCT | [°C] | normal operating cell temperature (NOCT) |
| TSTC | [°C] | cell temperature in standard test conditions (STCs) |
| γ | [%/°C] | temperature coefficient of Pmax |
| ηinv, ηwire | [-] | the efficiency of the inverter and wire, respectively |
References
- Thewes, S.; Maas, F.; Scholzen, D.; Waldmann, A.; Zürbes, A. Field study on the energy consumption of school buildings in Luxembourg. Energy Build. 2014, 68, 460–470. [Google Scholar] [CrossRef]
- Jin, Q.; Wallbaum, H.; Leiblein, T.; Hofmann, T.; Janser, M.; Windlinger, L. Assessments of indoor environmental quality on occupant satisfaction and physical parameters in office buildings. In Proceedings of the 14th International Conference on Indoor Air Quality and Climate, Ghent, Belgium, 3–8 July 2016; Volume 1, pp. 868–876. [Google Scholar]
- United Nations Department of Global Communications, Sustainable Development Goals. 2020. Available online: https://www.un.org/sustainabledevelopment/wp-content/uploads/2019/01/SDG_Guidelines_AUG_2019_Final.pdf (accessed on 16 September 2024).
- Hou, Q.; Luo, M. Passive design optimization of shading devices in temperate climate zone method and case studies. Appl. Comput. Eng. 2025, 136, 226–233. [Google Scholar] [CrossRef]
- Evola, G.; Gullo, F.; Marletta, L. The role of shading devices to improve thermal and visual comfort in existing glazed buildings. Energy Procedia 2017, 134, 346–355. [Google Scholar] [CrossRef]
- Czachura, A. Benefits of Passive Solar Shadings in Swedish Climate Scenarios: Integrated Daylight and Energy Study. Master’s Thesis, Faculty of Engineering, Lund University, Lund, Sweden, 2019. Available online: https://lup.lub.lu.se/luur/download?func=downloadFile&recordOId=8986629&fileOId=8986653 (accessed on 6 May 2025).
- Cellai, G.; Carletti, C.; Sciurpi, F.; Secchi, S. Transparent Building Envelope: Windows and Shading Devices Typologies for Energy Efficiency Refurbishments. In Windows and Shading Devices for Refurbishments; Springer: Cham, Switzerland, 2014; pp. 61–118. [Google Scholar] [CrossRef]
- Sharma, R.; Kaushik, A.S. Development and optimization of kinetic façade system for the improvement of visual comfort in an office building at Gurugram, India. In IOP Conference Series: Earth and Environmental Science; IOP Publishing: Bristol, UK, 2023; Volume 1210, p. 012012. [Google Scholar] [CrossRef]
- Mangkuto, R.A.; Koerniawan, M.D.; Apriliyanthi, S.R.; Lubis, I.H.; Atthaillah, H.; Hensen, J.L.M.; Paramita, B. Design optimization of fixed and adaptive shading devices on four façade orientations of a high-rise office building in the tropics. Buildings 2022, 12, 25. [Google Scholar] [CrossRef]
- Catto Lucchino, E.; Goia, F. Multi-domain model-based control of an adaptive façade based on a flexible double skin system. Energy Build. 2023, 285, 112881. [Google Scholar] [CrossRef]
- Hassooni, A.H.; Kamoona, G.M.I. Effects of kinetic façades on energy performance: A simulation in patient rooms of a hospital in Iraq. J. Int. Soc. Study Vernac. Settl. 2023, 10, 178–193. Available online: https://www.researchgate.net/publication/372825237_Effects_of_Kinetic_Facades_on_Energy_Performance_A_Simulation_in_Patient's_Rooms_of_a_Hospital_in_Iraq (accessed on 6 May 2025).
- Shen, L.; Han, Y. Optimizing the modular adaptive façade control strategy in open office space using integer programming and surrogate modeling. Energy Build. 2022, 254, 111546. [Google Scholar] [CrossRef]
- de Bem, G.; Krüger, E.; La Roche, P.; de Abreu, A.A.A.M.; Luu, L. Development of ReShadS, a climate-responsive shading system: Conception, design, fabrication, and small-scale testing. J. Build. Eng. 2024, 89, 109423. [Google Scholar] [CrossRef]
- Kim, J.H.; Han, S.H. Indoor daylight performances of optimized transmittances with electrochromic-applied kinetic louvers. Buildings 2022, 12, 263. [Google Scholar] [CrossRef]
- Norouziasas, A.; Tabadkani, A.; Rahif, R.; Amer, M.; van Dijk, D.; Lamy, H.; Attia, S. Implementation of ISO/DIS 52016-3 for adaptive façades: A case study of an office building. Build. Environ. 2023, 235, 110195. [Google Scholar] [CrossRef]
- Brzezicki, M. Daylight comfort performance of a vertical fin shading system: Annual simulation and experimental testing of a prototype. Buildings 2024, 14, 571. [Google Scholar] [CrossRef]
- Naeem, N.; Abdin, A.; Saleh, A. An approach to using shape memory alloys in kinetic façades to improve the thermal performance of office building spaces. Civ. Eng. Archit. 2024, 12, 326–349. [Google Scholar] [CrossRef]
- Vazquez, E.; Duarte, J.P. Bistable kinetic shades actuated with shape memory alloys: Prototype development and daylight performance evaluation. Smart Mater. Struct. 2022, 31, 034001. [Google Scholar] [CrossRef]
- Chatzipanagi, A.; Frontini, F.; Virtuani, A. BIPV-temp: A demonstrative building integrated photovoltaic installation. Appl. Energy 2016, 173, 1–12. [Google Scholar] [CrossRef]
- Virtuani, A.; Strepparava, D. Modelling the performance of amorphous and crystalline silicon in different typologies of building-integrated photovoltaic (BIPV) conditions. Sol. Energy 2017, 146, 113–118. [Google Scholar] [CrossRef]
- Ravyts, S.; Moschner, J.D.; Yordanov, G.H.; Van den Broeck, G.; Dalla Vecchia, M.; Manganiello, P.; Meuris, M.; Driesen, J. Impact of photovoltaic technology and feeder voltage level on the efficiency of façade building-integrated photovoltaic systems. Appl. Energy 2020, 269, 115039. [Google Scholar] [CrossRef]
- Li, Z.; Ma, T. Theoretic efficiency limit and design criteria of solar photovoltaics with high visual perceptibility. Appl. Energy 2022, 324, 119761. [Google Scholar] [CrossRef]
- Lefevre, B.; Peeters, S.; Poortmans, J.; Driesen, J. Predetermined static configurations of a partially shaded photovoltaic module. Prog. Photovolt. 2017, 25, 149–160. [Google Scholar] [CrossRef]
- Vulkan, A.; Kloog, I.; Dorman, M.; Erell, E. Modeling the potential for PV installation in residential buildings in dense urban areas. Energy Build. 2018, 169, 97–109. [Google Scholar] [CrossRef]
- Klugmann-Radziemska, E.; Rudnicka, M. Energy yield generated by a small building-integrated photovoltaic installation. Ecol. Chem. Eng. S 2020, 27, 335–346. [Google Scholar] [CrossRef]
- Chen, X.M.; Li, Y.; Zhao, B.Y.; Wang, R.Z. Are the optimum angles of photovoltaic systems so important? Renew. Sustain. Energy Rev. 2020, 124, 109791. [Google Scholar] [CrossRef]
- Barbón, A.; Bayón-Cueli, C.; Bayón, L.; Rodríguez-Suanzes, C. Analysis of the tilt and azimuth angles of photovoltaic systems in non-ideal positions for urban applications. Appl. Energy 2022, 305, 117802. [Google Scholar] [CrossRef]
- Ramtin, J.; Mohsen, D.; Mohammad, H.S.; Ali, S.; Müslüm, A.; Hoseyn, S. Artificial intelligence-based techno-economic-exergetic optimization of a thermoelectric enhanced building integrated photovoltaic thermal system. J. Build. Eng. 2024, 84, 108526. [Google Scholar] [CrossRef]
- Freire, S.; Gomes, N. Advancing environmental noise pollution analysis in urban areas by considering the variation of population exposure in space and time. Int. Arch. Photogramm. Remote Sens. Spat. Inf. Sci. 2013, XL-4/W1, 155–160. [Google Scholar] [CrossRef]
- Gray, A. These Are the Cities with the Worst Noise Pollution, World Economic Forum. 2017. Available online: https://www.weforum.org/agenda/2017/03/these-are-the-cities-with-the-worst-noise-pollution/ (accessed on 31 July 2024).
- European Environmental Agency (EEA). Noise Pollution Is a Major Problem, Both for Human Health and the Environment [Interview with E. Peris], EEA Newsletter 01. 2020. Available online: https://www.eea.europa.eu/articles/noise-pollution-is-a-major (accessed on 31 July 2024).
- Shum, C.; Zhong, L. Optimizing automated shading systems for enhanced energy performance in cold climate zones: Strategies, savings, and comfort. Energy Build. 2023, 300, 113638. [Google Scholar] [CrossRef]
- Vandenbogaerde, L.; Verbeke, S.; Audenaert, A. Optimizing building energy consumption in office buildings: A review of building automation and control systems and factors influencing energy savings. J. Build. Eng. 2023, 76, 107233. [Google Scholar] [CrossRef]
- Böke, J.; Knaack, U.; Hemmerling, M. Prototype of a cyber-physical façade system. J. Build. Eng. 2020, 31, 101397. [Google Scholar] [CrossRef]
- Balasbaneh, A.T.; Yeoh, D.; Abidin, A.R.Z. Life cycle sustainability assessment of window renovations in schools against noise pollution in tropical climates. J. Build. Eng. 2020, 32, 101784. [Google Scholar] [CrossRef]
- Li, X.; Tang, S.K.; Yim, S.Y.C.; Lee, R.Y.C.; Hung, T. Noise reduction of plenum windows on the façade of a high-rise residential building next to heavy road traffic. Build. Environ. 2020, 186, 107353. [Google Scholar] [CrossRef]
- Krimm, J.; Knaack, U.; Techen, H. Updated urban facade design for quieter outdoor spaces. J. Facade Des. Eng. 2017, 5, 63–75. [Google Scholar] [CrossRef]
- Designing Acoustically-Effective Façades. TUDelft. 2018. Available online: https://www.tudelft.nl/en/architecture-and-the-built-environment/research/research-stories/designing-acoustically-effective-facades (accessed on 6 May 2025).
- Busa, L.; Secchi, S.; Baldini, S. Effect of façade shape for the acoustic protection of buildings. Build. Acoust. 2010, 17, 317–338. [Google Scholar] [CrossRef]
- Zuccherini, M.N.; Fausti, P.; Santoni, A.; Secchi, S. The use of sound absorbing shading systems for the attenuation of noise on building façades. An experimental investigation. Buildings 2015, 5, 1346–1360. [Google Scholar] [CrossRef]
- Brzezicki, M.; Regucki, P.; Kasperski, J. Optimization of useful daylight illuminance for vertical shading fins covered by photovoltaic panels for a case study of an office room in the city of Wroclaw, Poland. Buildings 2021, 11, 637. [Google Scholar] [CrossRef]
- Pilkington, Glass Handbook. 2014. Available online: https://www.pilkington.com/-/media/pilkington/site-content/poland/trade/downloads/handbook_2014_eng.pdf (accessed on 15 July 2024).
- Ministry of Investment and Economic Development, Data for Energy Calculation of Buildings in Poland [Dataset, in Polish]. Available online: https://archiwum.miir.gov.pl/strony/zadania/budownictwo/charakterystyka-energetyczna-budynkow/dane-do-obliczen-energetycznych-budynkow-1/ (accessed on 26 July 2024).
- Boubekri, M.; Lee, J. A comparison of four daylighting metrics in assessing the daylighting performance of three shading systems. J. Green Build. 2017, 12, 39–53. [Google Scholar] [CrossRef]
- Nabil, A.; Mardaljevic, J. Useful daylight illuminance: A new paradigm for assessing daylight in buildings. Light. Res. Technol. 2005, 37, 41–59. [Google Scholar] [CrossRef]
- Suk, J.Y. Luminance and vertical eye illuminance thresholds for occupants’ visual comfort in daylit office environments. Build. Environ. 2019, 148, 107–115. [Google Scholar] [CrossRef]
- Sutter, Y.; Dumortier, D.; Fontoynont, M. The use of shading systems in vdu task offices: A pilot study. Energy Build. 2006, 38, 780–789. [Google Scholar] [CrossRef]
- Linney, A. Maximum Luminances and Luminance Ratios and Their Impact on Users’ Discomfort Glare Perception and Productivity in Daylight Offices. Master’s Thesis, Victoria University of Wellington, Wellington, New Zealand, 2008. [Google Scholar]
- Wymelenberg, K.V.D.; Inanici, M. Evaluating a new suite of luminance-based design metrics for predicting human visual comfort in offices with daylight. LEUKOS J. Illum. Eng. Soc. 2016, 12, 113–138. [Google Scholar] [CrossRef]
- Mardaljevic, J.; Andersen, M.; Roy, N.; Christoffersen, J. Daylighting metrics: Is there a relation between useful daylight illuminance and daylight glare probability? In Proceedings of the First Building Simulation and Optimization Conference, Loughborough, UK, 10–11 September 2012; Volume 2012, pp. 189–196. Available online: https://publications.ibpsa.org/conference/paper/?id=bso2012_3B1 (accessed on 8 May 2025).
- Wienold, J.; Christoffersen, J. Evaluation methods and development of a new glare prediction model for daylight environments with the use of CCD cameras. Energy Build. 2006, 38, 743–757. [Google Scholar] [CrossRef]
- Jones, N.L. The Imageless Method for Spatial and Annual Glare Analysis. Available online: https://github.com/nljones/Accelerad/wiki/The-Imageless-Method-for-Spatial-and-Annual-Glare-Analysis (accessed on 1 October 2024).
- Duffie, J.A.; Beckman, W.A. Design of photovoltaic systems. In Solar Engineering of Thermal Processes, 4th ed.; John Wiley & Sons, Inc.: Madison, NY, USA, 2013. [Google Scholar]
- Kalogirou, S.A. Photovoltaic systems. In Solar Energy Engineering: Processes and Systems, 2nd ed.; Elsevier Inc.: New York, NY, USA, 2014. [Google Scholar]
- Ameur, A.; Berrada, A.; Loudiyi, K.; Aggour, M. Forecast modeling and performance assessment of solar PV systems. J. Clean. Prod. 2020, 267, 122167. [Google Scholar] [CrossRef]
- Ling, S.J.; Sanny, J.; Moebs, W. (Senior Cont. Authors), University Physics Vol.3, Rice University, Houston. 2021. Available online: https://openstax.org/details/books/university-physics-volume-3/ (accessed on 8 May 2025).
- Everest, A.F.; Pohlmann, C.K. Master Handbook of Acoustics; McGraw-Hill Companies, Inc.: New York, NY, USA, 2014. [Google Scholar]
- ArAc-Multibook–Multimedia Textbook for Architectural Acoustics, International Partnership ArAc-Multibook. 2015. Available online: www.arac-multibook.com (accessed on 29 July 2024).
- Acoustic Supplies, Absorption Coefficients of Common Building Materials and Finishes. Available online: https://www.acoustic-supplies.com/absorption-coefficient-chart/2024 (accessed on 29 July 2024).
- PN-B-02151-4; Building Acoustics. Protection from Noise in Buildings. Part 4: Requirements for Reverberation Conditions and Speech Intelligibility in Rooms with Guidelines for Conducting Research [Selftranslation from Polish]. Polish Committee for Standardization (PKN): Warsaw, Poland, 2015.
| Disclaimer/Publisher’s Note: The statements, opinions and data contained in all publications are solely those of the individual author(s) and contributor(s) and not of MDPI and/or the editor(s). MDPI and/or the editor(s) disclaim responsibility for any injury to people or property resulting from any ideas, methods, instructions or products referred to in the content. |
© 2025 by the authors. Licensee MDPI, Basel, Switzerland. This article is an open access article distributed under the terms and conditions of the Creative Commons Attribution (CC BY) license (https://creativecommons.org/licenses/by/4.0/).


