Article

Modular Constructed Wetlands for Treatment of Rural Domestic Wastewater: Laboratory Performance and Field Application

1
School of Civil and Ocean Engineering, Jiangsu Ocean University, Lianyungang 222005, China
2
Institute of Oceanology, Chinese Academy of Sciences, Qingdao 266071, China
3
Centre for Climate Resilient and Low–Carbon Cities, School of Architecture and Urban Planning, Chongqing University, Chongqing 400045, China
*
Author to whom correspondence should be addressed.
Sustainability 2025, 17(10), 4427; https://doi.org/10.3390/su17104427
Submission received: 31 March 2025 / Revised: 1 May 2025 / Accepted: 6 May 2025 / Published: 13 May 2025

Abstract

:
As the discharge points of domestic sewage in rural areas are scattered with large fluctuations, constructed wetlands (CWs) are of great effectiveness in treating rural domestic wastewater. In this paper, horizontal subsurface flow modular constructed wetlands (HSSF-MCWs) with different filler combinations and plant species were constructed to analyze the pollutant removal effect on rural domestic wastewater. According to the fuzzy comprehensive evaluation method, the purification effect of the systems on rural domestic wastewater was evaluated for the selection of the best system. The decentralized rural domestic sewage treatment PPP project (Phase III) in Changshu was also monitored for field application. The results indicated that the red brick–volcanic rock (RB-VR) combination showed the best comprehensive removal effect on rural domestic wastewater, with the highest average removal rate of ammonia nitrogen (NH4+-N 81.0 ± 2.5%) and total nitrogen (TN 64.5 ± 3.4%). The fuzzy comprehensive index (FCI) of the RB-VR systems with four rural plants ranged from 2.60 to 3.74, in which Myriophyllum elatinoides Gaudich. showed the optimum long-term purification effect. The water quality and economic analysis results of the pilot project in Changshu indicated that the overall influent concentration was low with large fluctuations, and the qualified effluent rate was relatively low. Moreover, the equipment investment accounted for 51.24% of the overall construction investment of the project, so more economical equipment (1 m3/day and 20 m3/day) should be adopted in rural domestic wastewater treatment.

1. Introduction

Rural domestic wastewater treatment has been one of the major issues in China’s rural environmental governance [1]. In 2022, the rural domestic wastewater discharge amounted to 34.53 billion m3, and the rural domestic wastewater treatment rate was only about 31% by the end of 2022. Most of the untreated domestic wastewater was directly discharged into surface water bodies such as rivers and lakes, which polluted the environment and affected the life quality of residents [2,3]. The discharge points of domestic sewage in rural areas are scattered and regional emissions vary greatly [4]. Moreover, the types of pollutants are relatively stable, with the main components being total nitrogen (TN), total phosphorus (TP), ammonia nitrogen (NH4+-N), suspended solids (SS), and organic matter, etc. Therefore, selecting appropriate rural domestic wastewater treatment technology with stable effluent quality and a long-lasting wastewater treatment effect is directly related to the effective improvement of the rural water environment, which is of important practical significance [5,6].
Various countries have been committed to developing technologies to purify rural domestic wastewater [7,8,9]. The main treatment methods for rural domestic wastewater are biological treatment technologies, ecological treatment technologies, and combined treatment technologies, including anaerobic–anoxic–aerobic (ANA-A/O), membrane bioreactors (MBRs), soil infiltration, and constructed wetlands (CWs), etc. [10,11,12]. Although conventional biological treatment technologies are effective in treating effluents with low carbon/nitrogen (C/N) ratios, the lack of professional maintenance and regular monitoring in many rural areas has led to the underutilization of several wastewater treatment facilities [13]. Therefore, CWs are widely applied in treating rural domestic wastewater because of their low construction cost, simple maintenance, convenient management, and better nitrogen and phosphorus removal [12,14].
In practical application, modular constructed wetlands (MCWs) are a new technology that scales the CWs according to the corresponding proportion [15,16]. Compared with conventional CWs, MCWs possess a flexible modular framework, which allows the framework units to support efficient substrates and advanced enhancement treatment technologies, forming a comprehensive unified wastewater treatment facility [17]. The influencing factors of MCWs are mainly the wetland types, substrates, plant species, and microbial diversity [18,19]. However, the removal rate of nitrogen and phosphorus by traditional fillers (soil, sand, and gravel) in CWs remains low [20], which has led to further research on novel fillers or filler combinations, including shale ceramsite, activated carbon, fly ashes, lightweight fillers, and even construction waste [21,22]. Liu et al. [23] constructed a tidal flow constructed wetland (TFCW, SC-AA-TFCW) with a double-layer substrate of shale ceramsite (SC) and active alumina (AA) for decentralized domestic sewage treatment and found that SC-AA-TFCW removed 86% of NH4+-N and 79% of TN at a hydraulic load of 0.612 m3/m2·day, which was better than AA-TFCW (76%) or SC-TFCW (49%). Wei et al. [24] found that a novel lightweight filler (Al-NLS) composed of aluminum sludge and polyurethane had favorable removal efficiencies for COD (65.9–74.3%), TP (86.9–98.6%), NH4+-N (61.1–52.2%), and TN (35.4–45.6%) in domestic wastewater in CWs. De Carvalho Silva et al. [25] investigated the removal efficiency of three vertical-flow constructed wetlands (VFCW) vegetated with Eichhornia crassipes on red clay (CW-RC), autoclaved aerated concrete (CW-AC), and a composite from the chemical activation of autoclaved aerated concrete with white cement (CW-AAC) in nutrients and found that CW-RC showed a significant increase in COD removal from 65% to 91%. Liu et al. [26] selected four materials, namely biotite, gravel, quartz sand, and zeolite, as MCW fillers, and the results showed that the removal of NH4+-N, TP and COD in the simulated wastewater by this combination of fillers during the intermittent flow operation could reach 75.1–81.7%, 52.3–86.7%, and 89.8–94.9%, respectively. Kong et al. [27] investigated the effects of three types of gravel, lightweight ceramic pellets, and hickory shell biochar on nitrogen removal in modularized moving bed constructed wetlands (MMB-CWs), and the results showed that the MMB-CW system could remove up to 61.92 ± 12.63% of NH4+-N under the condition of a low carbon/nitrogen ratio. Xiang et al. [28] applied the MMB-CW technology to treat simulated tailwater from a wastewater treatment plant through a small-scale study and achieved significant results. The study showed that when the substrate filling rate reached 60%, the total nitrogen removal rate was increased by more than 15.9% compared with the control group, while the treatment cost was substantially reduced.
This study focused on the critical issue of rural domestic wastewater treatment, aiming to explore the pollutant removal effects of different filler combinations and plant species in horizontal subsurface flow modular constructed wetlands (HSSF-MCWs). Specifically, on the one hand, the fuzzy comprehensive evaluation method was used to quantify and assess the system’s purification performance, identifying the optimal system combination and providing scientific support for the optimized design of constructed wetlands. On the other hand, the study used the decentralized rural domestic wastewater treatment PPP project (Phase III) in Changshu as a pilot, conducting on-site monitoring and analysis to comprehensively evaluate the water quality and economic benefits of the project. This research aimed to provide practical design foundations and references for the widespread application of modular constructed wetlands in rural wastewater treatment, helping to address the environmental pollution caused by rural wastewater discharge and improving the quality of rural water environments.

2. Materials and Methods

2.1. Lab-Scale Modular Constructed Wetland Setup

In this experiment, horizontal subsurface flow modular constructed wetlands (HSSF-MCWs) were set up and consisted of six units with different filler combinations. The units of HSSF-MCWs were separated by plastic boards, and the dimensions of each unit were 40 cm × 30 cm × 30 cm, with a total volume of 36 L. After selecting the optimum filler combination, another system was constructed with four units planted with different wetland plants. Each unit was 60 cm × 30 cm × 30 cm in dimension. Both systems comprised a hydrolysis acidification zone, a substrate zone, and a catchment area. The structure of the HSSF-MCWs is shown in Figure 1.
The filling materials in the HSSF-MCWs were mainly selected from common rural wetland fillers and recycled materials (Figure 1). Red brick (1–3 cm), ceramsite (1–2 cm), volcanic rock (0.8–1 cm), and lightweight filler (polyethylene plastic filler, 2 cm) were chosen as the modular constructed wetland fillers in terms of practicability. The filler combinations were (A) red brick–ceramsite (RB-C), (B) red brick–lightweight filler (RB-LF), (C) red brick–volcanic rock (RB-VR), (D) ceramsite–lightweight filler (C-LF), (E) ceramsite–volcanic rock (C-VR), and (F) volcanic rock–lightweight filler (VR-LF). The total height of filling materials in the MCWs was 25 cm, with each group of filler combinations being 23 cm in height (each kind of filler was 11.5 cm in height), and they were covered with 2 cm of gravel to prevent the floating of lightweight fillers.
On the basis of the environmental adaptability, water purification effect, and economic feasibility of plants, four typical wetland aquatic plants were chosen for the HSSF-MCWs, including Ipomoea aquatica Forsk. (I. aquatica), Oenanthe javanica (Blume) DC. (O. javanica), Myriophyllum elatinoides Gaudich. (M. elatinoides), and Iris tectorum Maxim. (I. tectorum) [29,30]. The plants were planted at a density of 40 plants/m2 and harvested periodically according to their growth characteristics. The whole experiment operated from 16 May 2019 to 30 October 2019. The systems were started with seed sludge from the Jiangning sewage treatment plant (Nanjing, China) at the initial stage, and the MCWs were operated stably for 15 days.

2.2. Wastewater Composition

The synthetic wastewater was simulated by glucose (C6H12O6), potassium nitrate (KNO3), ammonium chloride (NH4Cl), potassium dihydrogen phosphate (KH2PO5), and trace elements (CaCl2, ZnSO4, FeSO4, MnSO4, CoCl2, and FeCl2). The main pollutant concentrations were as follows: COD, 60 mg/L; NO3N, 5 mg/L; NH4+-N, 10 mg/L; TP, 2 mg/L. The wastewater was continuously pumped into the MCWs by a peristaltic pump (BT100 M, CR Pump Co., Ltd., Baoding, Hebei, China) at a speed of 43.5 mL/min. The MCWs were operated at room temperature (18–23 °C), and the hydraulic retention time (HRT) was 48 h.

2.3. Sampling and Data Analysis

2.3.1. Water Sampling and Analysis

Normal water indexes including NH4+-N, NO3-N, TN, TP, and COD were analyzed throughout the experiment according to the standard analysis methods issued by the American Public Health Association (APHA). The water samples of each unit in the HSSF-MCWs were collected every 2 days for a month.

2.3.2. Data Analysis

The removal rates (R) of pollutants (NH4+-N, NO3-N, TN, TP, and COD) in the HSSF-MCWs were calculated by Equation (1)
R = C i n C o u t C i n × 100 %
where Cin denotes the influent concentration of each pollutant in the ith sample, and Cout denotes the effluent concentration of each pollutant in the ith sample.
The data were analyzed by Excel 2019 and plotted by Origin 2021. One-way ANOVA and the relative root mean square error (RRMSE) were calculated with SPSS 22.0, and each indicator in the treatment group was expressed as the mean of three replicates.

2.3.3. Water Quality Evaluation Method

The effluent water quality of the HSSF-MCWs in our research was evaluated by a fuzzy comprehensive evaluation method. This method transforms qualitative evaluation into quantitative evaluation according to the membership theory of fuzzy mathematics, which is suitable for solving various non-deterministic problems [31]. The calculation steps for water quality evaluation are as follows.
(1)
Fuzzy relation matrix
The set of evaluation factors U = {u1, u2,…, un} and the set of evaluation criteria V = {v1, v2,…, vm} are determined according to the limit values of pollutant elements and surface water quality standards. The degree of membership was calculated by Equation (2) to construct a fuzzy relation matrix R = (rij)mn
r i j = 1 x i Q ( j ) Q ( j + 1 ) x i Q ( j + 1 ) Q ( j ) Q ( j ) < x i 0 x i > Q ( j + 1 ) Q ( j + 1 )
where R denotes the fuzzy relationship between water quality pollutants and water quality evaluation criteria, rij is the degree of membership of the ith pollution factor to the jth criteria, xi is the measured value of the ith pollution factor, Q(j) is the jth standard of the ith pollution factor, and Q(j + 1) is the (j + 1)th standard of the ith pollution factor.
(2)
Weight coefficient
The weight coefficients of the pollution factors are used to evaluate the degree of influence of each pollution indicator on the environmental quality of the water body. In this experiment, the weights coefficients were determined by the exceedance multiplier method of the non-equal weights in Equation (3)
W i = C i / S i ¯ i = 1 n C i / S i ¯
S i ¯ = 1 m j = 1 m S i j
where Wi is the weight coefficient of the ith pollution factor, Ci is the measured value of the ith pollution factor, and S i ¯ is the arithmetic mean of the ith pollutant factor at each level of environmental quality standards.
(3)
Comprehensive evaluation model
The comprehensive evaluation model for water quality is D = W·R. The categories of water quality were assessed according to the principle of the maximum degree of membership.

3. Application Analysis of Engineering Cases

3.1. Project Description

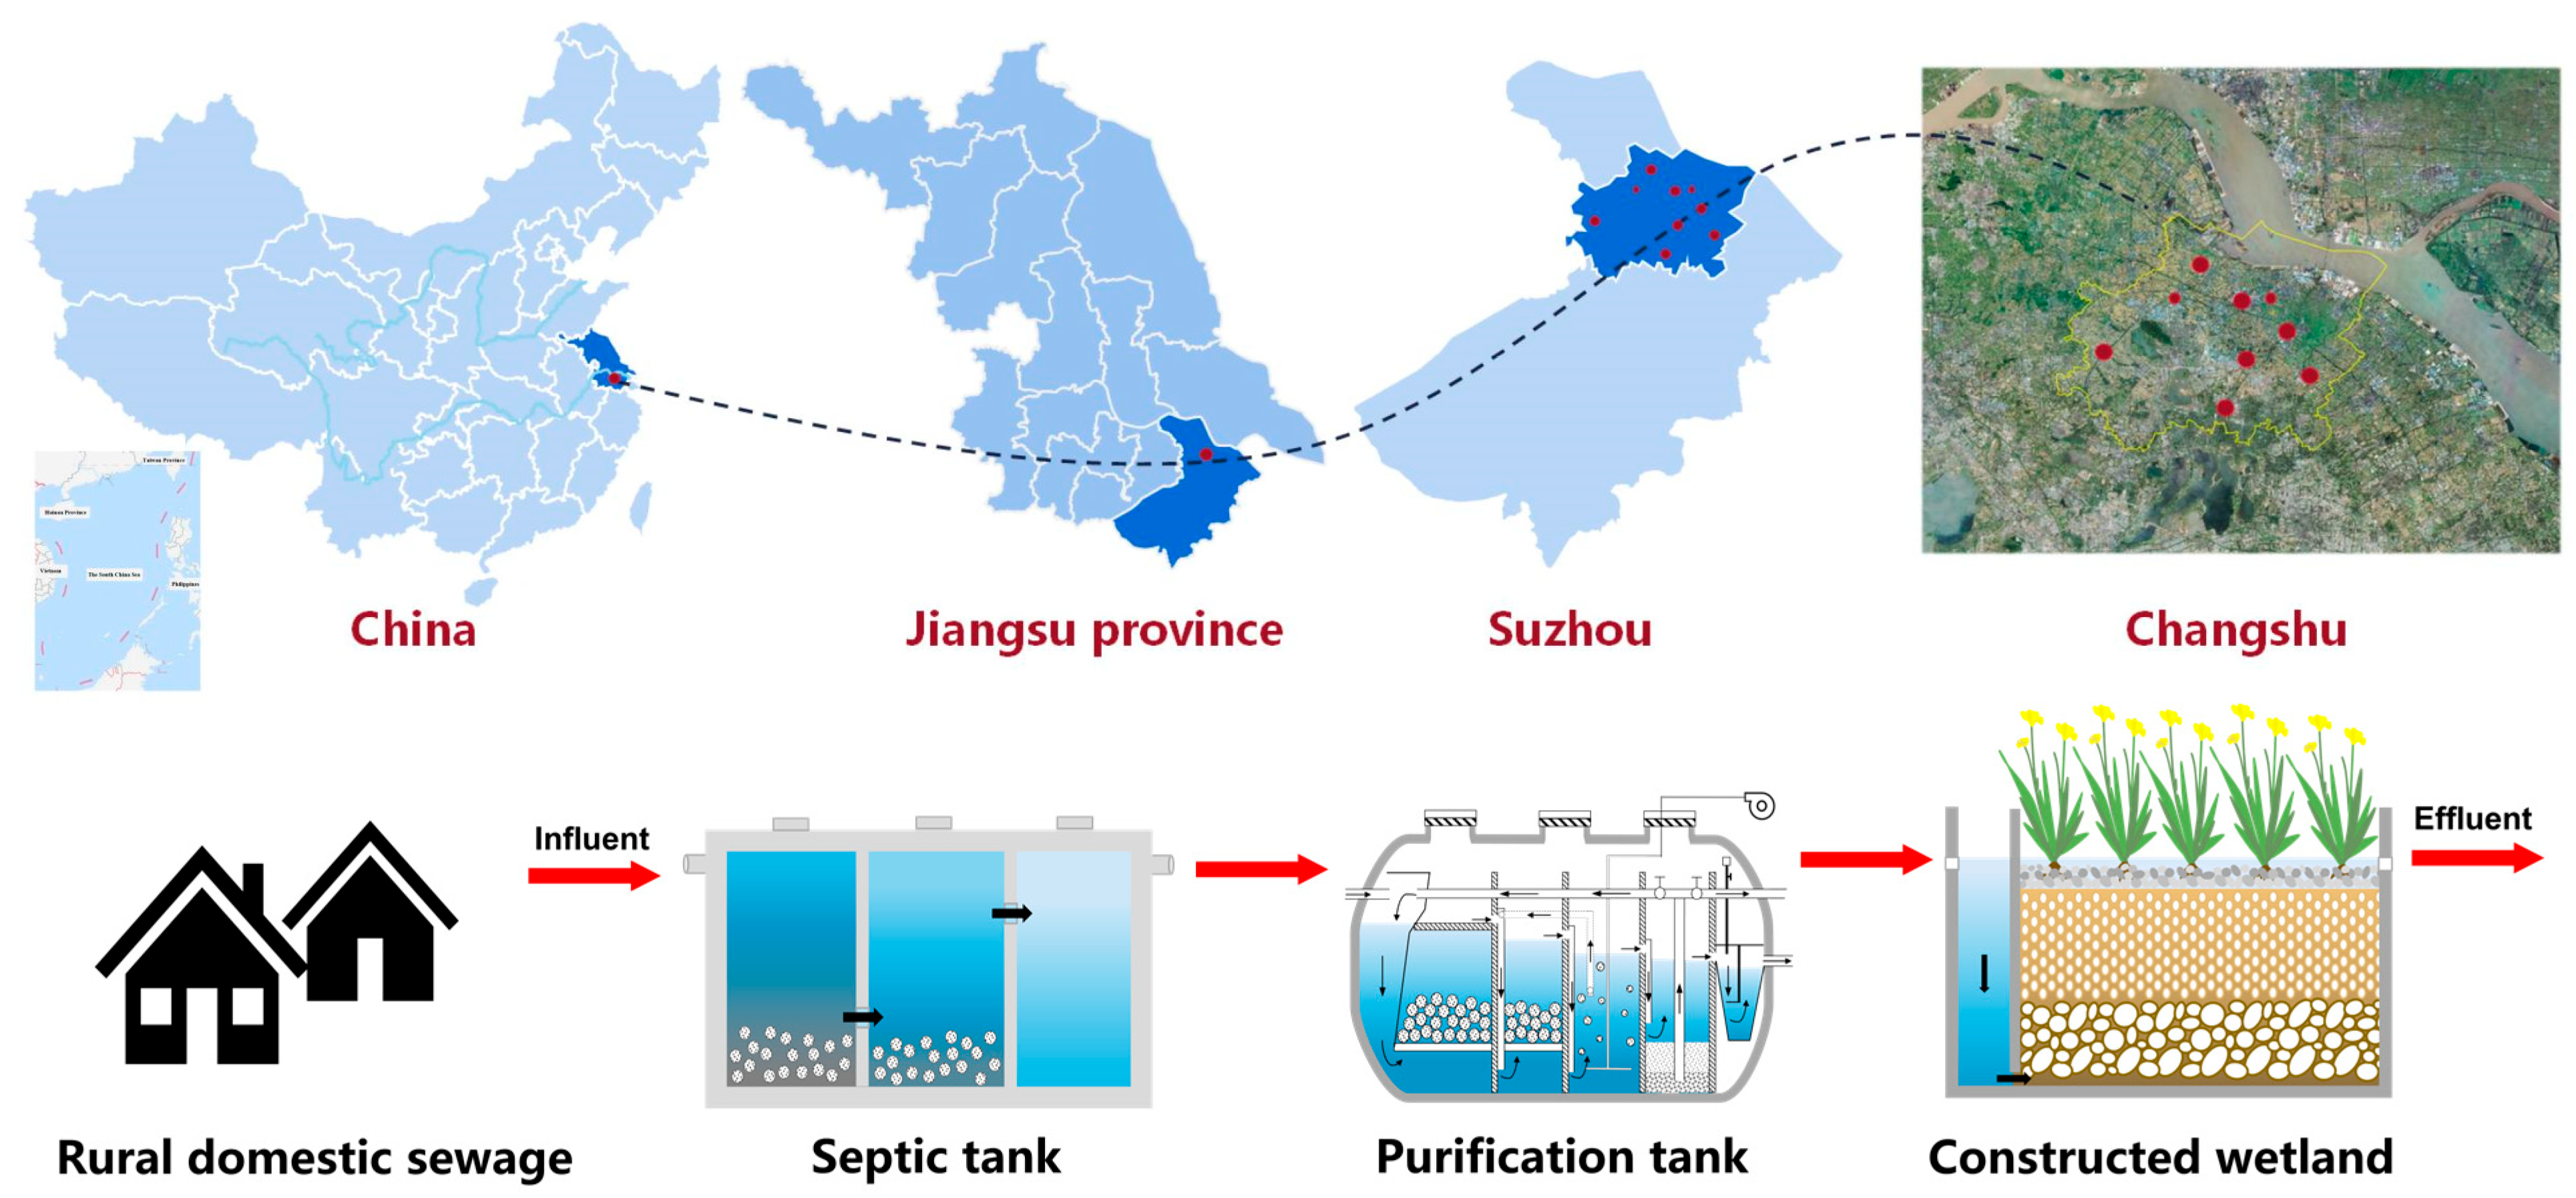
In this paper, the decentralized rural domestic sewage treatment PPP project (Phase III) in Changshu was selected as an engineering case for tracking research and analysis. The project is located in Changshu of Jiangsu Province, China, which possesses a flat terrain, convenient traffic, a developed water system, and an interlaced river network, with a total water area of 175 square kilometers (excluding the Yangtze River), accounting for 15.3% of the total area of the city. The location of the PPP project (Phase III) is shown in Figure 2. This project includes nine towns and districts of Changshu, involving sewage collection and treatment in 153 natural villages, with a sewage collection capacity of 2541.6 t/day and a total number of 6291 households benefiting from the project.
The PPP project (Phase III) in Changshu has adopted a decentralized treatment mode complemented by a centralized treatment mode. The process of “septic tank + purification tank (+ modular constructed wetland)” has been applied by all farmers within the project site and the effluent quality must meet the discharge standard of water pollutants for rural domestic sewage treatment facilities (DB32/T 3462-2020). Moreover, villages involved in the provincial examination section are equipped with constructed wetlands at the end of the treatment facilities, which have adopted a modular design with a hydraulic load of 0.2–0.4 m3/(m2·day) to improve the effluent water quality.

3.2. Scale of Wastewater Treatment

The total value of water consumption of the PPP project was determined by the value and habit of water consumption, and the economic conditions of the residents. Rural indoor sanitation facilities were well equipped and the source of water in Changshu was tap water, so the water consumption was 120 L/day per person, and the calculated sewage volume was 101 L/day per person. Common tonnages of wastewater treatment equipment are available for 1 m3/day, 2 m3/day, 5 m3/day, and 10 m3/day. The design of sewage volume and construction of wastewater treatment equipment may have a certain amount of flow error, which can lead to insufficient or excess water collection in the equipment, thereby affecting the effectiveness of sewage treatment. The rationality of the construction scale of sewage treatment can be determined by analyzing the relationship between the design sewage volume and the scale of the equipment (Table 1).

4. Results and Discussion

4.1. Effect of Filler Combinations on Pollutants Removal in MCWs

4.1.1. Nitrogen Removal

Figure 3 shows the removal effect on pollutants from rural domestic wastewater by MCWs with different filler combinations. As shown in Figure 3a, the average influent NH4+-N concentration of the systems was 10.02 ± 0.24 mg/L. The system with the RB-VR combination had the lowest average effluent NH4+-N concentration (1.90 ± 0.25 mg/L) and the highest average removal rate (81.0 ± 2.5%). On the second day, systems with the RB-VR and C-VR combinations showed excellent performance in NH4+-N removal, with removal rates of 87.4% and 83.1%, respectively. However, there was no obvious trend in the effluent NO3-N concentration with an increase in the sampling time (Figure 3b). The VR-LF (removal rate 49.9 ± 0.9%) and RB-LF (removal rate 47.5 ± 1.1%) showed better removal effects on NO3-N than the other filler combinations, and the average effluent NO3-N concentrations were 2.46 ± 0.20 mg/L and 2.58 ± 0.23 mg/L, respectively. Compared with other fillers, lightweight fillers have larger porosity and are less prone to accumulate, which can accelerate the nitrification reaction and provide better anaerobic conditions to promote the denitrification reaction [32,33].
The removal of nitrogen in CWs mainly relies on the nitrification and denitrification of wetland plants and microorganisms [34]. The MCWs with different filler combinations all contributed to the purification of TN in rural domestic wastewater (Figure 3c). The RB-VR combination showed the best purification effect on TN, with an average removal rate of 64.5 ± 3.4%; on the 16th day, the lowest effluent TN concentration (5.35 ± 0.78 mg/L) and highest removal rate (64.8%) were achieved by RB-VR. Moreover, the removal rates of TN in C-VR and VR-LF reached 59.9% and 57.3%, respectively, which indicated that volcanic rocks with larger surface areas and pore sizes can carry more oxygen and are more suitable for microbial proliferation [35].

4.1.2. Phosphorus Removal

The removal of phosphorus by CWs depends mainly on the adsorption of the substrate, which indicates that fillers with high porosity may be more effective in the purification of phosphorus. As shown in Figure 3d, the MCWs with different filler combinations had a certain purifying effect on TP in rural domestic wastewater. The C-VR and RB-VR combinations had relatively low average effluent TP concentrations of 0.34 ± 0.03 mg/L, and 0.46 ± 0.06 mg/L, respectively. In addition, the C-VR, RB-VR, and RB-C combinations showed better removal effects, with average removal rates of 83.5%, 77.7%, and 72.4%, respectively. Since both volcanic rocks and ceramite have a large specific surface area and porosity, the C-VR can quickly adsorb active iron ions and exchangeable aluminum ions, resulting in efficient phosphorus removal [33,36]. In addition, as the adsorption sites gradually became saturated, the TP removal rate would not increase with the extension of the sampling time. Therefore, the selection of fillers with large porosity and the rational selection of the hydraulic residence time are both crucial for TP removal.

4.1.3. COD Removal

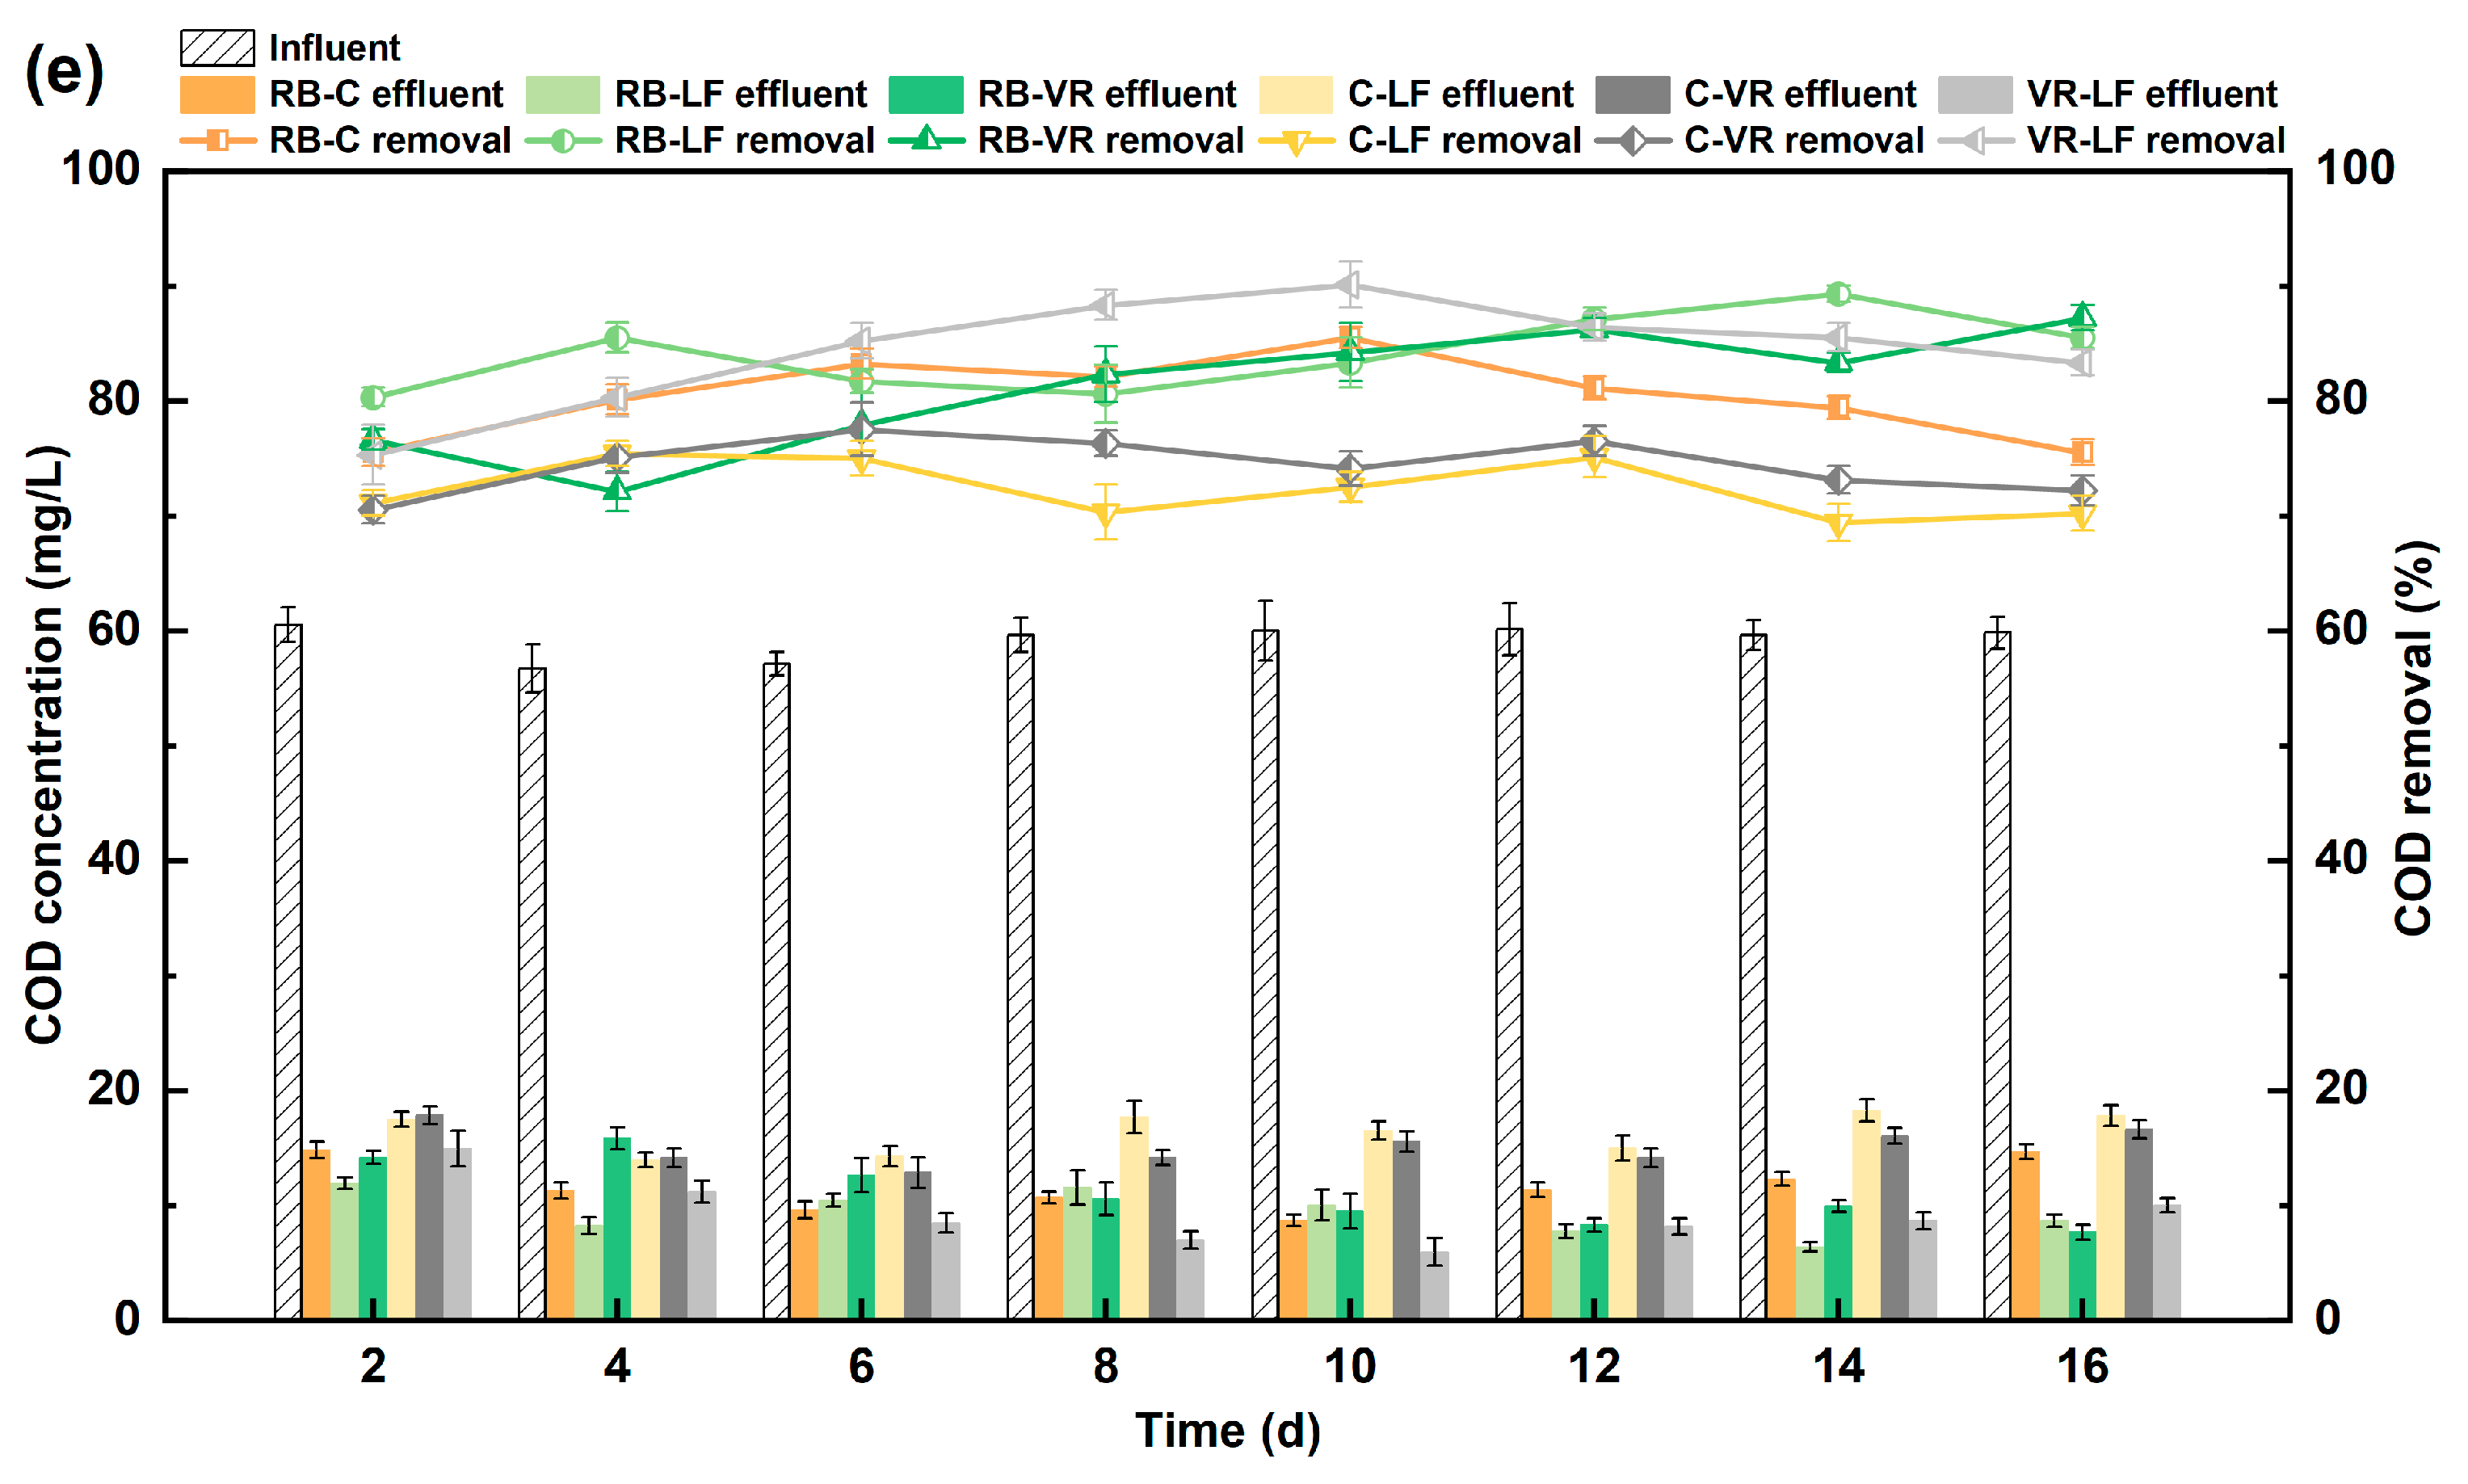
The variations in the COD concentration and removal rate in MCWs with the sampling time are shown in Figure 3e. The average influent COD concentration of each system was 59.18 ± 1.71 mg/L, and the average COD removal rate of them was ranked as follows: VR-LF (84.3 ± 1.6%) > RB-LF (84.2 ± 1.3%) > RB-VR (81.2 ± 1.6%) > RB-C (80.3 ± 1.1%) > C-VR (74.4 ± 1.4%) > C-LF (72.4 ± 1.5%). On the 16th day, the effluent COD concentration of RB-VR was the lowest among the six groups of filler combinations (7.65 ± 0.63 mg/L), and its removal rate reached 87.2%. The reason might be that volcanic rocks are rich in microporous structures, which provide more attachment sites for microorganisms and a rich anoxic and anaerobic microenvironment for anaerobic bacteria.

4.2. Long-Term Purification Effect of Plants on Rural Domestic Wastewater in MCWs

To further analyze the long-term purification effect of four native plants on rural domestic wastewater, RB-VR was selected as the filler to construct MCWs, and the change in the effluent concentration and removal rate of each pollutant with time is shown in Figure 4. The MCWs showed a certain purification effect on NH4+-N, and the average influent NH4+-N concentration was 10.01 ± 0.22 mg/L (Figure 4a). The average removal rates of MCWs planted with M. elatinoides and O. javanica were higher than 90%, which were better than that of I. tectorum and I. aquatica. In addition, the effluent NH4+-N concentrations of M. elatinoides and O. javanica reached the lowest on the 12th and 30th days, with 0.76 ± 0.20 mg/L and 0.64 ± 0.19 mg/L, respectively, and the corresponding removal rates were 92.5% and 93.6%, respectively. The NH4+-N concentrations in the effluent of I. aquatica and I. tectorum both reached a minimum on the 16th day, with 1.10 ± 0.24 mg/L and 1.36 ± 0.15 mg/L, respectively.
As shown in Figure 4b,c, the average influent NO3-N and TN concentrations in MCWs were 4.99 ± 0.19 mg/L and 15.01 ± 0.43 mg/L, respectively. Compared with O. javanica, I. aquatica, and I. tectorum, M. elatinoides showed the best purification effect, with the highest average removal rates of NO3-N and TN (69.7 ± 1.9% and 80.0 ± 1.9%). The effluent NO3-N and TN concentrations of the MCW planted with M. Elatinoides decreased to a minimum on the 8th day (1.12 ± 0.07 mg/L and 2.54 ± 0.23 mg/L, respectively), and the effluent NO3-N concentrations of I. aquatica and I. tectorum both reached the lowest on the 20th day (1.46 ± 0.07 mg/L and 1.62 ± 0.14 mg/L, respectively); the corresponding removal rates on the 8th day were 68 ± 1.9% and 80.0 ± 1.9%, respectively, and the corresponding removal rates on the 20th day were 68.9% and 65.6%, respectively. The effluent TN concentrations of the systems with O. javanica, I. aquatica, and I. tectorum reached the lowest on the 12th, 10th, and 20th days, and the corresponding removal rates were 82.2%, 75.5%, and 75.5%, respectively.
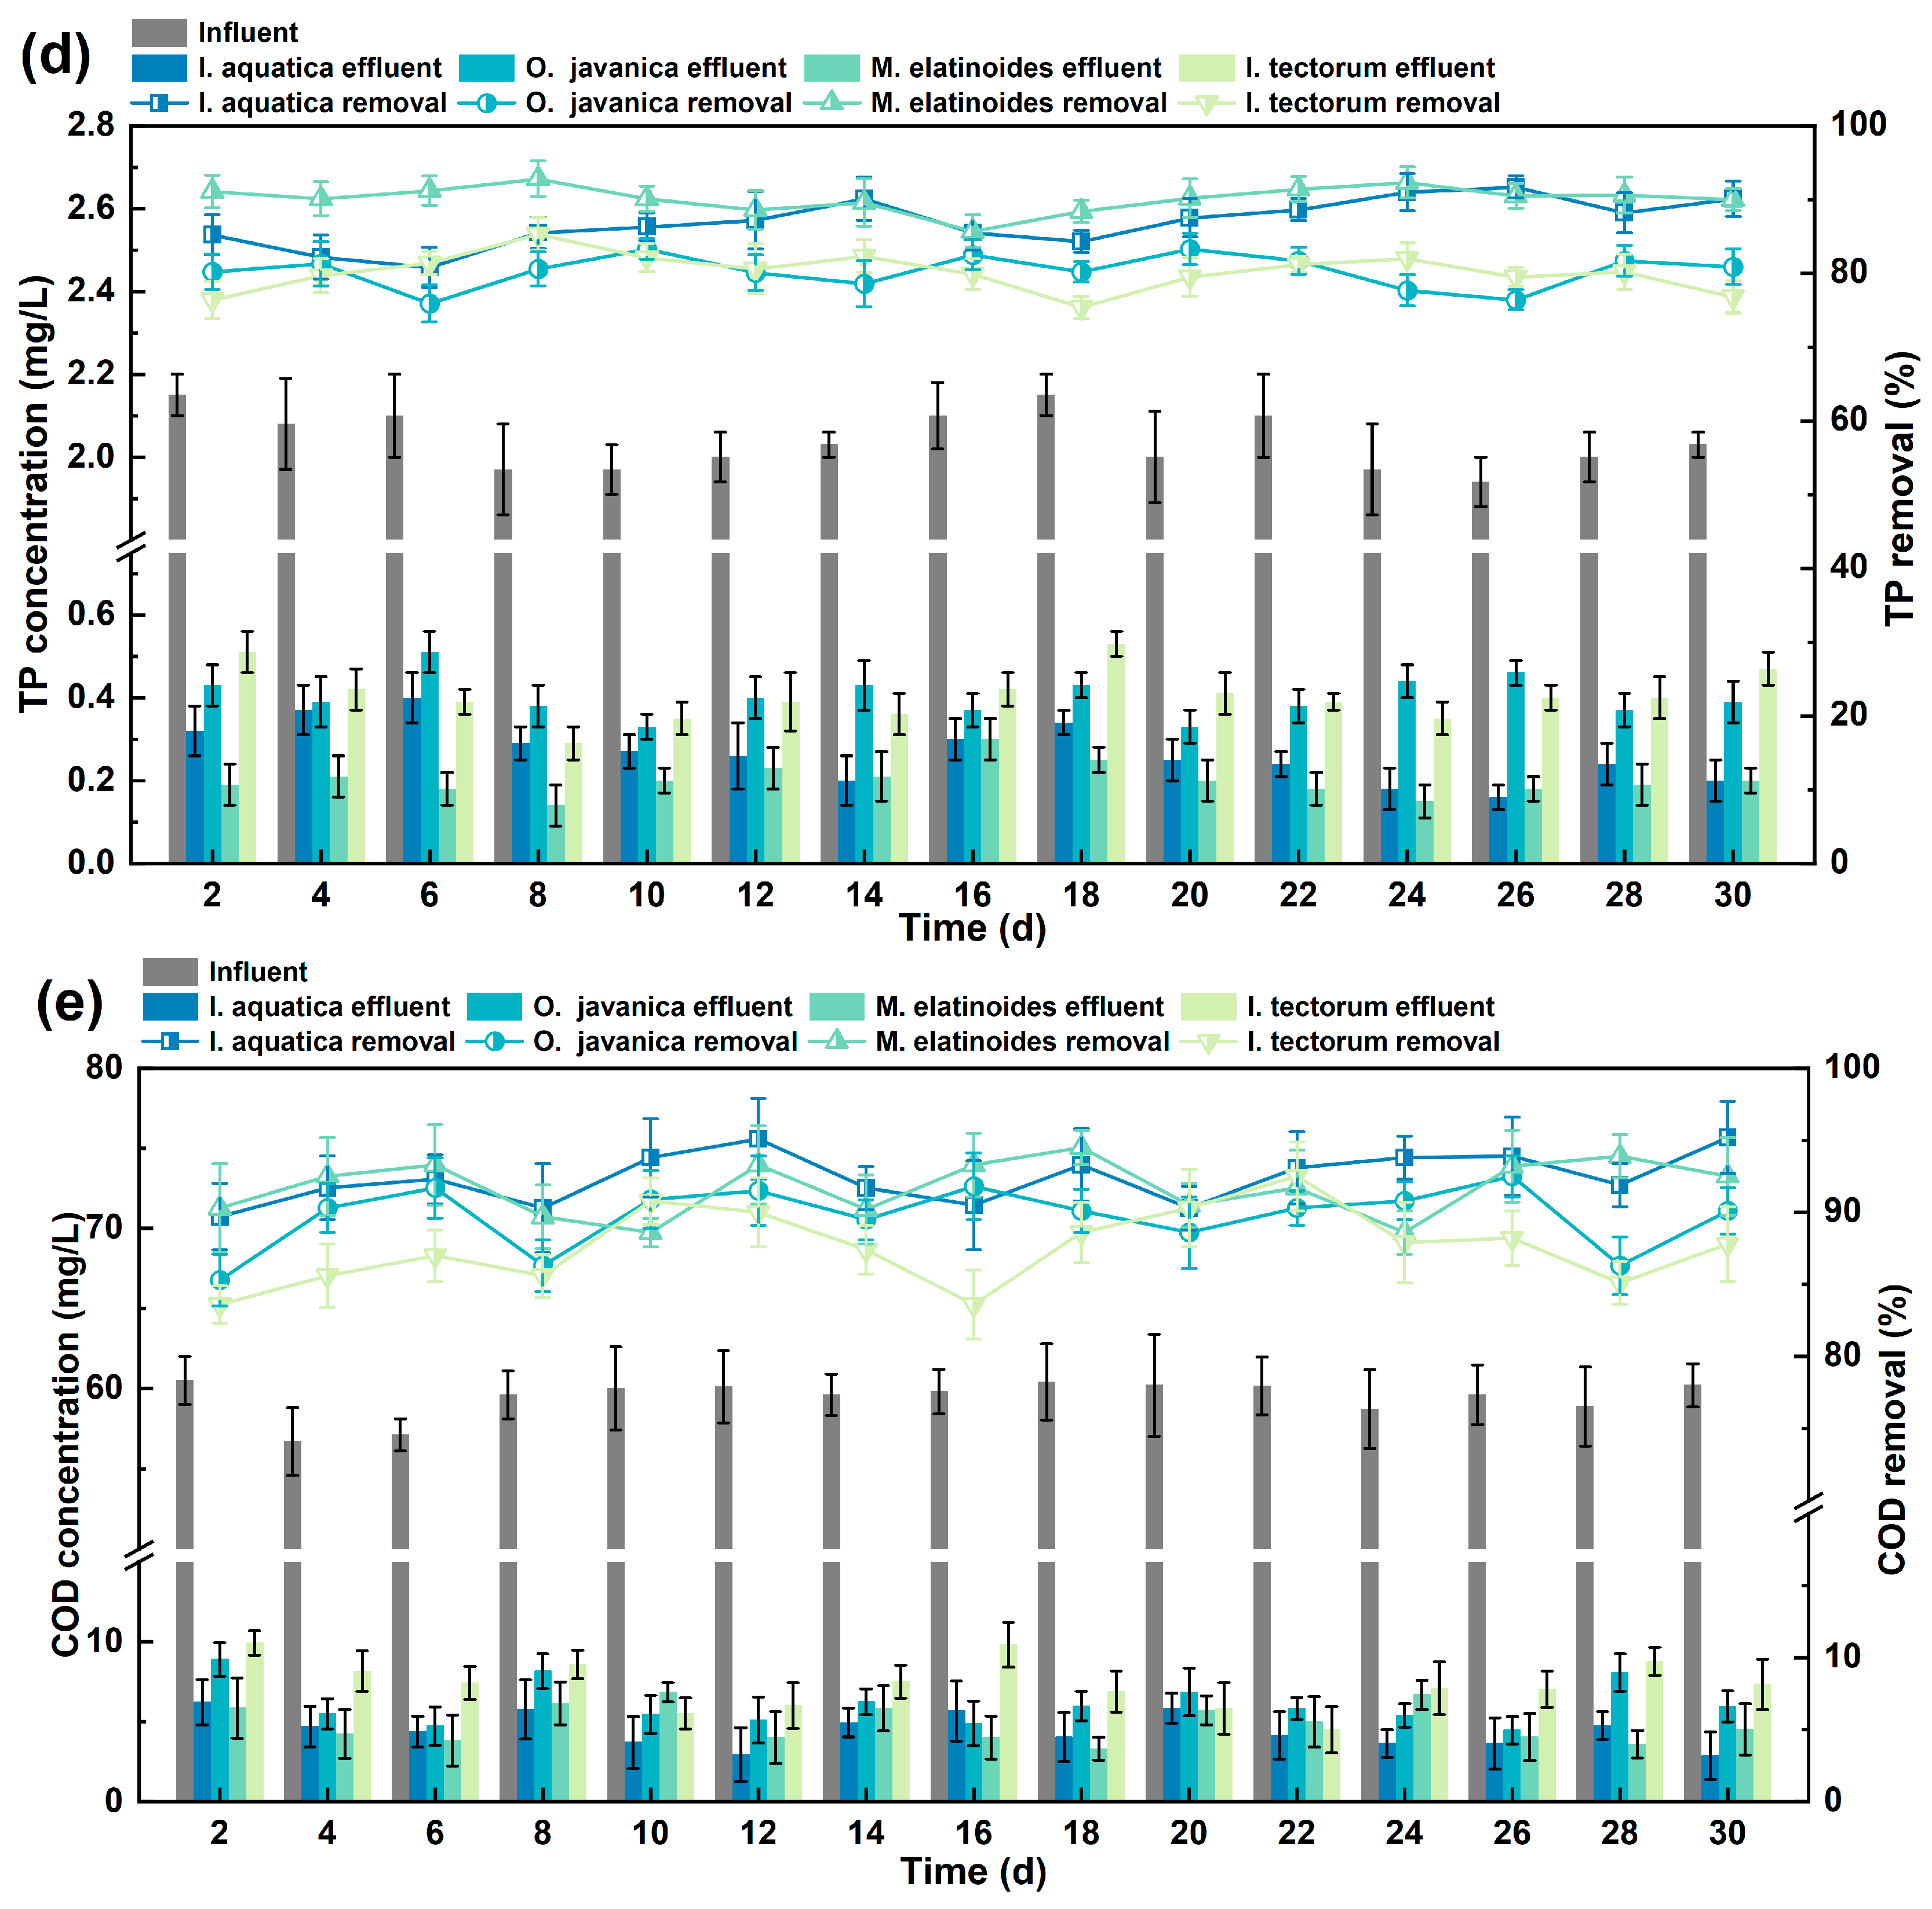
The average TP concentration in the influent water of MCWs was 2.04 ± 0.07 mg/L (Figure 4d). The MCW planted with M. elatinoides obtained the highest average TP removal rate (90.2 ± 2.1%) compared with the other three plants. Moreover, the effluent TP concentrations of the MCWs with M. elatinoides (0.14 ± 0.05 mg/L) and I. tectorum (0.29 ± 0.04 mg/L) were both the lowest on the eighth day, with corresponding removal rates of 92.8% and 85.3%, respectively. The effluent TP concentrations of the MCWs with O. javanica and I. aquatica reached their minimum values on the 26th and 20th days, with 0.16 ± 0.03 mg/L and 0.33 ± 0.04 mg/L, respectively.
As shown in Figure 4e, the average influent COD concentration of the MCWs was 59.43 ± 1.94 mg/L, and the effluent COD concentrations were significantly lower than 40 mg/L, which met the environmental quality standard of Class V for surface water. The average effluent COD concentration of the MCW planted with O. javanica was the lowest (4.49 ± 1.35 mg/L) and the average removal rate was the highest (92.4 ± 2.3%). The effluent COD concentrations of the MCWs planted with O. javanica, M. elatinoides, and I. tectorum were the lowest on the 30th, 18th, and 22nd days, with the removal rates reaching 95.2%, 94.5%, and 92.5%, respectively.
In conclusion, the MCWs planted with O. javanica, I. aquatica, M. elatinoides, and I. tectorum all played a certain role in purifying TP, TN, NO3-N, NH4+-N, and COD from rural domestic wastewater. Compared with I. aquatica and I. tectorum, the MCWs with O. javanica and M. elatinoides had a better comprehensive purification effect on domestic wastewater.

4.3. Evaluation of Water Quality Based on the Fuzzy Comprehensive Evaluation Method

The selection of evaluation factors in the fuzzy comprehensive evaluation model of MCWs should remove some monitoring indicators (nitrate nitrogen, conductivity, temperature, etc.) that cannot be directly evaluated by surface water quality standards [37]. Four conventional indicators (NH4+-N, COD, TP, and TN) were chosen as the evaluation factors and the set of evaluation factors constituted U = {NH4+-N, COD, TP, TN}.
According to the environmental quality standards for surface water (GB 3838-2002), the water quality of surface water is divided into five categories. The fuzzy comprehensive evaluation method cannot discern the water quality outside of Class V. Therefore, the set of evaluation criteria was determined as V = {I, II, III, IV, V}.
The degree of membership of each factor related to the water quality of Classes I–V was calculated by Equation (2), and the fuzzy relationship matrix of effluent water quality in MCWs with four different plants was obtained. The partial membership matrix is as follows:
R I . a q u a t i c a , 2 d = 0 0 0.5478 0.4522 0 1 0 0 0 0 0 0 0 0 1 0 0 0 0 1
R O . j a v a n i c a , 2 d = 0 0 0.0855 0.9145 0 1 0 0 0 0 0 0 0 0 1 0 0 0 0 1
R M . e l a t i n o i d e s , 2 d = 0 0.4121 0.5879 0 0 1 0 0 0 0 0 0.0865 0.9135 0 0 0 0 0 0 1
R I . t e c t o r u m , 2 d = 0 0 0.0855 0.9145 0 1 0 0 0 0 0 0 0 0 1 0 0 0 0 1
The weight coefficients of pollutant factors are used to measure the degree of influence of each pollutant factor on water bodies. In this experiment, the weight value was calculated by exceeding the ratio, and the impact of the factor on the water quality becomes larger when the weight coefficient rises. As shown in Table 2, the weight coefficients of COD and TN in MCWs were all higher than 0.2, which showed a larger impact on the water quality; among the four systems, the weight coefficient of TP in MCWs planted with O. javanica, M. elatinoides, and I. tectorum remained small, which had a slight impact on the effluent water quality.
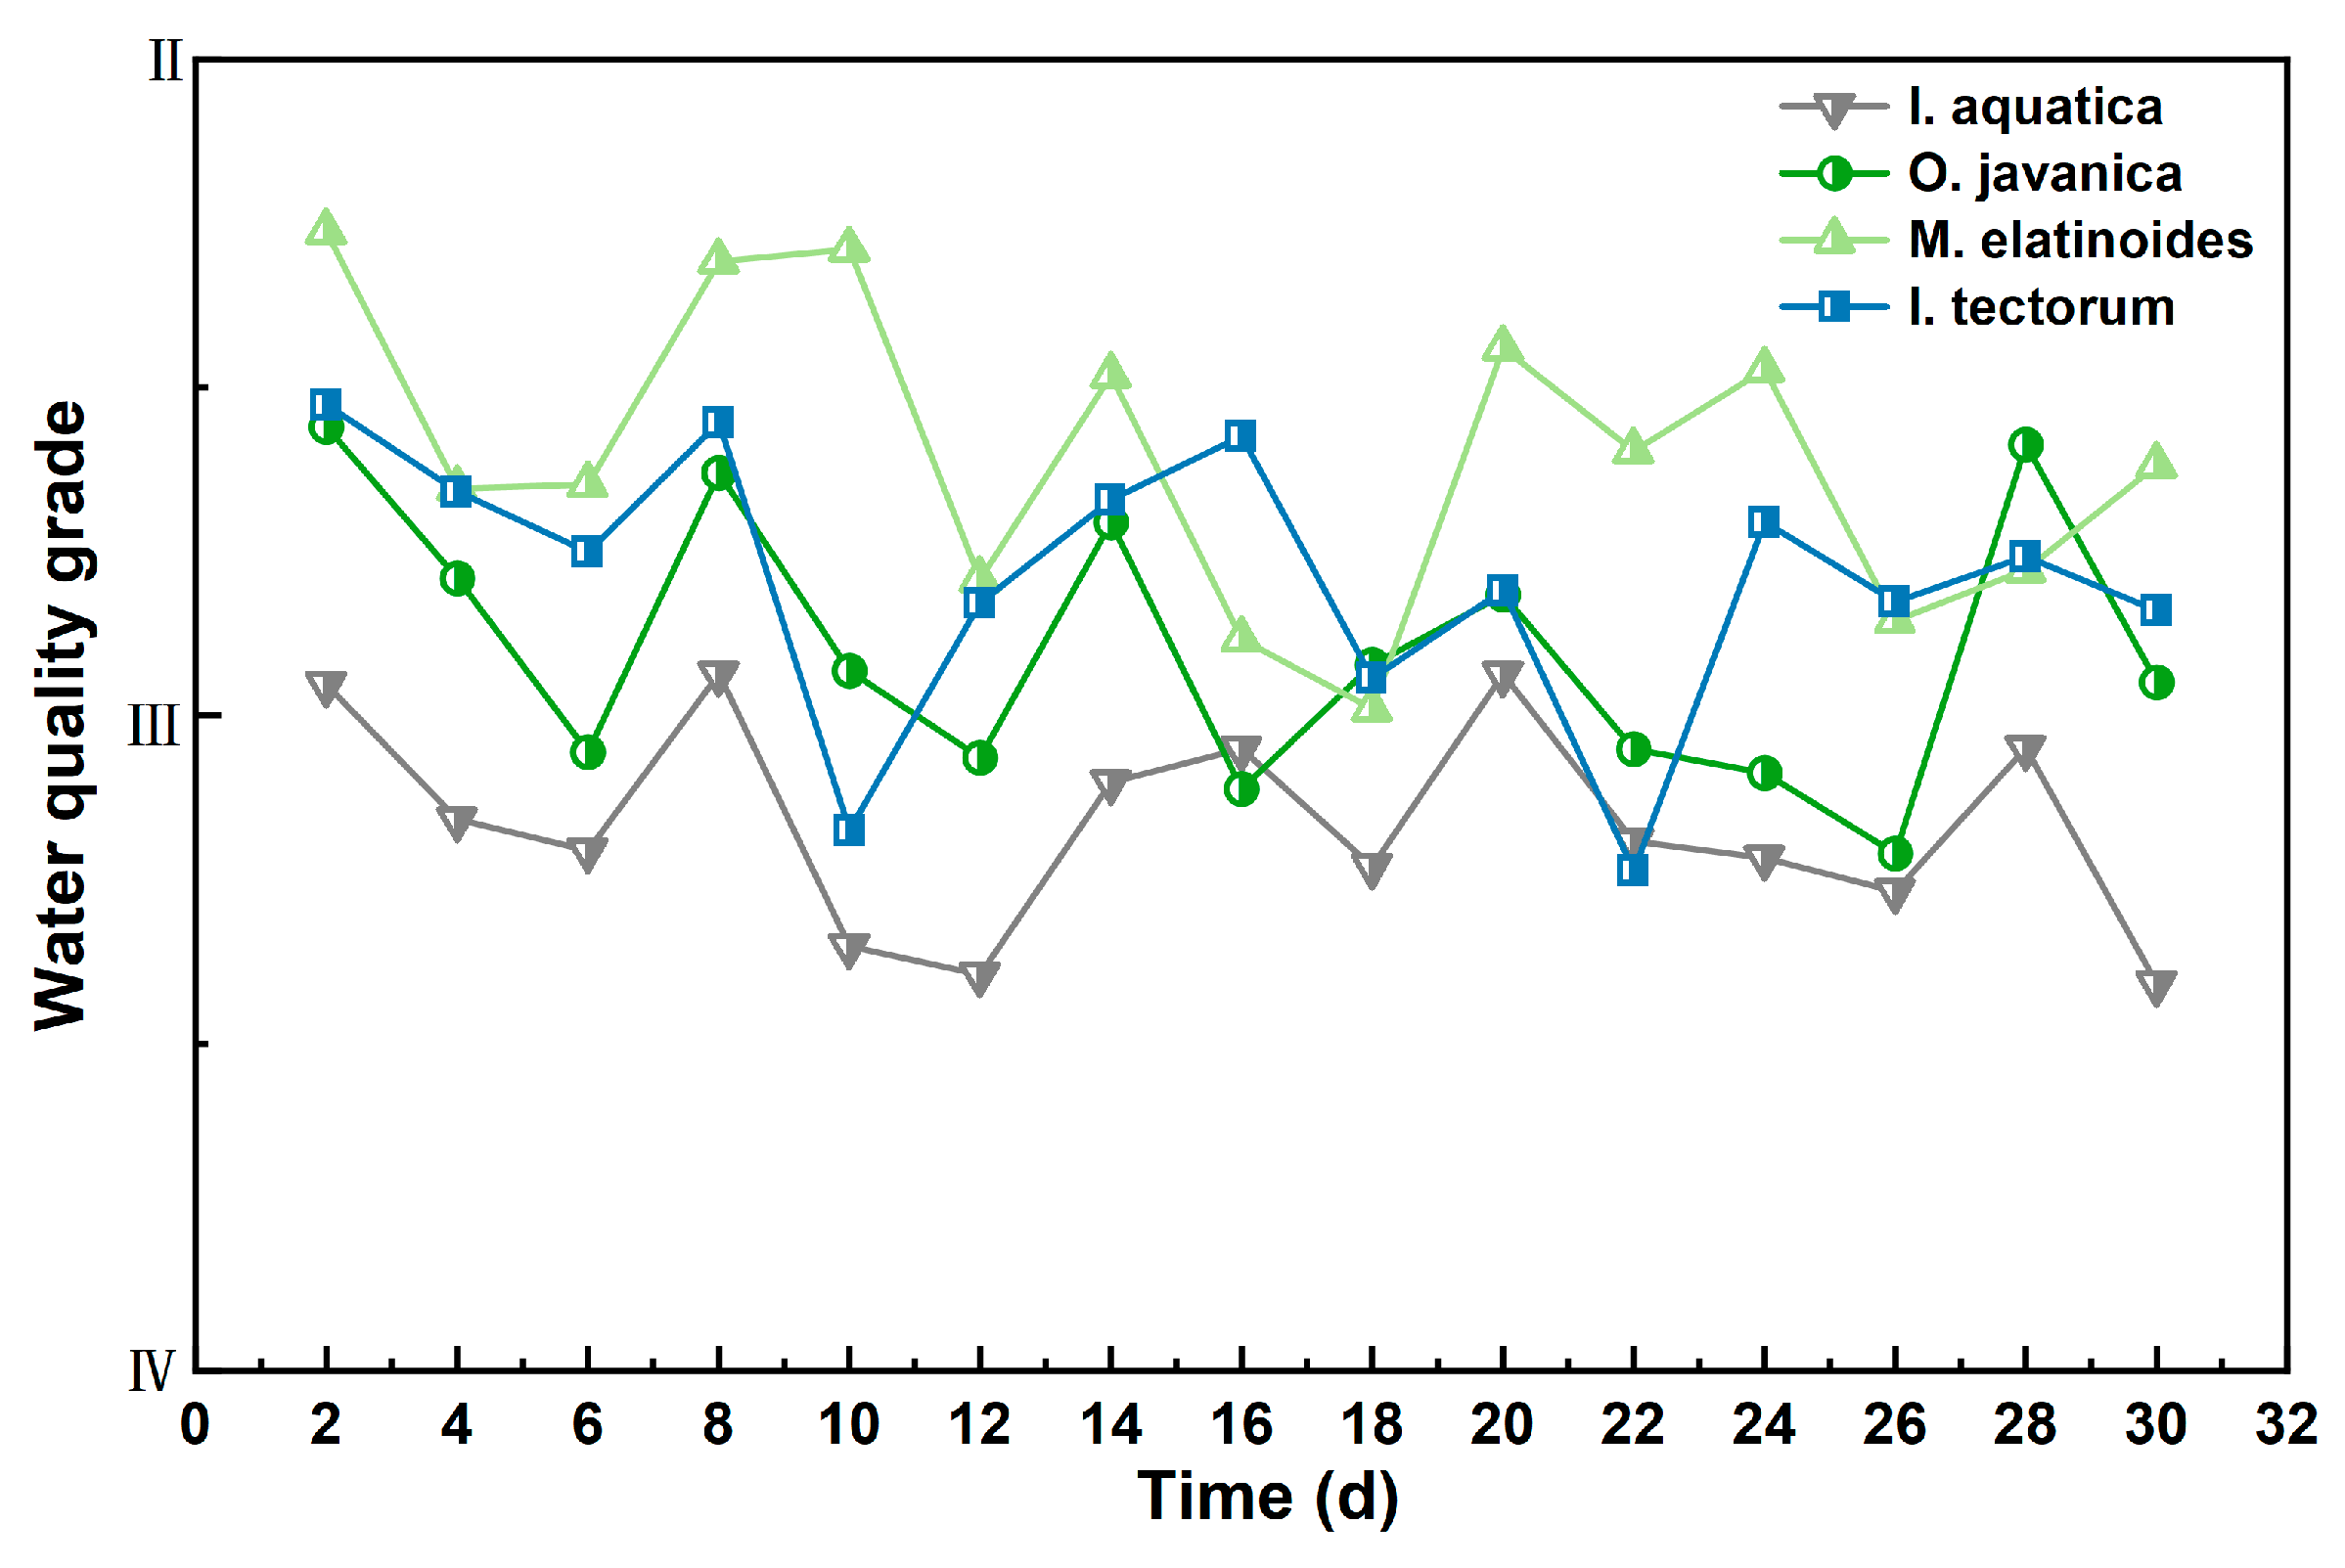
According to the comprehensive degree of membership of each pollution factor, the water quality at different sampling times in four systems was determined by the fuzzy comprehensive index, and the evaluation results are shown in Figure 5. The effluent water quality of MCWs planted with various plants generally met the quality standard for surface water, with the FCI ranging from 2.60 to 3.74. The effluent water quality of the system planted with M. elatinoides was the best and met the standard of Class III for surface water. The order of effluent water quality of the four systems was as follows: M. elatinoides > I. tectorum > O. javanica > I. aquatica. The effluent water quality of the MCWs showed a downward trend with the prolongation of sampling time, and the fluctuation range was large. Therefore, the findings above indicated that the modular constructed wetland with RB-VR as the filler and planted with M. elatinoides was the most effective in purifying rural domestic wastewater.

4.4. Analysis of Influent and Effluent Water Quality in the Pilot Project

Each household of the decentralized rural domestic sewage treatment PPP project (Phase III) in Changshu did not carry out septic tank construction and renovation, and the blackwater was discharged directly into the collection system after simple filtration, so the design influent quality indicators (TN and NH4+-N) were taken to be on the high side. One year (January 2019–December 2019) of water quality monitoring was conducted for the implemented sewage treatment facilities of the PPP project.

4.4.1. Analysis of Influent Water Quality

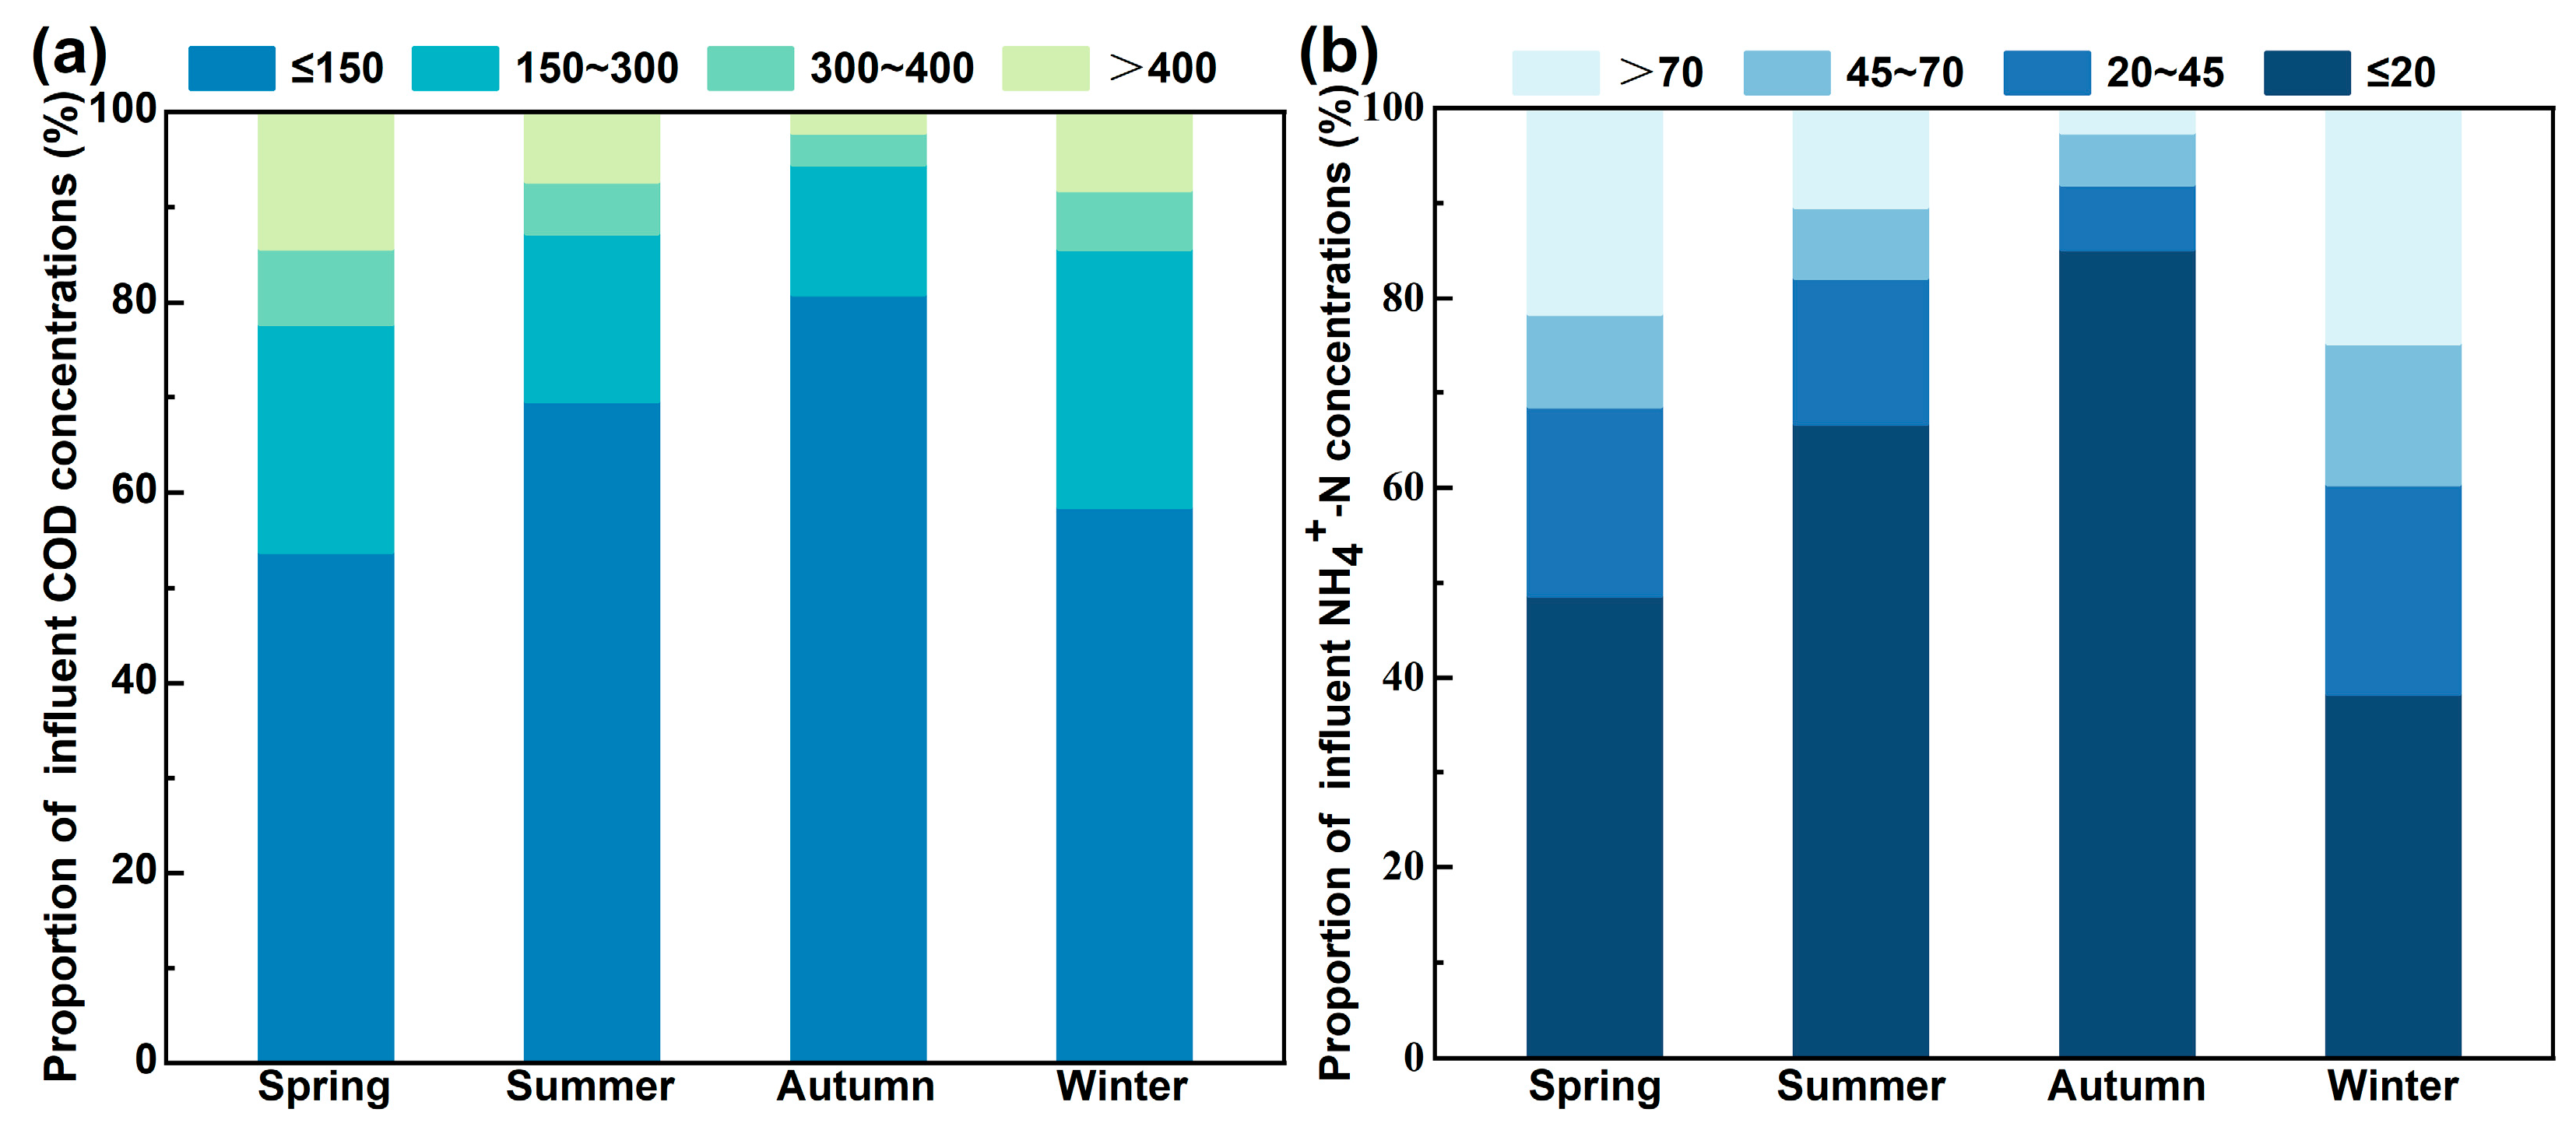
The monitored data of influent water quality were divided into four samples according to seasons: spring (March–May), summer (June–August), autumn (September–November), and winter (December–February). To exclude the impact of the treatment scale, 1 m3/day with the largest sample size was selected as the treatment scale, and the changes in th einfluent COD and NH4+-N concentrations in the four seasons are shown in Figure 6.
As shown in Figure 6a, the highest proportion of samples was observed when the influent COD concentration was below 150 mg/L, with a higher percentage in summer and autumn (69.51% and 80.85%) and a relatively smaller percentage in spring and winter (53.73% and 58.42%). In contrast, the percentage of samples in the high concentration interval was lower in summer and autumn, but higher in spring and winter, and the average COD concentrations in spring, summer, autumn and winter were 212.95 mg/L, 152.69 mg/L, 99.81 mg/L, and 169.6 mg/L, respectively.
As shown in Figure 6b, the NH4+-N concentration of 20 mg/L in the influent water is the largest proportion of the samples in the four seasons, with proportions of 48.57%, 66.67%, 85.11% and 38.28%, respectively, for spring, summer, autumn, and winter. Obviously, the proportion is higher in summer and fall, and lower in spring and winter. The average NH4+-N concentrations in the four seasons were 40.34 mg/L, 23.87 mg/L, 11.65 mg/L, and 46.22 mg/L, respectively, for spring, summer, autumn, and winter. In summary, the samples with low COD and NH4+-N concentrations accounting for the largest amount revealed that the influent concentration in this region was relatively low. The annual average COD and NH4+-N concentrations were 181.16 mg/L and 36.4 mg/L, but the influent’s qualified rates of COD (150 mg/L–400 mg/L) and NH4+-N (20 mg/L–70 mg/L) were only 29.52% and 28.61%.
The concentration of pollutants in the influent water was low in summer and autumn, but high in spring and winter. This phenomenon was mainly attributed to the living habits of residents, as the residents bathed frequently as the temperature was high in summer and autumn, resulting in a larger amount of greywater with a low concentration; on the contrary, the temperature was low in spring and winter, and the amount of greywater was relatively small, so that the overall influent concentration was relatively high.

4.4.2. Analysis of Effluent Water Quality

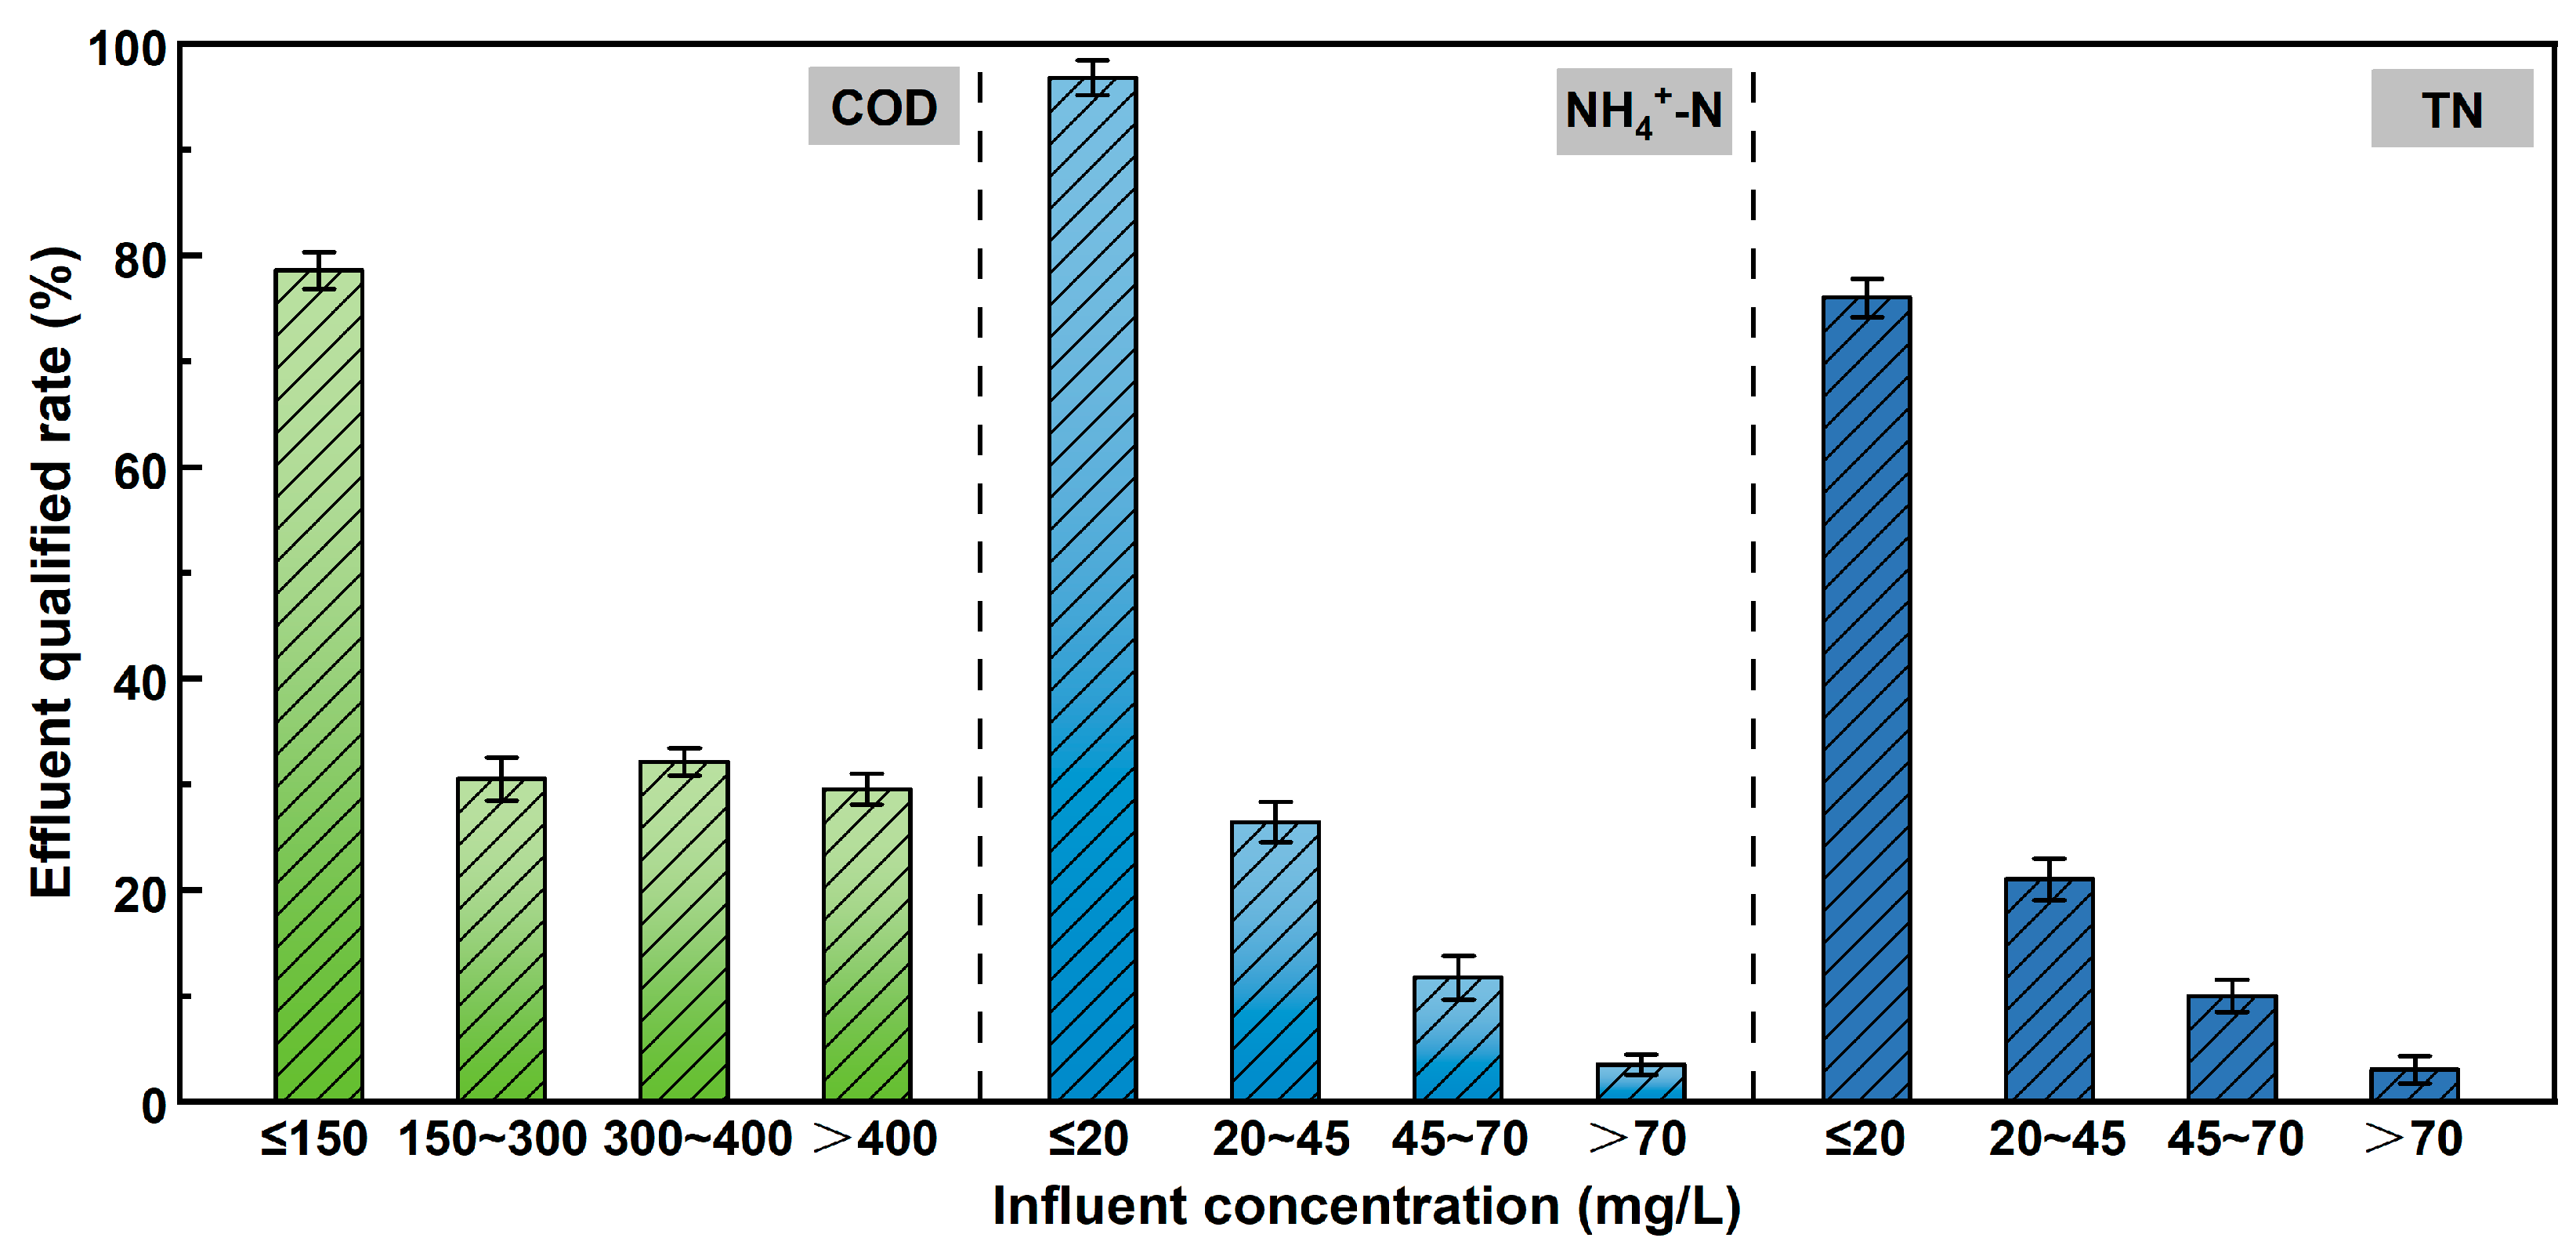
The influence of influent water quality on effluent water quality was analyzed according to the monitored data. As shown in Figure 7, the effluent’s qualified rate reached a maximum of 78.58% with an influent COD concentration lower than 150 mg/L, while the effluent’s qualified rate of other influent COD concentrations was only about 30%. When the concentration of influent NH4+-N was lower than 20 mg/L, the qualified rate of effluent NH4+-N and COD reached 96.77% and 75.44%, respectively; when the concentration of influent NH4+-N was higher than 70 mg/L, the qualified rate of effluent NH4+-N and COD was the lowest, with only 3.49% and 2.24%, respectively.
The phenomenon above indicated that the influent concentration significantly affects the effluent quality of this project. The effluent water quality becomes better when the influent concentration is lower and becomes worse when the influent concentration is higher. The purification tank applied in this project did not show good impact resistance in practical application, so it is necessary to set up a septic tank for wastewater pretreatment to improve the water quality. The influent water of this project was characterized by a low overall concentration and a wide range of fluctuations, which made it suitable for treating low-concentration wastewater.

4.5. Economic Analysis of the Pilot Project

The decentralized rural domestic sewage treatment PPP project (Phase III) in Changshu included nine towns and districts with a total of 4068 residents (Bixi district, Changfu district, Dongbang town, Guli town, Haiyu town, Meili town, Shajiabang town, Shanghu town, and Zhitang town). The project installed a total of 747 sets of 1 m3/day equipment, 10 sets of 2 m3/day equipment, 44 sets of 5 m3/day equipment, 47 sets of 10 m3/day equipment, 11 sets of 15 m3/day equipment, and 10 sets of 20 m3/day equipment. The investment budget for equipment installation, pipe laying, and installation of electric lining for different scales of equipment was analyzed.

4.5.1. Analysis of Investment in Equipment Construction

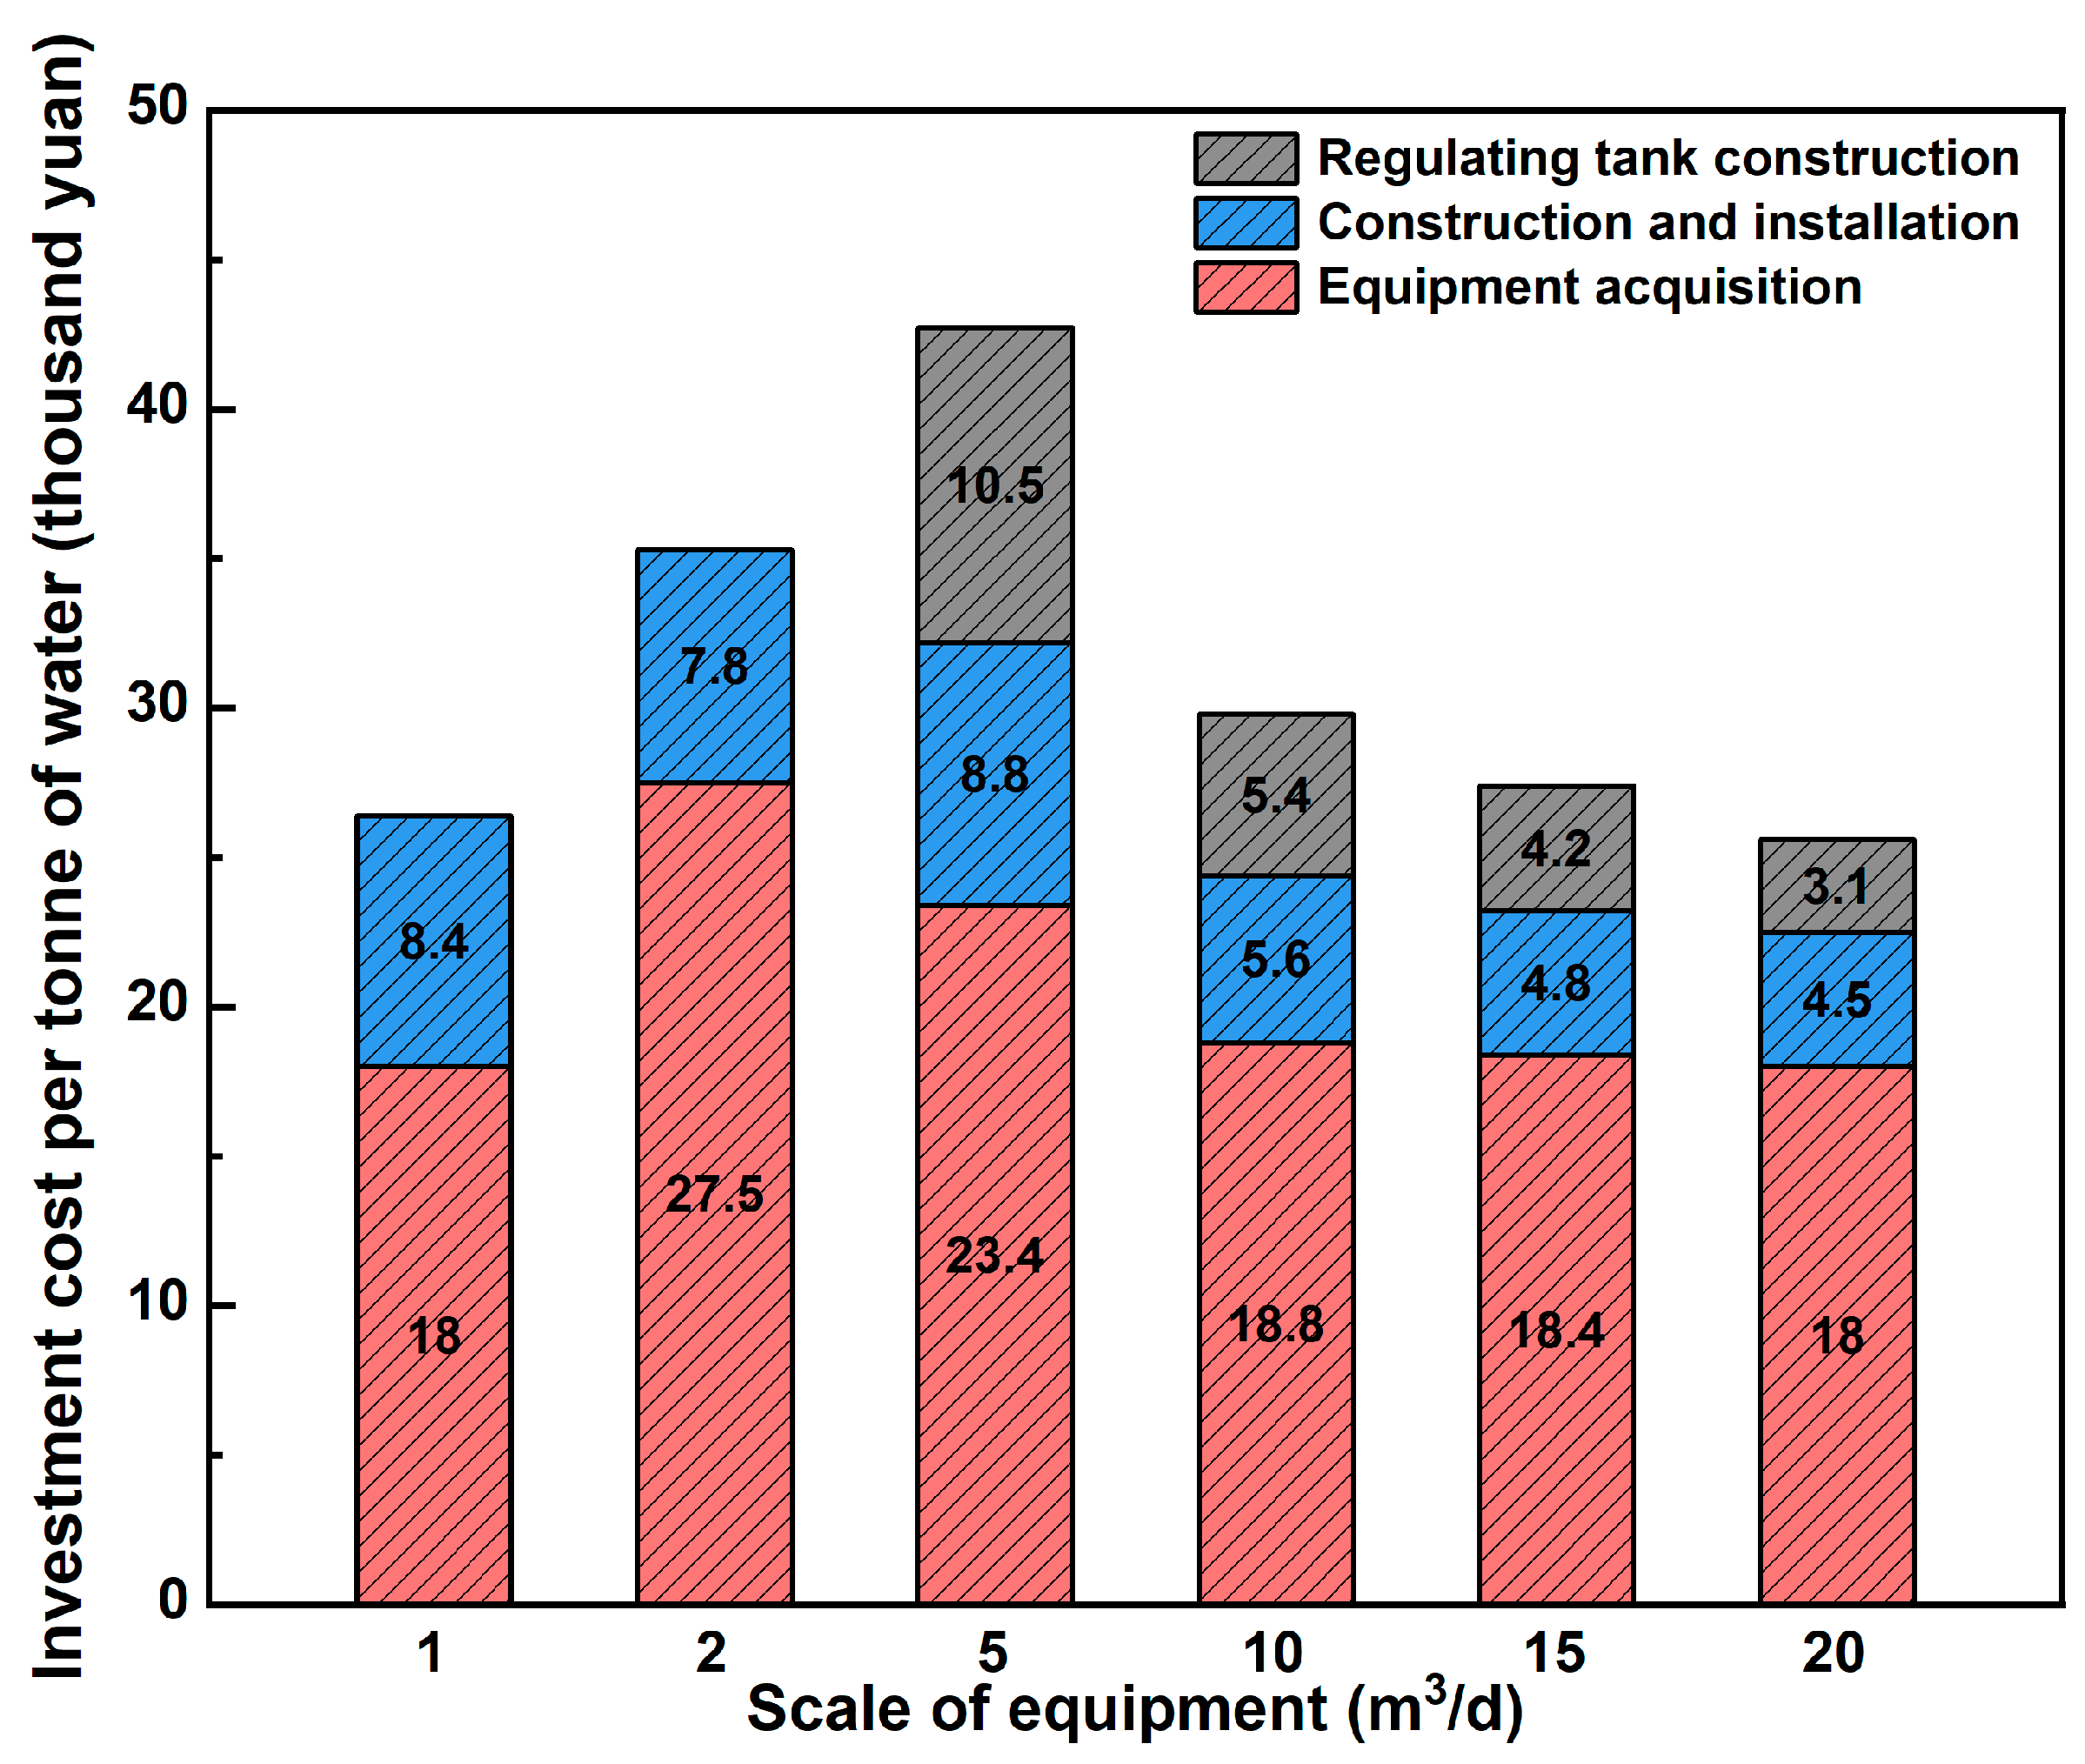
The investment costs of different scales of equipment mainly consisted of installation and acquisition, and the cost for regulating tank construction should be added when the scale of equipment is ≥5 m3/day. The investment in tons of water was chosen as a parameter for a comparative economic analysis to intuitively understand the economic situation of each scale of equipment.
The economic analysis of different scales of purification tanks is shown in Figure 8. The cost of purification tanks was CNY 18–27.5 thousand per ton of water, of which the lowest one was 1 m3/day and 20 m3/day and the highest was 2 m3/day; the cost of construction and installation per ton of water ranged from CNY 4.5–8.8 thousand and was higher in the equipment of 1 m3/day, 2 m3/day, and 5 m3/day, among which, the scale of 5 m3/day was the highest, while the equipment of 10 m3/day, 15 m3/day, and 20 m3/day were lower, for which the cost of 20 m3/day was the lowest; the total investment cost of equipment per ton of water (including the regulating pool) was CNY 25.5–43.2 thousand, for which the scale of 5 m3/day remained the highest, and the equipment of 1 m3/day and 20 m3/day were more economical than the others.

4.5.2. Analysis of Investment in Project Construction

The total construction investment cost of the decentralized rural domestic sewage treatment PPP project (Phase III) in Changshu was analyzed. The project adopted a decentralized treatment mode, primarily using 1 m3/day equipment combined with a small amount of relatively centralized treatment. As shown in Table 3, Dongbang town and Shajiabang town had completely decentralized sewage treatment modes, while the other towns had mixed sewage treatment modes.
The overall construction investment cost of the project was CNY 105,155,700, of which CNY 53,880,100 was invested in equipment, accounting for 51.24%; CNY 49,525,600 was invested in the pipeline network, accounting for 47.10%; and CNY 1,749,800 was invested in electricity and others, accounting for 1.66%. Equipment investment was slightly higher than pipeline network investment, but the overall difference was not significant. The average household investment was CNY 13,700 per household (excluding the pipe network). The overall engineering investment in each township remained consistent, with equipment investment slightly higher than pipe network investment. The application of more economical sewage treatment equipment could effectively reduce investment costs, and there was a positive correlation between power investment and the number of equipment, as greater equipment power investment accounted for the larger costs.

4.5.3. Limitations of the Study

MCWs are a breakthrough design concept compared with traditional CW, but their operation and management need us to establish a finer monitoring system, which may bring about increased difficulty and cost of operation and maintenance. In the project implementation stage, the process parameters, system configuration, and the subsequent maintenance program must be scientifically demonstrated by a professional team. It is worth noting that the MCW system has a number of outstanding advantages: its standardized prefabricated components can significantly reduce civil engineering expenses, and the enhanced pollution load treatment capacity improves the treatment efficiency per unit area, thus saving land requirements. To realize the large-scale promotion of MCW technology in different application scenarios, it is necessary to continuously strengthen the research on technological innovation and focus on solving the key problems in the system’s operation, which is of decisive significance for enhancing the comprehensive benefits of this technology.

5. Conclusions

1. Among the six filler combinations in MCWs, the unit with the RB-VR combination showed the best removal effect on rural domestic wastewater, in which the average removal rates of both NH4+-N and TN were the highest (81.0 ± 2.5% and 64.5 ± 3.4%).
2. According to the fuzzy comprehensive evaluation method, the fuzzy comprehensive index of the RB-VR systems with four kinds of plants ranged from 2.60 to 3.74, and the effluent water quality of systems all reached the standard for surface water. Among them, the best long-term purification results were obtained when the filler was RB-VR and the plant was M. elatinoides in the combined system.
3. The influent and effluent water quality analysis results of the rural pilot project in Changshu revealed that the overall influent concentration was low with large fluctuations (COD: 99.81–212.95 mg/L; NH4+-N: 11.65–46.22 mg/L), and the effluent’s qualified rate was relatively low (COD: 2.24–75.44%; NH4+-N: 3.49–96.77%). The effluent water quality is greatly affected by the influent concentration, and a lower influent concentration resulted in better water quality, while a higher concentration led to poorer effluent quality. Therefore, it is necessary to set up a septic tank for pretreatment in practical applications.
4. The economic analysis results of the rural pilot project in Changshu revealed that investment in the equipment of 5 m3/day was the highest while that of 1 m3/day and 20 m3/day was more economical; equipment investment accounted for 51.24% of the overall construction investment of the project, so more economical equipment should be adopted for rural domestic wastewater treatment.

Author Contributions

Conceptualization, X.Z. and J.Y.; methodology, X.Z.; software, R.H.; validation, L.C., M.L. and B.H.; formal analysis, X.Z.; investigation, H.L.; resources, J.Y.; data curation, R.H.; writing—original draft preparation, X.Z.; writing—review and editing, X.Z.; visualization, X.Z.; supervision, H.L.; project administration, H.L. All authors have read and agreed to the published version of the manuscript.

Funding

Financial support from the National Natural Science Foundation of China (52108322), Xinjiang Biomass Solid Waste Resources Technology and Engineering Center of China (KSUGCZX2022), Lianyungang Key Research and Development Plan (Social Development) project of China (SF2130), Lianyungang Key Research and Development Plan (Industrial Outlook and Key Technology Core) project of China (CG2207), and The Natural Science Foundation of the Jiangsu Higher Education Institutions of China (22KJB560001).

Data Availability Statement

The original contributions presented in this study are included in the article. Further inquiries can be directed to the corresponding author.

Conflicts of Interest

The authors declare no conflict of interest.

References

  1. Wang, B.; He, J.; Lulu, C.; Dai, C.; Lijie, Z.; Xiahui, W. Utilization of rural domestic sewage as a resource: Progress, dilemmas, and future. J. Agric. Res. Environ. 2023, 40, 1255. [Google Scholar]
  2. Wang, C.; Feng, B.; Wang, P.; Guo, W.; Li, X.; Gao, H.; Zhang, B.; Chen, J. Revealing factors influencing spatial variation in the quantity and quality of rural domestic sewage discharge across China. Process Saf. Environ. Prot. 2022, 162, 200–210. [Google Scholar] [CrossRef]
  3. Wei, S.; Luo, H.; Zou, J.; Chen, J.; Pan, X.; Rousseau, D.P.; Li, J. Characteristics and removal of microplastics in rural domestic wastewater treatment facilities of China. Sci. Total Environ. 2020, 739, 139935. [Google Scholar] [CrossRef]
  4. Sheng, X.; Qiu, S.; Xu, F.; Shi, J.; Song, X.; Yu, Q.; Liu, R.; Chen, L. Management of rural domestic wastewater in a city of Yangtze delta region: Performance and remaining challenges. Bioresour. Technol. Rep. 2020, 11, 100507. [Google Scholar] [CrossRef]
  5. Zhang, J.; Jiang, Y.; Zhang, H.; Feng, D.; Bu, H.; Li, L.; Lu, S. A critical review of characteristics of domestic wastewater and key treatment techniques in Chinese villages. Sci. Total Environ. 2024, 927, 172155. [Google Scholar] [CrossRef]
  6. Chen, P.; Zhao, W.; Chen, D.; Huang, Z.; Zhang, C.; Zheng, X. Research progress on integrated treatment technologies of rural domestic sewage: A review. Water 2022, 14, 2439. [Google Scholar] [CrossRef]
  7. Khan, S.A.R.; Ponce, P.; Yu, Z.; Golpîra, H.; Mathew, M. Environmental technology and wastewater treatment: Strategies to achieve environmental sustainability. Chemosphere 2022, 286, 131532. [Google Scholar] [CrossRef]
  8. Rout, P.R.; Shahid, M.K.; Dash, R.R.; Bhunia, P.; Liu, D.; Varjani, S.; Zhang, T.C.; Surampalli, R.Y. Nutrient removal from domestic wastewater: A comprehensive review on conventional and advanced technologies. J. Environ. Manag. 2021, 296, 113246. [Google Scholar] [CrossRef]
  9. Zhong, L.; Ding, J.; Wu, T.; Zhao, Y.-L.; Pang, J.W.; Jiang, J.-P.; Jiang, J.-Q.; Li, Y.; Ren, N.-Q.; Yang, S.-S. Bibliometric overview of research progress, challenges, and prospects of rural domestic sewage: Treatment techniques, resource recovery, and ecological risk. J. Water Process Eng. 2023, 51, 103389. [Google Scholar] [CrossRef]
  10. Xie, Y.; Zhang, Q.; Wu, Q.; Zhang, J.; Dzakpasu, M.; Wang, X.C. Nitrogen removal efficiency and mechanisms of an improved anaerobic-anoxic–oxic system for decentralized sewage treatment. Bioresour. Technol. 2024, 393, 129976. [Google Scholar] [CrossRef]
  11. Vinardell, S.; Astals, S.; Peces, M.; Cardete, M.; Fernández, I.; Mata-Alvarez, J.; Dosta, J. Advances in anaerobic membrane bioreactor technology for municipal wastewater treatment: A 2020 updated review. Renew. Sust. Energ. Rev. 2020, 130, 109936. [Google Scholar] [CrossRef]
  12. Moreira, F.D.; Dias, E.H.O. Constructed wetlands applied in rural sanitation: A review. Environ. Res. 2020, 190, 110016. [Google Scholar] [CrossRef] [PubMed]
  13. Ghernaout, D.; Elboughdiri, N. Domestic Wastewater Treatment: Difficulties and Reasons, and Prospective Solutions-China as an Example. Open Access Libr. J. 2020, 7, 1–15. [Google Scholar] [CrossRef]
  14. Vymazal, J.; Zhao, Y.; Mander, Ü. Recent research challenges in constructed wetlands for wastewater treatment: A review. Ecol. Eng. 2021, 169, 106318. [Google Scholar] [CrossRef]
  15. Changsong, C.; Mingsen, W.; Li, J.; Ye, T. Design of modular constructed wetland and its effect on rural domestic sewage treatment. IOP Conf. Ser. Earth Environ. Sci. 2021, 657, 012011. [Google Scholar] [CrossRef]
  16. Choi, J.; Maniquiz, M.; Geronimo, F.; Lee, S.; Lee, B.; Kim, L. Development of a horizontal subsurface flow modular constructed wetland for urban runoff treatment. Water Sci. Technol. 2012, 66, 1950–1957. [Google Scholar] [CrossRef]
  17. Wei, T.; Zhao, Y.; Zhou, M.; Zhang, Z.; Wei, Y.; Núñez, A.E. Initial concept and embodiment to develop modular constructed wetland: A unique and promising solution to sustainability transitions in water management. J. Clean. Prod. 2024, 450, 141912. [Google Scholar] [CrossRef]
  18. Huang, Y.; Liu, Q.; Wu, H.; Su, L.; Ma, J.; Li, H. Enhancement of nitrogen removal by a modular design of vertical flow constructed wetlands with a plant carbon source: Optimization of carbon dosage for nitrogen removal, practicability evaluation and strategy exploration for water quality control. Chemosphere 2022, 306, 135560. [Google Scholar] [CrossRef]
  19. Ji, Z.; Tang, W.; Pei, Y. Constructed wetland substrates: A review on development, function mechanisms, and application in contaminants removal. Chemosphere 2022, 286, 131564. [Google Scholar] [CrossRef]
  20. Lu, S.; Zhang, X.; Wang, J.; Pei, L. Impacts of different media on constructed wetlands for rural household sewage treatment. J. Clean. Prod. 2016, 127, 325–330. [Google Scholar] [CrossRef]
  21. Li, J.; Zheng, B.; Chen, X.; Li, Z.; Xia, Q.; Wang, H.; Yang, Y.; Zhou, Y.; Yang, H. The use of constructed wetland for mitigating nitrogen and phosphorus from agricultural runoff: A review. Water. 2021, 13, 476. [Google Scholar] [CrossRef]
  22. Kataki, S.; Chatterjee, S.; Vairale, M.G.; Dwivedi, S.K.; Gupta, D.K. Constructed wetland, an eco-technology for wastewater treatment: A review on types of wastewater treated and components of the technology (macrophyte, biolfilm and substrate). J. Environ. Manag. 2021, 283, 111986. [Google Scholar] [CrossRef] [PubMed]
  23. Liu, C.; Li, X.; Yang, Y.; Fan, X.; Tan, X.; Yin, W.; Liu, Y.; Zhou, Z. Double-layer substrate of shale ceramsite and active alumina tidal flow constructed wetland enhanced nitrogen removal from decentralized domestic sewage. Sci. Total Environ. 2020, 703, 135629. [Google Scholar] [CrossRef] [PubMed]
  24. Wei, T.; Zhao, Y.; Guo, J.; Ji, B.; García, Á.P.; Núñez, A.E. Developing a novel lightweight substrate for constructed treatment wetland: The idea and the reality. J. Water Process Eng. 2024, 57, 104587. [Google Scholar] [CrossRef]
  25. de Carvalho Silva, L.; Bernardelli, J.K.B.; de Oliveira Souza, A.; Lafay, C.B.B.; Nagalli, A.; Passig, F.H.; Kreutz, C.; de Carvalho, K.Q. Biodegradation and sorption of nutrients and endocrine disruptors in a novel concrete-based substrate in vertical-flow constructed wetlands. Chemosphere 2024, 346, 140531. [Google Scholar] [CrossRef]
  26. Liu, X.; Li, X.; Zhang, X.; Zhao, H.; Wang, C.; Zhu, H.; Xiao, X.; Cao, S.; Liu, R. Research on the purification effect of major pollutants in water by modular constructed wetlands with different filler combinations. Water Sci. Technol. 2024, 89, 2090–2104. [Google Scholar] [CrossRef]
  27. Kong, L.; Wang, Y.; Xiang, X.; Zhou, L.; Zhang, P.; Wang, Q.; Li, Y.; Wei, J.; Li, L.; Cheng, S. Study on the impact of hydraulic loading rate (HLR) on removal of nitrogen under low C/N condition by modular moving bed constructed wetland (MMB-CW) system. Environ. Technol. Innovation 2024, 34, 103579. [Google Scholar] [CrossRef]
  28. Xiang, T.; Liang, H.; Gao, D. Insights into two stable mainstream deammonification process and different microbial community dynamics at ambient temperature. Bioresour. Technol. 2021, 331, 125058. [Google Scholar] [CrossRef]
  29. Gu, X.; Chen, D.; Wu, F.; Tang, L.; He, S.; Zhou, W. Function of aquatic plants on nitrogen removal and greenhouse gas emission in enhanced denitrification constructed wetlands: Iris pseudacorus for example. J. Clean. Prod. 2022, 330, 129842. [Google Scholar] [CrossRef]
  30. Widayati, W.; Setyawan, S.A.A.; Kurniati, E.; Rachmansyah, A.; Anugroho, F. Performance of vertical subsurface flow constructed wetland (VSSFCW) with T. angustifolia and I. aquatica for BOD and COD removal from tofu wastewater. J. Biol. Res. 2023, 29, 73–79. [Google Scholar] [CrossRef]
  31. Xu, S.; Cui, Y.; Yang, C.; Wei, S.; Dong, W.; Huang, L.; Liu, C.; Ren, Z.; Wang, W. The fuzzy comprehensive evaluation (FCE) and the principal component analysis (PCA) model simulation and its applications in water quality assessment of Nansi Lake Basin, China. Environ. Eng. Res. 2021, 26, 200022. [Google Scholar] [CrossRef]
  32. Patyal, V.; Jaspal, D.; Khare, K. Materials in constructed wetlands for wastewater remediation: A review. Water Environ. Res. 2021, 93, 2853–2872. [Google Scholar] [CrossRef] [PubMed]
  33. Wang, Y.; Cai, Z.; Sheng, S.; Pan, F.; Chen, F.; Fu, J. Comprehensive evaluation of substrate materials for contaminants removal in constructed wetlands. Sci. Total Environ. 2020, 701, 134736. [Google Scholar] [CrossRef]
  34. Lai, C.; Guo, Y.; Cai, Q.; Yang, P. Enhanced nitrogen removal by simultaneous nitrification-denitrification and further denitrification (SND-DN) in a moving bed and constructed wetland (MBCW) integrated bioreactor. Chemosphere 2020, 261, 127744. [Google Scholar] [CrossRef]
  35. Xu, D.; Ling, H.; Li, Z.; Li, Y.; Chen, R.; Cai, S.; Gao, B. Treatment of ammonium-nitrogen–contaminated groundwater by tidal flow constructed wetlands using different substrates: Evaluation of performance and microbial nitrogen removal pathways. Water Air Soil Pollut. 2022, 233, 159. [Google Scholar] [CrossRef]
  36. Lin, J.-Y.; Li, D.; Kim, M.; Lee, I.; Kim, H.; Huang, C.-P. Process optimization for the synthesis of ceramsites in terms of mechanical strength and phosphate adsorption capacity. Chemosphere 2021, 278, 130239. [Google Scholar] [CrossRef]
  37. Qi-yu, Z.; Zeng-jin, L.; Lai-sheng, L.; Na, L. Research on comprehensive evaluation model of rural domestic sewage treatment technology based on fuzzy comprehensive evaluation and analytic hierarchy process method. Water Pract. Technol. 2021, 16, 452–471. [Google Scholar] [CrossRef]
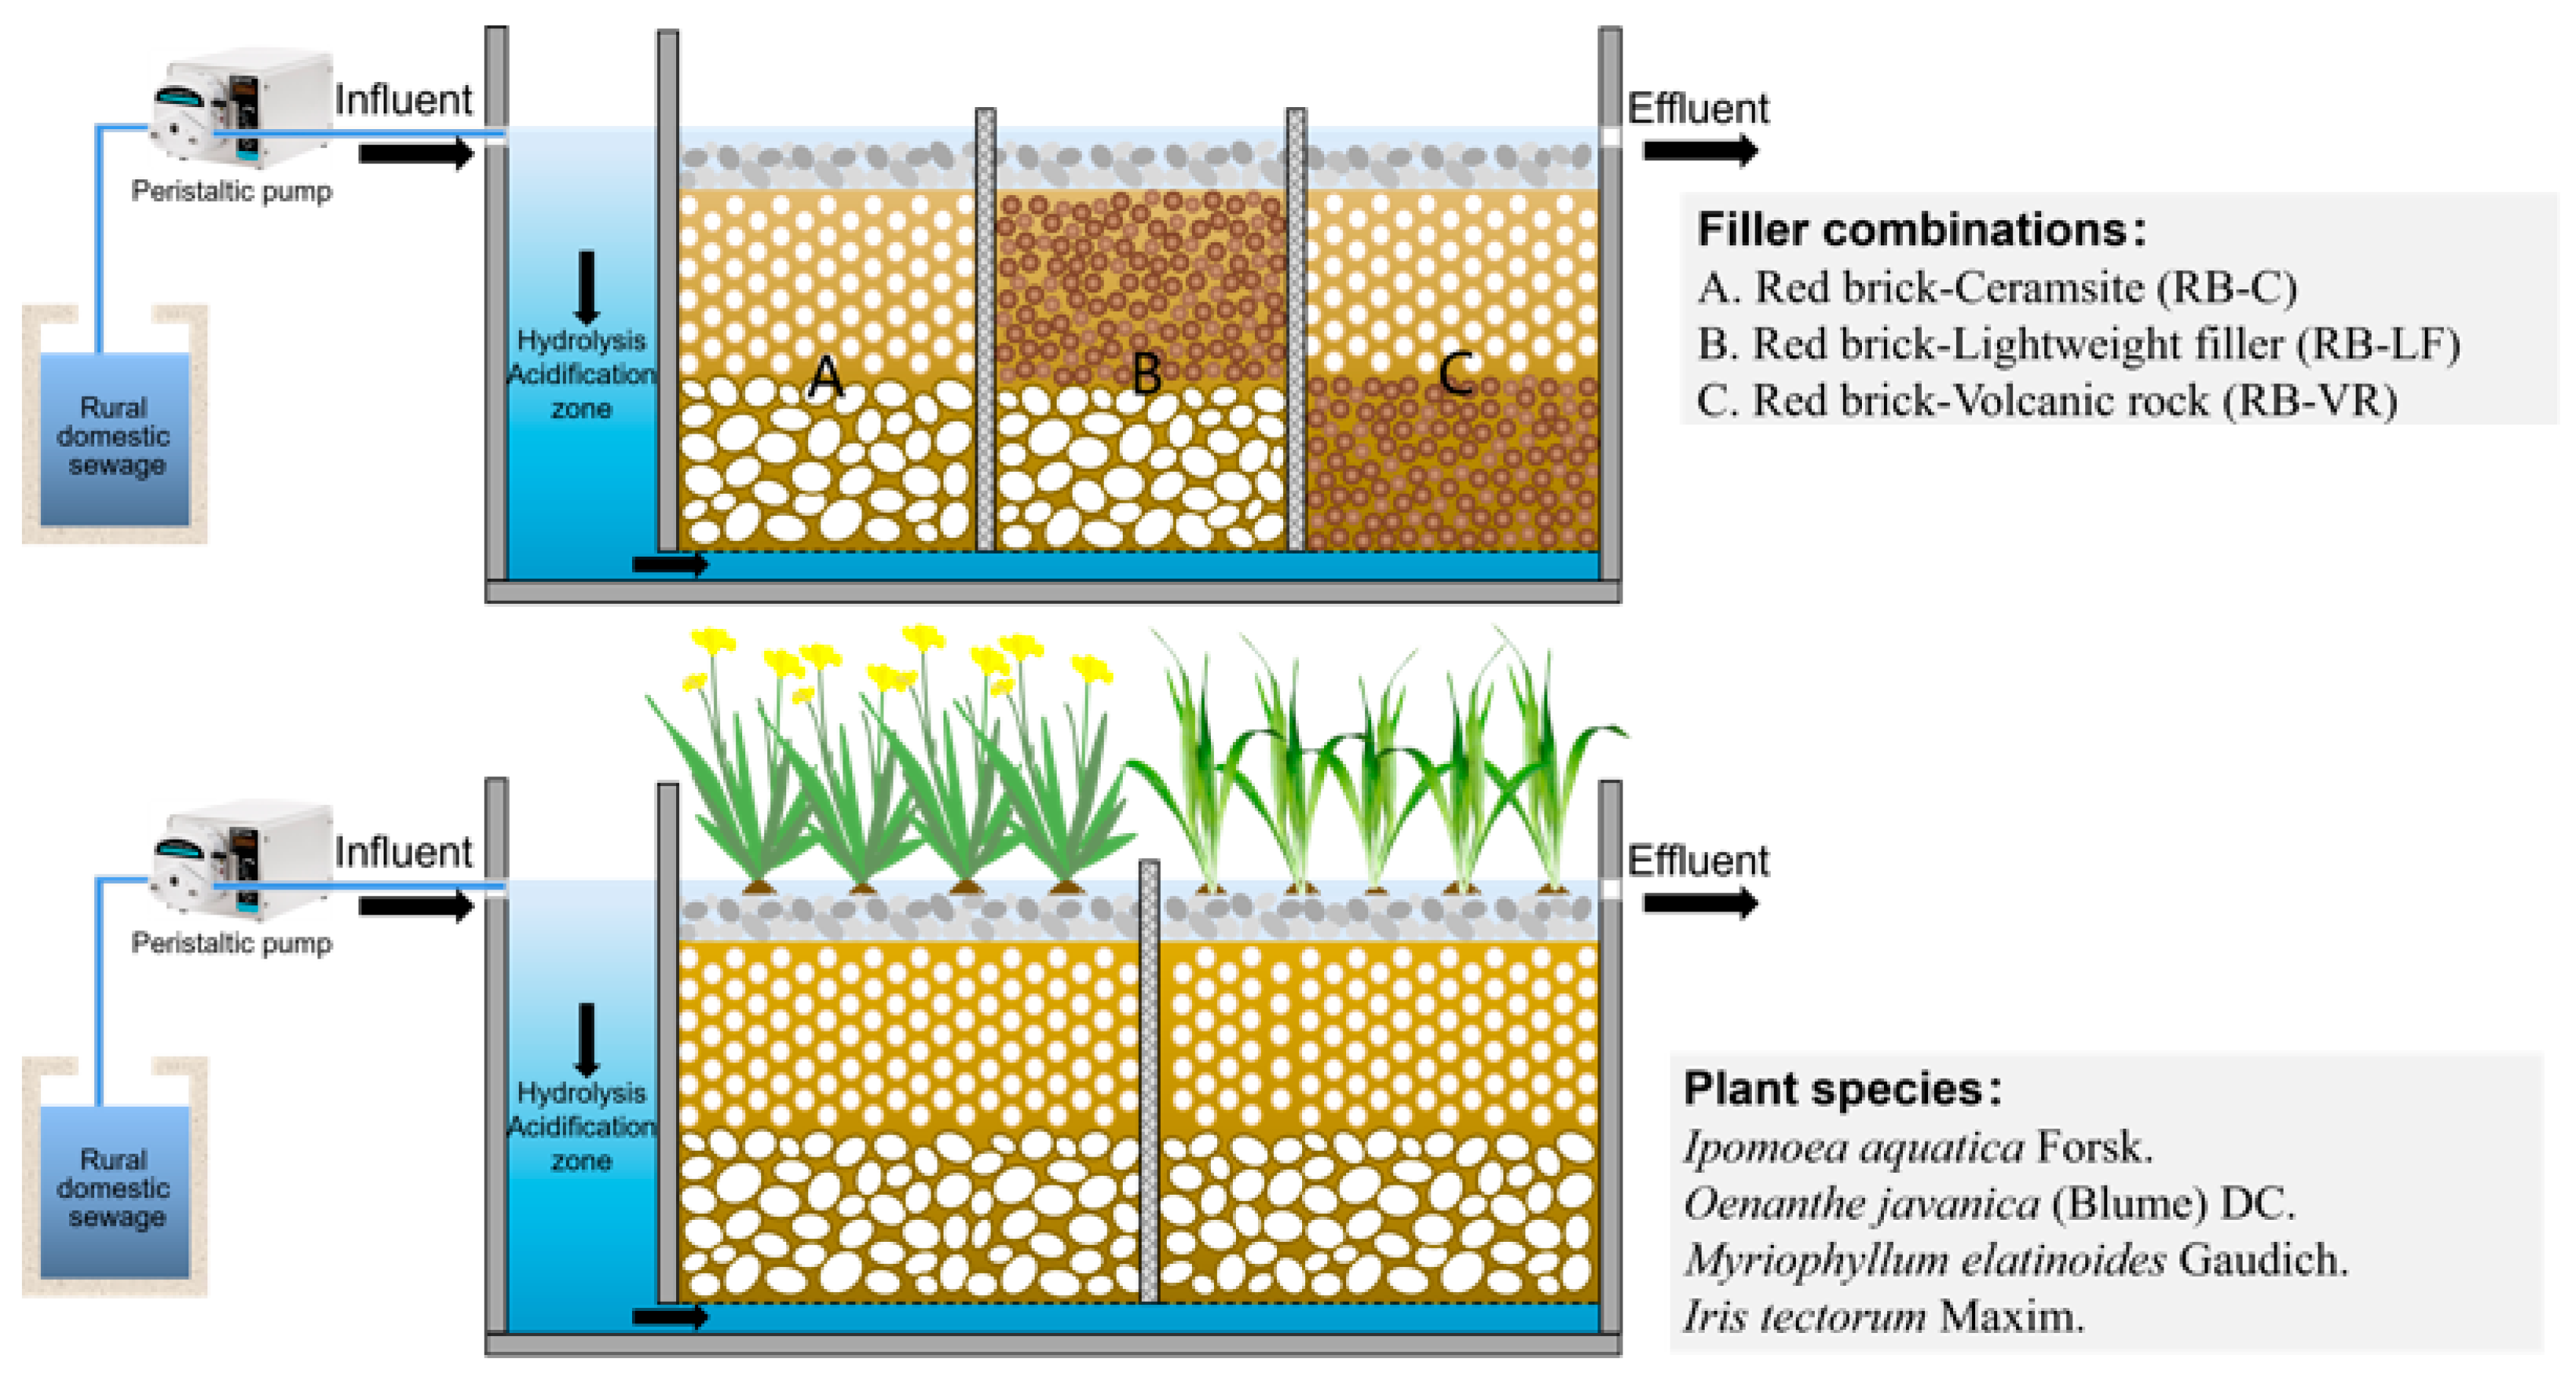
Figure 1. Schematic diagram of the HSSF-MCWs.
Sustainability 17 04427 g001
Figure 2. Location and treatment procedure of the PPP project (Phase III).
Sustainability 17 04427 g002
Figure 3. Influent/effluent water quality and pollutant removal in MCWs with different filler combinations (a) NH4+-N, (b) NO3-N, (c) TN, (d) TP, (e) COD.
Sustainability 17 04427 g003aSustainability 17 04427 g003bSustainability 17 04427 g003c
Figure 4. Influent/effluent water quality and pollutant removal in MCWs with different plants (a) NH4+-N, (b) NO3-N, (c) TN, (d) TP, (e) COD.
Sustainability 17 04427 g004aSustainability 17 04427 g004b
Figure 5. The assessment results of effluent water quality in different MCWs.
Sustainability 17 04427 g005
Figure 6. Variations in the proportion of different influent COD and NH4+-N concentrations with the seasons, Among them, (a) is COD and (b) is NH4+-N.
Sustainability 17 04427 g006
Figure 7. Effect of influent water quality on the effluent’s qualified rate.
Sustainability 17 04427 g007
Figure 8. Economic analysis of purification tanks at different scales.
Sustainability 17 04427 g008
Table 1. The sewage volume scale of the PPP project (Phase III).
Scale of Equipment (m3/day)Quantity of
Equipment
Total Scale of
Equipment (m3/day)
Design Sewage
Volume (m3/day)
110181018772.04
2295866.66
589445462.18
1068680607.21
1533495268.66
2019380364.81
Aggregate-30762541.6
Table 2. The weight coefficients of pollution factors.
Plant SpeciesTime (d)Pollution Factor
NH4+-NCODTPTN
I. aquatica20.09360.47560.16410.2668
40.07400.41730.18440.3242
60.08940.40270.19230.3156
80.10380.47730.16260.2563
100.14670.37270.19740.2831
120.11440.34300.23290.3096
140.12140.43670.17920.2628
160.10790.45250.16730.2723
180.08150.39490.20980.3139
200.06210.47730.16350.2972
220.09280.40350.20420.2995
240.07850.39550.21410.3120
260.09920.38070.20320.3170
280.06720.44460.18650.3017
300.07630.34570.24290.3351
O. javanica20.09570.58400.02800.2923
40.11570.50790.03590.3404
60.12480.44430.04740.3835
80.12420.57630.02700.2725
100.15300.48930.02950.3282
120.13740.45280.03530.3746
140.09360.53150.03690.3380
160.13300.43590.03270.3984
180.13960.49690.03540.3282
200.14930.53530.02610.2894
220.16080.48160.03170.3258
240.13880.45400.03690.3703
260.13180.41020.04200.4160
280.09400.56950.02580.3107
300.13640.48860.03180.3432
M. elatinoides20.08430.62280.02030.2727
40.11620.51400.02490.3449
60.10920.51030.02460.3559
80.11590.61500.01420.2549
100.08830.62300.01780.2710
120.09120.48340.02740.3980
140.09390.57100.02060.3144
160.14700.46620.03490.3518
180.10630.42800.03210.4336
200.09240.57950.01990.3083
220.13560.53950.01950.3054
240.11670.58470.01330.2854
260.09230.46910.02130.4172
280.11690.47670.02500.3814
300.11250.52560.02360.3383
I. tectorum20.08740.59480.03040.2875
40.11200.56410.02920.2947
60.12900.54580.02870.2965
80.11580.58820.01980.2761
100.16290.45200.02890.3562
120.11590.50580.03270.3456
140.09960.54790.02620.3263
160.10440.59220.02550.2780
180.14290.50930.03910.3087
200.13010.51380.03610.3199
220.15910.41790.03660.3865
240.11980.54450.02720.3086
260.13060.52650.02980.3131
280.12640.55920.02520.2892
300.12600.52490.03370.3154
Table 3. Distribution of equipment in towns.
Town/DistrictQuantity of Equipment
1 m3/day2 m3/day5 m3/day10 m3/day15 m3/day20 m3/day
Bixi district71-1821
Changfu district21-32--
Dongbang town68-----
Guli town59-4633
Haiyu town61-22-2
Meili town863121421
Shajiabang town11-----
Shanghu town180310712
Zhitang town190412831
Aggregate7471044471110
Disclaimer/Publisher’s Note: The statements, opinions and data contained in all publications are solely those of the individual author(s) and contributor(s) and not of MDPI and/or the editor(s). MDPI and/or the editor(s) disclaim responsibility for any injury to people or property resulting from any ideas, methods, instructions or products referred to in the content.