Article

The Synergistic Effect of the Dual Carbon Reduction Pilot on Corporate Carbon Performance: Empirical Evidence from Listed Manufacturing Companies

Business School, Shandong University, Weihai 264209, China
*
Author to whom correspondence should be addressed.
Sustainability 2025, 17(10), 4409; https://doi.org/10.3390/su17104409
Submission received: 22 March 2025 / Revised: 25 April 2025 / Accepted: 8 May 2025 / Published: 13 May 2025
(This article belongs to the Special Issue Effectiveness Evaluation of Sustainable Climate Policies)

Abstract

:
In recent years, a pressing global challenge has been that increasingly stringent environmental regulations have failed to prevent global climate change. In this context, exploring the synergistic effects of a policy mix approach has emerged as a promising strategy to turn the tide. Given that companies are the primary sources of carbon emissions, this study adopts a novel micro-level perspective. It employs the difference-in-differences method and establishes a two-way fixed effects model to empirically examine the interactive effects of the Low-Carbon City Pilot (LCCP) and the Carbon Emissions Trading Pilot (CETP) on corporate low-carbon development. Based on data availability and relevance, it uses a sample of Chinese listed industrial companies in 2007–2020. The findings indicate that the CETP enhances corporate carbon performance, whereas the LCCP has no significant impact on its own. However, the combined implementation of the two policies has resulted in a synergistic effect, with green innovation playing a mediating role in this process. The study also identifies the presence of a “green paradox” under heavily polluting industries and a weakening of the policies’ effectiveness in Western China and among non-high-tech firms. For emerging countries undergoing low-carbon transitions, it is essential to design context-specific policy combinations that maximize the effectiveness of environmental regulations.

1. Introduction

With the rapid expansion of the global economy, concerns about air pollution and climate change have become increasingly urgent. According to the World Meteorological Organization (WMO), the global average temperature in 2024 exceeded pre-industrial levels by approximately 1.55 °C, marking the first recorded breach of the critical 1.5 °C threshold [1]. As a result, the pursuit of green and low-carbon economic development has become a pressing global priority. Companies, as central actors in economic activity, play a dual role in it. On one hand, they contribute significantly to economic growth through their operations; on the other hand, their unregulated pursuit of profit has led to excessive carbon emissions [2]. To address this, governments have implemented environmental regulations to guide corporate behavior, serving as a vital mechanism for fostering sustainable corporate transitions. In this context, China has introduced policies such as the Low-Carbon City Pilot (LCCP) and the Carbon Emission Trading Pilot (CETP) to facilitate corporate engagement in green transformation.
These two initiatives—the LCCP and CETP—are collectively referred to as the Dual Carbon-Reduction Pilot (DCRP). By combining their complementary characteristics, they form a more comprehensive and effective policy framework [3]. Specifically, the LCCP represents a top-down administrative mechanism through which the central government assigns carbon reduction responsibilities to local authorities, encouraging them to experiment with innovative regulatory strategies for mitigating urban carbon emissions [4]. Meanwhile, the CETP introduces market-driven incentives by establishing emissions trading systems in select cities, fostering corporate engagement in carbon reduction [5]. Theoretically, the LCCP, as a guiding policy initiative, can create a supportive external environment for corporate low-carbon development [6]. Government intervention in policy implementation can mitigate potential market failures in the carbon trading system. In contrast, the CETP functions as a market-oriented constraint, providing internalized incentives and economic pressures that motivate firms to voluntarily reduce their carbon footprint [5]. Together, these mechanisms create a mutually reinforcing policy system in which government-led initiatives and market-based instruments interact dynamically, producing synergistic effects that enhance corporate green transformation [3]. Given this interdependence, evaluating either policy in isolation may underestimate their joint influence on corporate low-carbon behavior, potentially overlooking important benefits. Thus, a crucial question arises: is there really a “policy synergy” between these two initiatives in practice? If so, what are its underlying mechanisms? Clarifying these issues holds significant theoretical and practical implications for local governments aiming to optimize policy coordination, unlock interactive benefits, and strengthen support for green development in emerging economies.
To assess the effectiveness of such policies, a widely adopted indicator is corporate carbon performance [7], which reflects both a firm’s progress in low-carbon development and its capacity for sustainable growth. This metric captures the balance between carbon emissions, environmental impact, and economic performance [8]. From the perspective of carbon performance, prior research has shown that various environmental initiatives in China—such as the 12th Five-Year environmental regulations, green finance policies, low-carbon city initiatives, and carbon trading mechanisms—have exerted positive influences on firms’ carbon performance [9,10,11,12]. However, much of the literature has focused on the effects of individual policies [13,14,15]. Within the framework of the DCRP, recent scholarship has begun to investigate the combined impact of the LCCP and CETP, particularly regarding their synergistic effects on pollution control and carbon reduction [3,4]. Nevertheless, these studies have largely concentrated on macro-level outcomes, such as regional or city-level emissions, rather than micro-level corporate responses. To date, we have not yet found any scholars explicitly exploring their impact from a micro-level corporate perspective, highlighting an opportunity for this study. Furthermore, while the overall effectiveness of the LCCP and CETP in reducing pollution and emissions is well documented, some studies report inconsistent results [16], revealing the existence of a potential “green paradox” phenomenon [17,18]. These divergent findings suggest the need for a more nuanced, firm-level investigation to clarify the mechanisms and boundary conditions under which policy synergy can be effectively realized.
Therefore, this study aims to investigate the policy effects of the LCCP and the CETP on corporate carbon performance and further assess the synergistic effect arising from their joint implementation. Considering the substantial heterogeneity in regional economic conditions across China and the varying costs of green transition among firms, this study also seeks to determine whether the ‘green paradox’ may emerge under this policy mix. To this end, China is divided into eastern, central, and western regions, and firms are categorized based on whether they are high-tech enterprises or heavily polluting industries. Subgroup regressions are then employed to examine the heterogeneous effects of the DCRP across different geographic regions and firm characteristics. It adopts a micro-level corporate perspective for the first time to empirically test the synergistic effects and underlying mechanisms of the DCRP policies on corporate carbon performance. Utilizing a panel dataset of listed industrial firms in China from 2007 to 2020, we find that the CETP significantly improves corporate carbon performance, while the LCCP alone does not exhibit a significant short-term effect. However, when combined with the carbon emission trading mechanism, the LCCP strengthens its role in facilitating corporate low-carbon development, yielding a synergistic policy effect that exceeds the sum of the individual policies. Moreover, we find that the DCRP fosters corporate green innovation, which serves as a key channel through which these synergistic effects on carbon performance are realized. Nonetheless, our findings also reveal policy limitations: the effectiveness of the DCRP is attenuated in Western China and among non-high-tech firms, and the “green paradox” phenomenon is even observed in heavily polluting industries.
The potential contributions of this study are as follows. First, existing research on the synergy between the DCRP policies remains limited, with most studies focusing on the macro urban level [3,4]. The role of enterprises in urban pollution reduction and carbon mitigation has yet to be substantiated. This study innovatively adopts a micro-level corporate perspective to systematically analyze the synergistic effects of the LCCP and CETP, broadening the scope of policy synergy research. It also provides empirical evidence for the coordinated implementation of a national carbon trading market in China and offers policy insights for other emerging economies striving for green, low-carbon development. Second, this study delves into the mechanisms through which the DCRP influences corporate carbon performance, identifying the mediating role of green innovation in the transmission of policy effects. This finding enhances our understanding of the pathways through which policies shape corporate low-carbon development and provides recommendations for optimizing policy design. Finally, this study uncovers the heterogeneity of policy effects across different types of enterprises and regions, confirming the existence of the “green paradox” [9,11]. These findings offer a foundation for local governments to formulate differentiated policies tailored to various industries and regions.

2. Policy Background, Literature Review, and Research Hypotheses

2.1. Policy Background

In response to mounting pressures from climate change and the need to improve environmental quality, China has introduced a series of environmental policies that have been progressively refined through continuous policy experimentation. In the early stages, the focus was predominantly on command and control measures, such as the Air Pollution Prevention and Control Law enacted in 1987 and the Opinions on the Establishment of Acid Rain and SO2 Pollution Control Zones issued in 1998. In subsequent years, the emphasis of policies gradually shifted toward market-based environmental instruments, exemplified by the development of emissions trading schemes. In 2007, China released the National Program on Climate Change, identifying low-carbon development as a key priority and marking the beginning of its carbon reduction efforts. In alignment with its climate goals, China successively introduced LCCP policies and CETP policies starting in 2010. Most recently, the 2024 Central Economic Work Conference reaffirmed the country’s environmental agenda by calling for coordinated progress in carbon reduction, pollution control, ecological conservation, and sustainable development—underscoring the urgency of a full transition to a green economy. As two of China’s most significant carbon reduction policies, the CETP and LCCP provide valuable insights for emerging economies aiming to coordinate their own decarbonization efforts. Consequently, whether CETP and LCCP can generate synergistic effects and jointly support corporate green transformation remains a critical and timely question for further empirical investigation.
The LCCP program represents a key policy initiative undertaken by the Chinese government in response to the dual imperatives of climate change mitigation and sustainable development. As a critical instrument for achieving national greenhouse gas (GHG) emission reduction targets, the program employs a government-led approach that includes carbon emission monitoring, policy support, low-carbon industry planning, and public advocacy for environmentally friendly lifestyles. These mechanisms establish a top-down driving force that broadens the pathways for urban green and low-carbon transformation. In 2010, the Chinese government officially issued the Notice on Launching Low-Carbon Pilot Programs in Provinces and Cities, initiating pilot projects in five provinces and eight cities nationwide. In 2012, the program was expanded to include a second batch of low-carbon cities, followed by a third batch introduced in 2017. The primary criteria used by the National Development and Reform Commission (NDRC) for selecting low-carbon pilot regions were the enthusiasm of local governments and their representativeness in terms of economic and social development [19].
In contrast, the CETP policy was introduced to address the inefficiencies and high administrative costs associated with traditional regulatory approaches [20]. By leveraging market-based mechanisms, the CETP seeks to enhance the cost-effectiveness of achieving GHG reduction targets. Under this system, the government allocates carbon emission allowances to enterprises based on pre-established reduction objectives. Firms with surplus allowances can sell them in the carbon market, while those facing deficits must purchase additional allowances—thereby enabling an economically efficient reallocation of emissions rights and regulating overall urban carbon output. In 2011, the Chinese government issued the Notice on Launching Carbon Emissions Trading Pilot Programs, designating seven pilot regions. These programs became operational between 2013 and 2014, followed by the inclusion of Fujian Province as the eighth pilot region in 2016. In 2021, China officially established a national carbon emissions trading market.

2.2. Literature Review

2.2.1. The Effect of Environmental Policy

The theoretical foundation of environmental policy can be traced back to early economic theories, in which economists proposed the Pigovian tax and the Coase theorem, arguing that governments should internalize environmental externalities through taxation or market-based transactions to address challenges such as carbon emissions. As research in this field has advanced, two divergent perspectives have emerged in the academic debate on how environmental regulations influence carbon emissions.
One perspective affirms the positive effect of environmental regulation on carbon reduction, a view known as “forced emission reduction”. This perspective argues that environmental regulations can drive green technological innovation and industrial upgrading by raising environmental standards, eliminating inefficient firms, imposing fines and taxes, and offering subsidies and incentives, thereby reducing energy consumption and achieving emission reductions [21], although this process may at times be influenced by factors such as institutional circumstances [22]. In contrast, the opposing view supports the “green paradox” hypothesis [23], suggesting that environmental regulations may exacerbate carbon emissions. It argues regulatory interventions could accelerate fossil fuel extraction [19]. Specifically, when market participants anticipate that future environmental regulations will raise carbon emission costs, they may increase current carbon emissions to avoid greater future losses. Building on the “cost compliance theory”, some scholars contend that by internalizing environmental costs, environmental regulations increase corporate financial burdens, thereby constraining development driven by technological innovation [24]. To compensate for higher compliance costs, firms may expand production to achieve economies of scale and generate higher profits, which could ultimately lead to increased carbon emissions [25].
A synthesis of the existing literature indicates that the debate surrounding the effectiveness of LCCP policies and CETP policies has also coalesced into two competing viewpoints: “forced emission reduction” and the “green paradox”.
Regarding low-carbon city pilot policies, some scholars highlight their positive impact. Hong et al. (2022) found that such policies enhance energy efficiency and reduce carbon emissions by promoting green technological innovation and optimizing resource allocation [26]. Similarly, Pan et al. (2022) argued that by fostering an innovation-friendly environment and increasing environmental information disclosure, these policies stimulate green innovation [27]. Yu and Zhang (2021) also confirmed the positive role of the LCCP in improving carbon emission efficiency [28]. Conversely, some scholars point to unintended side effects. Cao et al. (2025) and Lyu (2023) find that while pilot cities experience a reduction in local carbon emissions, these policies simultaneously induce carbon leakage to neighboring non-pilot cities [29,30]. Moreover, Feng et al. (2021) report that the initial two phases of the LCCP program resulted in a short-term surge in urban carbon intensity [31].
Regarding CETP programs, there are two contrasting perspectives. On one hand, Chen and Lin (2021) argue that carbon trading significantly enhances carbon performance and serves as an effective tool for promoting energy conservation and emission reduction [32]. Similarly, Yang et al. (2021), through a study of ten provinces in Eastern China, found that the CETP significantly improved green production efficiency [14]. On the other hand, some scholars highlight potential drawbacks. Yang (2023) found that carbon emission regulations led to a crowding-out effect, in which productive investments displaced green investments, as profit-driven firms opted to purchase carbon allowances instead of investing in environmental initiatives [18]. Zhuo et al. (2024) further discovered that carbon emissions trading pilots contributed to increased carbon emissions in geographically and economically adjacent areas [33].
Given these divergent findings, a consensus has yet to be reached. Therefore, it is crucial to explore how the dual pilot of the LCCP and the CETP influences corporate carbon performance in the Chinese context and whether a potential “green paradox” effect exists.

2.2.2. Synergies of the Policy Mix

The interaction among multiple policy instruments often leads to diverse outcomes, including additive effects, antagonistic effects (less than additive), and synergistic effects (greater than additive) [34]. The study of the policy mix has become a critical tool for addressing contemporary challenges [35] and has gradually expanded across various disciplines [36]. Given their complementary mechanisms and implementation timelines, the LCCP policy and CETP policy are expected to generate a synergistic effect in carbon reduction, achieving an outcome in which “1 + 1 > 2”.
Existing research on carbon reduction policies primarily focuses on the macro urban level. For instance, Jia et al. (2024) and Jiang et al. (2024) identify a synergistic effect between the LCCP and CETP in reducing urban pollution and carbon emissions [3,4]. However, we have not yet found any scholars who have examined the interaction between these two key carbon reduction policies from a micro-level corporate perspective. Given the central role of firms in carbon reduction efforts, an in-depth analysis of their response to these policies is both practically significant and theoretically valuable.
Currently, there is no consensus on the methodology for assessing synergistic effects [4]. Jiang et al. (2024) evaluate synergy by comparing the effectiveness of the dual-pilot policy with that of single policies [3], while Zhang et al. (2023) test for synergy by examining the statistical significance of interaction terms between the two policies [37]. To ensure the robustness and reliability of our conclusions, this study adopts both approaches.

2.3. Research Hypotheses

2.3.1. The Impact of CETP on Corporate Carbon Performance

Carbon performance measures the alignment between a firm’s CO2 emissions and its operational efficiency, reflecting the extent of its low-carbon development. Carbon emissions trading can enhance corporate carbon performance by both reducing emissions and improving business performance [8].
On the one hand, due to the negative externalities of environmental pollution, firms often lack intrinsic motivation for emission reduction. The carbon emissions trading system addresses this by imposing emission caps, requiring firms that exceed their limits to purchase additional allowances in the market. This mechanism internalizes the external cost of pollution, discouraging reckless CO2 emissions. Additionally, firms with surplus allowances can sell them in the market, creating financial incentives to actively reduce emissions [5].
On the other hand, while pollution costs increase, the economic burden on firms exceeding emission limits is mitigated by the introduction of market mechanisms. Instead of facing potential production disruptions due to mandatory emission standards, non-compliant firms can simply purchase additional allowances in the carbon trading market, thereby avoiding greater financial losses [38].
Based on this, this paper proposes the following hypothesis:
Hypothesis 1.
The CETP enhances corporate carbon performance.

2.3.2. The Impact of LCCP on Corporate Carbon Performance

The LCCP influences corporate carbon performance primarily through enhanced supervision, policy support, and governance concept guidance. First, pilot cities allocate emission reduction targets to various districts and key enterprises, conducting ongoing assessments to track compliance and performance. This mechanism imposes constraints on corporate carbon emissions [4], compelling firms to adopt measures to improve carbon performance.
Additionally, since the national government has not established specific regional carbon peak timelines or industry-level emission quotas, pilot cities enjoy considerable autonomy in developing policies and supporting infrastructure tailored to local and sectoral characteristics. This flexibility provides ample room for firms to enhance their carbon performance [6].
Finally, pilot cities promote green initiatives that encourage cleaner production and foster low-carbon awareness among corporate management. By shaping corporate environmental attitudes, these initiatives stimulate intrinsic motivation for emission reduction and effectively curb non-compliant environmental behaviors [39]. As a result, firms, guided by green principles, voluntarily adopt low-carbon strategies to enhance their carbon performance.
Based on this, this paper proposes the following hypothesis:
Hypothesis 2.
The LCCP enhances corporate carbon performance.

2.3.3. Analysis of the Synergistic Effect of DCRP

Although the LCCP and CETP share the same overarching goal, their implementation paths differ significantly. These two policies interact across multiple levels, complementing each other’s strengths and creating the potential for a synergistic effect that exceeds the sum of their individual impacts—resulting in a “1 + 1 > 2” outcome.
First, the LCCP is a government-led administrative regulation, requiring policymakers to balance macro-level development objectives with micro-level firm-specific differences. This complexity increases governance challenges and regulatory costs. If the policy design is flawed or enforcement is inadequate, firms may engage in avoidance behaviors, thereby undermining the intended effectiveness of the initiative. In contrast, the carbon emissions trading system follows a market-driven approach, incentivizing firms to undertake emission reduction efforts voluntarily according to economic motivations. This mechanism enables emissions reduction at the lowest possible cost, which traditional regulatory measures may struggle to achieve [40]. However, the “emissions trading paradox” proposed by Jaehn and Letmathe (2010) highlights the risk of dominant market players manipulating allowance prices to disrupt the normal functioning of the trading system [41]. Therefore, integrating carbon trading with the LCCP can effectively mitigate the inherent risks of market-driven mechanisms—such as spontaneity, unpredictability, and delays—while preventing monopolistic firms from using their market position to hinder technological innovation or suppress the growth of low-carbon enterprises. Moreover, this integration helps curb collusive behaviors that might otherwise weaken corporate responsibility for emissions reduction.
Secondly, the LCCP primarily focuses on formulating long-term urban development strategies, promoting green and low-carbon governance concepts, and driving the transition towards low-carbon industrial structures [6]. However, this process often requires a prolonged period before delivering tangible results. In contrast, the introduction of the market-based mechanism in the CETP enables enterprises to participate in emission reduction efforts swiftly due to economic incentives, thereby compensating for the short-term effectiveness limitations of the LCCP.
Finally, the LCCP is a guiding low-carbon policy that emphasizes macro-level environmental planning and policy framework development, fostering a supportive external environment for green and low-carbon growth [4]. In contrast, the CETP operates as a market-driven regulatory tool, leveraging internal incentives and economic constraints to encourage firms to actively fulfill their emission reduction responsibilities. Given their distinct operational mechanisms, the integration of these two policies does not lead to conflicts due to overlapping scopes. Instead, it fosters an internal–external linkage that enhances carbon reduction synergies [42].
Based on this, this paper proposes the following hypothesis:
Hypothesis 3.
The DCRP enhances corporate carbon performance.

3. Materials and Methods

3.1. Model Specification

This study treats the dual-pilot policy of the LCCP and the CETP as an exogenous event, considering it a quasi-natural experiment. Policy evaluation is generally conducted using the difference-in-differences (DID) method. Given the staggered implementation timeline of the pilot programs, this study employs a staggered DID model to examine the impact of the DCRP on corporate carbon performance. Following the approach of Zhang et al. (2023), the following econometric models are constructed to test the hypotheses [37]:
C P i t = α 1 + α 2 C E T P i t + C o n t r o l i t + I d i + Y e a r t + ε i t ,
C P i t = β 1 + β 2 L C C P i t + C o n t r o l i t + I d i + Y e a r t + δ i t ,
C P i t = γ 1 + γ 2 D I D i t + γ 3 L C C P i t + γ 4 C E T P i t + C o n t r o l i t + I d i + Y e a r t + θ i t
In this model, C P i t represents the dependent variable, indicating the carbon performance of firm i in year t. L C C P i t and C E T P i t denote the LCCP policy and CETP policy, respectively. D I D i t is the interaction term of the two policies, serving as a dummy variable that indicates whether the DCRP was implemented in the city where firm i is located in year t. The coefficient γ 2 captures the effectiveness of the dual-pilot policy, reflecting the synergistic effect of LCCP and CETP in enhancing corporate carbon performance. C o n t r o l i t represents a set of control variables, while I d i and Y e a r t denote firm-specific and time-fixed effects, respectively. Finally, ε i t , δ i t , and θ i t are random error terms.

3.2. Variables

3.2.1. Dependent Variable

Corporate carbon performance (CP) serves as the dependent variable in this study. Generally, there are two main types of indicator specifications: absolute and relative carbon emissions [43]. Absolute indicators are typically represented by the total carbon emissions of a firm, reflecting its direct environmental impact. Relative indicators, on the other hand, link carbon emissions to business metrics, thereby illustrating the firm’s efficiency in resource utilization and its capacity for green development. In addition, some studies directly utilize carbon performance indices disclosed by rating agencies [44]. However, due to the relatively late development of carbon disclosure in China, there is a lack of uniformity in evaluation standards across agencies, and the data on Chinese firms also remain limited. Given that relative indicators improve comparability across firms and are more consistent with the research objectives of this study, carbon performance is measured by the ratio of operating revenue to carbon emissions following the approach of Clarkson (2011), with a higher value indicating better carbon performance [7]. Since direct data on corporate carbon emissions are unavailable, this study adopts the estimation method proposed by Ren et al. (2022), which approximates corporate carbon emissions based on industry-level emissions and corporate operating costs [45]. The calculation formula is as follows.
C P = C o r p o r a t e   o p e r a t i n g   r e v e n u e s C o r p o r a t e   o p e r a t i n g   c o s t s × I n d u s t r y   c a r b o n   e m i s s i o n s I n d u s t r y   o p e r a t i n g   c o s t s

3.2.2. Independent Variables

The independent variables in this study include the Low-Carbon City Pilot Policy (CETP), the Carbon Emission Trade Pilot Policy (LCCP), and their interaction term (DID) representing the effects of the dual pilot. Given the limited quantitative research on policy synergies, this study follows Zhang et al. (2023)’s method to define policy synergy variables, with the DID as the interaction term between the LCCP and the CETP [37]. Specifically, two dummy variables—LCCP and CETP—are created to indicate whether a firm operates within an LCCP or CETP region, respectively. For provincial-level pilot programs, all prefecture-level cities within the province are considered part of the pilot. The variables take a value of 1 starting from the year the firm’s city was designated as a pilot city and 0 otherwise.

3.2.3. Control Variables

Considering the potential impact of other firm characteristics on carbon performance and drawing on prior research [9,46], this study controls for firm-level characteristics, including corporate sales (LnSale), return on assets (ROA), the shareholding ratio of the largest shareholder (Top), leverage (Lev), cash flow (Cash), board size (Boardsize), and business growth (Growth). The variable descriptions are shown in Table 1 as follows.

3.3. Data

Following Jiang et al. (2024), this study limits the sample of Chinese A-share listed companies to the period from 2007 to 2020 to mitigate potential biases introduced by the establishment of China’s national carbon emissions trading market in 2021 [3], which may affect the estimation of single-pilot effects of CETP. The financial data of listed firms and industry-level carbon emissions data are sourced from the CSMAR database, while industry economic data are obtained from the CNRDS database. Data on policy implementation are manually compiled from official government sources.
The initial sample undergoes the following refinements: (1) non-industrial firms are excluded, as industrial activities are the primary source of carbon emissions; (2) firms categorized as ST or *ST, as well as those with missing data, are removed; and (3) to control for the influence of extreme values, all continuous variables are Winsorized. The final dataset comprises 20,673 firm-year observations from 2795 publicly listed companies.

4. Results and Discussion

4.1. Descriptive Statistics

The descriptive statistics of the variables are presented in Table 2. The standard deviation of CP is 62.91, with a minimum value of 0.16 and a maximum value of 270.66. The substantial standard deviation and the wide gap between the minimum and maximum values indicate significant variations in carbon performance across firms. The mean value of the DID is 0.26, suggesting that firms in the experimental group under the DCRP account for 26% of the total sample. This distribution reflects a reasonable and representative sample composition.

4.2. Univariate Difference Test

Table 3 compares the mean differences in corporate carbon performance between non-pilot firms and pilot firms. Specifically, Panel A, Panel B, and Panel C present the t-test results based on CETP, LCCP, and DID groupings, respectively. In these panels, Group 1 represents the control group (non-pilot firms), while Group 2 represents the experimental group (pilot firms). The results indicate that the mean corporate carbon performance of firms in the experimental group is significantly higher than that of firms in the control group.

4.3. Benchmark Regression

Table 4 presents the regression results examining the impact of the pilot policy on corporate carbon performance. Columns (1)–(2) assess the effect of the CETP on corporate carbon performance, with column (2) incorporating control variables beyond the baseline model in column (1). The coefficients for the CETP are 9.276 and 8.622, both statistically significant at the 1% level, indicating that the CETP significantly enhances corporate carbon performance, thus confirming Hypothesis 1. The CETP internalizes the externalities of carbon emissions. It improves corporate carbon performance by incentivizing firms to reduce emissions and enhance operational performance.
Columns (3)–(4) examine the LCCP, with column (4) introducing control variables. The results show that the coefficients for the LCCP are statistically insignificant, suggesting that the LCCP does not have a significant direct impact on corporate carbon performance. This finding contradicts Hypothesis 2 but is similar to the conclusions of Feng et al. (2021) [31]. A plausible explanation is that the LCCP fosters low-carbon development through structural transformation and low-carbon concept advocacy, which requires a longer timeframe to materialize, making it difficult to observe immediate effects on corporate carbon performance.
Columns (5)–(6) explore policy synergy by including the CETP, the LCCP, and their interaction, the DID. Column (6) adds control variables. The coefficients for the DID are 16.510 and 16.465, which are both statistically significant at the 1% level, indicating that the DCRP policy generates a positive synergy effect. The coefficients for the CETP and LCCP are simply the results of the model setting involving the interaction term and thus have limited standalone interpretive significance. The introduction of the CETP has activated the effectiveness of the LCCP in promoting corporate green development. As a result, firms are more motivated in the short term to adopt low-carbon practices advocated by the LCCP, thereby validating Hypothesis 3.
Among the control variables in columns (1)–(6), Top exhibits a significant negative effect on CP. The ownership concentration may enable major shareholders to exert control and hinder the adoption of green initiatives in order to protect the firm’s financial performance [47]. The positive effects of ROA and LEV on CP can be explained from the perspective of financial performance. An increase in LEV, within a certain range, can enhance firm performance [48], while a higher ROA reflects strong profitability. Since CP measures the amount of revenue generated per unit of carbon emissions, improvements in firm performance are reflected in enhanced carbon performance.

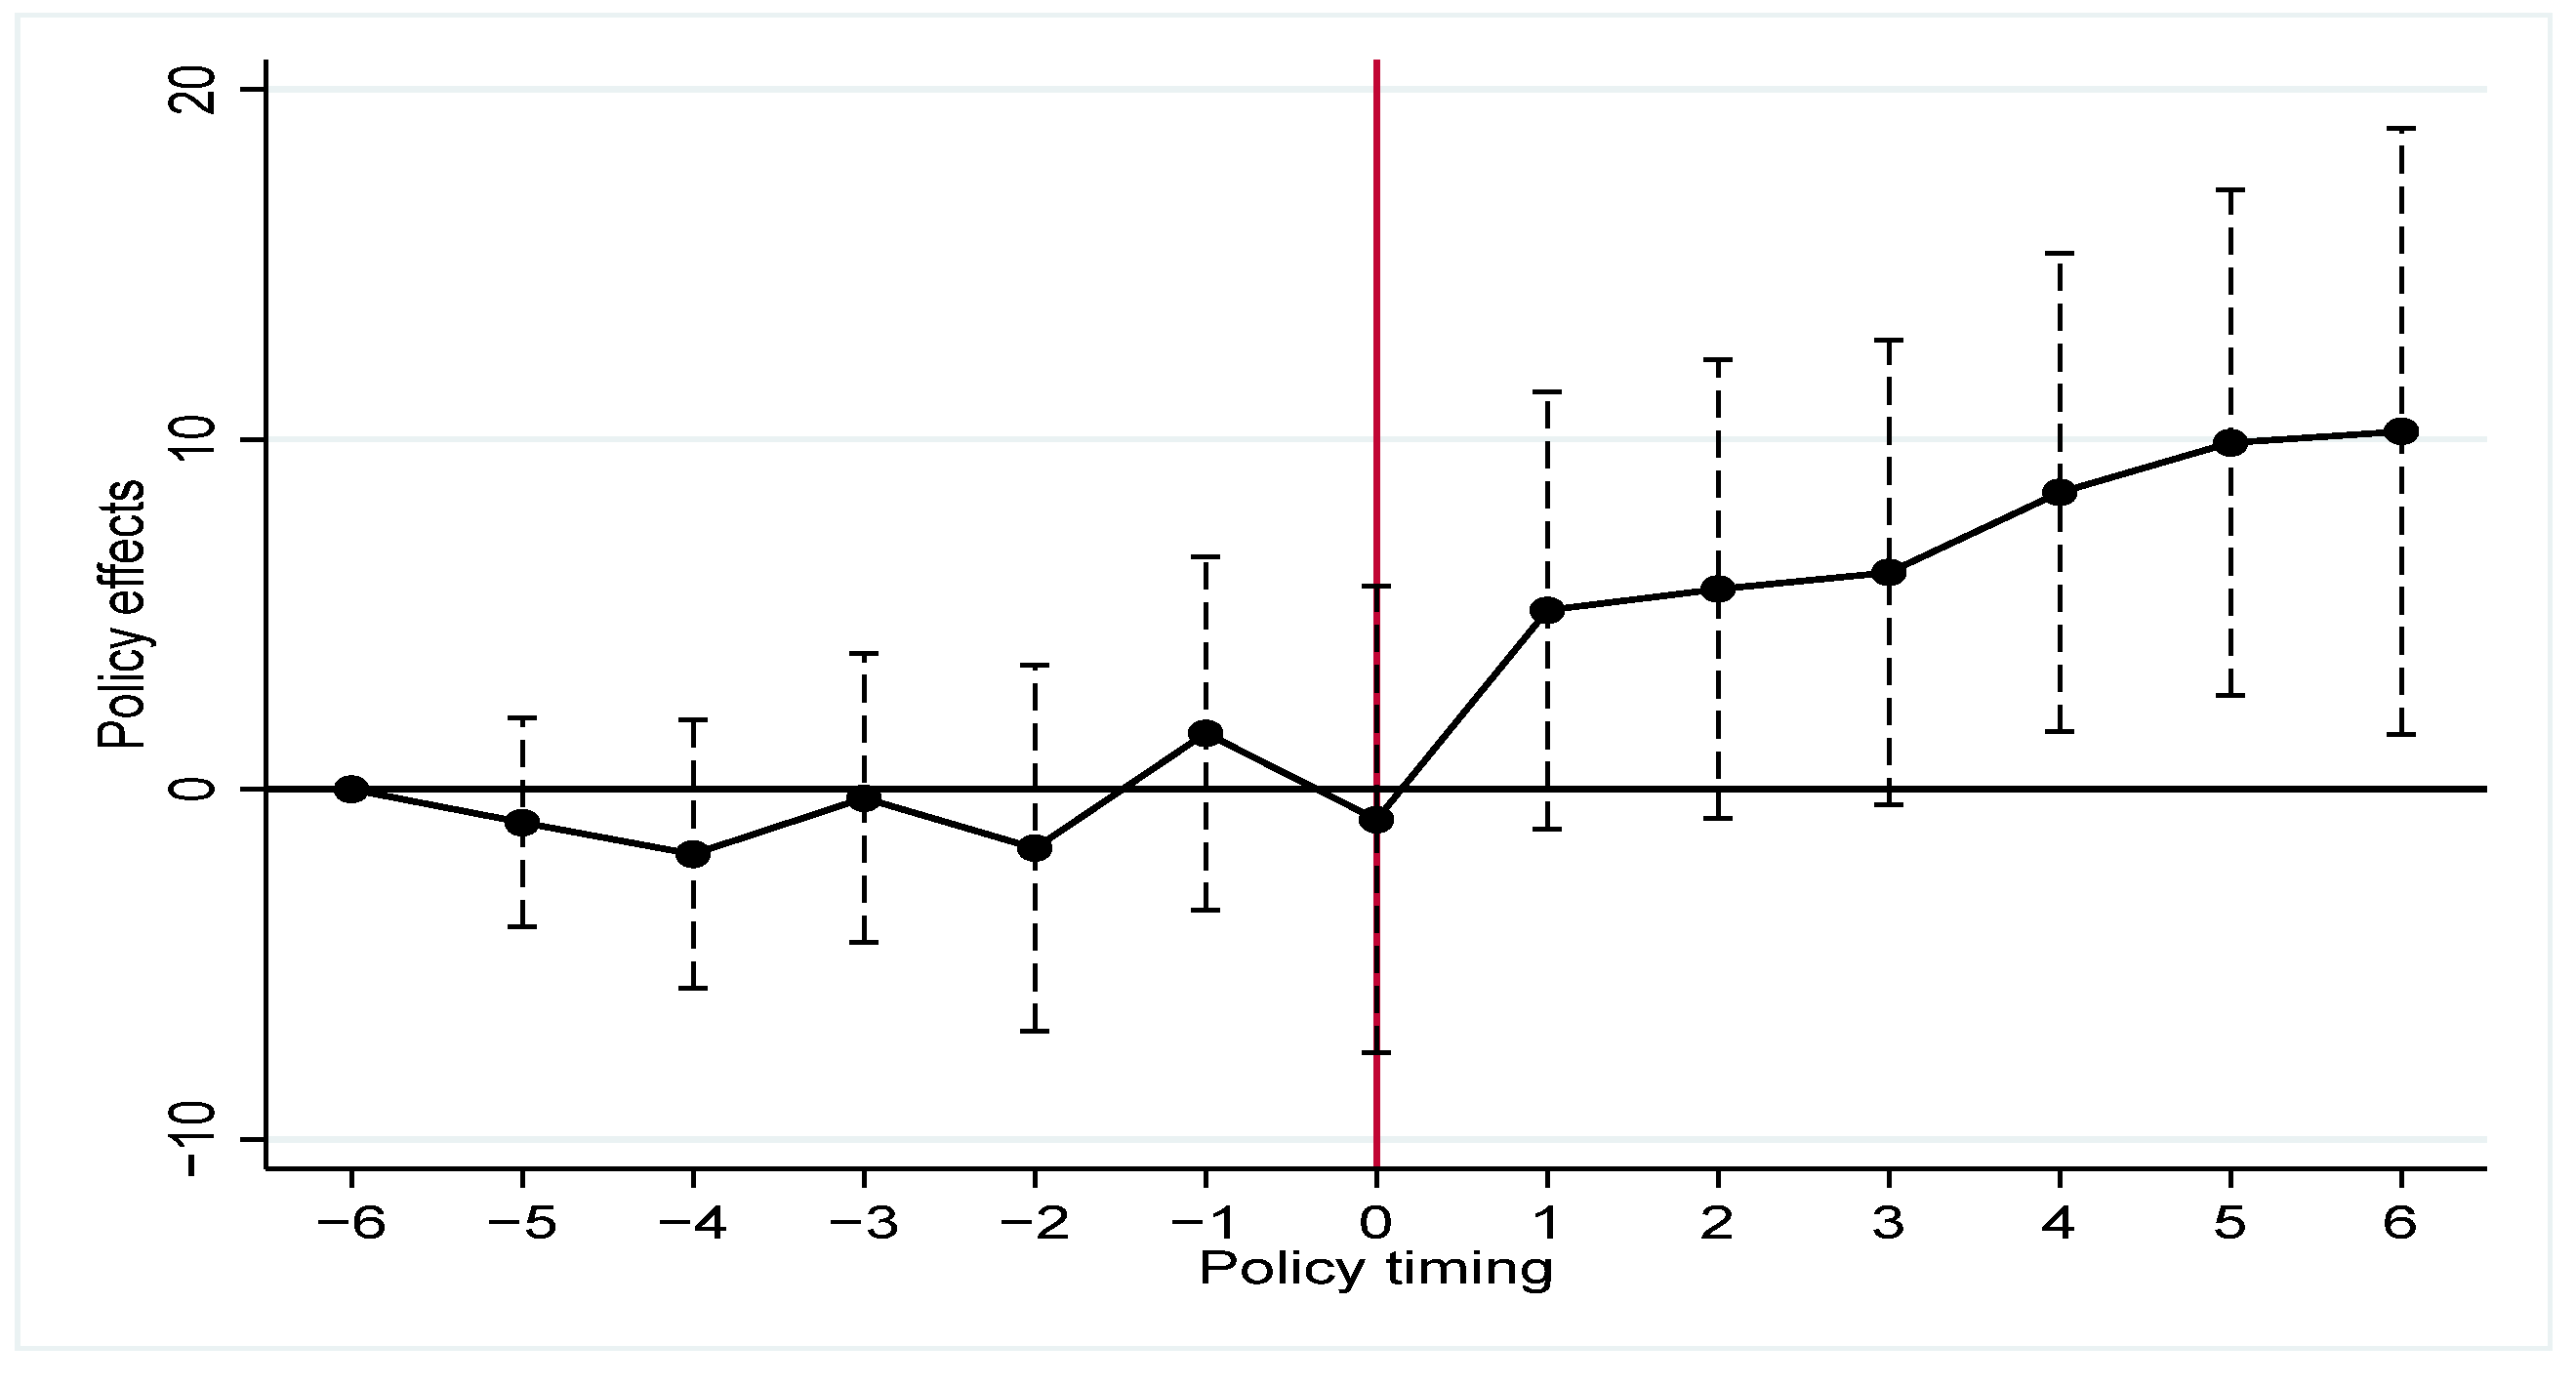
4.4. Parallel Trend Test

The validity of the baseline model relies on the parallel trends assumption, which requires that before the implementation of the DCRP policy, the time trends of corporate carbon performance in pilot and non-pilot regions remain as similar as possible. Figure 1, Figure 2 and Figure 3 present parallel trend tests for the CETP, LCCP, and their combined effect. The results indicate that, within a 90% confidence interval, the regression coefficients before policy implementation are not statistically significant. However, after the policies are enacted, the coefficients for the CETP and the interaction term become significantly positive, while the coefficient for LCCP becomes significantly positive three years post-implementation. These findings suggest that the parallel trends assumption holds, supporting the validity of the DID estimation.
The results further reveal that the CETP has a more immediate impact on corporate carbon performance, though its effect diminishes over time. In contrast, the LCCP demonstrates a delayed impact, with no significant short-term effect but a sustained upward trend over a longer period, aligning with theoretical expectations. The DCRP approach integrates the strengths of both policies, leading to a more rapid and enduring improvement in corporate carbon performance.

4.5. Robustness Test
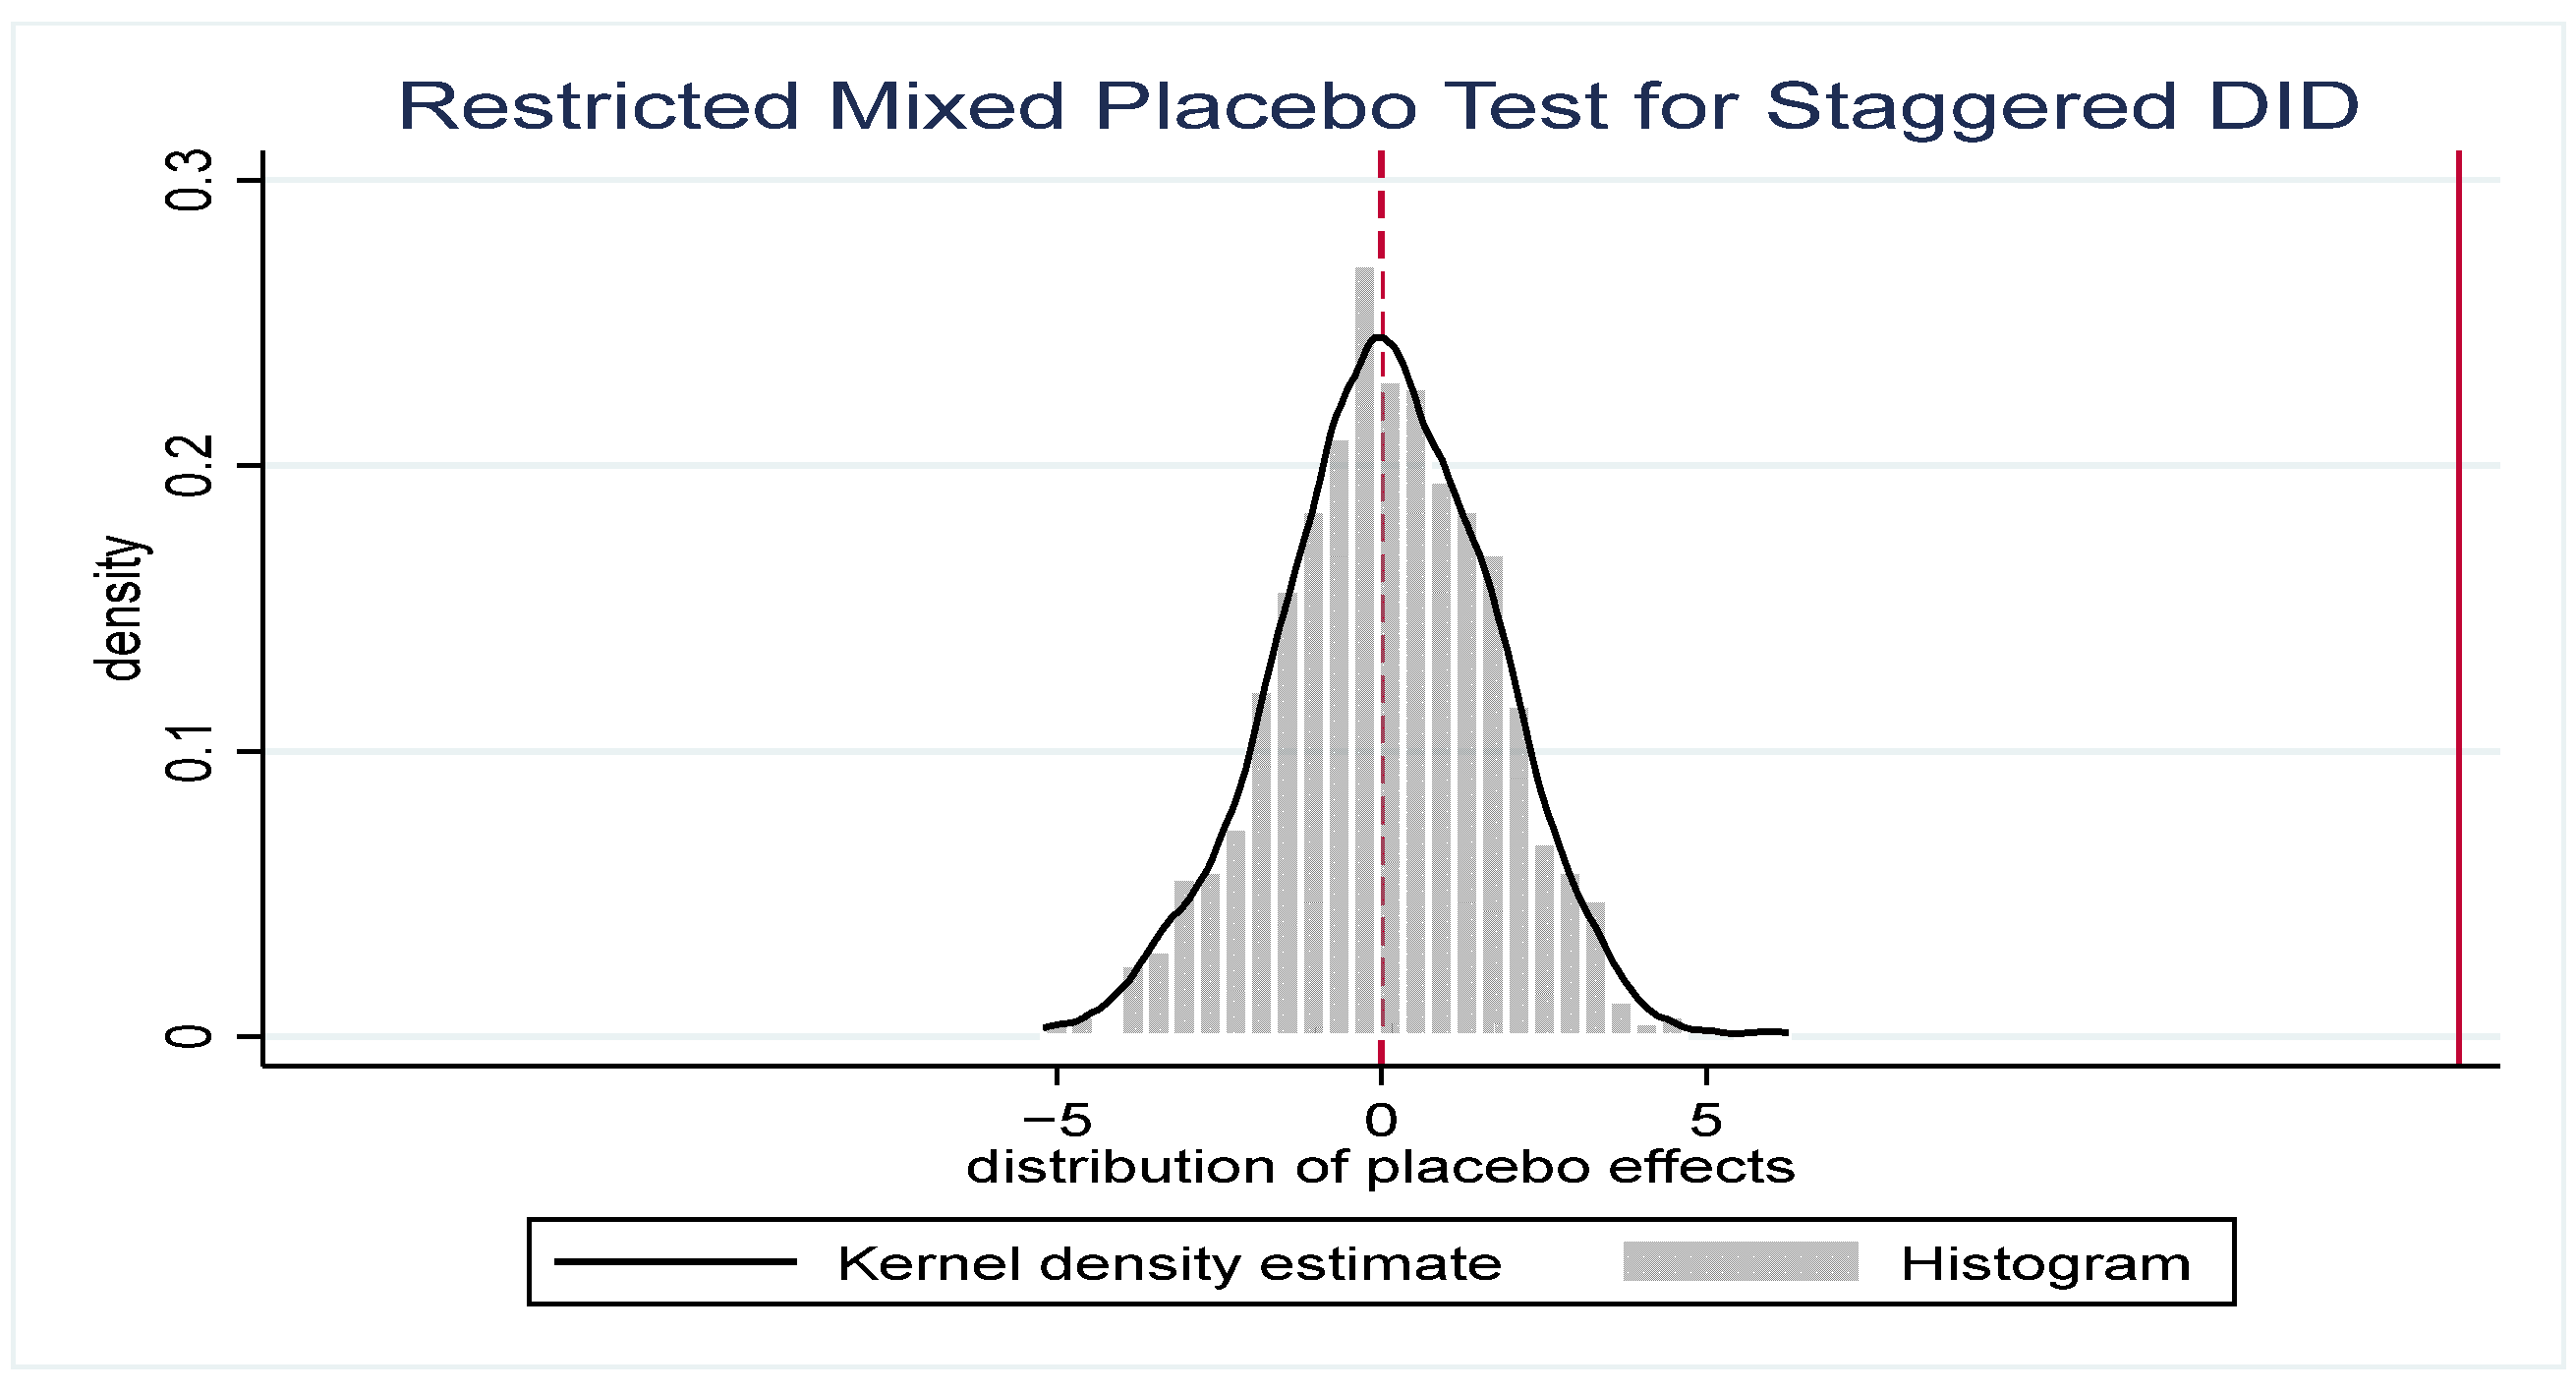
4.5.1. Placebo Test

To verify that the observed synergistic effects of the DCRP are not due to other random factors, both unrestricted and restricted mixed placebo tests are conducted. The unrestricted mixed placebo test assigns each unit in the sample a randomly selected pseudo-treatment time within the interval between the earliest and latest actual implementation times of the dual-pilot policies. In contrast, the restricted mixed placebo test preserves the original group structure based on treatment timing in the actual sample. Specifically, the number of units in each group is held constant, individuals are randomly reassigned to these groups, and a pseudo-treatment time is randomly assigned to each group. TWFE estimation is then performed under both approaches and repeated 500 times to obtain the distribution of the placebo effects. The results are presented in Figure 4 and Figure 5. The estimated treatment effect (vertical solid red line) lies at the extreme right of the placebo effect distribution, providing strong evidence against the null hypothesis that the treatment effect is zero, thus supporting the robustness of the baseline conclusions.

4.5.2. Adjust the Sample Structure

Given that directly governed municipalities enforce environmental policies differently from prefecture-level cities, we follow Qian et al. (2022) in excluding municipalities from the sample and re-estimating the model [49]. As shown in Table 5, column (1), the DID coefficient (19.803) remains significant at the 1% level, confirming the stability of the synergistic effect.

4.5.3. Change the Clustering Level

Since some pilots are implemented at the provincial level, firms within the same province may exhibit correlated policy responses. To address this, we adjust the clustering level to the provincial scale. The results, presented in Table 5, column (2), show the DID coefficient is 19.803 at the 1% level. After applying a more stringent clustering level, the synergistic effect remains significant.

4.5.4. Change the Test Method of Policy Synergistic Effect

Given that there are currently two main approaches to testing synergistic effects, this study re-estimates the model using an alternative method to ensure the robustness of the results. Following Jiang et al. (2024), we employ a stepwise comparative approach to assess policy synergy [3]. First, the direct effect of the DCRP is examined. As shown in Table 5, column (3), the DID coefficient is 10.186 and statistically significant at the 1% level, indicating a positive impact on corporate carbon performance. Moreover, its direct effect exceeds the simple additive effect of the two individual pilot programs observed in the baseline regression, indicating a synergistic interaction when the combined policy impact is greater than the sum of its parts.
Second, to differentiate between dual-pilot and single-pilot effects, we exclude firms in cities that were not designated as either pilot type and re-estimate the regression. The results, in column (4) of Table 5, show a DID coefficient of 8.037, significant at the 5% level, confirming that the dual-pilot policy is more effective than the single-pilot policy.
Finally, columns (5) and (6) of Table 5 compare the dual-pilot policy separately with the CETP and LCCP. Specifically, we first retain only the firms under the CETP and conduct a regression, followed by a separate regression only including the firms under the LCCP. The results show that the DID coefficients are 8.507 and 8.028, respectively, which are significant at the 1% and 5% levels. This indicates that implementing one pilot policy on top of the other significantly enhances policy effectiveness. These findings further confirm the presence of a notable synergistic effect in the DCRP policy.

4.6. Endogenous Analysis

4.6.1. PSM-DID

To address the potential endogeneity issue arising from the non-random selection of pilot regions, we adopt the propensity score matching (PSM) approach following Pan et al. (2022) [27]. Using 1:1 nearest-neighbor matching, we minimize selection bias and approximate randomized allocation. Table 6 reports the matching results, showing that all standardized biases are below 10%, and the t-tests fail to reject the null hypothesis of no systematic difference between the groups. The post-matching regression results in column (1) of Table 7 confirm that the DID coefficient remains significantly positive at the 1% level. After accounting for the potential impact of non-random selection, the synergistic effect remains statistically significant.

4.6.2. Eliminating Policy Factors

Other policies implemented during the same period, such as the “New Energy Demonstration City” policy and the “Broadband China” policy, may influence corporate carbon performance. The New Energy Demonstration City policy (NEDCP) promotes the adoption of renewable energy technologies, potentially constraining corporate carbon emissions [50]. Meanwhile, the Broadband China policy (BCP) enhances network infrastructure, facilitating regulatory oversight by both the government and the public, which may improve corporate management and, in turn, impact carbon performance [51]. To account for these potential confounding factors, we re-estimate the regression while controlling for these policies. The results, shown in columns (2) and (3) of Table 7, indicate that the DID coefficients remain significantly positive at the 1% level (16.181 and 16.122, respectively), confirming the robustness of the policy synergy effect.

4.6.3. Lagged Independent Variable

To mitigate concerns about reverse causality and enhance the reliability of the regression results, we follow the approach of Yang et al. (2023) and introduce a one-period lag for all key explanatory and control variables [52]. The re-estimated regression results, presented in column (4) of Table 7, show that the DID coefficient remains significantly positive at the 1% level (15.516), suggesting that the baseline findings are not driven by reverse causality.

4.6.4. IV Method

While this study employs multiple strategies to address endogeneity, corporate carbon performance remains subject to various external influences, potentially leading to omitted variable bias. To enhance empirical reliability, we adopt an instrumental variable (IV) approach, drawing on Hering and Poncet (2014) and Hong et al. (2022) [26,53]. The selected instruments, ventilation coefficient (Ventilation) and river density (River), capture environmental and geographical conditions that influence regulatory intensity but are unlikely to directly affect firm-level carbon performance.
The ventilation coefficient reflects meteorological conditions that influence the dispersion rate of pollutants in the atmosphere. Given a fixed level of pollutant emissions, cities with lower ventilation coefficients experience weaker air circulation, leading to slower pollutant dispersion and higher detected pollution concentrations. Consequently, governments in such cities are more likely to impose stricter environmental regulations, increasing the probability of being selected for the LCCP and CETP. Similarly, river density is associated with urban transportation infrastructure—cities with a higher river density tend to have more accessible transportation networks, making them attractive for industrial investment. However, this also results in higher pollution levels, prompting central and local governments to establish more environmental monitoring stations [54,55]. Additionally, a greater river density implies a larger water surface area, leading to stronger public scrutiny and greater pressure on local governments to implement pollution control measures. This, in turn, increases the likelihood of stricter environmental regulations and selection for carbon reduction pilot programs [55]. Since the ventilation coefficient and river density are natural factors with no direct correlation to corporate carbon performance, they meet the exogeneity requirement for valid instrumental variables.
The ventilation coefficient data are sourced from the European Centre for Medium-Range Weather Forecasts (ECMWF) ERA dataset, matched with the geographical coordinates of Chinese cities to obtain wind speed data at a height of 10 m within the boundary layer. The ventilation coefficient is calculated as the product of the wind speed and boundary layer height. River density data are obtained from the National Geospatial Information Center. Since the river density remains constant over time, it interacts with the time trend when incorporating it into the model as an instrumental variable.
Table 8 presents the results of the two-stage least squares (2SLS) regression. The Kleibergen–Paaprk LM statistic, Wald F-statistic, and Hansen test results indicate that the instrumental variables do not suffer from under-identification, weak instrument bias, or over-identification issues. After accounting for potential endogeneity between the DCRP carbon reduction policy and corporate carbon performance, column (2) shows that the DID coefficient remains significantly positive, further supporting the conclusion that the DCRP policy effectively enhances corporate carbon performance.

4.7. Mechanism Analysis

The preceding analysis has demonstrated that the DCRP policy exerts both direct and synergistic effects on corporate carbon performance. To further elucidate the specific mechanisms through which these policies influence corporate carbon performance, the following section examines the transmission pathways. Green innovation represents a firm-level environmental initiative driven by multiple factors, enabling companies to enhance key indicators of sustainable development [56,57,58]. On the one hand, the LCCP and CETP impose stringent constraints on corporate carbon emissions, increasing pollution-related costs. According to the Porter hypothesis, innovation can enhance resource productivity, offset compliance costs, and, when environmental policies are well designed, incentivize firms to pursue green innovation, ultimately contributing to low-carbon development [59]. On the other hand, a key objective of environmental policies is to stimulate technological innovation [60]. Pilot cities promote green innovation by fostering market information exchange on green technologies, shaping low-carbon mindsets, and implementing incentives such as tax reductions [6,61]. These mechanisms create a supportive environment for corporate green innovation, thereby improving corporate carbon performance.
To mitigate potential endogeneity concerns and control for unobservable factors, this study employs a relative measure of innovation—the ratio of independently filed green invention patents to total patent applications in a given year (GP)—as a mediating variable. After removing missing values, the regression analysis is conducted. Table 9 presents the results of the mediation effect test using the three-step method proposed by Baron and Kenny (1986) [62]. Column (1) reports the impact of the DCRP on corporate carbon performance, with a DID coefficient of 11.493, which is statistically significant at the 1% level, indicating that the DCRP significantly enhances corporate carbon performance. Column (2) examines the effect of the policy on corporate green innovation, yielding a DID coefficient of 0.01, significant at the 5% level, suggesting that the policy significantly fosters corporate green technology innovation. Column (3) incorporates the mediating variable into the regression model, showing that the DID coefficient (11.434) for the LCCP remains significant at the 1% level, while green innovation also exhibits a statistically significant coefficient of 5.901 at the 5% level. Given that the DID coefficient (11.434) in column (3) is slightly lower than that (11.493) in column (1), these results indicate that green innovation partially mediates the relationship between the DCRP and corporate carbon performance.

4.8. Heterogeneity Analysis

4.8.1. Enterprise Pollution Intensity Heterogeneity

The “green paradox”, first proposed by Sinn (2008) [23], describes the counterintuitive effect wherein environmental regulations lead to increased carbon emissions. As governments impose restrictions on fossil fuel consumption, traditional energy markets may anticipate declining future profitability and respond by increasing current energy supply [63]. At the corporate level, a critical question emerges: do enterprises highly dependent on traditional energy sources respond to expected increases in future emissions costs by temporarily increasing short-term emissions, thereby triggering a “green paradox”? To explore this, the sample firms are categorized into high- and low-pollution groups based on the Industry Classification Management Directory for Environmental Inspection of Listed Companies, and a subgroup regression analysis is conducted.
The results, presented in Table 10, show that in the low-pollution group (column 1), the DID coefficient is 10.515 and statistically significant at the 1% level. In contrast, for the high-pollution group (column 2), the DID coefficient is −1.461, also statistically significant at the 1% level. The seemingly unrelated estimation (SUEST) test confirms that the difference between the two coefficients is significant at the 1% level, suggesting that under certain conditions, the “green paradox” effect may emerge. Firms with a high degree of reliance on traditional energy sources experience a decline in carbon performance following policy implementation, while for low-pollution firms, the LCCP and CETP policies significantly enhance carbon performance.
Overall, the findings indicate that while the DCRP policies effectively target low-pollution enterprises, the “green paradox” persists in high-pollution industries. The underlying mechanism may be that low-pollution firms can transition to low-carbon operations at a lower cost, whereas high-pollution firms, facing substantial economic dependence on carbon emissions, may have stronger incentives to accelerate emissions in the short term to preempt higher future compliance costs when faced with stricter environmental policies, thereby reinforcing the “green paradox” phenomenon.

4.8.2. Regional Heterogeneity

China exhibits significant regional disparities. The eastern region, characterized by advanced economic development, demonstrates a higher level of efficiency in resource allocation and a greater green innovation capacity, enabling firms to adapt more readily to environmental regulations. In contrast, due to differences in economic development stages and resource endowments, the stringency of environmental regulations enforced by local governments tends to decrease progressively from central to western regions [7]. To assess whether the LCCP and CETP policies influence corporate carbon performance differently across regions, this study categorizes firms into eastern, central, and western groups (the eastern region includes Beijing, Tianjin, Hebei, Liaoning, Shanghai, Jiangsu, Zhejiang, Fujian, Shandong, Guangdong, Guangxi, and Hainan; the central region includes Shanxi, Inner Mongolia, Jilin, Heilongjiang, Anhui, Jiangxi, Henan, Hubei, and Hunan; and the western region includes Sichuan, Chongqing, Guizhou, Yunnan, Tibet, Shaanxi, Gansu, Ningxia, Qinghai, and Xinjiang) and conducts a subgroup regression analysis.
The results, presented in columns (3)–(5) of Table 10, indicate that the DID regression coefficients for firms in the eastern and central regions are 8.541 and 11.654, statistically significant at the 1% and 10% levels, respectively. However, the DID coefficient for firms in the western region is −3.454, significant at the 10% level. The SUEST test results reveal no significant difference between the coefficients for the eastern and central regions, while the differences between the eastern and western regions, as well as between the central and western regions, are statistically significant at the 1% level. The eastern and central regions of China exhibit relatively higher levels of economic development, with greater public oversight of urban carbon emissions and more stringent governmental enforcement. As a result, firms in these regions are more likely to proactively adopt carbon reduction measures in response to external pressures following the implementation of green regulations. Moreover, compared to the western region, the eastern and central regions have a lower concentration of heavily polluting enterprises that are highly dependent on fossil fuels, thereby reducing the likelihood of a “green paradox” effect arising from environmental regulations.

4.8.3. Heterogeneity in Enterprises’ Technological Attributes

Green technology innovation plays a crucial role in the impact of the DCRP on corporate carbon performance. High-tech firms, characterized by frequent innovation activities and intensive knowledge resources, are well positioned to leverage their existing R&D capabilities, enabling them to respond more swiftly to environmental regulations and engage in green technology innovation. In contrast, non-high-tech firms, which are predominantly concentrated in traditional industries with substantial energy demands, face greater challenges in restructuring their energy consumption patterns within a short period. As a result, the effects of the DCRP policies may differ significantly between these two types of enterprises. To explore whether the policy effects differ based on technological attributes, this study classifies firms into high-tech and non-high-tech groups according to the Administrative Measures for the Recognition of High-Tech Enterprises and conducts a subgroup regression analysis.
The results, presented in Table 10 (columns 6–7), indicate that the DID coefficient for non-high-tech firms (column 6) is not statistically significant, whereas the coefficient for high-tech firms (column 7) is 12.821, which is significant at the 1% level. Additionally, results from the SUEST test confirm that the difference between the two groups is statistically significant at the 1% level. These findings suggest that the DCRP policies have a more pronounced impact on improving carbon performance among high-tech firms compared to their non-high-tech counterparts. High-tech enterprises are primarily concentrated in emerging technology sectors, in which the cost of abandoning traditional energy sources for green transformation is relatively low. Leveraging their advantages in innovation, these firms can rapidly upgrade their production technologies, achieving both a green transition and economic gains, thereby enhancing their carbon performance.

5. Conclusions and Policy Recommendations

With the continuous implementation of carbon reduction policies in China, assessing the interactions between different policies has become critical for policy optimization and future development. This study utilizes a dataset of publicly listed industrial firms from 2007 to 2020 to evaluate the synergies between the LCCP and CETP policies, which innovatively extends the research scope of the dual-pilot policy synergies to the micro level. This study identifies the potential for environmental regulations to induce a green paradox under certain conditions, thereby enriching our theoretical understanding of the unintended consequences of environmental regulation and providing empirical support for the green paradox theory. The results suggest that the dual implementation of the LCCP and CETP yields greater benefits than either policy independently, producing a synergistic effect. But the standalone implementation of the LCCP does not have a significant impact on corporate carbon performance. Further analysis indicates that corporate green innovation mediates this relationship. However, the study also finds that policy effectiveness is context-dependent—firms with a high degree of reliance on traditional energy sources and heavily polluting industries are more prone to the green paradox, while the impact of these policies is less pronounced in western regions and non-high-tech firms.
The findings of this study yield several policy implications:
First, we recommend enhancing the coordinated design and implementation of low-carbon policies. The results indicate that the synergistic effects of the LCCP and CETP policies can significantly improve corporate carbon performance. Therefore, policymakers may need to prioritize the joint implementation of these two policies, ensuring they complement each other during their execution. Particularly for emerging economies transitioning toward green development, a holistic approach that aligns policies with national characteristics and corporate needs can help establish a complementary policy framework that maximizes effectiveness while minimizing potential inefficiencies from isolated policy implementation.
Second, we advise promoting green innovation as a key policy pathway. This study highlights the critical mediating role of green innovation in the effectiveness of low-carbon policies, with technology-intensive enterprises demonstrating a stronger response to these policies. Consequently, governments may consider leveraging fiscal incentives, such as tax reductions and R&D subsidies, to strengthen support for green technology development. Encouraging businesses to pursue technological innovation in low-carbon transitions can help optimize industrial structures and foster emerging green industries. Additionally, fostering green technology collaboration and market competition may further enhance firms’ innovation capabilities, thereby improving both carbon reduction efforts and long-term corporate competitiveness.
Finally, we recommend adopting differentiated policy measures based on industry and regional characteristics. The study reveals that policy effectiveness varies across industries and regions, with high-pollution enterprises being more prone to the green paradox effect, potentially leading to suboptimal policy outcomes. Local governments may consider tailoring policies based on their economic development stage, industrial composition, and carbon emission characteristics. For instance, in emerging economies in which development relies heavily on high-pollution industries, firms in these sectors may be more susceptible to compliance-induced behavioral shifts. In such cases, stricter emission standards and targeted subsidies may be necessary to mitigate the green paradox.
While this study provides insights into the synergistic effects of the Low-Carbon City Pilot (LCCP) and CETP policies, certain limitations remain, warranting further exploration in future research. Due to data availability constraints, this study adopts an indirect approach to measuring corporate carbon emissions, estimating carbon performance based on industry-level emissions and corporate operating costs. However, such an approximation may not fully capture actual corporate carbon emissions. Future research could strive to obtain more granular and direct emissions data to enhance the accuracy and robustness of empirical findings. Although this study contributes to discussions on China’s national carbon trading market, its findings may be somewhat constrained by the fact that the national carbon emissions trading market was only officially launched in 2021. The interaction effects between the LCCP and the national carbon trading market have not been comprehensively examined due to the limited time frame. Future studies could investigate this effect after the national carbon market has been in operation for a longer period, providing theoretical and empirical guidance for the further refinement of the national carbon trading system in China and even emerging countries around the world.

Author Contributions

Conceptualization, G.W. and S.L.; Data curation, G.W.; Formal analysis, G.W.; Funding acquisition, S.L.; Investigation, G.W. and C.F.; Methodology, G.W.; Project administration, G.W. and S.L.; Software, G.W.; Supervision, S.L.; Validation, G.W., C.F. and S.L.; Writing—original draft, G.W.; Writing—review and editing, G.W., C.F. and S.L. All authors have read and agreed to the published version of the manuscript.

Funding

This research was funded by China National Social Science Fund, grant number 21BJY146.

Institutional Review Board Statement

Not applicable.

Informed Consent Statement

Not applicable.

Data Availability Statement

The raw data supporting the conclusions of this article will be made available by the authors on request.

Acknowledgments

We would like to thank the editor and the anonymous reviewers for their useful and challenging comments, which have strengthened the paper.

Conflicts of Interest

The authors declare no conflicts of interest.

Abbreviations

The following abbreviations are used in this manuscript:
WMOThe World Meteorological Organization
LCCPLow-Carbon City Pilot
CETPCarbon Emission Trading Pilot
DCRPDual carbon reduction pilot

References

  1. World Meteorological Organization. World Meteorological Organization WMO Confirms 2024 as Warmest Year on Record at About 1.55 °C Above Pre-Industrial Level 2025; World Meteorological Organization: Geneva, Switzerland, 2025. [Google Scholar]
  2. Cole, M.A.; Elliott, R.J.; Okubo, T.; Zhou, Y. The Carbon Dioxide Emissions of Firms: A Spatial Analysis. J. Environ. Econ. Manag. 2013, 65, 290–309. [Google Scholar] [CrossRef]
  3. Jiang, W.; Wang, K.-L.; Jiang, N. 1+1 > 2? The Synergistic Effect of Carbon Emissions Reduction Policies: Empirical Evidence from China. Clim. Policy 2024, 1–14. [Google Scholar] [CrossRef]
  4. Jia, Z.; Wen, S. Interaction Effects of Market-Based and Incentive-Driven Low-Carbon Policies on Carbon Emissions. Energy Econ. 2024, 137, 107776. [Google Scholar] [CrossRef]
  5. Shi, B.; Li, N.; Gao, Q.; Li, G. Market Incentives, Carbon Quota Allocation and Carbon Emission Reduction: Evidence from China’s Carbon Trading Pilot Policy. J. Environ. Manag. 2022, 319, 115650. [Google Scholar] [CrossRef]
  6. Khanna, N.; Fridley, D.; Hong, L. China’s Pilot Low-Carbon City Initiative: A Comparative Assessment of National Goals and Local Plans. Sustain. Cities Soc. 2014, 12, 110–121. [Google Scholar] [CrossRef]
  7. Clarkson, P.; Li, Y.; Richardson, G.; Vasvari, F. Does It Really Pay to Be Green? Determinants and Consequences of Proactive Environmental Strategies. J. Account. Public Policy 2011, 30, 122–144. [Google Scholar] [CrossRef]
  8. Haque, F.; Ntim, C.G. Executive Compensation, Sustainable Compensation Policy, Carbon Performance and Market Value. Br. J. Manag. 2020, 31, 525–546. [Google Scholar] [CrossRef]
  9. Chen, S.; Mao, H.; Sun, J. Low-Carbon City Construction and Corporate Carbon Reduction Performance: Evidence from a Quasi-Natural Experiment in China. J. Bus. Ethics 2022, 180, 125–143. [Google Scholar] [CrossRef]
  10. Tan, X.; Choi, Y.; Wang, B.; Huang, X. Does China’s Carbon Regulatory Policy Improve Total Factor Carbon Efficiency? A Fixed-Effect Panel Stochastic Frontier Analysis. Technol. Forecast. Soc. Chang. 2020, 160, 120222. [Google Scholar] [CrossRef]
  11. Wang, X.; Gao, C. Does Green Finance Policy Help to Improve Carbon Reduction Welfare Performance? Evidence from China. Energy Econ. 2024, 132, 107452. [Google Scholar] [CrossRef]
  12. Li, N.; Zhang, H.; Zhang, X.; Xie, X. Does Market-Based Environmental Regulatory Policy Improve Corporate Environmental Performance? Evidence from Carbon Emission Trading in China. Sustainability 2025, 17, 623. [Google Scholar] [CrossRef]
  13. Yang, Z.; Shao, S.; Yang, L. Unintended Consequences of Carbon Regulation on the Performance of SOEs in China: The Role of Technical Efficiency. Energy Econ. 2021, 94, 105072. [Google Scholar] [CrossRef]
  14. Yang, L.; Li, Y.; Liu, H. Did Carbon Trade Improve Green Production Performance? Evidence from China. Energy Econ. 2021, 96, 105185. [Google Scholar] [CrossRef]
  15. Yang, Z.; Fan, M.; Shao, S.; Yang, L. Does Carbon Intensity Constraint Policy Improve Industrial Green Production Performance in China? A Quasi-DID Analysis. Energy Econ. 2017, 68, 271–282. [Google Scholar] [CrossRef]
  16. Zhang, K.; Xu, D.; Li, S.; Zhou, N.; Xiong, J. Has China’s Pilot Emissions Trading Scheme Influenced the Carbon Intensity of Output? Int. J. Environ. Res. Public Health 2019, 16, 1854. [Google Scholar] [CrossRef]
  17. Ge, X.; Li, Y.; Yang, H. The Green Paradox of Time Dimension: From Pilot to National Carbon Emission Trading System in China. Environ. Impact Assess. Rev. 2024, 109, 107642. [Google Scholar] [CrossRef]
  18. Yang, S. Carbon Emission Trading Policy and Firm’s Environmental Investment. Financ. Res. Lett. 2023, 54, 103695. [Google Scholar] [CrossRef]
  19. Li, H.; Wang, J.; Yang, X.; Wang, Y.; Wu, T. A Holistic Overview of the Progress of China’s Low-Carbon City Pilots. Sustain. Cities Soc. 2018, 42, 289–300. [Google Scholar] [CrossRef]
  20. Gustafsson, B. Scope and Limits of the Market Mechanism in Environmental Management. Ecol. Econ. 1998, 24, 259–274. [Google Scholar] [CrossRef]
  21. Zeng, S.; Jin, G.; Tan, K.; Liu, X. Can Low-Carbon City Construction Reduce Carbon Intensity? Empirical Evidence from Low-Carbon City Pilot Policy in China. J. Environ. Manag. 2023, 332, 117363. [Google Scholar] [CrossRef]
  22. Xu, R.; Pata, U.K.; Dai, J. Sustainable Growth through Green Electricity Transition and Environmental Regulations: Do Risks Associated with Corruption and Bureaucracy Matter? Politická Ekon. 2024, 72, 228–254. [Google Scholar] [CrossRef]
  23. Sinn, H. Public Policies against Global Warming: A Supply Side Approach. Int. Tax Public Financ. 2008, 15, 360–394. [Google Scholar] [CrossRef]
  24. Sepehri, A.; Sarrafzadeh, M.-H. Effect of Nitrifiers Community on Fouling Mitigation and Nitrification Efficiency in a Membrane Bioreactor. Chem. Eng. Process.-Process Intensif. 2018, 128, 10–18. [Google Scholar] [CrossRef]
  25. Yousefi, S.R.; Ghanbari, D.; Salavati-Niasari, M.; Hassanpour, M. Photo-Degradation of Organic Dyes: Simple Chemical Synthesis of Ni(OH)2 Nanoparticles, Ni/Ni(OH)2 and Ni/NiO Magnetic Nanocomposites. J. Mater. Sci. Mater. Electron. 2016, 27, 1244–1253. [Google Scholar] [CrossRef]
  26. Hong, Q.; Cui, L.; Hong, P. The Impact of Carbon Emissions Trading on Energy Efficiency: Evidence from Quasi-Experiment in China’s Carbon Emissions Trading Pilot. Energy Econ. 2022, 110, 106025. [Google Scholar] [CrossRef]
  27. Pan, A.; Zhang, W.; Shi, X.; Dai, L. Climate Policy and Low-Carbon Innovation: Evidence from Low-Carbon City Pilots in China. Energy Econ. 2022, 112, 106129. [Google Scholar] [CrossRef]
  28. Yu, Y.; Zhang, N. Low-Carbon City Pilot and Carbon Emission Efficiency: Quasi-Experimental Evidence from China. Energy Econ. 2021, 96, 105125. [Google Scholar] [CrossRef]
  29. Cao, Y.; Wu, Y.; Li, Z.; Wang, Q. Climate Policy and Carbon Leakage: Evidence from the Low-Carbon City Pilot Program in China. Environ. Impact Assess. Rev. 2025, 110, 107730. [Google Scholar] [CrossRef]
  30. Lyu, J.; Liu, T.; Cai, B.; Qi, Y.; Zhang, X. Heterogeneous Effects of China’s Low-Carbon City Pilots Policy. J. Environ. Manag. 2023, 344, 118329. [Google Scholar] [CrossRef]
  31. Feng, T.; Lin, Z.; Du, H.; Qiu, Y.; Zuo, J. Does Low-Carbon Pilot City Program Reduce Carbon Intensity? Evidence from Chinese Cities. Res. Int. Bus. Financ. 2021, 58, 101450. [Google Scholar] [CrossRef]
  32. Chen, X.; Lin, B. Towards Carbon Neutrality by Implementing Carbon Emissions Trading Scheme: Policy Evaluation in China. Energy Policy 2021, 157, 112510. [Google Scholar] [CrossRef]
  33. Zhuo, C.; Liu, Y.; Dai, L.; Deng, Y. Cultural, Economic, or Transport Link: Does Carbon Emissions Trading Promote “Good Neighbor” Carbon Emission Reduction? Land 2024, 13, 1762. [Google Scholar] [CrossRef]
  34. Reich, P.B.; Hobbie, S.E.; Lee, T.D.; Rich, R.; Pastore, M.A.; Worm, K. Synergistic Effects of Four Climate Change Drivers on Terrestrial Carbon Cycling. Nat. Geosci. 2020, 13, 787–793. [Google Scholar] [CrossRef]
  35. Wilts, H.; O’Brien, M. A Policy Mix for Resource Efficiency in the EU: Key Instruments, Challenges and Research Needs. Ecol. Econ. 2019, 155, 59–69. [Google Scholar] [CrossRef]
  36. Edmondson, D.L.; Kern, F.; Rogge, K.S. The Co-Evolution of Policy Mixes and Socio-Technical Systems: Towards a Conceptual Framework of Policy Mix Feedback in Sustainability Transitions. Res. Policy 2019, 48, 103555. [Google Scholar] [CrossRef]
  37. Zhang, P.; Zhou, D.; Guo, J. Policy Complementary or Policy Crowding-out? Effects of Cross-Instrumental Policy Mix on Green Innovation in China. Technol. Forecast. Soc. Change 2023, 192, 122530. [Google Scholar] [CrossRef]
  38. Montgomery, W. Markets in Licenses and Efficient Pollution Control Programs. J. Econ. Theory 1972, 5, 395–418. [Google Scholar] [CrossRef]
  39. Wang, J.; Liu, L.; Ou, Y. Low-Carbon City Pilot Policy and Corporate Environmental Violations: Evidence from Heavily Polluting Firms in China. Financ. Res. Lett. 2024, 65, 105548. [Google Scholar] [CrossRef]
  40. Hahn, R.; Stavins, R. Economic Incentives for Environmental-Protection—Integrating Theory and Practice. Am. Econ. Rev. 1992, 82, 464–468. [Google Scholar]
  41. Jaehn, F.; Letmathe, P. The Emissions Trading Paradox. Eur. J. Oper. Res. 2010, 202, 248–254. [Google Scholar] [CrossRef]
  42. Sorrell, S.; Sijm, J. Carbon Trading in the Policy Mix. Oxf. Rev. Econ. Policy 2003, 19, 420–437. [Google Scholar] [CrossRef]
  43. Busch, T.; Lewandowski, S. Corporate Carbon and Financial Performance: A Meta-Analysis. J. Ind. Ecol. 2018, 22, 745–759. [Google Scholar] [CrossRef]
  44. Siddique, M.A.; Akhtaruzzaman, M.; Rashid, A.; Hammami, H. Carbon Disclosure, Carbon Performance and Financial Performance: International Evidence. Int. Rev. Financ. Anal. 2021, 75, 101734. [Google Scholar] [CrossRef]
  45. Ren, X.; Li, Y.; Shahbaz, M.; Dong, K.; Lu, Z. Climate Risk and Corporate Environmental Performance: Empirical Evidence from China. Sustain. Prod. Consum. 2022, 30, 467–477. [Google Scholar] [CrossRef]
  46. Cheng, Z.; Meng, X. Can Carbon Emissions Trading Improve Corporate Total Factor Productivity? Technol. Forecast. Soc. Chang. 2023, 195, 122791. [Google Scholar] [CrossRef]
  47. Chen, S.; Wang, Y.; Albitar, K.; Huang, Z. Does Ownership Concentration Affect Corporate Environmental Responsibility Engagement? The Mediating Role of Corporate Leverage. Borsa Istanb. Rev. 2021, 21, S13–S24. [Google Scholar] [CrossRef]
  48. Akhtar, M.; Yusheng, K.; Haris, M.; Ain, Q.U.; Javaid, H.M. Impact of Financial Leverage on Sustainable Growth, Market Performance, and Profitability. Econ. Chang. Restruct. 2022, 55, 737–774. [Google Scholar] [CrossRef]
  49. Qian, L.; Xu, X.; Sun, Y.; Zhou, Y. Carbon Emission Reduction Effects of Eco-Industrial Park Policy in China. Energy 2022, 261, 125315. [Google Scholar] [CrossRef]
  50. Lei, X. Assessing the Effectiveness of Energy Transition Policies on Corporate ESG Performance: Insights from China’s NEDC Initiative. Int. J. Glob. Warm. 2024, 34, 291–299. [Google Scholar] [CrossRef]
  51. He, W.; Wang, X.; Miao, M. Network Infrastructure and Corporate Environmental Performance: Empirical Evidence from “Broadband China”. Energy Econ. 2024, 131, 107393. [Google Scholar] [CrossRef]
  52. Yang, S.; Jahanger, A.; Hossain, M.R. How Effective Has the Low-Carbon City Pilot Policy Been as an Environmental Intervention in Curbing Pollution? Evidence from Chinese Industrial Enterprises. Energy Econ. 2023, 118, 106523. [Google Scholar] [CrossRef]
  53. Hering, L.; Poncet, S. Environmental Policy and Exports: Evidence from Chinese Cities. J. Environ. Econ. Manag. 2014, 68, 296–318. [Google Scholar] [CrossRef]
  54. Ghanem, D.; Zhang, J. ‘Effortless Perfection’: Do Chinese Cities Manipulate Air Pollution Data? J. Environ. Econ. Manag. 2014, 68, 203–225. [Google Scholar] [CrossRef]
  55. Yu, Y.Z.; Sun, P.B.; Xuan, Y. Do Constraints on Local Governments’ Environmental Targets Affect Industrial Transformation and Upgrading? Econ. Res. J. 2020, 55, 57–72. (In Chinese) [Google Scholar]
  56. Huang, J.-W.; Li, Y.-H. Green Innovation and Performance: The View of Organizational Capability and Social Reciprocity. J. Bus. Ethics 2017, 145, 309–324. [Google Scholar] [CrossRef]
  57. Xu, R.; Farooq, U.; Alam, M.M.; Dai, J. How Does Cultural Diversity Determine Green Innovation? New Empirical Evidence from Asia Region. Environ. Impact Assess. Rev. 2024, 106, 107458. [Google Scholar] [CrossRef]
  58. Liu, S.; Li, Y. Exploration or Exploitation? Corporate Green Innovation Strategy for Carbon Emission Reduction-Evidence from Pilot Enterprises in China. Sustainability 2024, 16, 4486. [Google Scholar] [CrossRef]
  59. Porter, M.E.; van der Linde, C. Toward a New Conception of the Environment-Competitiveness Relationship. J. Econ. Perspect. 1995, 9, 97–118. [Google Scholar] [CrossRef]
  60. Krysiak, F. Environmental Regulation, Technological Diversity, and the Dynamics of Technological Change. J. Econ. Dyn. Control 2011, 35, 528–544. [Google Scholar] [CrossRef]
  61. Huang, J.; Meng, S.; Yu, J. The Effects of the Low-Carbon Pilot City Program on Green Innovation: Evidence from China. Land 2023, 12, 1639. [Google Scholar] [CrossRef]
  62. Baron, R.M.; Kenny, D.A. The Moderator-Mediator Variable Distinction in Social Psychological Research: Conceptual, Strategic, and Statistical Considerations. J. Personal. Soc. Psychol. 1986, 51, 1173–1182. [Google Scholar] [CrossRef] [PubMed]
  63. Grafton, R.; Kompas, T.; Long, N. Substitution between Biofuels and Fossil Fuels: Is There a Green Paradox? J. Environ. Econ. Manag. 2012, 64, 328–341. [Google Scholar] [CrossRef]
Figure 1. The parallel trend test of CETP.
Sustainability 17 04409 g001
Figure 2. The parallel trend test of LCCP.
Sustainability 17 04409 g002
Figure 3. The parallel trend test of DCRP.
Sustainability 17 04409 g003
Figure 4. Unrestricted mixed placebo test.
Sustainability 17 04409 g004
Figure 5. Restricted mixed placebo test.
Sustainability 17 04409 g005
Table 1. Explanation of variables.
VariablesExplanation
CPThe ratio of operating revenue to carbon emissions.
DIDThe interaction term between LCCP and CETP.
CETPA binary variable indicating whether a firm is located in a CETP city. The variable is assigned a value of 1 starting from the year the firm’s city was designated as a pilot city, and 0 otherwise.
LCCPA binary variable indicating whether a firm is located in an LCCP city. The variable is assigned a value of 1 starting from the year the firm’s city was designated as a pilot city, and 0 otherwise.
lnSaleThe logarithm of corporate sales.
ROANet profit after tax/total assets.
TopThe shareholding ratio of the largest shareholder.
LevTotal liabilities/total assets.
CashNet cash flows from operating activities/current liabilities.
BoardsizeThe logarithm of the number of board members.
GrowthIncrease rate of main business revenue.
Table 2. Descriptive statistics.
VariablesCountMeanSDMinMax
CP20,67345.4662.910.16270.66
DID20,6730.260.440.001.00
CETP20,6730.270.440.001.00
LCCP20,6730.550.500.001.00
lnSale20,67321.371.3918.4725.25
ROA20,6730.040.06−0.240.21
Top20,6730.350.150.090.74
Lev20,6730.410.200.050.95
Cash20,6730.050.07−0.150.24
Boardsize20,6732.140.201.612.71
Growth20,6730.230.60−0.683.84
Table 3. Univariate difference test.
Panel A: based on CETP
Variables Group1 Mean1 Group2 Mean2 MeanDiff
CP 15,15835.584551572.592−37.008 ***
Panel B: based on LCCP
Variables Group1 Mean1 Group2 Mean2 MeanDiff
CP 934426.89011,32960.770−33.880 ***
Panel C: based on DID
Variables Group1 Mean1 Group2 Mean2 MeanDiff
CP 15,36635.860530773.244−37.384 ***
*** p < 0.01
Table 4. Benchmark regression.
(1) (2) (3) (4) (5) (6)
Variables CP CP CP CP CP CP
DID


16.510 ***
(2.89)
16.465 ***
(2.70)
CETP9.276 ***
(2.77)
8.622 ***
(2.61)


−6.063 ***
(2.03)
−6.683 ***
(2.08)
LCCP

3.187
(2.34)
3.209
(2.38)
2.017
(2.35)
2.089
(2.37)
lnSale
1.826 *
(1.00)

1.974 *
(1.02)

1.765 *
(0.99)
ROA
21.075 ***
(7.55)

21.904 ***
(7.41)

21.201 ***
(7.63)
Top
−17.769 ***
(6.56)

−17.987 ***
(6.63)

−18.085 ***
(6.50)
Lev
15.555 ***
(4.39)

16.397 ***
(4.33)

15.767 ***
(4.39)
Cash
0.423
(5.23)

−0.057
(5.20)

0.170
(5.24)
Boardsize
5.156
(3.30)

5.300
(3.32)

5.279
(3.30)
Growth
1.471 **
(0.71)

1.406 **
(0.71)

1.423 **
(0.71)
constant32.910 ***
(1.30)
−16.857
(22.63)
33.213 ***
(1.36)
−20.196
(23.21)
32.679 ***
(1.35)
−16.043
(22.62)
YearYesYesYesYesYesYes
IdYesYesYesYesYesYes
N20,67320,67320,67320,67320,67320,673
R20.1490.1560.1450.1530.1500.158
F66.80452.82750.47746.49468.48259.720
The standard errors clustered at the city level are presented in parentheses; * p < 0.10, ** p < 0.05, *** p < 0.01.
Table 5. Robustness test.
(1) (2) (3) (4) (5) (6)
Variables CP CP CP CP CP CP
DID19.803 ***
(2.75)
16.416 ***
(2.55)
10.186 ***
(2.49)
8.037 **
(3.51)
8.507 ***
(2.38)
8.028 **
(3.52)
CETP−6.557 ***
(2.07)
−6.603 ***
(1.80)


LCCP2.635
(2.60)
2.124
(1.98)


lnSale2.719 ***
(0.97)
1.751 *
(0.88)
1.781 *
(0.99)
0.421
(1.53)
−3.077 *
(1.66)
0.435
(1.54)
ROA16.355 **
(7.42)
20.985 ***
(6.47)
21.020 ***
(7.59)
31.764 ***
(11.70)
45.009 **
(17.47)
31.891 ***
(11.87)
Top−18.194 **
(7.08)
−17.985 **
(8.20)
−17.995 ***
(6.52)
−19.662 **
(9.82)
1.945
(21.32)
−19.869 **
(9.83)
Lev12.785 ***
(3.96)
15.797 ***
(4.38)
15.542 ***
(4.39)
15.118 *
(7.89)
12.881
(14.40)
15.105 *
(8.00)
Cash−5.132
(4.46)
0.068
(4.54)
0.369
(5.23)
2.367
(7.85)
7.379
(15.62)
2.004
(8.01)
Boardsize6.165
(3.76)
5.327 *
(2.87)
5.206
(3.30)
0.763
(5.77)
−5.273
(8.97)
1.398
(5.80)
Growth1.634 **
(0.67)
1.413 **
(0.63)
1.459 **
(0.71)
0.530
(1.19)
0.799
(2.16)
0.600
(1.20)
constant−36.626
(22.54)
−15.924
(19.83)
−16.016
(22.52)
15.794
(39.67)
117.897 **
(47.71)
14.315
(40.05)
YearYesYesYesYesYesYes
IdYesYesYesYesYesYes
N17,68020,74920,67311,537551511,329
R20.1600.1570.1560.1480.0920.149
F48.80551.32052.44074.25574.34474.650
Standard errors clustered at the city level are reported in parentheses, except for Column 2, which reports standard errors clustered at the provincial level; * p < 0.10, ** p < 0.05, *** p < 0.01.
Table 6. Balance test.
VariablesUnmatched
Matched
Mean%Bias%Reduct |Bias|t-Test
TreatedControlTp > |t|
lnSaleU21.3921.352.50035.201.7300.0830
M21.3921.371.6000.9600.339
ROAU0.04270.03935.50064.803.7300
M0.04270.04151.9001.1200.262
TopU0.3500.3500.300−400.60.1800.856
M0.3500.3481.3000.7800.433
LevU0.3960.415−9.20090.70−6.2900
M0.3960.397−0.900−0.5100.608
CashU0.05110.05031.20059.700.7900.430
M0.05110.05080.5000.2800.783
BoardsizeU2.1232.143−9.80076.10−6.7700
M2.1232.1192.3001.3900.166
GrowthU0.2440.2272.90059.901.9700.0490
M0.2440.251−1.200−0.6700.506
Table 7. Endogeneity test results.
(1)(2)(3)(4)
Variables CP CP CP CP
DID20.817 ***
(4.78)
16.181 ***
(2.53)
16.122 ***
(2.72)
15.516 ***
(4.23)
NEDCP
1.803
(2.29)


BCP

1.636
(1.74)

CETP−10.169 **
(4.11)
−6.402 ***
(2.17)
−6.791 ***
(2.08)
−9.268 **
(3.97)
LCCP1.312
(2.64)
2.164
(2.38)
2.014
(2.38)
2.992
(2.27)
lnSale0.910
(1.31)
1.749 *
(0.99)
1.749 *
(0.99)
1.107
(1.06)
ROA15.476
(11.47)
21.224 ***
(7.61)
21.270 ***
(7.63)
−0.538
(7.13)
Top−20.777 **
(8.64)
−17.930 ***
(6.49)
−17.836 ***
(6.49)
−13.400 *
(8.09)
Lev15.228 **
(6.74)
15.693 ***
(4.44)
15.800 ***
(4.39)
10.145 *
(5.17)
Cash7.602
(8.02)
0.157
(5.24)
0.218
(5.24)
6.428
(5.39)
Boardsize5.455
(5.67)
5.303
(3.31)
5.335
(3.31)
3.116
(3.71)
Growth0.985
(1.00)
1.422 **
(0.71)
1.423 **
(0.71)
1.043 *
(0.62)
constant1.593
(24.80)
−9.706
(21.09)
−9.806
(21.06)
5.038
(24.09)
YearYesYesYesYes
IdYesYesYesYes
N13,95620,67320,67317,358
R20.1580.1580.1580.122
F34.68762.42355.28851.275
The standard errors clustered at the city level are presented in parentheses; The independent variable in column (4) is lagged by one period; * p < 0.10, ** p < 0.05, *** p < 0.01.
Table 8. Instrumental variable method.
(1) (2)
Variables DID CP
River0.063 ***
(0.010)
Ventilation−0.087 *
(0.051)
DID 30.351 ***
(11.119)
ROA0.06319.665 **
(0.052)(7.927)
lnSale0.019 ***1.331
(0.007)(0.974)
Top0.008−17.859 ***
(0.063)(6.409)
Lev0.04014.227 ***
(0.042)(4.785)
Cash−0.0170.781
(0.025)(5.287)
Boardsize−0.0015.213
(0.028)(3.334)
Growth−0.0011.483 **
(0.004)(0.735)
YearYesYes
IdYesYes
Kleibergen–Paap rk LM6.138 **
Kleibergen–Paap rk Wald F20.251
10% maximal IV size19.93
Hansen J (p-value) 1.541 (0.2145)
Obs20,38920,389
The standard errors clustered at the city level are presented in parentheses; * p < 0.10, ** p < 0.05, *** p < 0.01.
Table 9. Mediation effect test.
(1) (2) (3)
Variables CP GP CP
DID 11.493 ***
(2.71)
0.010 **
(0.00)
11.434 ***
(2.71)
GP

5.901 **
(2.55)
lnSale 2.587 **
(1.09)
−0.001
(0.00)
2.595 **
(1.09)
ROA 26.344 ***
(9.62)
0.011
(0.02)
26.277 ***
(9.62)
Top −20.050 **
(8.31)
−0.001
(0.03)
−20.044 **
(8.30)
Lev 16.665 ***
(4.55)
0.006
(0.01)
16.630 ***
(4.54)
Cash −1.132
(7.33)
0.021
(0.02)
−1.256
(7.30)
Boardsize 4.153
(3.65)
−0.007
(0.01)
4.193
(3.64)
Growth 0.388
(0.63)
−0.006 ***
(0.00)
0.423
(0.63)
constant −26.525
(22.30)
0.065
(0.08)
−26.907
(22.23)
Year YesYesYes
Id YesYesYes
N 14,46714,46714,467
R20.1770.0030.177
F51.5204.14049.359
The standard errors clustered at the city level are presented in parentheses; ** p < 0.05, *** p < 0.01.
Table 10. Heterogeneity test.
(1)(2)(3)(4)(5)(6)(7)
Variables CP CP CP CP CP CP CP
DID10.515 ***
(2.62)
−1.461 **
(0.56)
8.541 ***
(2.77)
11.654 *
(6.10)
−3.454 *
(1.75)
−0.713
(1.21)
12.821 ***
(3.05)
lnSale0.868
(1.17)
−0.364
(0.34)
0.762
(1.30)
3.960 **
(1.89)
1.645
(1.99)
0.455
(0.65)
1.143
(1.32)
ROA27.368 ***
(9.20)
3.700
(2.47)
36.928 ***
(11.54)
−10.888
(11.79)
6.109
(10.06)
16.858 ***
(4.32)
21.734 **
(9.41)
Top−17.584 **
(8.56)
−2.069
(2.70)
−31.297 ***
(9.11)
−0.341
(9.98)
12.814
(10.78)
−8.809
(5.48)
−12.843
(8.64)
Lev14.564 ***
(5.26)
1.802
(1.36)
20.966 ***
(6.09)
11.710
(8.49)
1.639
(8.35)
8.075 ***
(2.38)
14.482 **
(5.65)
Cash−1.942
(6.67)
2.977
(1.98)
1.559
(7.25)
−0.793
(8.06)
−4.533
(11.95)
−4.903 *
(2.94)
4.077
(6.77)
Boardsize4.244
(3.88)
−1.275
(1.40)
3.077
(4.67)
11.535 **
(5.20)
3.191
(6.82)
−0.828
(2.42)
5.878
(4.20)
Growth1.455
(0.89)
0.565 *
(0.32)
1.444
(1.00)
0.673
(1.27)
2.175
(1.32)
−0.046
(0.34)
1.750 *
(0.92)
constant10.798
(26.55)
13.980 **
(7.03)
16.421
(30.41)
−85.104 **
(40.05)
−30.375
(44.78)
1.983
(14.86)
3.008
(29.43)
YearYesYesYesYesYesYesYes
IdYesYesYesYesYesYesYes
N16,965357113,77036782999544915,095
R20.1830.0940.1720.1600.1080.1050.192
F59.6788.44775.9498.3449.46511.92267.196
P0.0000.0170.0020.6400.000
The standard errors clustered at the city level are presented in parentheses; * p < 0.10, ** p < 0.05, *** p < 0.01. The p-values represent the significance levels based on SUEST test, with pairwise tests conducted for regional heterogeneity. Columns (3) to (5) present the test results for the central and western regions, the eastern and western regions, and the eastern and central regions, respectively.
Disclaimer/Publisher’s Note: The statements, opinions and data contained in all publications are solely those of the individual author(s) and contributor(s) and not of MDPI and/or the editor(s). MDPI and/or the editor(s) disclaim responsibility for any injury to people or property resulting from any ideas, methods, instructions or products referred to in the content.

