Article

Vulnerability and Sustainable Development Strategy of the Power Industry Under Carbon Market Based on Social Network Analysis Perspective

1
School of Management, Shenyang Jianzhu University, Shenyang 110168, China
2
State Grid Liaoning Electric Power Company Limited, Economic Research Institute, Shenyang 110015, China
3
School of Business Administration, Liaoning Technical University, Huludao 125105, China
*
Author to whom correspondence should be addressed.
Sustainability 2025, 17(10), 4398; https://doi.org/10.3390/su17104398
Submission received: 19 March 2025 / Revised: 29 April 2025 / Accepted: 8 May 2025 / Published: 12 May 2025

Abstract

:
Under the carbon market regulation, the power industry carbon trading (PICT) is still facing severe challenges, which seriously restrict the low-carbon transition of the power industry and carbon market stability. This paper innovatively introduces vulnerability research into PICT exploration and identifies stakeholders and vulnerabilities based on the whole PICT process. A social network analysis (SNA) is used to construct the PICT vulnerability network, and the key vulnerability nodes and their interactions are quantitatively analyzed to reveal the vulnerability formation mechanism. The findings suggest that PICT vulnerabilities are multi-dimensional, complex, and highly systemic, while policy formulation, the market trading mechanism, and the regulatory system are the core factors influencing the stable operation. At the same time, vulnerability propagation shows subject correlation and multilevel transmission effects, and different stakeholders play different roles in vulnerability propagation. On this basis, this paper proposes a four-dimensional vulnerability mitigation system centered on policy, market, regulation, and synergy, and quantitatively evaluates the effectiveness of the strategy through network simulation analysis. The conclusions enrich the theoretical study of PICT vulnerability and also provide strong decision support for regulating stakeholders’ market behavior and enhancing the stability of the carbon trading market.

1. Introduction

In the face of escalating global climate change, reducing greenhouse gas emissions has become a shared objective of the international community [1]. According to the Sixth Assessment Report of the United Nations Intergovernmental Panel on Climate Change (IPCC), global temperatures have already risen by approximately 1.1 °C above pre-industrial levels. Without urgent action, the temperature increase could surpass the critical 1.5 °C threshold between 2030 and 2052, leading to potentially catastrophic consequences [2]. As a key market-based instrument, the carbon trading market has been widely adopted worldwide to incentivize companies to reduce greenhouse gas emissions by assigning a price to carbon emissions [3,4,5]. In 2023, 75 global carbon pricing instruments covered around 24% of greenhouse gas emissions, with the total revenues topping USD 104 billion. The European Union’s Carbon Trading System (EU ETS), the oldest and largest compliance market, had auction revenues of EUR 43.6 billion in 2023, and had reduced aggregate allowances and expanded capacity to shipping and new shipping routes in 2024 to address market overhang and promote long-term emission reductions. In North America, California has covered about 85% of the state’s emissions since the launch of carbon trading in 2013, with trading volume up nearly 250% in 2024 compared to five years ago, and the spot price maintained at around USD 30/ton, providing a robust risk-hedging tool for participating entities. Meanwhile, China’s national ETS has accumulated 442 million tons of CO2 in allowances and RMB 24.919 billion in turnover by the end of 2023 since it was incorporated into the power sector in 2021, and the Interim Regulations on the Administration of Carbon Emission Trading came into effect in May 2024 to provide legal protection for market operations. According to the International Energy Agency (IEA), the global power sector accounted for approximately 42% of the total CO2 emissions in 2024, making it a primary focus for carbon reduction efforts [6,7]. However, as both a major carbon emitter and a critical component of energy supply, the power industry faces a significant opportunity for low-carbon transformation through its participation in carbon trading. At the same time, this transition has revealed multiple vulnerabilities in policy, technology, market dynamics, and social coordination [8]. For example, challenges such as carbon price volatility, the uneven allocation of allowances, and the instability of renewable energy sources have placed significant economic and technical pressures on power enterprises participating in carbon trading [9,10]. In addition, conflicts of interest and unequal cost-sharing among participating entities further exacerbate the power industry’s vulnerability in the carbon trading process [11,12]. These challenges make it increasingly difficult for the power sector to effectively participate in the carbon trading market.
In recent years, with the growing prominence of research on power industry carbon trading (PICT), both the perspectives and depth of related studies have expanded significantly. At the macro policy level, the price formation mechanism of the PICT market has been gradually established, emphasizing the importance of the carbon trading market in guiding the long-term development of the power industry [10,13,14]. At the micro-operational level, researchers have focused on how the carbon quota allocation mechanism reshapes the cost structure and market competition patterns of electric power enterprises [15,16], as well as the transmission mechanism of carbon price volatility on investment decisions and the operational stability of power enterprises [17,18]. Additionally, carbon trading has a catalytic effect on the power sector’s emission reduction performance and provides a quantitative basis for assessing policy effectiveness [6,19]. Undoubtedly, the participation of the power industry in the carbon trading market is an effective measure for achieving carbon emission reduction. Similarly, the carbon trading market offers a route for the future development of the power industry. However, PICT is facing a range of multidimensional vulnerabilities [20,21]. The slow development and application of low-carbon technologies complicate enterprises’ adaptation to the carbon market, while policy implementation uncertainties affect long-term investment planning in the power industry. Furthermore, information asymmetry and the imbalanced distribution of benefits among stakeholders may undermine the stability and fairness of the carbon market. Unlike traditional external risks, the volatility and crises faced by PICT are not isolated events but rather a dynamic process triggered by external shocks and amplified by internal vulnerabilities, followed by market adjustments and recovery. Vulnerability shocks focus more on the internal susceptibility and coping capacity of the system. Changes in the system reflect the sensitivity and adaptability to external shocks. Therefore, the innovation of this paper lies in systematically incorporating vulnerability research into the discussion of carbon trading in the power industry for the first time. From a multidimensional analysis perspective, this paper identifies key vulnerabilities and internal mechanisms affecting PICT, offering more targeted theoretical support and practical insights for the power industry’s low-carbon transformation.
By briefly analyzing the background and progress of current research on PICT, the current research deficiencies are further clarified. (1) The vulnerability identification methods of PICT and the roles played by different vulnerabilities are still unclear. (2) PICT involves the participation of multiple stakeholders, and the roles of different stakeholders in the diffusion of PICT vulnerabilities are yet to be examined. (3) To ensure the smooth operation of PICT, practical mitigation strategies for PICT vulnerability should be proposed. To address these challenges, this paper employs the social network analysis (SNA) method to identify key vulnerability nodes and their interactions within the different stages of PICT under carbon market regulation. First, it defines the critical stakeholders at each stage of PICT and systematically examines potential sources of vulnerability across total carbon quota setting and allocation, monitoring, reporting, and verification (MRV), trading, compliance, and regulation. Subsequently, a PICT vulnerability network is constructed to map the correlation structure among different nodes. Using NetMiner 4.0 software, network modeling and analysis are conducted to pinpoint key vulnerability nodes affecting carbon market stability and to explore their interconnections as well as the roles of different stakeholders in the network. Based on the analysis results, targeted vulnerability mitigation strategies are proposed. Further, the innovations and contributions of this paper include the following: (1) The proposal of a systematic PICT vulnerability identification method. This paper innovatively takes PICT stakeholders and all life cycle stages as entry points to comprehensively sort out PICT vulnerability nodes. With the help of the SNA method, the quantitative portrayal of various types of vulnerability nodes and their interactions in PICT is realized, thus filling the deficiency of fragmented and static analysis of vulnerability identification. (2) The quantitative revelation of the differentiated roles of multi-stakeholders in vulnerability diffusion. By calculating multi-dimensional SNA indicators such as the out-degree, in-degree, state centrality, etc., this paper clarifies the key positions and functions of the government, third-party verification agencies, trading centers, and other subjects in the vulnerability diffusion network, realizes the precise positioning of different stakeholders in the dynamic diffusion process of PICT, and cracks the blind spot of the traditional research on the analysis of the mechanism of multi-stakeholder synergy. (3) The establishment and validation of the PICT vulnerability mitigation strategy system. Based on the simulation experiment of node removal–network index recalculation, this paper evaluates the optimization effect of the four-dimensional interventions of policy, market, regulation, and synergy on the vulnerability network, and then puts forward an operable governance framework centered on dynamic quota adjustment, the improvement of carbon financial instruments, digital MRV, and cross-sectoral synergies, which provides quantitative support and practical practice to realize the resilience enhancement and sustainable and stable operation of the PICT system. It provides quantitative support and practical paths to realize the resilience enhancement and sustainable operation of the PICT system.
The structure of the paper is as follows. Section 1 introduces the research background and problem statement. Section 2 provides a systematic literature review, outlining the current state of PICT research, the application of SNA methods, and existing research gaps. Section 3 details the materials and methods, including the research framework, the methodology for constructing the vulnerability network, and key analytical metrics. Section 4 presents the empirical analysis results, discussing the influence of key vulnerability nodes and their transmission pathways. Section 5 offers a discussion of the findings and proposes corresponding vulnerability mitigation strategies. Finally, Section 6 summarizes the research conclusions and outlines directions for future research.

2. Literature Review

2.1. Critical Stakeholders of PICT

The vulnerabilities of PICT are deeply intertwined with the roles and interactions of critical stakeholders. Understanding these stakeholders is fundamental to identifying and addressing PICT vulnerabilities. Key stakeholders include, but are not limited to, the government, power enterprises, third-party verification agencies, and carbon trading centers, each playing distinct roles in maintaining the functionality of PICT. As the primary rule-maker and regulator, the government balances supply and demand through policy tools such as quota allocation, price regulation, and compliance oversight. However, the consistency and transparency of policy implementation directly shape the expectations and behaviors of other stakeholders [22,23,24]. As carbon emission majors and trading participants, the power enterprises’ data reporting quality and trading strategies determine the cost of compliance and also influence the market liquidity [25,26,27]. Meanwhile, carbon trading centers and third-party verification agencies form the intermediary support system of PICT, trading centers enhance market efficiency by offering trade aggregation and information disclosure services [28,29], and verification agencies ensure market credibility by independently verifying carbon emission data [30,31]. However, the existing research primarily focuses on the isolated roles of individual stakeholders, lacking a systematic exploration of the synergistic relationships among multiple participants. Particularly, the roles and mechanisms of stakeholders dynamically evolve across different PICT stages in response to market conditions. This paper systematically analyzes stakeholder interactions from a full life-cycle perspective of PICT, as illustrated in Figure 1. The two-way interaction of stakeholders through information, financial, and policy flows forms a complex network with multiple levels and dimensions. The relational framework provides new research ideas for optimizing the stakeholder synergy mechanism and enhancing the operational efficiency of PICT.

2.2. Vulnerabilities of PICT

PICT plays a key role in the low-carbon transition, but systematic research on its vulnerability is still insufficient, and overall, there is a lack of a systematic and complete theoretical system and a unified methodological paradigm. The existing studies have mainly focused on exploring the localized obstacles faced by the carbon market in the actual operation process, such as the allocation of quotas, trading mechanisms, and policy implementation and other key aspects. Of these, the inequitable distribution of quotas is widely recognized as an important constraint on market efficiency and the optimization of resource allocation, which not only leads to an imbalance in the distribution of the cost of carbon assets but also inhibits the incentive of enterprises to reduce emissions, thus weakening the basis for fair competition in the market [32,33,34]. Insufficient market liquidity, drastic price fluctuations, and information asymmetry in the trading process have exacerbated the vulnerability of PICT, seriously hindered the effective transmission of carbon price signals, and reduced the ability of the market to guide emission reduction investment behavior [35,36,37]. Meanwhile, at the policy implementation level, uncertainties in institutional design and deficiencies in the regulatory system are seen as key obstacles, which tend to induce short-term behaviors and excessive speculation among market participants, weakening the stability of PICT and the accessibility of long-term emission reduction targets [38,39,40]. Although relevant studies have provided valuable references in identifying problems and proposing targeted improvement measures, most of them remain in the identification of isolated problems and analysis of static mechanisms, and lack an in-depth portrayal of the endogenous generation, systematic diffusion, and dynamic evolution mechanism of PICT vulnerability in the process of multi-subjects, multi-stage interactions, which makes it difficult to reveal the complex logical chain of vulnerability accumulation and destabilization within the system. Therefore, based on the whole process perspective, this paper runs through the core links of quota setting and allocation, MRV, trading, compliance clearing, and regulatory assessment, systematically identifies the key vulnerability nodes, establishes a closely coupled vulnerability mapping among the stages, and analyzes in depth the multilevel diffusion of vulnerability among different subjects and links and the system destabilization mechanism. By introducing the stakeholder network interaction analysis method, this paper makes up for the shortcomings of traditional risk identification and efficiency optimization research in terms of holistic, dynamic, and systematic analysis. Moreover, it provides a new theoretical framework and empirical evidence for the in-depth understanding and effective intervention of the vulnerability of the PICT system, which is of great theoretical significance and practical value for enhancing the resilience and stability of PICT.

2.3. Social Network Analysis

SNA, as a method for systematically portraying individuals and their interrelationships in a social structure, constructs a complex network graph through nodes (individuals) and edges (relationships), which enables quantitative analysis of the interaction patterns and their far-reaching impact on the overall operation of the system [41]. Compared with system dynamics, which focuses on the feedback mechanism of macro-variables, and game theory, which emphasizes the equilibrium of rational strategies, SNA is capable of systematically portraying the network evolution and systematic vulnerability diffusion process under the coupling of multiple subjects, stages, and relationships from the perspective of micro-interactions [42]. Therefore, SNA shows unique applicability in revealing the mechanism of multi-stakeholder interaction, information flow, and vulnerability dissemination in PICT. Unlike traditional methods that focus on the properties of isolated entities (e.g., Regression Analysis) or linear causal deduction (e.g., System Dynamics, Game Theory), SNA emphasizes the relational ontology and the overall network structure, and is able to reveal the implicit associations among the nodes, resource flow paths, and information dissemination mechanisms in complex systems [40]. Through a series of network metrics, SNA identifies key nodes and vulnerable propagation chains in the system in detail and dynamically characterizes the evolution of the network structure. Lee et al. systematically reviewed the use of SNA in complex project management and clarified the interpretation of SNA metrics in the application areas of “Network Behavior”, “Stakeholder Management”, “Schedule Management”, “Quality Management”, “Resource Management”, “Communications Management”, “Risk Management”, “Procurement Management”, and “Health, Safety, Security, and Environmental (HSSE) management” [43]. Zheng et al. summarized the eight hot topics of SNA research in complex project management as “Performance and Effectiveness”, “Communication and Coordination”, “Knowledge Management”, “Risk Management”, “Governance Issue”, “Strategic Management”, “IT Utilization and Innovation Diffusion”, and “Site and Resource Management” [44]. Yuan et al. applied SNA to develop a risk network for prefabricated building projects, prioritizing stakeholder-related risks and their interconnections [45]. Yang et al. leveraged SNA to highlight the pivotal role of occupant behavior in building energy conservation, mapping stakeholder interactions that drive energy efficiency [46]. Meanwhile, Luo et al. explored supply chain vulnerabilities in prefabricated building projects and digital mitigation technologies, quantifying the influence of stakeholders on vulnerability factors through SNA [47]. As a highly complex and dynamically evolving interactive system, the vulnerability of PICT often stems from an inter-subjective linkage imbalance, conflict of interest, and information asymmetry. By establishing the vulnerability propagation network and identifying the key nodes and core paths, SNA can effectively capture the micro-dynamic process of vulnerability generation and diffusion, and make up for the limitations of the traditional methods in static local analysis and linear deduction. Based on this, this paper introduces the SNA method to systematically portray the interaction between the vulnerability nodes at each stage of PICT from the perspective of the whole process, and quantitatively analyze the multilevel diffusion characteristics of vulnerability and the system destabilization mechanism among different subjects and stages, so as to provide support for the enhancement of systemic resilience and the formulation of precise intervention strategies for PICT.

3. Materials and Methods

3.1. Research Framework

From the perspective of SNA theory, PICT under carbon market regulation functions as a dynamic network system comprising multiple stakeholders and their intricate interactions. Based on this understanding, this paper establishes a research framework, as illustrated in Figure 2, which consists of four main steps.
First, a systematic literature review of PICT-related research is conducted. Simultaneously, insights from interviews with industry experts are incorporated to identify key stakeholders and vulnerabilities at different stages of PICT. Second, to comprehensively map the vulnerability network and assess the extent of its influence, a questionnaire survey is administered among PICT stakeholders for data collection. Correlations among vulnerability nodes are then identified, allowing for the construction of an interaction network. Third, the research utilizes NetMiner 4.0 software to visualize and analyze the PICT vulnerability network. Key SNA metrics are applied to assess the impact of different vulnerability nodes, revealing network characteristics and critical points of weakness. Finally, based on the results of the network analysis, major vulnerability nodes are examined in depth. Additionally, tailored vulnerability mitigation strategies are developed and evaluated to enhance the stability and adaptability of the PICT system.

3.2. PICT Vulnerability Network Establishment

3.2.1. PICT Vulnerability Identification

This paper employs two primary methods for obtaining data resources to gain a deeper understanding of key PICT stakeholders and associated vulnerabilities. On the one hand, a comprehensive search of high-quality journal papers is conducted using the Web of Science (WOS) database. The search includes the following keywords: (Power Industry OR Power Generation Industry) AND (Carbon Market OR Carbon Trading) AND (Vulnerability OR Risk OR Constraint OR Barrier). After a full-text evaluation, PICT vulnerabilities are systematically summarized. This approach has been widely used in previous research to identify key sources of influence [45,47,48]. On the other hand, this paper conducts in-depth interviews with scholars and practitioners engaged in related research. The interviewees include four professors from the School of Management at Shenyang Jianzhu University, three professors from the School of Business Administration at Liaoning Technical University, and four staff members from the State Grid Liaoning Economic and Technical Research Institute. Respondents are selected based on the principles of stakeholder-based sampling [49]. Each interview lasts between 30 and 60 min to ensure that vulnerabilities are accurately identified. The identified PICT vulnerabilities are summarized in Table 1, where each vulnerability source and its description are clearly outlined. The key stakeholders involved in PICT, as identified in Section 2.2, include the government department (S1), power enterprise (S2), third-party verification agency (S3), carbon trading center (S4), industry association (S5), investment institution (S6), and financial institution (S7). Each vulnerability is denoted as V, with a total of 29 vulnerabilities identified.

3.2.2. PICT Vulnerability Network Relationship

This paper is based on an analysis of the interrelationships among PICT vulnerabilities. The acquisition of the dataset is designed around three core questions. (1) Does the vulnerability node SaVb have an impact on ScVd?; (2) If the impact exists, how likely is it to occur?; (3) What is the extent of the impact of SaVb on ScVd if the impact exists? The latter two questions are evaluated using a five-point Likert scale, where 1 represents the lowest level and 5 represents the highest level. The influence intensity between two nodes is calculated as the product of the likelihood and the level of influence. To ensure the reliability and credibility of the data, this paper distributes a structured questionnaire to identified stakeholders and their recommended industry practitioners. A total of 106 valid questionnaires are collected. Based on the survey data, a stakeholder–vulnerability matrix is constructed (see Table 2), which lays the foundation for the visualization and analysis of the network.

3.3. SNA Key Metrics

3.3.1. Network-Level Metrics

At the overall network level, this paper selects network density and network cohesion as the key descriptive metrics to characterize the network structure. Network density measures the strength of the overall connectivity of the network, reflecting the ratio of the number of relationships that exist in the network relative to the maximum number of possible relationships, and is calculated as shown in Equation (1). The total network density is defined as the ratio of the total number of relationships K existing between all N nodes in the network to the maximum number of potential relationships N(N − 1). The network density takes values between 0 and 1. When the density value is close to 0, it indicates that the network tends to be decentralized and the nodes are not closely connected. As the density value approaches 1, the network tends to be fully connected, i.e., all nodes are directly connected. Higher densities imply more frequent interactions among stakeholders, which may exacerbate system vulnerability. Network cohesion portrays the degree of closeness and structural solidity within the network and can be measured by the shortest path length between nodes. Higher network cohesion means closer connections among nodes within the system and more efficient information flow and resource sharing. However, a highly cohesive network structure may also enhance risk coupling within the system, making it easier for localized shocks to propagate throughout the network. Further, network cohesion characterizes network complexity through vulnerability accessibility, i.e., the number of reachable paths between nodes based on geodesic distance. The calculation formula is shown in Equation (2). dij denotes the sum of the shortest path lengths between node i and node j (calculated only for I ≠ j).
D ( G ) = K N ( N 1 ) ,   0     D ( G )     1
C ( G ) = N ( N 1 ) i j d i j

3.3.2. Node-Level Metrics

In node-level analysis, status centrality is an important metric for measuring the status of the node network and its influence, which can portray the relative importance of stakeholders in the network and their role in the overall structure. The scope of influence and intensity of the role of a node in the network is measured by counting the number of direct neighboring nodes (both predecessor and successor nodes) as well as the indirectly connected secondary nodes of that node. Status centrality is further subdivided into in-status centrality and out-status centrality. In particular, nodes with higher out-status centrality are usually considered to be key nodes with strong influence and outstanding propagation capabilities. Such nodes have a wider scope of action and have a more significant shaping effect on the overall structure and function of the network. Calculated according to Equation (3), α is the attenuation factor that affects the connectivity of distant nodes and is usually taken as 0.5. αd−1 is the weight factor of the node at distance d. AdjMd(i,j) represents the number of paths passing through the length d from node i to node j.
SC = d = 1 α d 1 j = 1 N AdjM d ( i , j )
The node degree is an important measure of a node’s direct connectivity characteristics, reflecting the strength and importance of its interactions in a network. The node degree can be further divided into the out-degree and in-degree, which measure the node’s influence on the outside and its external influence, respectively. Nodes with higher out-degree usually have a strong influence on the network and can spread information or resources within the system. The calculation is usually conducted using the weighted sum of all the external connections of the node, expressed in Equation (4). Nodes with higher incidence are usually the main recipients of external influences, indicating a strong dependency on the network and vulnerability to the influence or control of other nodes. It is calculated in a similar way to the out-degree, i.e., the sum of the weights of all connections pointing to the node, as shown in Equation (5). The degree difference reflects the difference between the influence exerted by a node and the influence it receives, i.e., the level of net influence. Nodes with a large degree difference are usually in the decision-making core or resource control position in the network, which has an important impact on the overall stability of the system, represented by Equation (6).
OD i = j = 1 N w i j
ID i = j = 1 N w j i
DD i =   OD i ID i

3.3.3. Link-Level Metrics

Brokerage analysis aims to evaluate the ability of a specific node to connect different subgroups in a network and its role under a selected partition vector. The method quantifies the frequency of the five brokerage roles that each node assumes in the network, including Coordinator, Representative, Liaison, Gatekeeper, and Consultant, with the roles shown in Figure 3. In the network structure, nodes with strong brokerage roles are usually key hubs across different subgroups, which not only facilitate information flow and strengthen network collaboration but also increase the complexity of the overall network to some extent. Therefore, nodes with high brokerage scores deserve special attention as they play a crucial role in disseminating information, integrating resources, and coordinating interactions.
Betweenness centrality is a shortest-path-based network metric that measures how often a particular node or link acts as a bridge in a network. This metric identifies key nodes or links that mediate between different network parts and reveals potential vulnerabilities in the network structure. The betweenness centrality of nodes is measured by counting the number of times it is passed through in the shortest path between other nodes, indicating the bridging role of the node in network propagation. Calculated according to Equation (7), BCi denotes the intermediate centrality of node i. σ s t is the number of all the shortest paths between node s and node t. σ s t ( i ) denotes the number of paths that pass through node i in these shortest paths. The betweenness centrality of links is used to measure the importance of a given relational line in connecting different subgroups. The higher the betweenness centrality of links, the more the line plays the role of a key channel in the vulnerability propagation process. Once disturbed, it may affect the connectivity of the whole network. As shown in Equation (8), BCe denotes the intermediate centrality of an edge e. σ s t is the number of all shortest paths between node s to node t. σ s t ( e ) denotes the number of paths that pass through edge e in these shortest paths.
B C i = s i t σ s t ( i ) σ s t
B C e = s t σ s t ( e ) σ s t

4. Results

4.1. Overall Network Visualization

This paper utilizes NetMiner 4.0 software to visualize and analyze the PICT vulnerability network, calculating key network metrics to assess structural characteristics. The directed graph of the PICT vulnerability network, as illustrated in Figure 4, reveals the network topology, comprising 48 vulnerability nodes and 435 influence relationships. Node colors and shapes are utilized to differentiate between vulnerability categories and stakeholder types, respectively. The directed edges represent interactions between vulnerabilities, with arrow thickness indicating the strength of influence. Nodes with high connectivity are concentrated in the network’s core region, highlighting their pivotal role in the propagation of PICT vulnerabilities. The central region is predominantly composed of red, blue, and yellow nodes, indicating that the total carbon allowance setting and allocation stage, the carbon allowance trading stage, and the MRV stage exert the most significant influence across the network. In terms of node shape distribution, a high proportion of triangular and circular nodes suggests that government departments and power enterprises play crucial roles in the vulnerability propagation pathways. These findings underscore the substantial impact of government policy decisions and enterprise market behaviors on the formation and diffusion of vulnerabilities throughout PICT operations. To quantitatively assess the network’s structural characteristics, this study calculates a network density of 0.183 and an average node distance of 1.998, indicating relatively strong linkages among vulnerability nodes. Furthermore, the network cohesion coefficient is 0.962, demonstrating a high degree of overall connectivity and significant cross-transmission of vulnerabilities. These insights provide a robust foundation for evaluating PICT system stability and formulating targeted risk mitigation strategies.

4.2. Node Visualization

The status centrality analysis provides insights into the relative outward influence of different stakeholders within the PICT vulnerability network. Figure 5 visually represents the distribution of influence across vulnerability nodes, where nodes positioned closer to the center exert a more substantial impact on the overall network interactions. It is evident that triangular and circular nodes are primarily concentrated in the core region, indicating that vulnerabilities associated with government departments and power enterprises are more susceptible to external influences throughout the PICT process. Additionally, the central region exhibits a noticeably higher proportion of red and yellow nodes, signifying that the total carbon allowance setting and allocation stage, as well as the MRV stage, play a pivotal role in shaping the PICT system. This finding further reinforces the notion that early-stage policy formulation and market infrastructure development are critical determinants of PICT stability and operational efficiency.
Furthermore, the calculation results of out-status centrality, out-degree, degree difference, and ego size provide deeper insights into the distribution and functional mechanisms of key vulnerability nodes within the network, as shown in Table 3. First, based on the out-status centrality metric, nodes S1V1, S1V2, and S2V7 occupy core positions, indicating their critical role in the propagation of vulnerabilities across the entire network. Second, these three nodes also rank highest in the out-degree and degree difference dimensions, further confirming their substantial influence over other nodes in the system. Lastly, from the perspective of ego size, the top three nodes—S1V1, S2V9, and S1V5—exhibit the strongest structural embeddedness within the network. Their extensive connections make them pivotal in triggering cascading effects and amplifying system-wide vulnerabilities. Therefore, priority should be given to mitigating the risks associated with these high-impact nodes in the vulnerability management strategy. Notably, vulnerability nodes linked to third-party verification agencies (S3) and financial institutions (S7) also frequently appear in core rankings, suggesting their non-negligible role in the overall network dynamics and the necessity of targeted interventions.

4.3. Lines Visualization

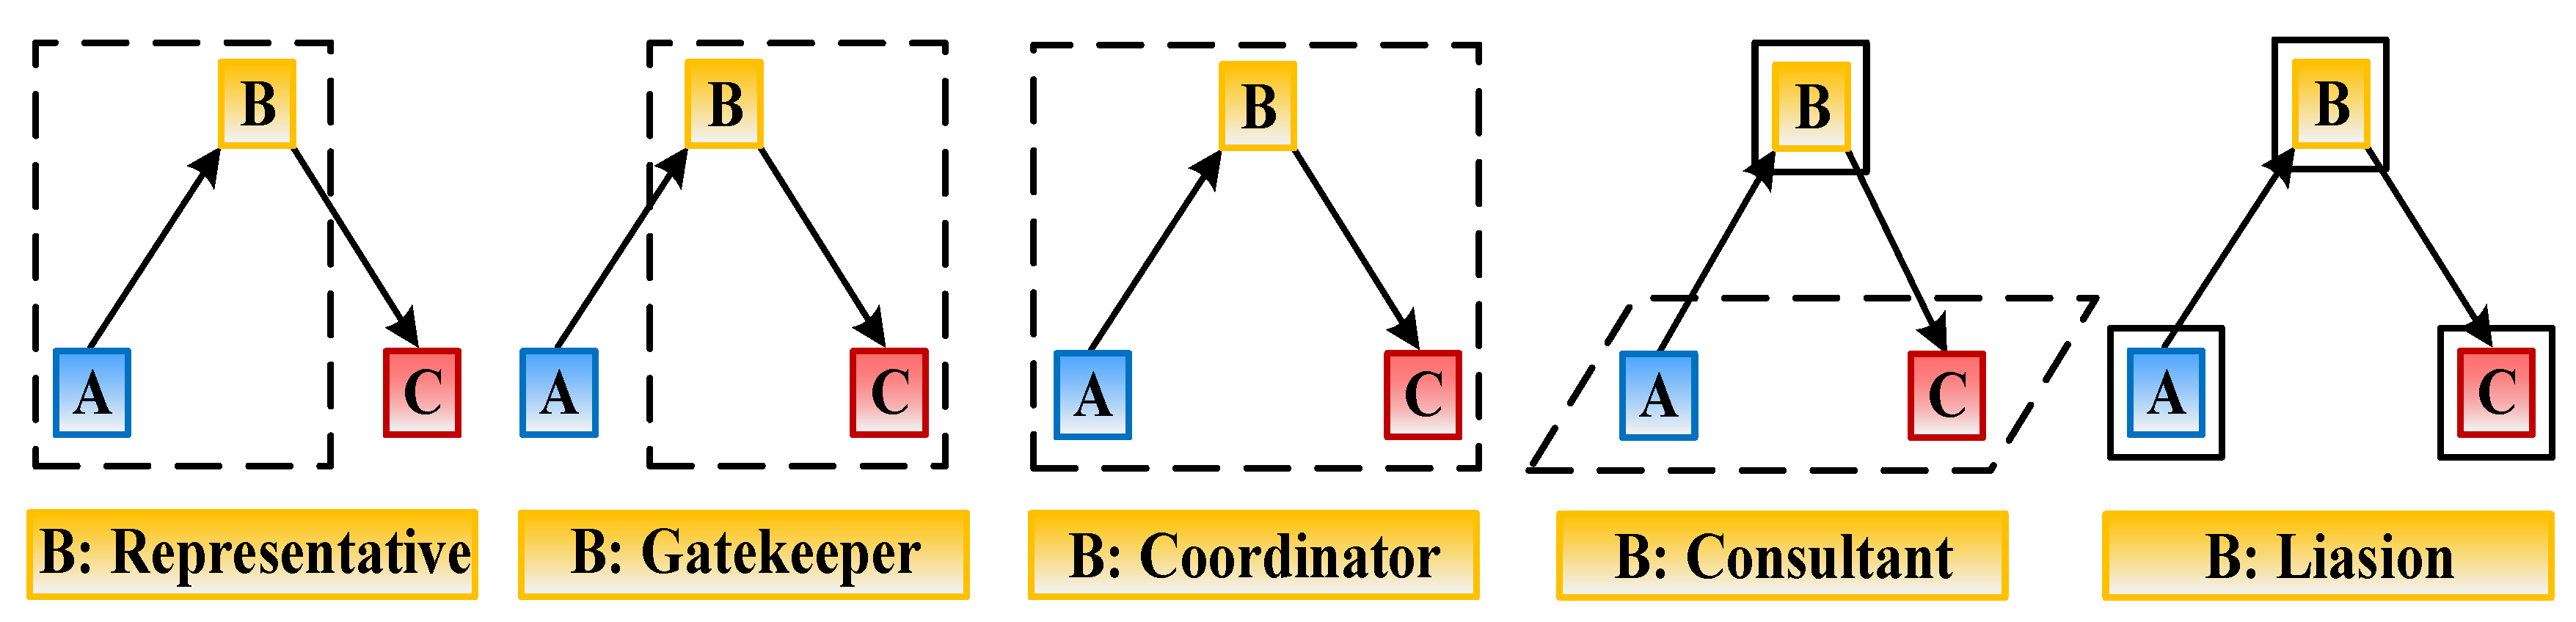
4.3.1. Brokerage Analysis

In this paper, brokerage analysis is conducted based on PICT stakeholder and stage categorization criteria to identify the critical role of key vulnerability nodes within the network. Figure 6 and Figure 7 illustrate the top ten vulnerability nodes in terms of brokerage scores, further unveiling the mechanisms of information flow and dissemination. Among these nodes, S1V1, S2V9, and S1V25 hold the top three positions, highlighting their essential roles in facilitating the transfer of resources, information, and influence among stakeholders. Under the stakeholder classification criteria, S7V16 stands out as a key liaison, indicating its crucial bridging function in maintaining connectivity and ensuring efficient information flow. Given that carbon market maturity directly affects liquidity and price stability, this node plays a pivotal role in promoting market circulation and integrating various market participants within PICT. Additionally, S1V1 exhibits significant influence in terms of representation, signifying that it not only occupies a central position in government decision-making but also shapes the behavioral patterns of other stakeholders. When analyzed based on PICT stage classification, S1V1 demonstrates excellence across all five brokerage roles, further reinforcing its centrality and extensive influence within the network.

4.3.2. Betweenness Centrality

The betweenness centrality measures a node’s function as a bridge between other nodes, reflecting its “control” and “regulating power” within the network. Nodes with high betweenness centrality play crucial roles in information transmission, resource allocation, and policy implementation, meaning that any changes or interventions affecting these nodes will directly impact the stability and resilience of the entire network. Table 4 presents the ten key vulnerability nodes ranked by betweenness centrality and their interactions. Among them, S1V1, S2V9, and S1V25 hold the top three positions and frequently appear in the vulnerability interaction network. These nodes and their connections serve as critical moderating agents in the operational, regulatory, and trading aspects of PICT. Consequently, targeted mitigation strategies should prioritize these high-betweenness nodes to enhance system stability and reduce vulnerability propagation risks.

5. Discussion

5.1. Critical Challenges in PICT

The selection of critical vulnerability nodes is based on the constructed vulnerability network and the quantitative results of multidimensional indicators. First, this paper uses NetMiner 4.0 to calculate the out-degree, in-degree, status centrality, betweenness centrality, and degree difference for all 48 nodes in the network, as well as the Coordinator, Liaison, and Gatekeeper brokerage role scores. Second, the results of the above eight metrics are sorted in descending order, and the frequency of each node being in the top 20% of each metric is counted; finally, the nodes that are ranked in the top five of frequency (i.e., at least in the five metrics) are counted in the top 20% of each metric. Finally, the nodes ranking in the top 5 (i.e., at least in the top 20% of the five indicators) are taken as the core candidates, and then those that are inconsistent with the actual situation are excluded after review, and the critical vulnerability nodes are finally identified for subsequent in-depth analysis and countermeasure design. As a result, 13 critical vulnerability nodes are identified, including S1V1, S1V2, S1V25, S1V21, S2V7, S2V9, S2V12, S3V8, S4V13, S5V23, S6V16, S7V16, and S7V17. Additionally, 10 critical vulnerability interactions are recognized, including S2V4→S1V1, S2V11→S2V9, S2V15→S1V21, S1V21→S1V1, S6V14→S2V9, S2V12→S1V19, S5V23→S1V2, S7V17→S1V2, S1V25→S1V1, and S6V16→S1V25.
It is found that the critical vulnerabilities of PICT and their interactions exhibit a high degree of systemicity and path-dependence, focusing on policy formulation, market trading mechanisms, and regulatory systems. Although the three core dimensions as the underlying components of PICT operation are consistent with the direction of existing research concerns, the propagation structure identified in this study through the SNA methodology shows a change in the hierarchical order of impacts [50,51]. Policymaking no longer exists only as an upstream variable, but plays the most central structural role in the network, becoming the source node and the starting point of the path of vulnerability diffusion to the market and regulatory system. First, from the perspective of policy formulation, the initial institutional arrangements of PICT (e.g., aggregate control, quota allocation rules) directly affect market participation expectations and institutional trust. Through the multi-level policy transmission path, institutional deficiencies not only affect the trading behavior and asset allocation of enterprises but also exacerbate the complexity of regulatory enforcement. The results show that the nodes of irrational quota setting and lagging policy adjustment have the highest degree of out-degree in the network, suggesting that they are the key starting point of vulnerability diffusion as well as the intermediary bridge of multi-path transmission. Unreasonable policy design can weaken corporate incentives, stimulate speculative trading, cause market friction, and expand uncertainty through delayed response, thus hindering the long-term stability of the carbon market [33].
Second, in terms of market trading mechanisms, price volatility, opaque trading information, and a lack of financial instruments are important factors that exacerbate the vulnerability of the PICT system. The key transmission paths identified in this study, such as a “lack of financial products, high price volatility, and chaotic corporate strategies”, show a typical chain amplification effect. At the same time, short-term arbitrage behavior and regulatory blindness in the carbon market form a cross-coupling that amplifies the volatility risk of the system, reflecting that the vulnerability of the market dimension is highly dependent on the linkage between policy and regulatory governance [36]. Finally, from the perspective of the regulatory system, the inconsistent implementation of MRV, data forgery, lax law enforcement, and other issues has formed a typical “regulatory void zone”, which is manifested in the SNA network as a cluster of multiple high-input and low-output nodes, implying that it is not only the “end point” of the flow of information and institutional constraints but also the bottleneck of the system’s resilience [55,56]. In particular, the lack of independence of third-party verification agencies and the lack of accountability mechanisms reduce the credibility of regulation and make vulnerability accumulate in the network, which is difficult to reverse. In summary, the multi-path interaction structure revealed by the social network analysis shows that the vulnerability of PICT is not dominated by a single link, but originates from the nonlinear coupling and feedback diffusion among the triad system of “policy-market-regulation”. The polycentric and weakly coupled structure determines that it is difficult to optimize a single vulnerability node, and a systematic intervention strategy oriented to the weakening of critical paths and the mitigation of core nodes is urgently needed.

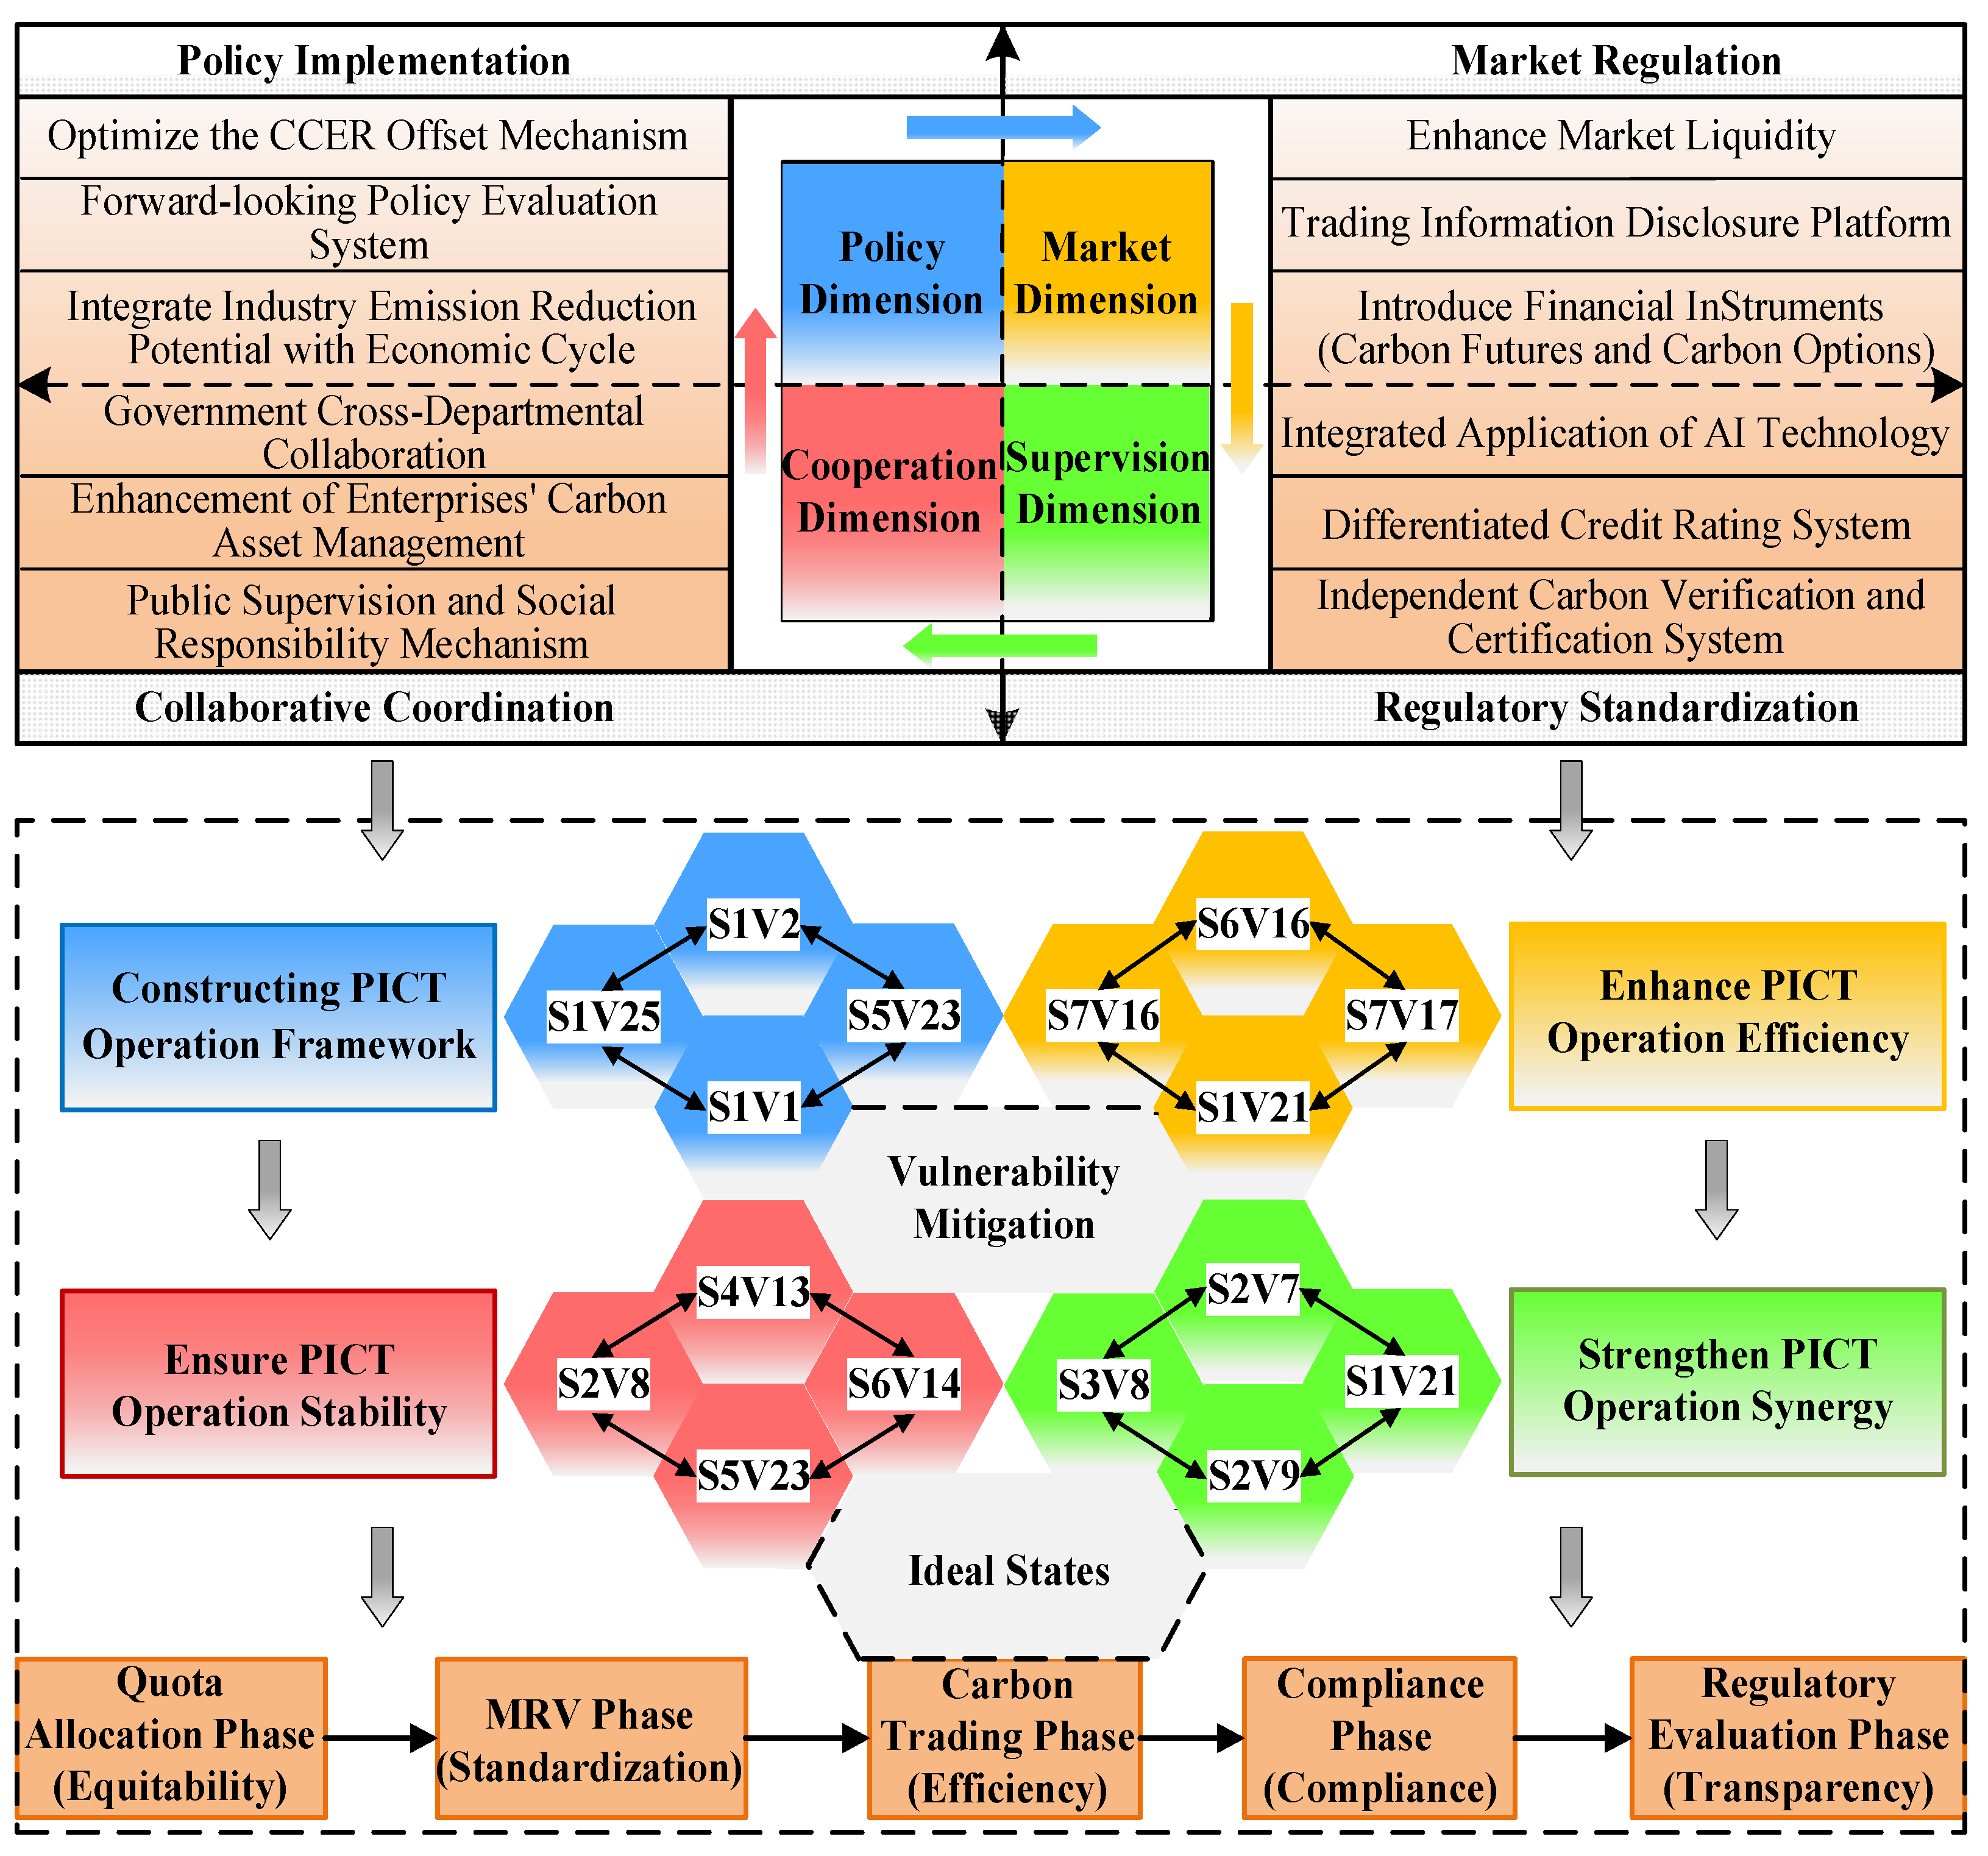
5.2. Vulnerabilities Mitigation Strategies

The vulnerabilities of PICT under carbon market regulation are fundamentally rooted in the intricate interactions among the three key systems: policy, market, and regulation. To address these vulnerabilities, this study proposes a four-dimensional policy–market–regulation–synergy framework aimed at regulating stakeholder behavior and stabilizing PICT, as shown in Figure 8. From the policy-setting point of view, the shortcomings in the design of the carbon market jeopardize fairness and reduce the incentives for enterprises to comply. To alleviate these problems, the allocation of quotas should be optimized by combining industrial emission reduction potential with economic cycles, and a dynamic adjustment mechanism for initial quotas in the carbon market should be established. Drawing on the Market Stabilization Reserve (MSR) system in the EU ETS, the supply of allowances should be automatically adjusted according to the fluctuation in the carbon price in the market or the change in trading volume, so as to calm down the drastic price fluctuations and prevent excessive speculation. At the same time, it is recommended to strengthen the policy forward-looking assessment and flexible amendment mechanism, and reduce the negative impact of policy uncertainty on carbon asset management by setting up a window period and feedback cycle for policy adjustment.
With regard to the construction of market trading mechanisms, challenges such as carbon price volatility, low information transparency, rampant speculation, and an underdeveloped carbon financial derivatives market have led to instability in PICT. To cope with these risks, a unified trading information disclosure platform should be established to accelerate the development of the carbon financial derivatives market, encourage the introduction of hedging tools such as carbon futures and carbon options, and enhance the ability of enterprises to manage the risk of carbon price fluctuations. Referring to the experience of California’s carbon market, a price stabilization mechanism can be set up to set the minimum and maximum carbon price range to guarantee the effectiveness and rationality of the market price signal. In addition, the transparency of trading information should be improved, and a unified, real-time public carbon trading information platform should be built to reduce information asymmetry and improve market efficiency.
In terms of the construction of the regulatory system, inconsistent MRV standards, data falsification, and weak law enforcement have undermined the integrity of the market. The carbon emission data deposit and audit mechanism based on blockchain technology ensures the authenticity and non-tamperability of emission data, effectively enhancing verification efficiency and credibility. At the same time, the independence supervision of third-party verification organizations should be strengthened, and a negative list and qualification dynamic assessment mechanism should be set up to prevent the risk of data falsification due to collusion of interests. Finally, effective multi-stakeholder cooperation is crucial to ensure the stable operation of PICT. The government should promote cross-sectoral cooperation to align carbon market policies with fiscal and environmental regulations, thereby minimizing institutional conflicts and enhancing policy coherence. Enterprises must enhance market resilience through digital transformation, optimize carbon asset management strategies, and reduce risks associated with carbon price volatility. At the societal level, the introduction of public oversight mechanisms and corporate social responsibility initiatives can improve market transparency and enhance trust in the carbon trading system.

5.3. Effectiveness of Vulnerability Mitigation Strategies

To comprehensively evaluate the effectiveness of the proposed vulnerability mitigation strategies, this study employs NetMiner 4.0 software to optimize and analyze the PICT vulnerability network. The impact of the strategies on the PICT network is quantitatively assessed by removing key vulnerability nodes and their interactions, followed by a re-evaluation of network density, cohesion, and path structure. The optimization results indicate a reduction in network nodes from 49 to 38 and a decrease in vulnerability links from 435 to 160. The substantial 63.22% reduction in vulnerability links highlights a significant decrease in system redundancy and complexity. The optimized PICT vulnerability network topology, as illustrated in Figure 9, reveals a streamlined structure with considerably simplified links, a looser overall configuration, and a notable contraction of vulnerability propagation paths. Further quantitative analysis shows that network density declines from 0.183 to 0.134, marking a 26.77% reduction, which suggests a significant weakening of network tightness and a reduction in the clustering effect of vulnerability factors. Network cohesion drops from 0.725 to 0.471, a 35.03% decrease, indicating a lower degree of vulnerability coupling within the system. Additionally, the average path length increases from 1.998 to 2.415, confirming a decentralization trend in the network structure, effectively disrupting the chain propagation of vulnerability nodes.

6. Conclusions

First, PICT vulnerability is characterized by multi-dimensional complexity and high systemicity, which cuts across all stages of carbon quota setting and allocation, MRV, etc. It encompasses multiple dimensions, including policy formulation, market mechanisms, and regulatory frameworks. Vulnerability nodes are intricately linked, exerting different levels of influence across various stages. Among these, policy formulation, market trading, and regulatory mechanisms hold the most significant impact. The initial policy framework determines market trading dynamics and the effectiveness of regulatory enforcement. Specifically, irrational quota setting and allocation can lead to carbon price volatility and conflicts of interest among market participants. Data distortion and lack of standardized MRV procedures undermine market transparency and fairness. Furthermore, price fluctuations and information opacity during the carbon quota trading phase intensify speculative behavior and systemic risks, which subsequently affect the compliance and clearance stage, increasing enterprises’ compliance burden and weakening market discipline. Delayed policy adjustments and inadequate assessment mechanisms in the regulation and evaluation phase further impair market credibility, exacerbating uncertainties and systemic risks within the carbon market.
Second, PICT vulnerability diffusion exhibits subject correlation and multilevel transmission effects. Different stakeholders play distinct roles in the propagation of vulnerabilities, shaping market dynamics through complex interaction mechanisms. Government agencies hold a dominant position in the network, where policy uncertainty and weak implementation amplify PICT volatility and systemic risk. As the primary compliance entities, power enterprises’ willingness and ability to manage carbon assets directly influence market liquidity and stability. The independence and credibility of third-party verification agencies are crucial for ensuring data transparency and fairness. Carbon trading centers, through their platforms and market mechanisms, impact carbon price formation and overall market stability. Industry associations play a pivotal role in establishing industry norms and coordinating stakeholder interests, while misalignment or misinformation can aggravate market fragmentation and conflicts. Investment and financial institutions contribute to the liquidity of the carbon derivatives market, yet inadequate upper-level regulations may fuel excessive speculation and heighten price volatility risks.
Finally, to systematically mitigate the diffusion of PICT vulnerabilities, this paper proposes a multidimensional governance framework structured around four key dimensions: policy, market, regulation, and synergy. Targeted strategies are designed to address the operational structure, efficiency, stability, and stakeholder collaboration within PICT. For each dimension, comprehensive measures are outlined, such as dynamic quota adjustment and forward-looking policy evaluation (policy), expansion of carbon financial instruments and establishment of real-time trading information platforms (market), standardization and digitalization of MRV protocols and enhancement of third-party verification independence (regulation), and promotion of cross-sectoral coordination and differentiated support for diverse stakeholders (synergy). Simulation analysis verifies the effectiveness of this framework in reducing critical vulnerability connections and improving fairness, resilience, and adaptability. Overall, the proposed governance system offers actionable guidance for regulating stakeholder behavior and optimizing interaction mechanisms, providing a systematic foundation for the power sector’s low-carbon transition and the stable development of carbon markets.
This paper investigates PICT vulnerabilities under carbon market regulation and proposes targeted mitigation strategies that fill critical gaps and guide stakeholders in engaging proactively with carbon trading while protecting their interests. Nevertheless, two key limitations warrant further attention. First, PICT vulnerability profiles differ markedly across regions due to variations in policy frameworks, economic development levels, and industrial structures, calling for comparative, jurisdiction-specific analyses to refine and adapt mitigation strategies. Second, although this study identifies primary power sector actors, it does not fully capture the complex strategic interactions, trust dynamics, and information-transfer processes that shape vulnerability diffusion. Future research should integrate multi-agent game-theoretic models and empirical studies of trust and knowledge dissemination to unravel these interdependencies and develop more nuanced, context-tailored PICT optimization strategies.

Author Contributions

Conceptualization, L.L. and C.X.; methodology, B.L.; software, X.Y.; validation, R.Z. and X.Y.; formal analysis, L.L.; investigation, R.Z.; resources, B.L.; data curation, C.X.; writing—original draft preparation, L.L.; writing—review and editing, C.X.; visualization, R.Z.; supervision, X.Y.; project administration, C.X.; funding acquisition, L.L. All authors have read and agreed to the published version of the manuscript.

Funding

This research was funded by State Grid Liaoning Electric Power Company Limited Economic Research Institute, grant number SGTYHT/23-JS-004.

Institutional Review Board Statement

Not applicable.

Informed Consent Statement

Not applicable.

Data Availability Statement

Data used can be shared by contacting the corresponding author.

Conflicts of Interest

Authors Ce Xiu, Bing Liu, Xingcheng Yu were employed by the company State Grid Liaoning Electric Power Company Limited Economic Research Institute.The remaining authors declare that the research was conducted in the absence of any commercial or financial relationships that could be construed as a potential conflict of interest.

References

  1. Cheng, X.M.; Ye, K.; Du, A.M.; Bao, Z.Z.; Chlomou, G. Dual carbon goals and renewable energy innovations. Res. Int. Bus. Financ. 2024, 70, 11. [Google Scholar] [CrossRef]
  2. Xu, Y.Y.; Ramanathan, V.; Victor, D.G. Global warming will happen faster than we think. Nature 2018, 564, 30–32. [Google Scholar] [CrossRef] [PubMed]
  3. Timilsina, G.R. Carbon Taxes. J. Econ. Lit. 2022, 60, 1456–1502. [Google Scholar] [CrossRef]
  4. Tang, B.J.; Ji, C.J.; Hu, Y.J.; Tan, J.X.; Wang, X.Y. Optimal carbon allowance price in China’s carbon emission trading system: Perspective from the multi-sectoral marginal abatement cost. J. Clean. Prod. 2020, 253, 12. [Google Scholar] [CrossRef]
  5. Su, C.; Zha, X.X.; Ma, J.Y.; Li, B.Y.; Wang, X.P. Dynamic Optimal Control Strategy of CCUS Technology Innovation in Coal Power Stations Under Environmental Protection Tax. Systems 2025, 13, 193. [Google Scholar] [CrossRef]
  6. Li, G.H.; Niu, M.M. How does the carbon trading scheme promote the decarbonization of China’s power sector? J. Environ. Plan. Manag. 2024, 28, 1969–1996. [Google Scholar] [CrossRef]
  7. Chen, X.H.; Zhang, C. A dynamic analysis of a green closed-loop supply chain with different on-line platform smart recycling and selling models. Comput. Ind. Eng. 2025, 200, 19. [Google Scholar] [CrossRef]
  8. Zhou, K.L.; Li, Y.W. Carbon finance and carbon market in China: Progress and challenges. J. Clean. Prod. 2019, 214, 536–549. [Google Scholar] [CrossRef]
  9. Ren, Z.R.; Zhang, S.F.; Liu, H.J.; Huang, R.; Wang, H.Q.; Pu, L. The feasibility and policy engagements in achieving net zero emission in China’s power sector by 2050: A LEAP-REP model analysis. Energy Conv. Manag. 2024, 304, 19. [Google Scholar] [CrossRef]
  10. Liu, Q.; Zheng, X.Q.; Zhao, X.C.; Chen, Y.; Lugovoy, O. Carbon emission scenarios of China’s power sector: Impact of controlling measures and carbon pricing mechanism. Adv. Clim. Change Res. 2018, 9, 27–33. [Google Scholar] [CrossRef]
  11. Howie, P.; Atakhanova, Z. Assessing initial conditions and ETS outcomes in a fossil-fuel dependent economy. Energy Strateg. Rev. 2022, 40, 12. [Google Scholar] [CrossRef]
  12. Barragán-Beaud, C.; Pizarro-Alonso, A.; Xylia, M.; Syri, S.; Silveira, S. Carbon tax or emissions trading? An analysis of economic and political feasibility of policy mechanisms for greenhouse gas emissions reduction in the Mexican power sector. Energy Policy 2018, 122, 287–299. [Google Scholar] [CrossRef]
  13. Zhao, Y.H.; Li, H.; Xiao, Y.L.; Liu, Y.; Cao, Y.; Zhang, Z.H.; Wang, S.; Zhang, Y.F.; Ahmad, A. Scenario analysis of the carbon pricing policy in China’s power sector through 2050: Based on an improved CGE model. Ecol. Indic. 2018, 85, 352–366. [Google Scholar] [CrossRef]
  14. Xu, Y.Y.; Zhao, S.; Chu, B.X.; Zhu, Y.L. Emission Reduction Effects of China’s National Carbon Market: Evidence Based on the Power Sector. Energies 2024, 17, 16. [Google Scholar] [CrossRef]
  15. Meng, M.; Wang, L.X.; Chen, Q. Quota Allocation for Carbon Emissions in China’s Electric Power Industry Based Upon the Fairness Principle. Energies 2018, 11, 16. [Google Scholar] [CrossRef]
  16. Cui, X.Y.; Zhao, T.; Wang, J. Allocation of carbon emission quotas in China’s provincial power sector based on entropy method and ZSG-DEA. J. Clean. Prod. 2021, 284, 11. [Google Scholar] [CrossRef]
  17. Xiao, J.; Li, G.H.; Xie, L.; Wang, S.Y.; Yu, L.A. Decarbonizing China’s power sector by 2030 with consideration of technological progress and cross-regional power transmission. Energy Policy 2021, 150, 14. [Google Scholar] [CrossRef]
  18. Chen, H.D.; Wang, C.; Cai, W.J.; Wang, J.H. Simulating the impact of investment preference on low-carbon transition in power sector. Appl. Energy 2018, 217, 440–455. [Google Scholar] [CrossRef]
  19. Li, W.; Zhang, Y.W.; Lu, C. The impact on electric power industry under the implementation of national carbon trading market in China: A dynamic CGE analysis. J. Clean. Prod. 2018, 200, 511–523. [Google Scholar] [CrossRef]
  20. Yang, M.; Wang, D.X.; Chen, X.F.; Lei, X.M.; Cao, L.X. Influence mechanism of technological innovation of electric power industry on carbon emission reduction in China. Int. J. Clim. Change Strateg. Manag. 2023, 15, 232–246. [Google Scholar] [CrossRef]
  21. Li, R.; Chen, Z.; Xiang, J.Y. A region-scale decoupling effort analysis of carbon dioxide emissions from the perspective of electric power industry: A case study of China. Environ. Dev. Sustain. 2023, 25, 4007–4032. [Google Scholar] [CrossRef]
  22. Liu, L.L.; Feng, T.T.; Kong, J.J. Can carbon trading policy and local public expenditures synergize to promote carbon emission reduction in the power industry? Resour. Conserv. Recycl. 2023, 188, 15. [Google Scholar] [CrossRef]
  23. Qi, C.; Choi, Y. A study on the CO2 marginal abatement cost of coal-fueled power plants: Is the current price of China pilot carbon emission trading market rational? Carbon Manag. 2020, 11, 303–314. [Google Scholar] [CrossRef]
  24. Xie, L.; Zhou, Z.C.; Hui, S.M. Does environmental regulation improve the structure of power generation technology? Evidence from China’s pilot policy on the carbon emissions trading market (CETM). Technol. Forecast. Soc. Change 2022, 176, 11. [Google Scholar] [CrossRef]
  25. Xian, Y.J.; Wang, K.; Wei, Y.M.; Huang, Z.M. Would China’s power industry benefit from nationwide carbon emission permit trading? An optimization model-based ex post analysis on abatement cost savings. Appl. Energy 2019, 235, 978–986. [Google Scholar] [CrossRef]
  26. Pietzcker, R.C.; Osorio, S.; Rodrigues, R. Tightening EU ETS targets in line with the European Green Deal: Impacts on the decarbonization of the EU power sector. Appl. Energy 2021, 293, 18. [Google Scholar] [CrossRef]
  27. Chen, W.Y.; Zhang, L.G.; Shi, L.J.; Shao, Y.Q.; Zhou, K.H. Carbon emissions trading system and investment efficiency: Evidence from China. J. Clean. Prod. 2022, 358, 12. [Google Scholar] [CrossRef]
  28. Ma, C.Q.; Ren, Y.S.; Zhang, Y.J.; Sharp, B. The allocation of carbon emission quotas to five major power generation corporations in China. J. Clean. Prod. 2018, 189, 1–12. [Google Scholar] [CrossRef]
  29. Han, Y.H.; Tan, S.T.; Zhu, C.W.; Liu, Y. Research on the emission reduction effects of carbon trading mechanism on power industry: Plant-level evidence from China. Int. J. Clim. Change Strateg. Manag. 2023, 15, 212–231. [Google Scholar] [CrossRef]
  30. Guo, H.Y.; Davidson, M.R.; Chen, Q.X.; Zhang, D.; Jiang, N.; Xia, Q.; Kang, C.Q.; Zhang, X.L. Power market reform in China: Motivations, progress, and recommendations. Energy Policy 2020, 145, 14. [Google Scholar] [CrossRef]
  31. Wang, Z.H.; Li, J.Y.; Lu, B.; Wang, B.; Zhang, B.; Sun, K.N.; Fan, M. Effectiveness and risk of initial carbon quota allocation principle under the uncertainty of the Chinese electricity market. China Econ. Rev. 2023, 77, 15. [Google Scholar] [CrossRef]
  32. Liu, L.W.; Chen, C.X.; Zhao, Y.F.; Zhao, E.D. China’s carbon-emissions trading: Overview, challenges and future. Renew. Sust. Energ. Rev. 2015, 49, 254–266. [Google Scholar] [CrossRef]
  33. Chen, F.; Zhao, T.; Xia, H.M.; Cui, X.Y.; Li, Z.Y. Allocation of carbon emission quotas in Chinese provinces based on Super-SBM model and ZSG-DEA model. Clean Technol. Environ. Policy 2021, 23, 2285–2301. [Google Scholar] [CrossRef]
  34. Chi, Y.Y.; Zhao, H.; Hu, Y.; Yuan, Y.K.; Pang, Y.X. The impact of allocation methods on carbon emission trading under electricity marketization reform in China: A system dynamics analysis. Energy 2022, 259, 18. [Google Scholar] [CrossRef]
  35. Zhao, X.G.; Jiang, G.W.; Nie, D.; Chen, H. How to improve the market efficiency of carbon trading: A perspective of China. Renew. Sust. Energ. Rev. 2016, 59, 1229–1245. [Google Scholar] [CrossRef]
  36. Fan, J.H.; Todorova, N. Dynamics of China’s carbon prices in the pilot trading phase. Appl. Energy 2017, 208, 1452–1467. [Google Scholar] [CrossRef]
  37. Teng, F.; Jotzo, F.; Wang, X. Interactions between market reform and a carbon price in China’s power sector. Econ. Energy Environ. Policy 2017, 6, 39–54. [Google Scholar] [CrossRef]
  38. Qi, S.Z.; He, A.Q.; Zhang, J.H. The Effective Benchmark Selection Model and Simulation in the Power Sector of China’s ETS. Clim. Change Econ. 2020, 11, 39. [Google Scholar] [CrossRef]
  39. Zeng, Q.; Ma, F.; Lu, X.J.; Xu, W.J. Policy uncertainty and carbon neutrality: Evidence from China. Financ. Res. Lett. 2022, 47, 6. [Google Scholar] [CrossRef]
  40. Song, Y.Z.; Liu, T.S.; Li, Y.; Zhu, Y.; Ye, B. Paths and policy adjustments for improving carbon-market liquidity in China. Energy Econ. 2022, 115, 12. [Google Scholar] [CrossRef]
  41. Camacho, D.; Panizo-Lledot, A.; Bello-Orgaz, G.; Gonzalez-Pardo, A.; Cambria, E. The four dimensions of social network analysis: An overview of research methods, applications, and software tools. Inf. Fusion 2020, 63, 88–120. [Google Scholar] [CrossRef]
  42. Otte, E.; Rousseau, R. Social network analysis: A powerful strategy, also for the information sciences. J. Inf. Sci. 2002, 28, 441–453. [Google Scholar] [CrossRef]
  43. Lee, C.Y.; Chong, H.Y.; Liao, P.C.; Wang, X.Y. Critical Review of Social Network Analysis Applications in Complex Project Management. J. Manag. Eng. 2018, 34, 15. [Google Scholar] [CrossRef]
  44. Xian, Z.; Yun, L.; Chan, A.P.C.; Yi, H.; Yongkui, L. Review of the application of social network analysis (SNA) in construction project management research. Int. J. Proj. Manag. 2016, 34, 1214–1225. [Google Scholar] [CrossRef]
  45. Yuan, M.Q.; Li, Z.F.; Li, X.D.; Luo, X.W. Managing stakeholder-associated risks and their interactions in the life cycle of prefabricated building projects: A social network analysis approach. J. Clean. Prod. 2021, 323, 18. [Google Scholar] [CrossRef]
  46. Yang, Y.R.; Zuo, J.; Pan, M.; Chang, R.D.; Zou, Z.J.; Webber, R.J.; Dong, N. Analysis of stakeholder-associated factors and their interactions in energy conservation behaviour of occupants: Evidence from network analysis. Environ. Dev. Sustain. 2024, 36. [Google Scholar] [CrossRef]
  47. Luo, L.Z.; Li, Y.K.; Wang, X.; Jin, X.; Qin, Z.Y. Supply Chain Vulnerability in Prefabricated Building Projects and Digital Mitigation Technologies. IEEE Trans. Eng. Manag. 2024, 71, 10686–10698. [Google Scholar] [CrossRef]
  48. Hu, X.; Chong, H.Y.; Wang, X.Y.; London, K. Understanding Stakeholders in Off-Site Manufacturing: A Literature Review. J. Constr. Eng. Manag. 2019, 145, 15. [Google Scholar] [CrossRef]
  49. Luo, L.Z.; Shen, G.Q.; Xu, G.Y.; Liu, Y.L.; Wang, Y.J. Stakeholder-Associated Supply Chain Risks and Their Interactions in a Prefabricated Building Project in Hong Kong. J. Manag. Eng. 2019, 35, 14. [Google Scholar] [CrossRef]
  50. Lin, B.Q.; Jia, Z.J. Why do we suggest small sectoral coverage in China’s carbon trading market? J. Clean. Prod. 2020, 257, 14. [Google Scholar] [CrossRef]
  51. Cong, R.G.; Wei, Y.M. Potential impact of (CET) carbon emissions trading on China’s power sector: A perspective from different allowance allocation options. Energy 2010, 35, 3921–3931. [Google Scholar] [CrossRef]
  52. Chen, S.; Shi, A.N.; Wang, X. Carbon emission curbing effects and influencing mechanisms of China’s Emission Trading Scheme: The mediating roles of technique effect, composition effect and allocation effect. J. Clean. Prod. 2020, 264, 15. [Google Scholar] [CrossRef]
  53. Ji, C.J.; Hu, Y.J.; Tang, B.J.; Qu, S. Price drivers in the carbon emissions trading scheme: Evidence from Chinese emissions trading scheme pilots. J. Clean. Prod. 2021, 278, 12. [Google Scholar] [CrossRef]
  54. Hu, Y.J.; Li, X.Y.; Tang, B.J. Assessing the operational performance and maturity of the carbon trading pilot program: The case study of Beijing’s carbon market. J. Clean. Prod. 2017, 161, 1263–1274. [Google Scholar] [CrossRef]
  55. Maosheng, D.; Tao, P.; Xiliang, Z. Review of carbon emissions trading pilots in China. Energy Environ. 2014, 25, 527–549. [Google Scholar] [CrossRef]
  56. Yang, Y.; Cheng, L.W. Operational efficiency evaluation and system design improvements for carbon emissions trading pilots in China. Carbon Manag. 2017, 8, 399–415. [Google Scholar] [CrossRef]
  57. Wang, J.Q.; Dai, P.F.; Chen, X.H.; Nguyen, D.K. Examining the linkage between economic policy uncertainty, coal price, and carbon pricing in China: Evidence from pilot carbon markets. J. Environ. Manag. 2024, 352, 16. [Google Scholar] [CrossRef]
  58. Morris, J.; Paltsev, S.; Ku, A.Y. Impacts of China’s emissions trading schemes on deployment of power generation with carbon capture and storage. Energy Econ. 2019, 81, 848–858. [Google Scholar] [CrossRef]
  59. Chang, K.; Ge, F.P.; Zhang, C.; Wang, W.H. The dynamic linkage effect between energy and emissions allowances price for regional emissions trading scheme pilots in China. Renew. Sust. Energ. Rev. 2018, 98, 415–425. [Google Scholar] [CrossRef]
  60. Zha, D.S.; Feng, T.T.; Kong, J.J. Effects of enterprise carbon trading mechanism design on willingness to participate-Evidence from China. Front. Environ. Sci. 2022, 10, 22. [Google Scholar] [CrossRef]
  61. Wang, X.Q.; Su, C.W.; Lobont, O.R.; Li, H.; Nicoleta-Claudia, M. Is China’s carbon trading market efficient? Evidence from emissions trading scheme pilots. Energy 2022, 245, 9. [Google Scholar] [CrossRef]
  62. Zhang, S.Y.; Jiang, K.; Wang, L.; Bongers, G.; Hu, G.P.; Li, J. Do the performance and efficiency of China’s carbon emission trading market change over time? Environ. Sci. Pollut. Res. 2020, 27, 33140–33160. [Google Scholar] [CrossRef] [PubMed]
  63. Kai, C.; Rongda, C.; Chevallier, J. Market fragmentation, liquidity measures and improvement perspectives from China’s emissions trading scheme pilots. Energy Econ. 2018, 75, 249–260. [Google Scholar] [CrossRef]
Figure 1. PICT stakeholders and activities.
Sustainability 17 04398 g001
Figure 2. Research framework.
Sustainability 17 04398 g002
Figure 3. Brokerage analysis category.
Sustainability 17 04398 g003
Figure 4. PICT vulnerability network-directed graph.
Sustainability 17 04398 g004
Figure 5. PICT vulnerability network status centrality.
Sustainability 17 04398 g005
Figure 6. Top 10 vulnerability nodes for brokerage analysis based on stakeholder.
Sustainability 17 04398 g006
Figure 7. Top 10 vulnerability nodes for brokerage analysis based on vulnerability category.
Sustainability 17 04398 g007
Figure 8. PICT vulnerability mitigation four-dimensional system.
Sustainability 17 04398 g008
Figure 9. Directed graph of PICT vulnerability network after mitigation.
Sustainability 17 04398 g009
Table 1. PICT vulnerability and description.
StageDescriptionStakeholdersReferences
Total Carbon Allowance Setting and Allocation StageUnreasonable setting of total carbon allowances V1Government Department, Power Enterprise, Third Party Verification Agency, Industry Association[50,51,52,53]
Inequity in the way carbon allowances allocated V2
Local government intervention leads to market fragmentation V3
Inaccurate historical carbon emission data V4
Unscientific industry baseline setting V5
Game of interests in high-emission and high-energy-consumption industries V6
MRV StageData falsification in carbon emission reports V7[54,55,56]
Lack of independence in third-party verification agencies V8
Lack of uniformity in monitoring methods and standards V9
Lack of coordination in the regulatory system V10
Insufficient transparency in carbon emission data V11
High costs of MRV V12
Carbon Allowance Trading StageVolatility in carbon prices V13Government Department, Power Enterprise, Carbon Trading Center, Industry Association, Investment Institution, Financial Institution[36,53,57,58,59]
Insufficient market liquidity V14
Carbon allowance hoarding V15
Immaturity of the carbon financial derivatives market V16
Lack of transparency in carbon allowance trading V17
Excessive financial speculation V18
Poor connection between regional carbon markets V19
Compliance and Clearance StageLow compliance willingness V20Government Department, Power Enterprise, Industry Association[58,60,61]
Insufficient regulatory penalties V21
Unreasonable deadlines for compliance V22
Irrational CCER offset ratio V23
Insufficient carbon asset management capacity V24
Regulation and Evaluation StageDelayed adjustment of carbon market policies V25Government Department, Power Enterprise, Third Party Verification Agency, Industry Association[54,56,62,63]
Unclear responsibilities and authorities of regulatory agencies V26
Lack of independence in third-party verification agency V27
Conflict between carbon market goals and economic development goals V28
Inadequate carbon credit evaluation system V29
Table 2. PICT stakeholder–vulnerability matrix.
No.S1V1S1V2S7V17S7V18
S1V1 (2, 3)
S1V2(3, 2) (3, 4)(4, 4)
(likelihood, level)
S7V17 (4, 3)
S7V18 (3, 2)
Table 3. Top 10 vulnerability nodes of out-status centrality, out-degree, degree difference, ego size.
RankingNodesOut-Status CentralityNodesOut-DegreeNodesDegree DifferenceNodesEgo Size
1S1V12.951710S1V132S1V117S1V132
2S1V22.244449S1V222S1V214S2V927
3S2V72.002302S2V721S2V711S1V526
4S3V81.832926S3V820S3V88S2V725
5S2V91.727897S2V918S1V196S1V1925
6S1V191.630182S1V1918S6V175S7V1624
7S7V161.407323S7V1615S6V185S3V823
8S3V271.266567S1V2515S4V174S1V223
9S1V211.252348S1V514S1V263S3V2721
10S1V251.208533S4V1313S1V233S4V1321
Table 4. Top 10 vulnerability nodes of node betweenness centrality and link betweenness centrality.
RankingRisk NodesNode Betweenness CentralityRisk InteractionsLink Betweenness Centrality
1S1V10.122319S2V4→S1V143.756
2S2V90.098750S2V11→S2V943.384
3S1V250.077409S2V15→S1V2130.659
4S7V160.056601S1V21→S1V128.864
5S1V190.049295S6V14→S2V928.095
6S3V80.046392S2V12→S1V1925.201
7S1V50.046113S5V23→S1V224.965
8S2V70.042557S7V17→S1V223.974
9S3V270.039767S1V25→S1V122.876
10S1V20.036953S6V16→S1V2521.983
Disclaimer/Publisher’s Note: The statements, opinions and data contained in all publications are solely those of the individual author(s) and contributor(s) and not of MDPI and/or the editor(s). MDPI and/or the editor(s) disclaim responsibility for any injury to people or property resulting from any ideas, methods, instructions or products referred to in the content.

