
Sustainable Risk Management Framework for Petroleum Storage Facilities: Integrating Bow-Tie Analysis and Dynamic Bayesian Networks


Abstract
1. Introduction
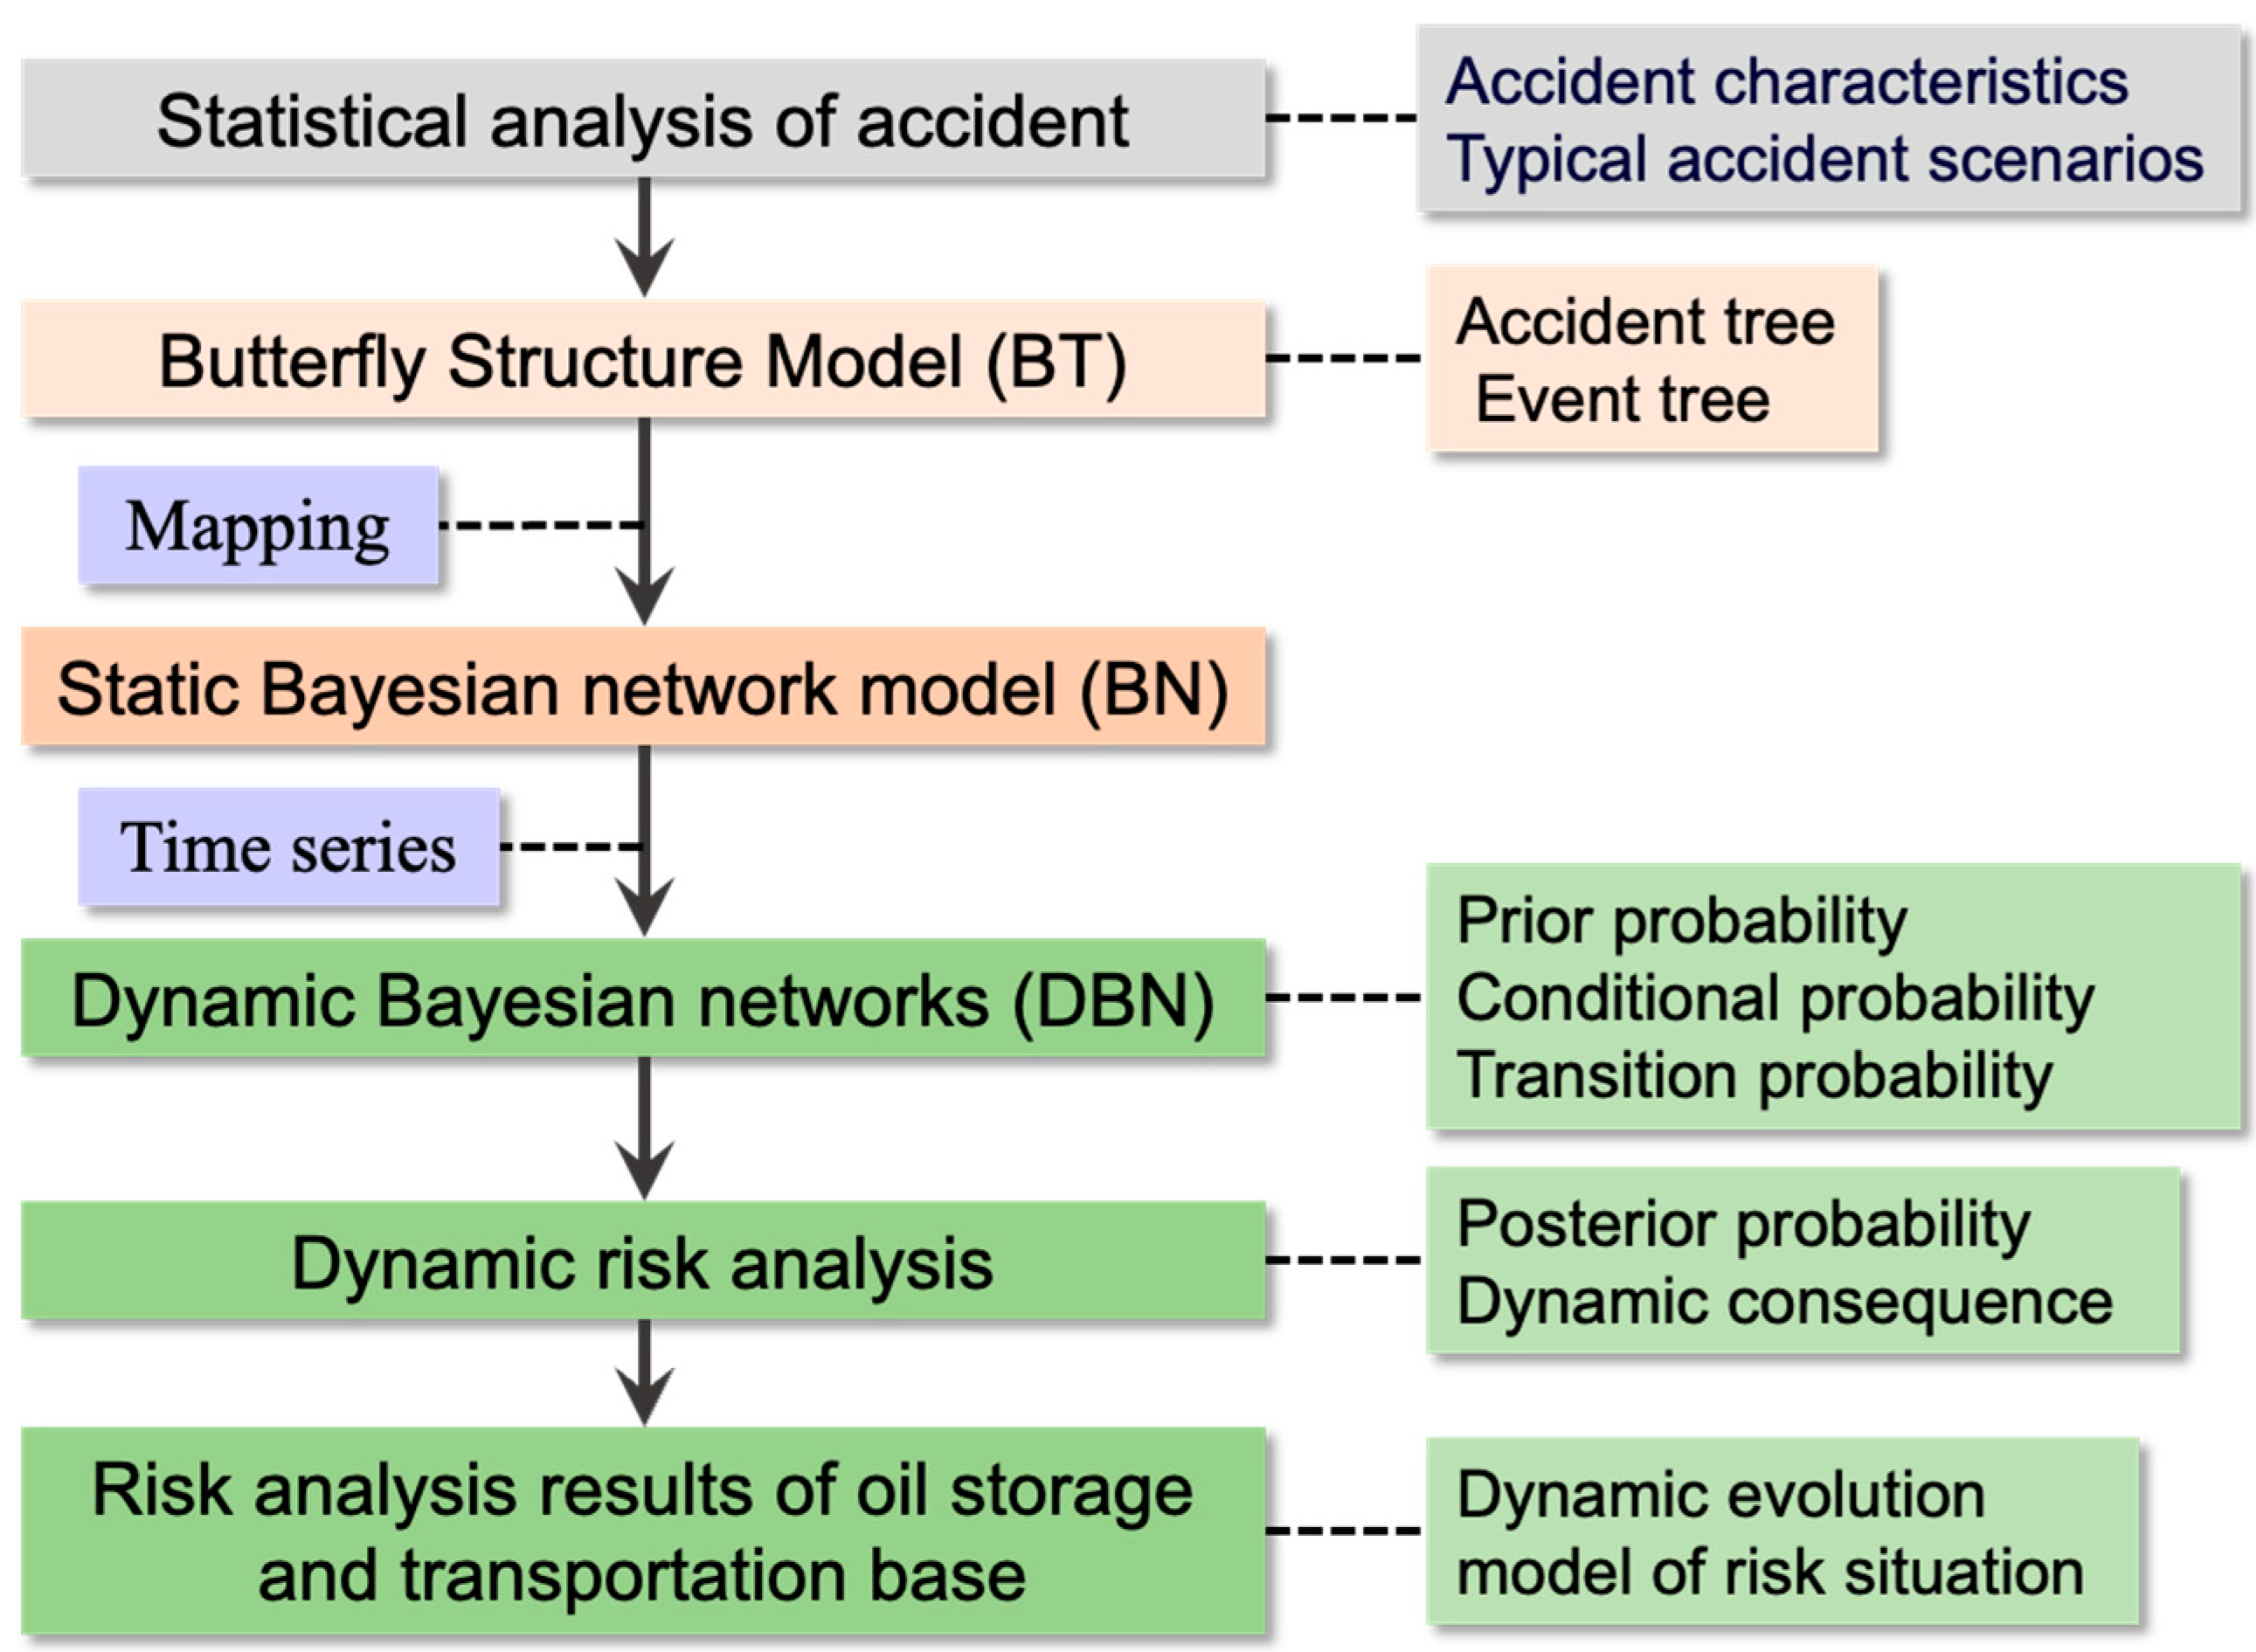
2. Methods
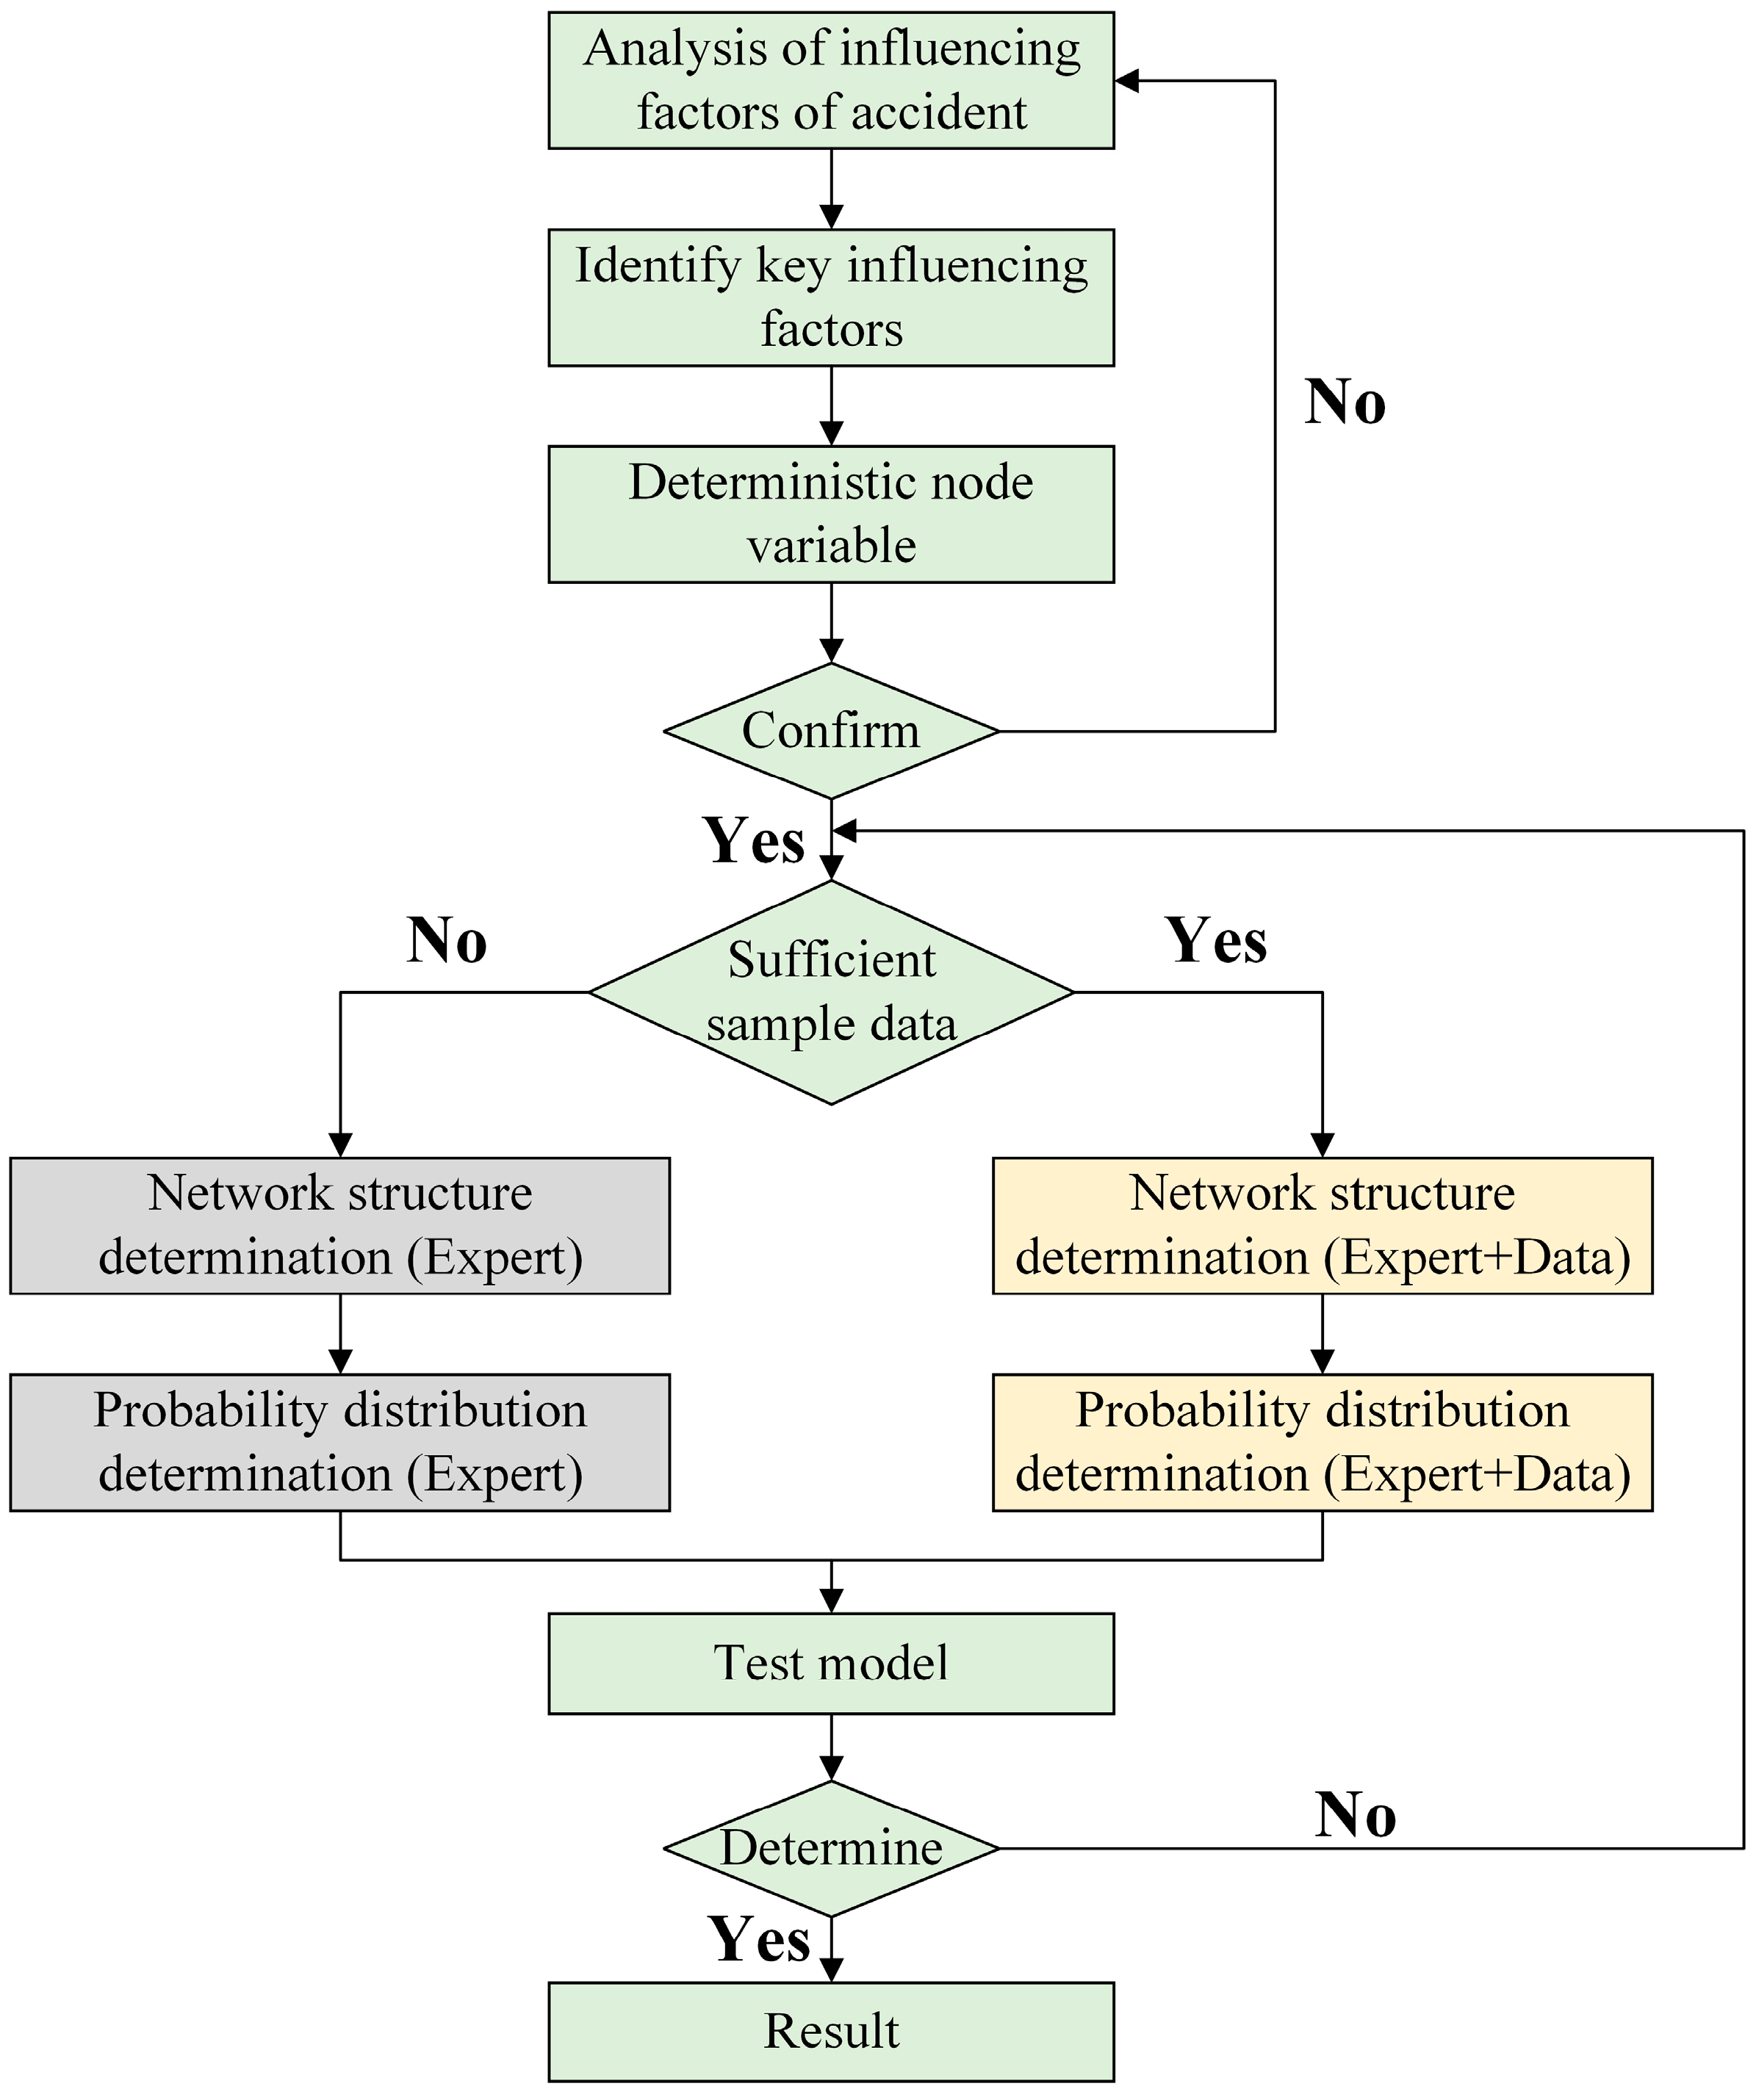
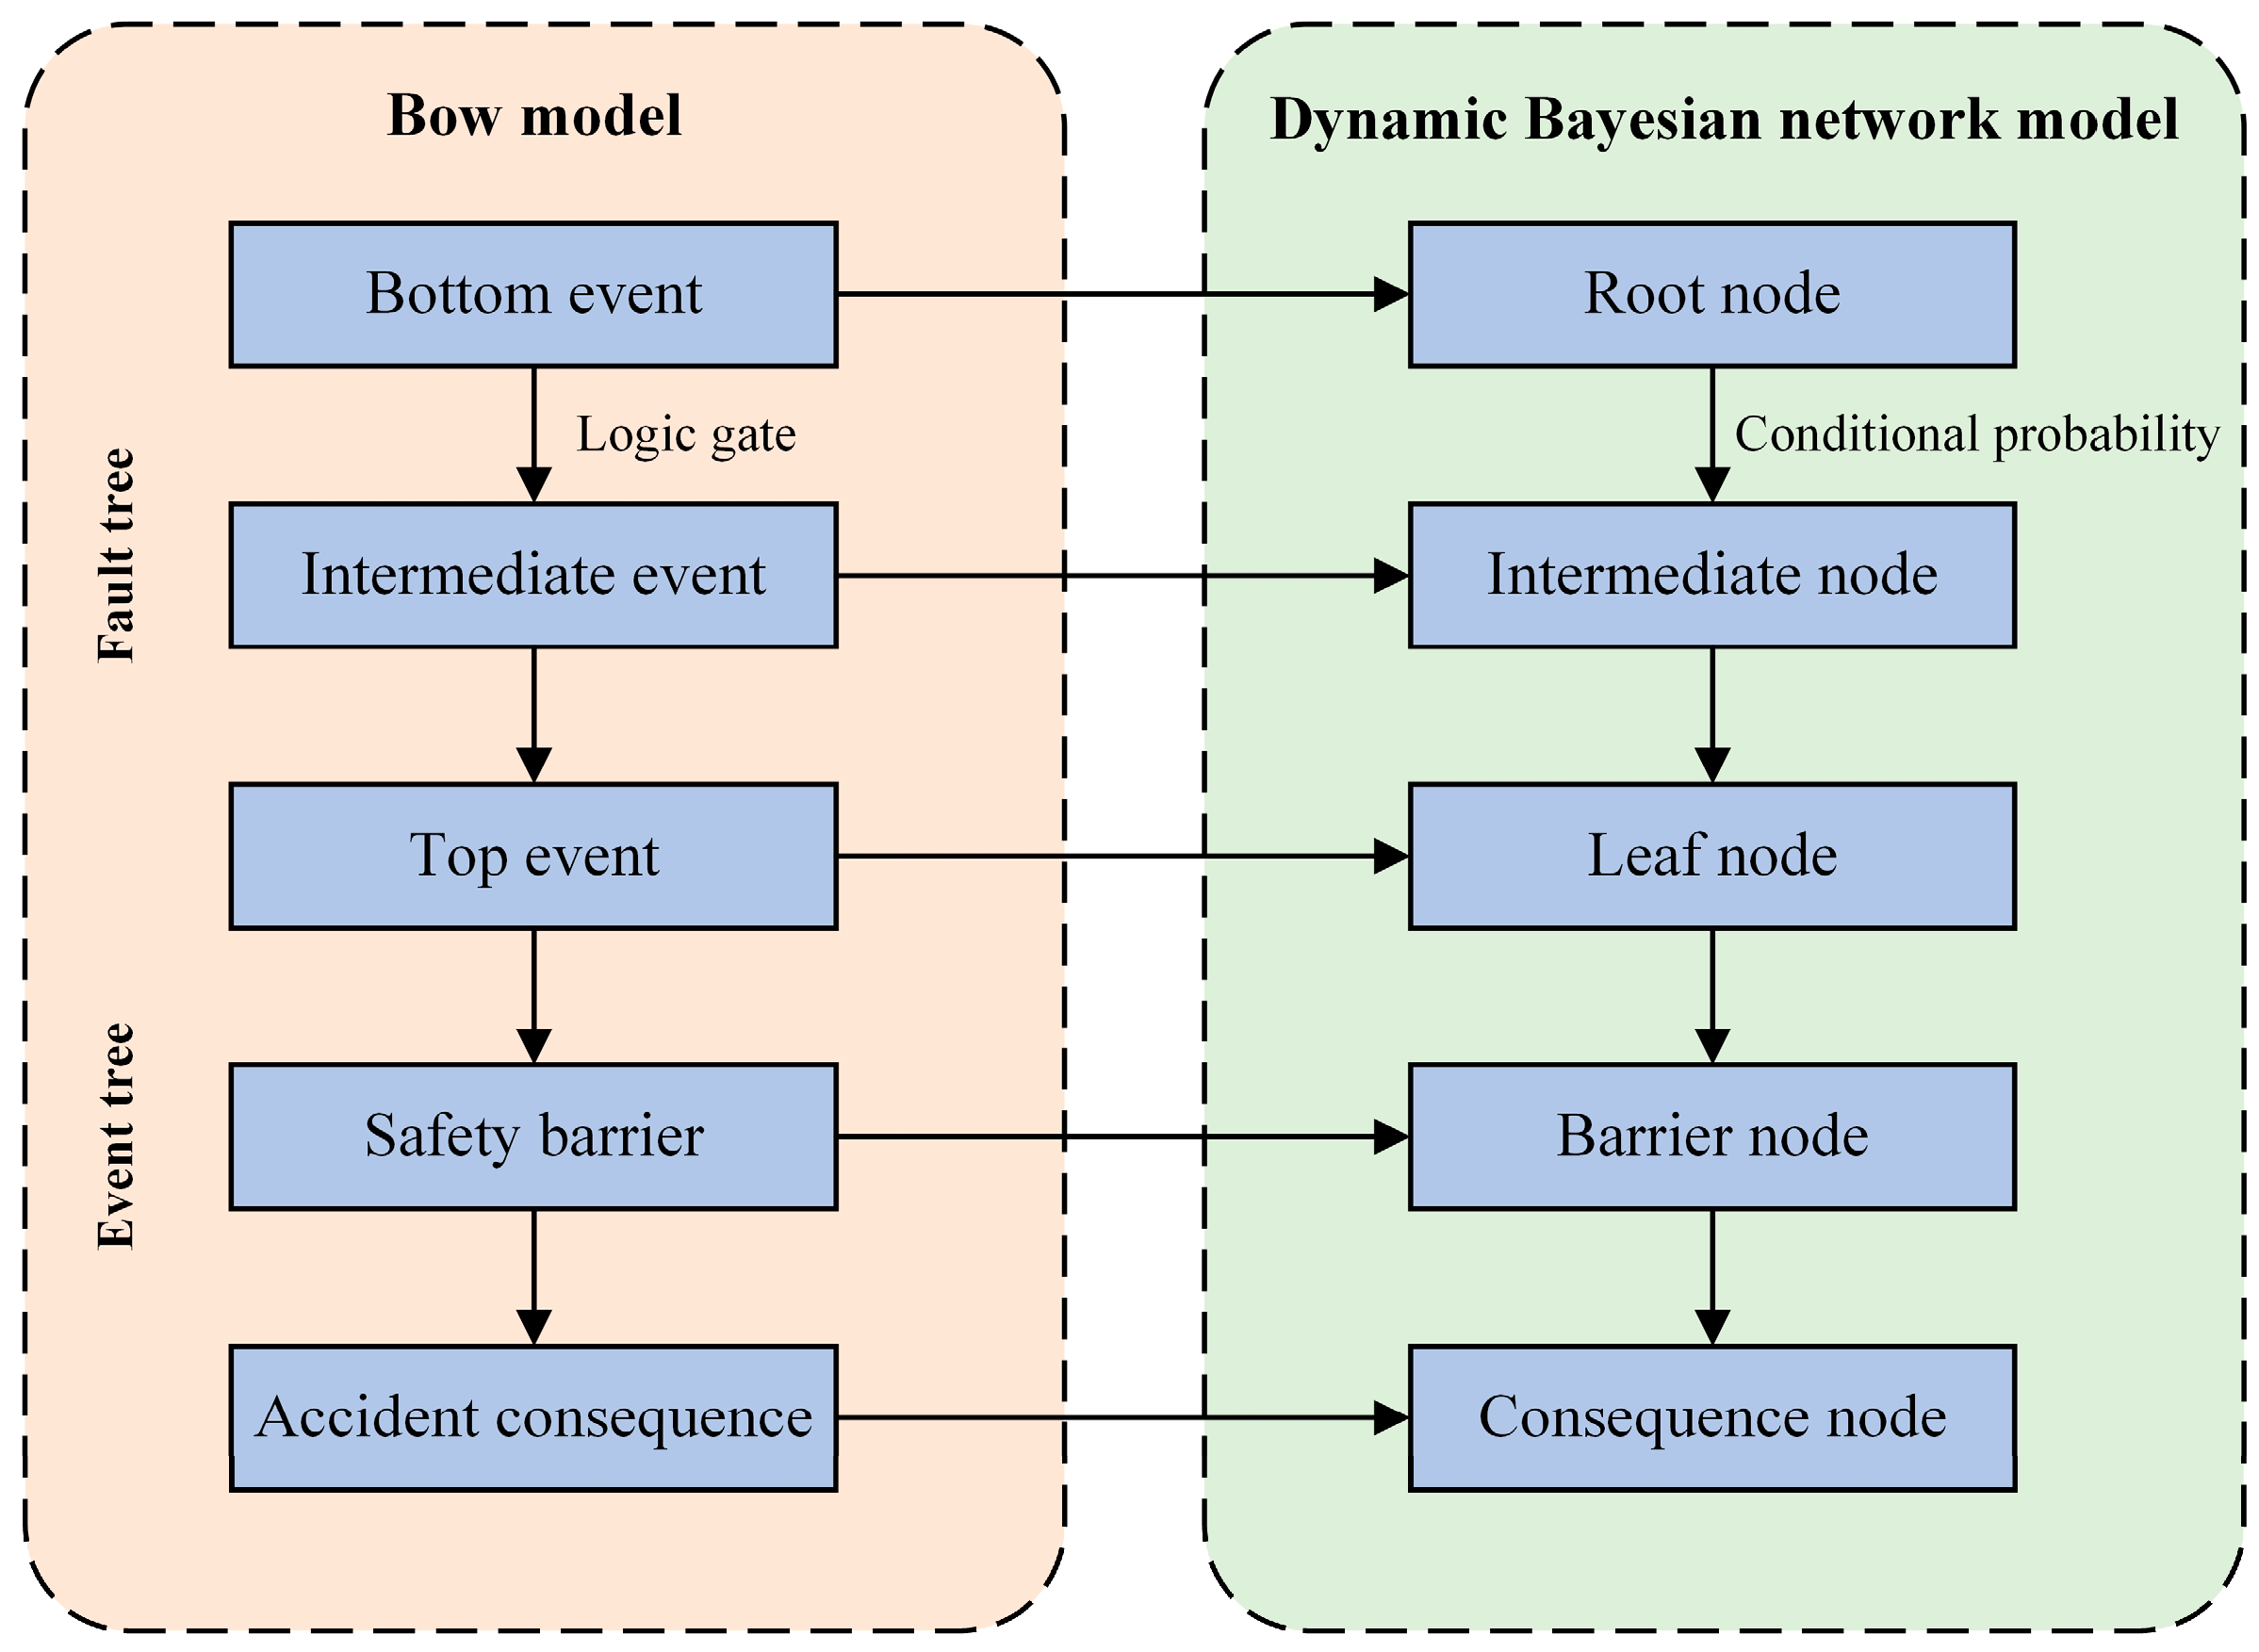
2.1. BN Model Method
2.2. Network Parameter
2.3. Establishment of the DBN Model
3. Evaluate the Application Results of the Model
3.1. Construction of BT Model
3.2. Establishment of the BN
4. Accident Risk Analysis Based on BN
4.1. Network Parameter Determination
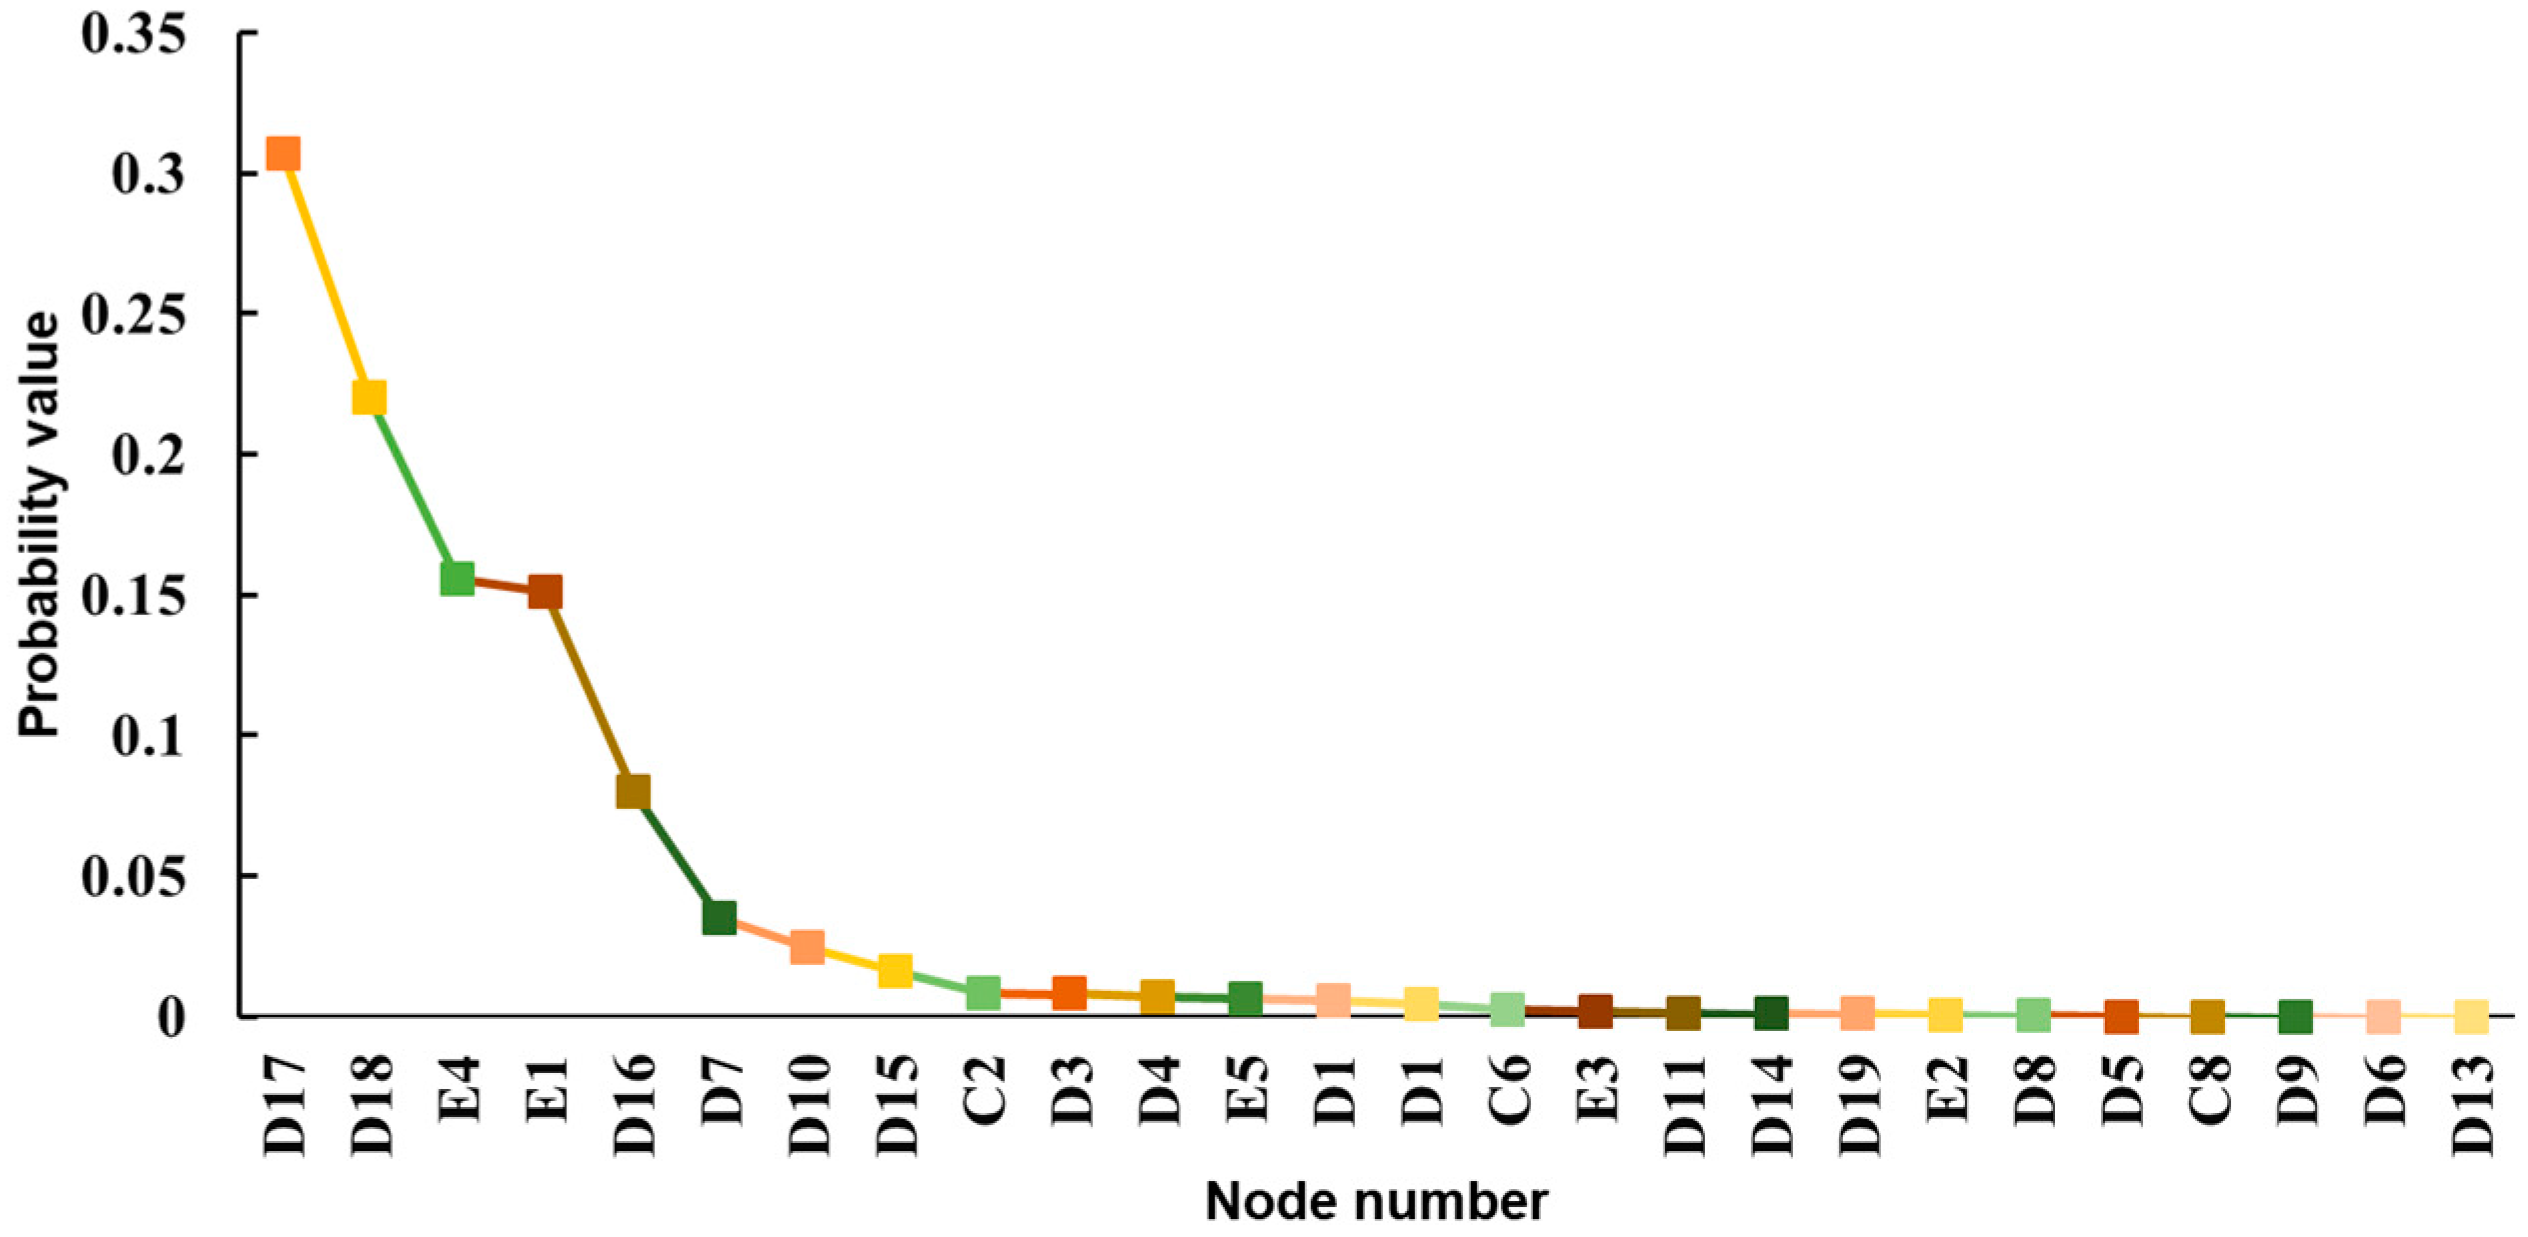
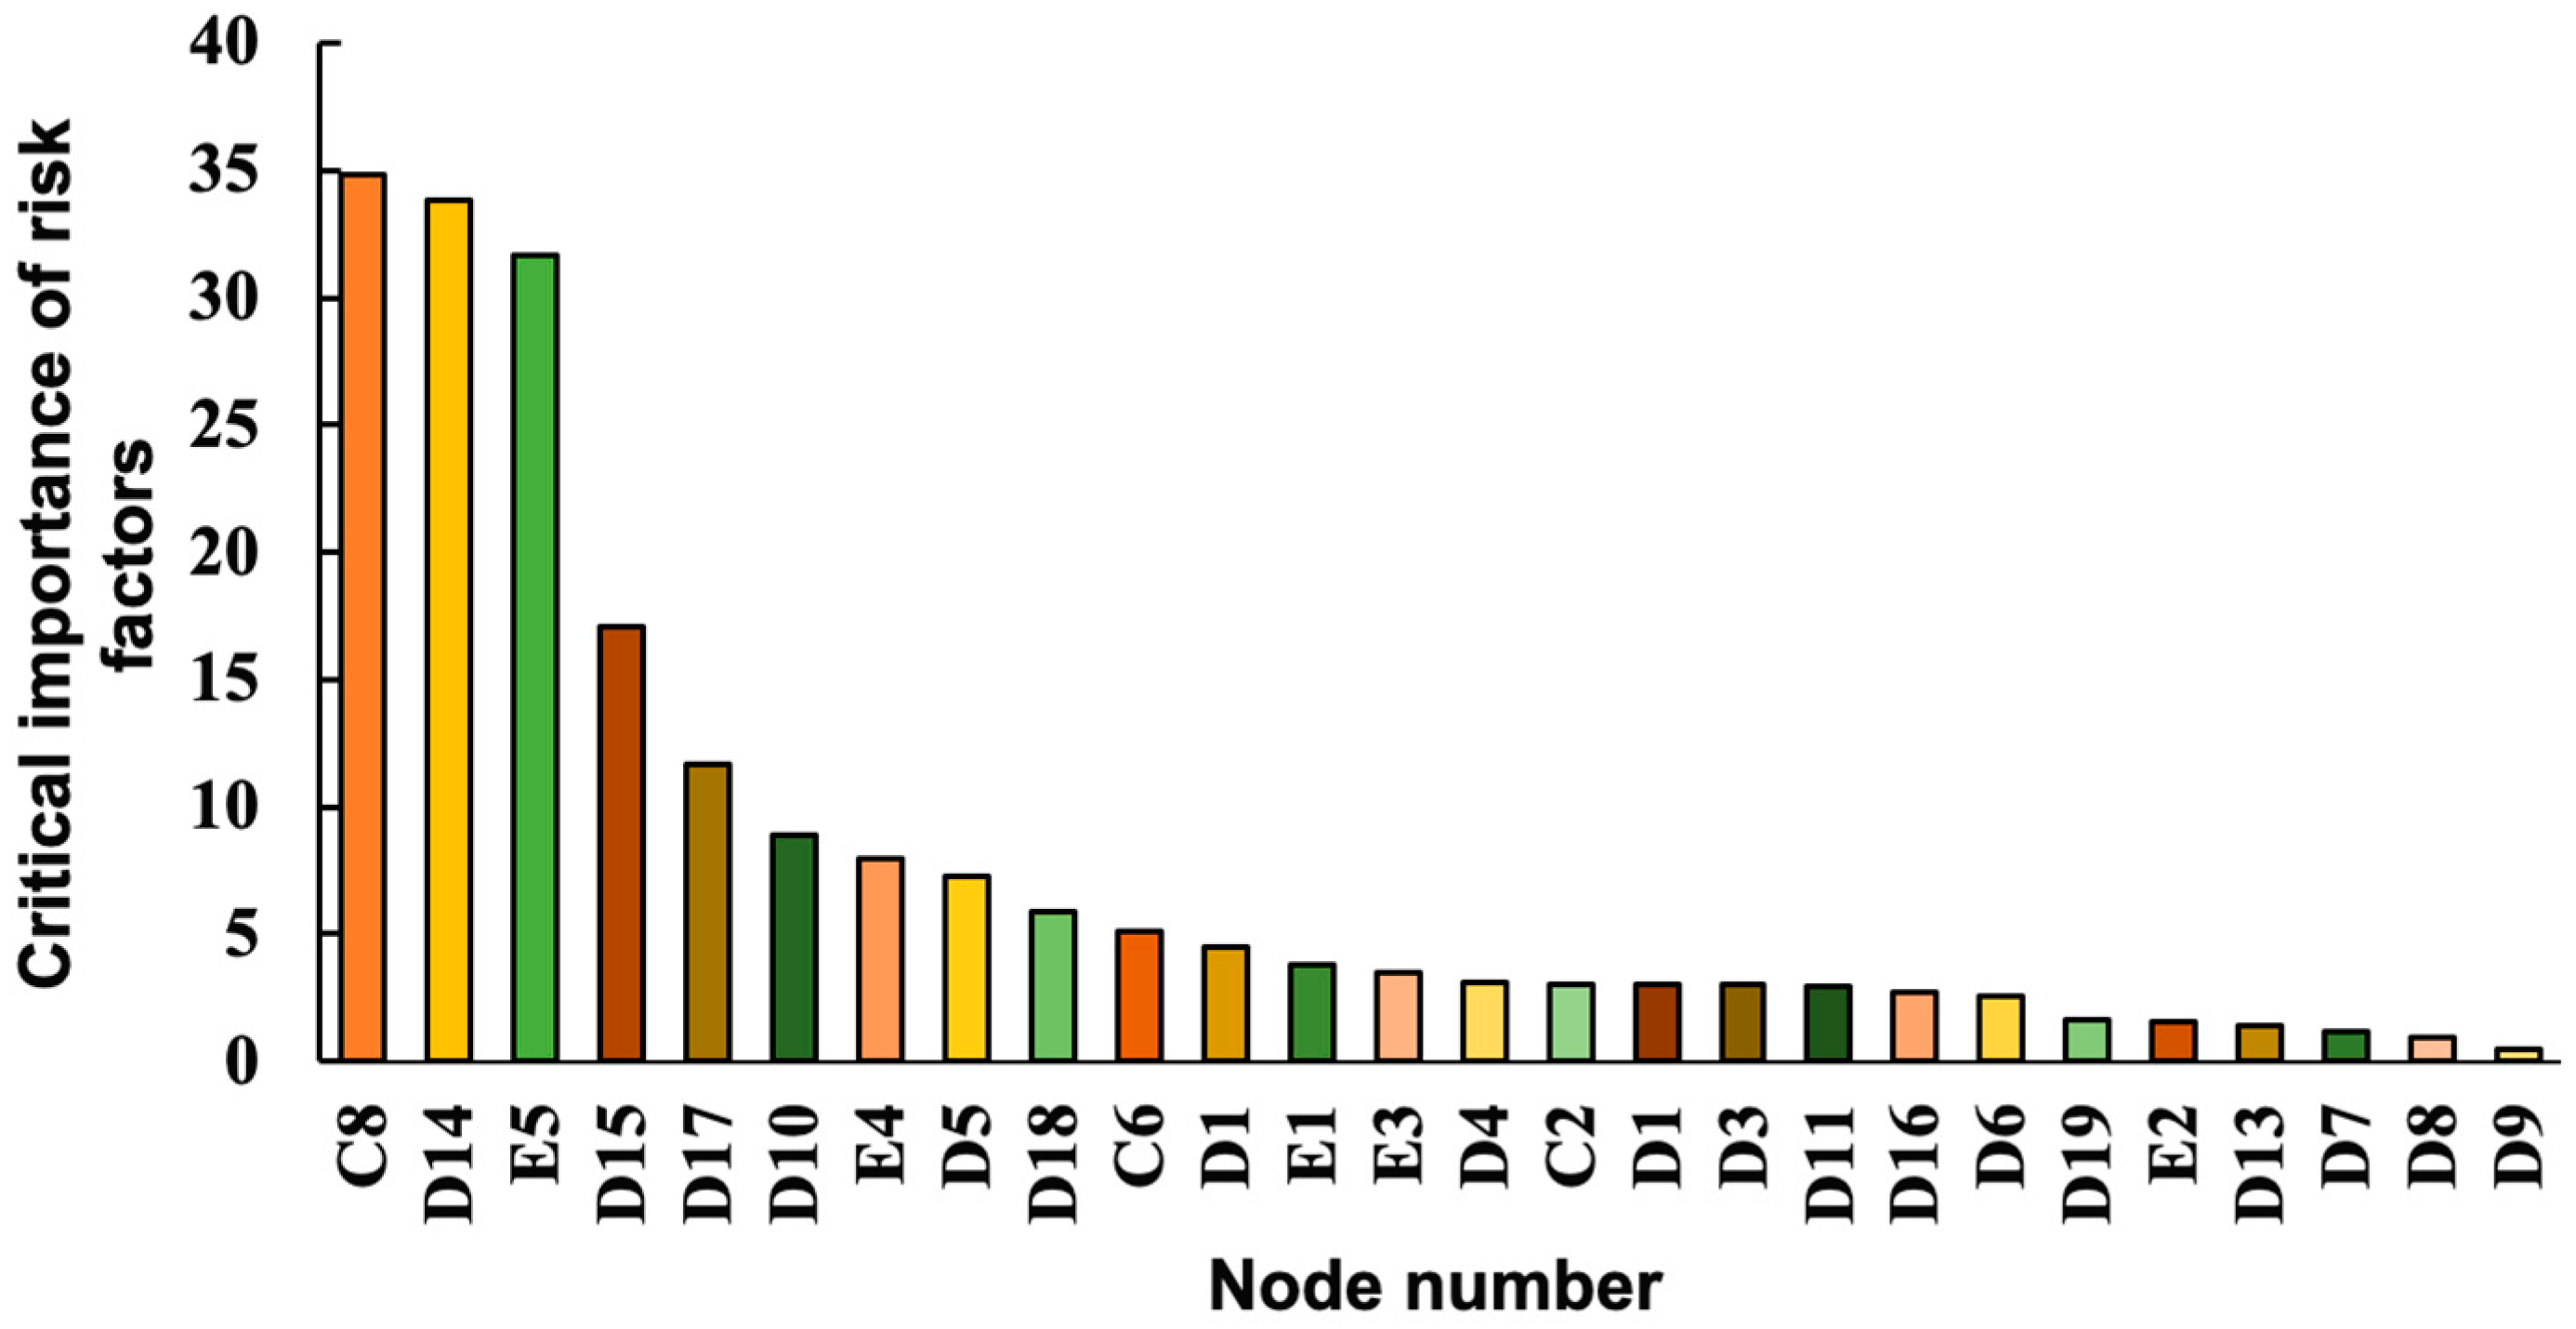
4.2. Critical Importance Analysis
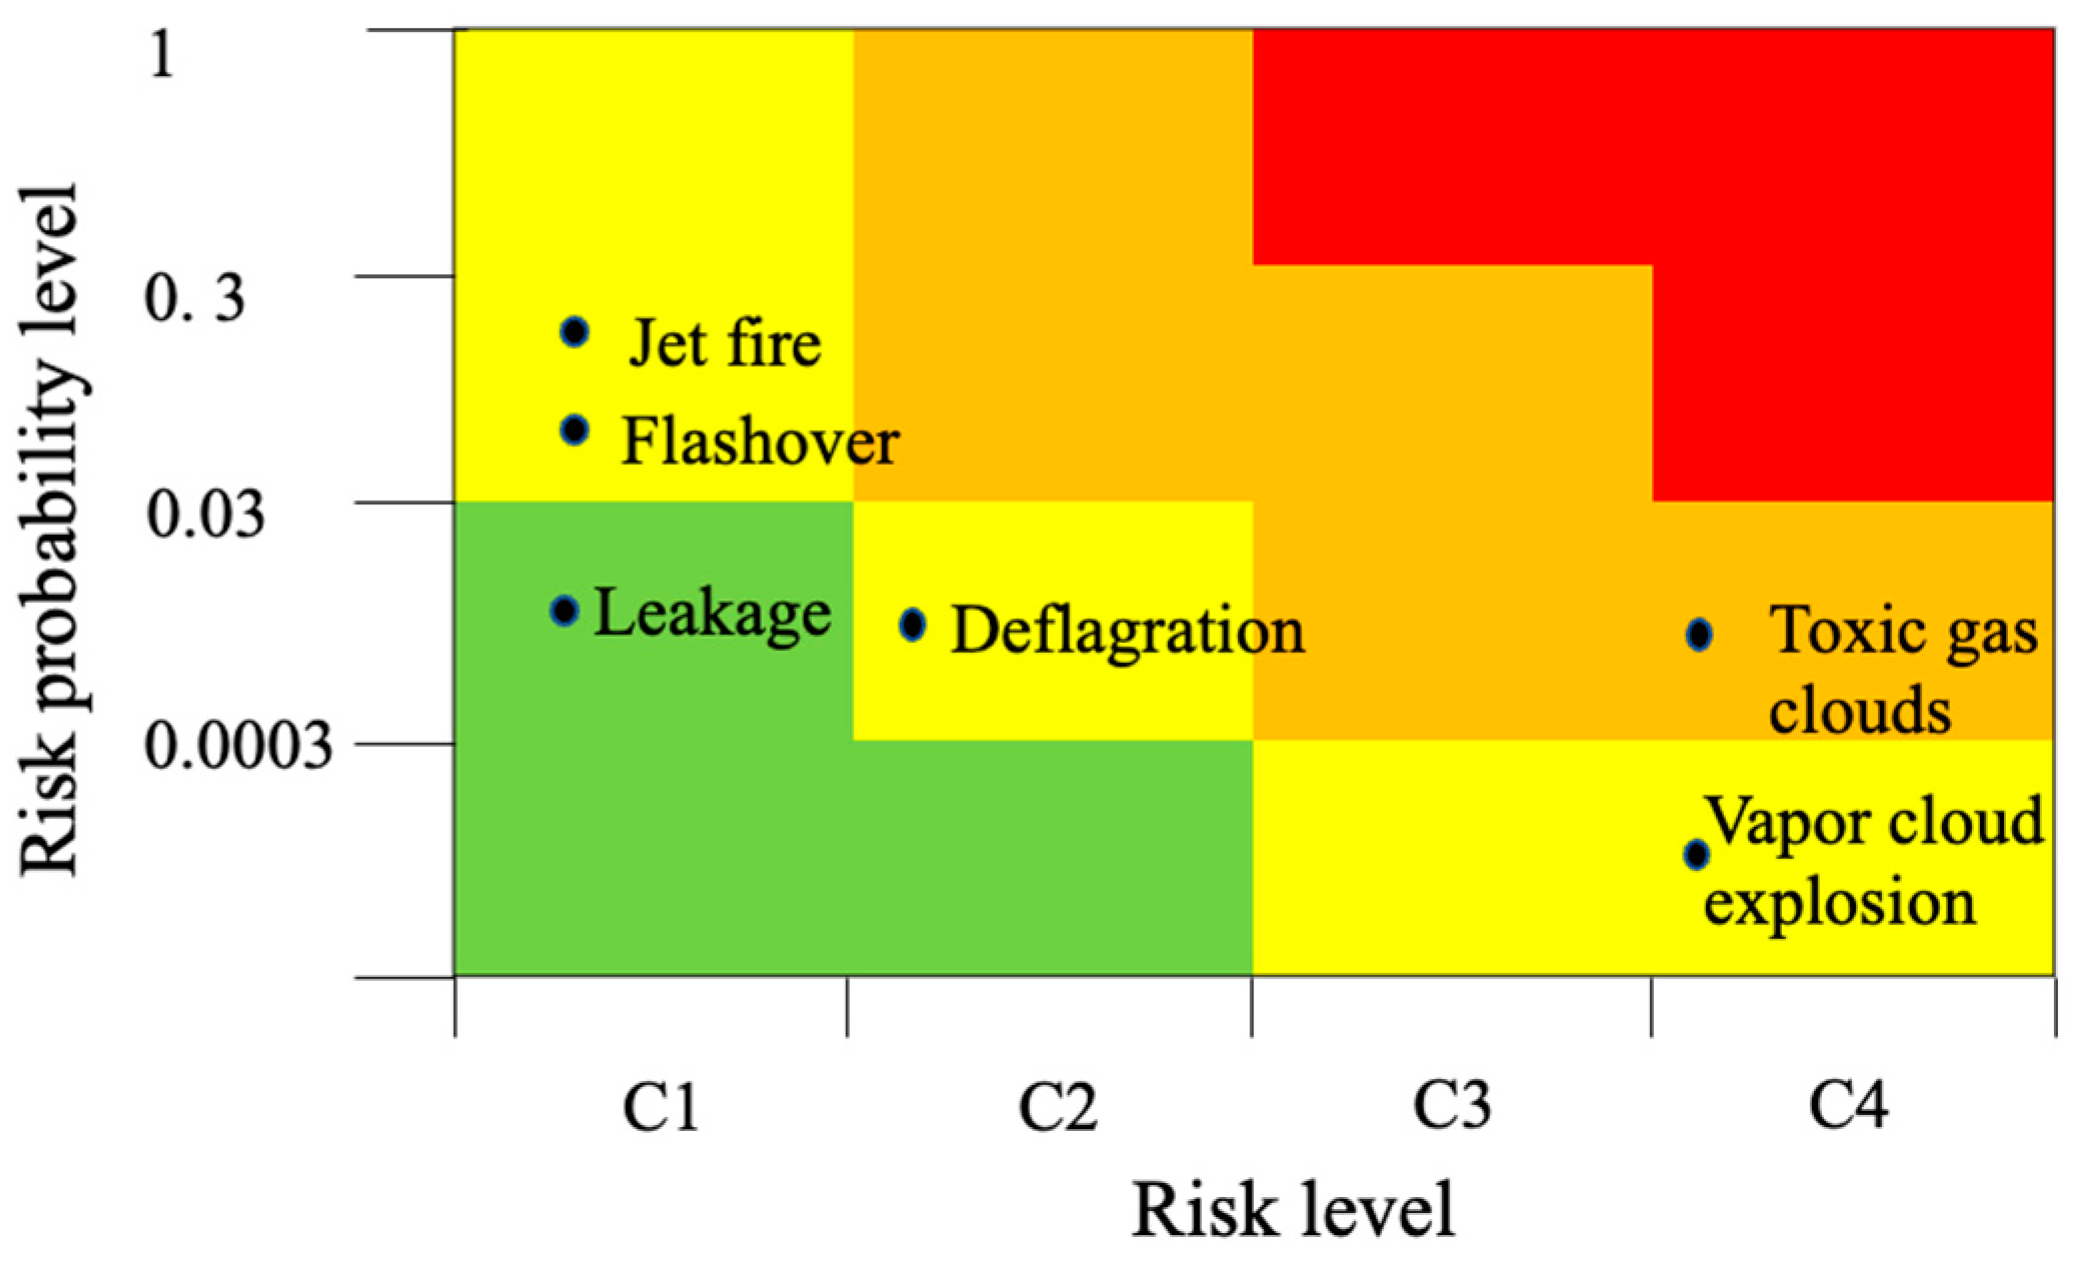
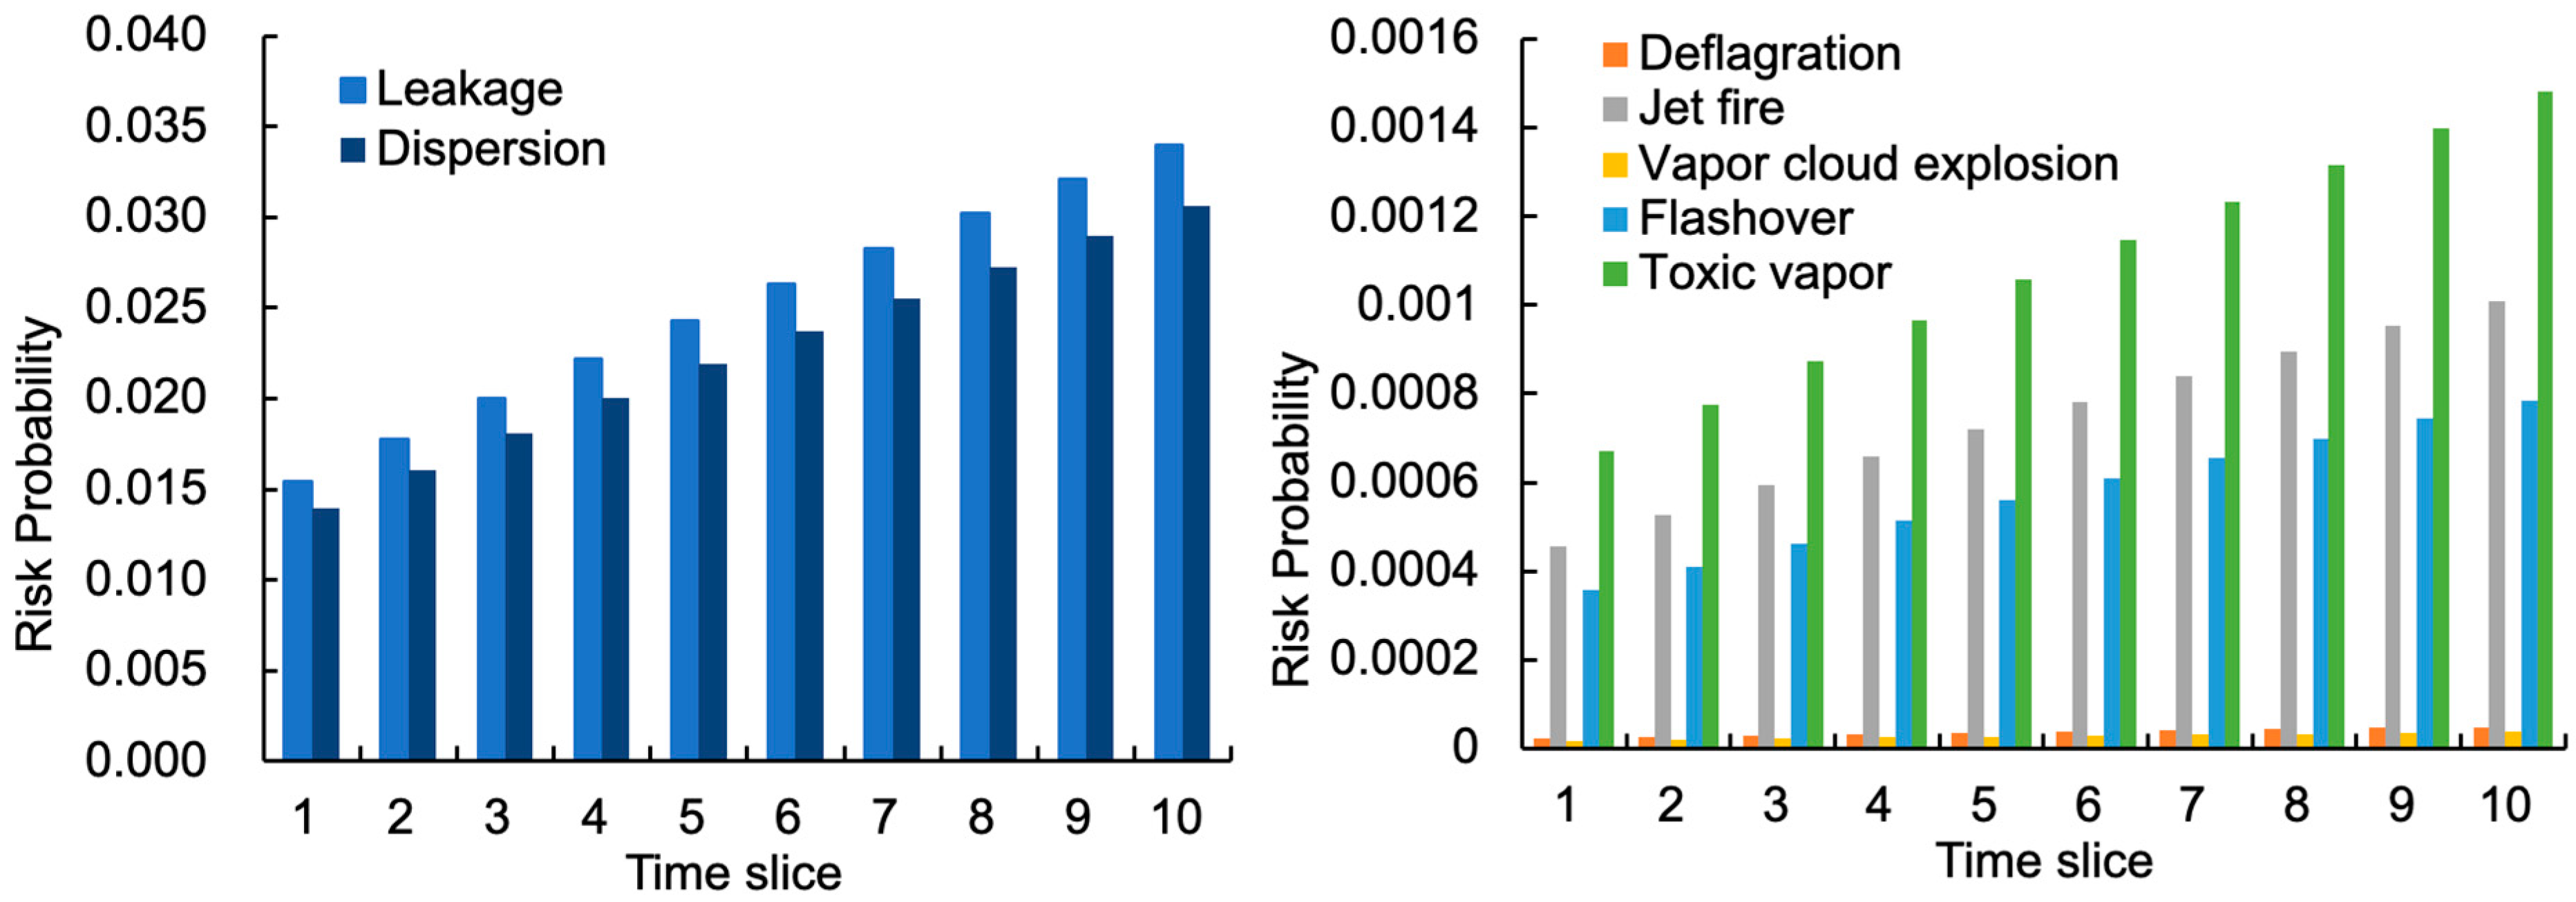
4.3. Risk Analysis of Oil Storage and Transportation Base Based on DBN
4.4. Discussion
5. Conclusions
Author Contributions
Funding
Institutional Review Board Statement
Informed Consent Statement
Data Availability Statement
Acknowledgments
Conflicts of Interest
Appendix A

| Event Number | E1 | E2 | E3 | E4 |
|---|---|---|---|---|
| D1 | RL | L | VL | L |
| C2 | L | L | RL | RL |
| C6 | RL | RL | L | RL |
| D19 | RL | L | L | L |
| Event Number | FSP | K | FP |
|---|---|---|---|
| D1 | 0.1575 | 4.024202 | 0.000095 |
| C2 | 0.20375 | 3.624381 | 0.000237 |
| C6 | 0.265 | 3.232936 | 0.000585 |
| D19 | 0.1775 | 3.836152 | 0.000146 |
| Node | Prior Probability | Node | Prior Probability |
|---|---|---|---|
| Operation error | 0.00867 | Strength design defect | 0.0001 |
| Staff negligence | 0.0059 | Corrosion | 0.00003 |
| Safety valve failure | 0.00013 | Quality defect | 0.00047 |
| Accessory damage | 0.000554 | Inclement weather | 0.00557 |
| Construction quality defect | 0.00047 | Routine equipment maintenance is not in place | 0.0092 |
| Floating roof fatigue operation | 0.000004 | Insufficient knowledge of tank storage medium | 0.0098 |
| Natural disaster | 0.000001 | External failure | 0.000001 |
| No strict implementation of the post responsibility system | 0.0037 | High ambient temperature | 0.00002 |
| The operation procedure is not strictly implemented | 0.00007 | Safety devices are not complete | 0.0062 |
| Devices are not properly managed during thunderstorms | 0.00000724 | Temperature control and monitoring system (LC1) failure | 0.000095 |
| Improper foundation treatment | 0.001 | Level control and monitoring system failure (LC1) | 0.000237 |
| The construction quality is not in place | 0.00047 | Emergency stop system failure (L1) | 0.000585 |
| Natural disaster | 0.000001 | Settlement monitoring (LC1) failure | 0.000146 |
| Expert Evaluation | ||||||||
|---|---|---|---|---|---|---|---|---|
| B1 | H | RH | H | RH | ||||
| B2 | RH | M | M | RH | ||||
| B3 | H | VH | H | H | ||||
| We converted expert assessment natural language with weights into fuzzy numbers | ||||||||
| B1 | (0.60, 0.80, 0.95) | |||||||
| B2 | (0.41, 0.61, 0.81) | |||||||
| B3 | (0.75, 0.93, 1.00) | |||||||
| The average area method was used to calculate the fuzzy probability score FPS | ||||||||
| = 0.79 | = 0.61 | = 0.90 | ||||||
| We used the Noise-or-gate model to calculate CPT | ||||||||
| B1 | B2 | B3 | ||||||
| 0 | 0 | 0 | 0 | 1 | ||||
| 0 | 1 | 1 | = 0.96 | 0.04 | ||||
| 1 | 0 | 1 | = 0.98 | 0.02 | ||||
| 1 | 0 | 1 | = 0.79 | 0.21 | ||||
| 1 | 1 | 0 | = 0.92 | 0.08 | ||||
| 0 | 1 | 0 | = 0.61 | 0.39 | ||||
| 0 | 0 | 1 | = 0.90 | 0.10 | ||||
| 1 | 1 | 1 | 0.99 | 0.01 | ||||
References
- Tian, C.; Liang, Y.; Lin, Q.; You, D.; Liu, Z. Environmental pressure exerted by the petrochemical industry and urban environmental resilience: Evidence from Chinese petrochemical port cities. J. Clean. Prod. 2024, 471, 143430. [Google Scholar] [CrossRef]
- Yang, D.; Qin, Y.; Xu, Y.; Xing, K.; Chen, Y.; Jia, X.; Aviso, K.B.; Tan, R.R.; Wang, B. Sequestration of carbon dioxide from the atmosphere in coastal ecosystems: Quantification, analysis, and planning. Sustain. Prod. Consum. 2024, 47, 413–424. [Google Scholar] [CrossRef]
- Li, Q.; Li, Q.; Han, Y. A Numerical Investigation on Kick Control with the Displacement Kill Method during a Well Test in a Deep-Water Gas Reservoir: A Case Study. Processes 2024, 12, 2090. [Google Scholar] [CrossRef]
- Li, Q.; Li, Q.; Wu, J.; Li, X.; Li, H.; Cheng, Y. Wellhead Stability During Development Process of Hydrate Reservoir in the Northern South China Sea: Evolution and Mechanism. Processes 2024, 13, 40. [Google Scholar] [CrossRef]
- Abbasi, S.; Keshavarzi, B. Source identification of total petroleum hydrocarbons and polycyclic aromatic hydrocarbons in PM10 and street dust of a hot spot for petrochemical production: Asaluyeh County, Iran. Sustain. Cities Soc. 2019, 45, 214–230. [Google Scholar] [CrossRef] [PubMed]
- Li, G.-Q.; Hou, S.-K.; Yu, X.; Meng, X.-T.; Liu, L.-L.; Yan, P.-B.; Tian, M.-N.; Chen, S.-L.; Han, H.-J. A descriptive analysis of injury triage, surge of medical demand, and resource use in an university hospital after 8.12 Tianjin Port Explosion, China. Chin. J. Traumatol. 2015, 18, 314–319. [Google Scholar] [CrossRef]
- Yu, G.; Wang, Y.; Zheng, L.; Huang, J.; Li, J.; Gong, L.; Chen, R.; Li, W.; Huang, J.; Duh, Y.-S. Comprehensive study on the catastrophic explosion of ammonium nitrate stored in the warehouse of Beirut port. Process. Saf. Environ. Prot. 2021, 152, 201–219. [Google Scholar] [CrossRef]
- Wang, N.; Wu, M.; Yuen, K.F. Assessment of Port Resilience Using Bayesian Network: A Study of Strategies to Enhance Readiness and Response Capacities. Reliab. Eng. Syst. Saf. 2023, 237, 109394. [Google Scholar] [CrossRef]
- Wan, C.; Yuan, J.; Cao, D.; Wang, T.; Ng, A.K. A Fuzzy Evidential Reasoning-Based Model for Evaluating Resilience of Ports to Typhoons. Transp. Res. Part D Transp. Environ. 2024, 133, 104228. [Google Scholar] [CrossRef]
- Ma, S.; Huang, Y.; Liu, Y.; Liu, H.; Chen, Y.; Wang, J.; Xu, J. Big Data-Driven Correlation Analysis Based on Clustering for Energy-Intensive Manufacturing Industries. Appl. Energy 2023, 349, 121608. [Google Scholar] [CrossRef]
- Huang, X.; Wen, Y.; Zhang, F.; Han, H.; Huang, Y.; Sui, Z. A Review on Risk Assessment Methods for Maritime Transport. Ocean. Eng. 2023, 279, 114577. [Google Scholar] [CrossRef]
- Abrahamsen, E.B.; Milazzo, M.F.; Selvik, J.T.; Asche, F.; Abrahamsen, H.B. Prioritising Investments in Safety Measures in the Chemical Industry by Using the Analytic Hierarchy Process. Reliab. Eng. Syst. Saf. 2020, 198, 106811. [Google Scholar] [CrossRef]
- Ren, C.; Yang, M. Risk assessment of hazmat road transportation accidents before, during, and after the accident using Bayesian network. Process. Saf. Environ. Prot. 2024, 190, 760–779. [Google Scholar] [CrossRef]
- Haddad, H.; Bouyahia, Z.; Chaudhry, S.A. A Multiagent Geosimulation and IoT-based Framework for Safety Monitoring in Complex Dynamic Spatial Environments. Procedia Comput. Sci. 2019, 151, 527–534. [Google Scholar] [CrossRef]
- Zhang, Z.; Song, C.; Zhang, J.; Chen, Z.; Liu, M.; Aziz, F.; Kurniawan, T.A.; Yap, P.-S. Digitalization and innovation in green ports: A review of current issues, contributions and the way forward in promoting sustainable ports and maritime logistics. Sci. Total Environ. 2024, 912, 169075. [Google Scholar] [CrossRef]
- Zhao, J.; Tian, J.; Meng, F.; Zhang, M.; Wu, Q. Safety Assessment Method for Storage Tank Farm Based on the Combination of Structure Entropy Weight Method and Cloud Model. J. Loss Prev. Process Ind. 2022, 75, 104709. [Google Scholar] [CrossRef]
- Wu, X.; Huang, H.; Xie, J.; Lu, M.; Wang, S.; Li, W.; Huang, Y.; Yu, W.; Sun, X. A Novel Dynamic Risk Assessment Method for the Petrochemical Industry Using Bow-Tie Analysis and Bayesian Network Analysis Method Based on the Methodological Framework of ARAMIS Project. Reliab. Eng. Syst. Saf. 2023, 237, 109397. [Google Scholar] [CrossRef]
- Xiao, H.; Li, B.; Yu, H.; Shu, C.-M. Dynamic Risk Analysis of Hydrogen Refueling Station Gas Cloud Explosions Based upon the Bow-Tie Perspective. Int. J. Hydrog. Energy 2024, 82, 89–101. [Google Scholar] [CrossRef]
- Djemai, Z.; Aissani, N.; Bekrar, A.; Lounis, Z. Risk Analysis of Petroleum Storage Tank Based on Uncertain Data Incorporated into Mapped Bow-Tie to Bayesian Network. Process Saf. Environ. Prot. 2024, 190, 1202–1221. [Google Scholar] [CrossRef]
- Pan, L.; Zheng, Y.; Zheng, J.; Xu, B.; Liu, G.; Wang, M.; Yang, D. Characteristics of Chemical Accidents and Risk Assessment Method for Petrochemical Enterprises Based on Improved FBN. Sustainability 2022, 14, 12072. [Google Scholar] [CrossRef]
- Zhang, L. Operation Safety Evaluation of Zhonggui-nanchong Gas Transmission Station. Master‘s Thesis, Southwest Petroleum University, Chengdu, China, 2020. [Google Scholar]
- Chen, F.; Jia, H.; Du, E.; Chen, Y.; Wang, L. Modeling of the Cascading Impacts of Drought and Forest Fire Based on a Bayesian Network. Int. J. Disaster Risk Reduct. 2024, 111, 104716. [Google Scholar] [CrossRef]
- Li, X.; Chen, G.; Amyotte, P.; Alauddin, M.; Khan, F. Modeling and Analysis of Domino Effect in Petrochemical Storage Tank Farms under the Synergistic Effect of Explosion and Fire. Process Saf. Environ. Prot. 2023, 176, 706–715. [Google Scholar] [CrossRef]
- Zhang, J.; Zhang, S.; Liang, Z.; Lang, X.; Shi, M.; Qiao, J.; Wei, J.; Dai, H.; Kang, J. A Risk Assessment Method Based on DEMATEL-STPA and Its Application in Safety Risk Evaluation of Hydrogen Refueling Stations. Int. J. Hydrog. Energy 2024, 50, 889–902. [Google Scholar] [CrossRef]
- Zhang, J.; Shi, M.; Lang, X.; You, Q.; Jing, Y.; Huang, D.; Dai, H.; Kang, J. Dynamic Risk Evaluation of Hydrogen Station Leakage Based on Fuzzy Dynamic Bayesian Network. Int. J. Hydrog. Energy 2024, 50, 1131–1145. [Google Scholar] [CrossRef]
- Wu, X. Study on Accident Analysis and Risk Assessment for Oil Depot Based on Safety Barrier. Ph.D. Thesis, China University of Petroleum, Beijing, China, 2022. [Google Scholar]
- Park, Y.; Park, D.J. System Dynamics Approach for Assessing the Performance of Safety Management Systems in Petrochemical Plants. J. Loss Prev. Process Ind. 2024, 90, 105324. [Google Scholar] [CrossRef]
- Yang, D.; Peng, K.; Zheng, J.; Xie, B.; Wang, J.; Xu, B.; Li, F. Consequences Analysis of the LPG Tank Truck Traffic Accident: A Case Study of the Wenling Explosion Accident. J. Loss Prev. Process Ind. 2024, 87, 105228. [Google Scholar] [CrossRef]

| Stats | Category | Score |
|---|---|---|
| Position | Senior engineer | 5 |
| Manager | 4 | |
| Engineer/researcher | 3 | |
| Technician | 2 | |
| Operator | 1 | |
| Educational background | Learned scholar | 5 |
| Master | 4 | |
| Undergraduate course | 3 | |
| Junior college | 2 | |
| Senior high school | 1 | |
| Field experience | Firm | 2 |
| Colleges and universities | 0 |
| Domain Expert | Weight |
|---|---|
| Senior engineer (E1) | 0.3 |
| Engineer (E2) | 0.25 |
| Front-line worker (E3) | 0.2 |
| Corporate safety officer (E4) | 0.25 |
| Language Evaluation | Evaluation Description | Fuzzy Number |
|---|---|---|
| very low (VL) | only happened once | (0, 0, 0.1) |
| low (L) | occurs once every 6 to 10 years | (0, 0.1, 0.3) |
| relatively low (RL) | occurs once every 1 to 5 years | (0.1, 0.3, 0.5) |
| middle (M) | occurs once every 10 to 12 months | (0.3, 0.5, 0.7) |
| relatively high (RH) | occurs once every 7 to 9 months | (0.5, 0.7, 0.9) |
| high (H) | occurs once every 4 to 6 months | (0.7, 0.9, 1) |
| very high (VH) | occurs once every 1 to 3 months | (0.9, 1, 1) |
| Series A | Series B | Series C | Series D | Series E |
|---|---|---|---|---|
| Top event A | B1 Oil spill | C1 Liquid level exceeds the safe height | D1 Level control and monitoring system failed (LC1) | |
| D2 Liquid level exceeded | E1 Operation error | |||
| E2 Staff negligence | ||||
| E3 Safety valve failure | ||||
| C2 Emergency stop system failed | ||||
| B2 Floating plate sinking | C3 The strength of the floating roof decreases | D3 Accessory damage | ||
| D4 Construction quality defect | ||||
| D5 Floating roof fatigue operation | ||||
| D6 Natural disaster | ||||
| C4 Operation management is not in place | D7 No strict implementation of the post responsibility system | |||
| D8 The operation procedure is not strictly implemented | ||||
| D9 Devices are not properly managed during thunderstorms | ||||
| B3 Tank rupture | C5 Uneven settlement of foundation | D10 Improper foundation treatment | ||
| D11 Strength design defect | ||||
| D12 The construction quality is not in place | ||||
| D13 Natural disaster | ||||
| C6 Settlement monitoring failure (LC1) | ||||
| C7 Corrosion or crack | D14 Corrosion | |||
| D15 Quality defect | ||||
| D16 Inclement weather | ||||
| D17 Routine equipment maintenance is not in place | ||||
| D18 Insufficient knowledge of tank storage medium | ||||
| C8 External failure | ||||
| C9 Tank fatigue | D19 Temperature control and monitoring system (LC1) failure | |||
| D20 Overpressure | E4 Safety devices are not complete | |||
| E5 High ambient temperature | ||||
| Barrier | Failure Probability |
|---|---|
| Immediate ignition | 0.031 |
| Delayed ignition | 0.025 |
| Finite space | 0.046 |
| Personal Injury | Economic Loss (Ten Thousand CNY) | Environmental Damage | Consequence Hierarchy |
|---|---|---|---|
| No casualties | <100 | companies can solve it themselves | C1 |
| Stay in hospital for more than 24 h | 100~1000 | the impact on the environment is serious and requires assistance from local authorities | C2 |
| Long-term effects of injury | 1000~5000 | it has a great impact on the external environment of enterprises, which requires the intervention of the state | C3 |
| Irreversible casualties | >5000 | it has irreversible impact on the external environment of enterprises, which requires state intervention | C4 |
| Consequence | Level |
|---|---|
| Fire explosion | C3 |
| Jet fire | C2 |
| Flash ignition | C2 |
| Vapor cloud explosion | C4 |
| Gas cloud | C4 |
| leak | C1 |
| Probability Level | Risk Probability Level | Probability Range |
|---|---|---|
| low | I | |
| normal | II | |
| relatively high | III | |
| high | IV | (0.3, 1) |
| Risk Level | Risk Loss Level | |||||
|---|---|---|---|---|---|---|
| I | II | III | IV | |||
| C1 | C2 | C3 | C4 | |||
| Risk probability level | I | low | 1 | 1 | 2 | 2 |
| II | normal | 1 | 2 | 3 | 3 | |
| III | relatively high | 2 | 3 | 3 | 4 | |
| IV | high | 2 | 3 | 4 | 4 | |
Disclaimer/Publisher’s Note: The statements, opinions and data contained in all publications are solely those of the individual author(s) and contributor(s) and not of MDPI and/or the editor(s). MDPI and/or the editor(s) disclaim responsibility for any injury to people or property resulting from any ideas, methods, instructions or products referred to in the content. |
© 2025 by the authors. Licensee MDPI, Basel, Switzerland. This article is an open access article distributed under the terms and conditions of the Creative Commons Attribution (CC BY) license (https://creativecommons.org/licenses/by/4.0/).
Share and Cite
Yang, D.; Xing, K.; Pan, L.; Lu, N.; Yu, J. Sustainable Risk Management Framework for Petroleum Storage Facilities: Integrating Bow-Tie Analysis and Dynamic Bayesian Networks. Sustainability 2025, 17, 2642. https://doi.org/10.3390/su17062642
Yang D, Xing K, Pan L, Lu N, Yu J. Sustainable Risk Management Framework for Petroleum Storage Facilities: Integrating Bow-Tie Analysis and Dynamic Bayesian Networks. Sustainability. 2025; 17(6):2642. https://doi.org/10.3390/su17062642
Chicago/Turabian StyleYang, Dingding, Kexin Xing, Lidong Pan, Ning Lu, and Jingxiao Yu. 2025. "Sustainable Risk Management Framework for Petroleum Storage Facilities: Integrating Bow-Tie Analysis and Dynamic Bayesian Networks" Sustainability 17, no. 6: 2642. https://doi.org/10.3390/su17062642
APA StyleYang, D., Xing, K., Pan, L., Lu, N., & Yu, J. (2025). Sustainable Risk Management Framework for Petroleum Storage Facilities: Integrating Bow-Tie Analysis and Dynamic Bayesian Networks. Sustainability, 17(6), 2642. https://doi.org/10.3390/su17062642