Article

Research on New Energy Vehicle Battery (NEV) Recycling Model Considering Carbon Emission

1
School of Business, Beijing Information Science and Technology University, Beijing 102206, China
2
School of Management Science Engineering, Beijing Information Science and Technology University, Beijing 102206, China
*
Author to whom correspondence should be addressed.
Sustainability 2025, 17(10), 4356; https://doi.org/10.3390/su17104356
Submission received: 19 March 2025 / Revised: 23 April 2025 / Accepted: 7 May 2025 / Published: 12 May 2025

Abstract

:
This paper focuses on the carbon emission problem of new energy vehicle (NEV) battery recycling, constructs a tripartite evolutionary game model of battery manufactures, new energy vehicle original equipment manufacturers (NEV OEMs) and certified recyclers, analyzes the stability of each party’s strategy selection and the relationship between the influence of the elements, and simulates to verify the validity of the conclusions, and arrives at the conditions for the occurrence of the lowest carbon emission stabilizing strategy combinations, and puts forward countermeasure suggestions accordingly, and analyzes the effects of the changes of the key parameters on the equilibrium results, and the study shows that (1) Carbon emission cost, battery decomposition cost, recycling channel construction cost and R&D cost are the main factors affecting the equilibrium results. (2) Under the carbon emission reduction policy, the battery manufacturer’s investment in low-carbon production can help other actors in the supply chain to reduce the negative impact of the policy so that they can reduce their costs. (3) The cooperative recycling model based on the recycling network constructed by vehicle manufacturers can maximize the interests of all parties in the supply chain. The findings of the study provide management insights for governments, battery manufacturers, NEV OEMs, and certified recyclers.

1. Introduction

At present, China’s new energy automobile industry has achieved exponential expansion, with production, sales, and exports dominating 58% of global market share [1], a vertically integrated industrial chain encompassing research and development (R&D), manufacturing, and recycling, and cultivated 10 globally competitive enterprises with >$5B annual revenue [2]. With the increase in production and sales of new energy vehicles (NEVs), the safe, environmentally friendly, and efficient use of power batteries has become a hotspot for discussion, and the dismantling and recycling of used power batteries is one of the hotspots for research [3]. From the beginning of the year, China’s NEV batteries gradually enter the scale of the decommissioning period, the annual decommissioning amount is about 24 GWh. According to the forecast of the China Automotive Strategy and Policy Research Center, the amount of power battery decommissioning in the year 2025 will be more than 30 GWh, more than 80 GWh in the year 2027, and break through 100 GWh in the year 2028. China’s NEVs are about to usher in a large-scale decommissioning boom, and power batteries for proper handling are imperative for environmental protection and resource sustainability [4].
As core components of NEVs, power batteries exhibit their carbon emission linkages throughout their production, use, and recycling processes. Failure to properly manage the decommissioning will not only directly affect human health, but also the environmental contamination of the water, soil, and other environmental factors indirectly jeopardize the human populations. With China anticipating the upcoming large-scale decommissioning of power batteries, it is crucial to properly handle end-of-life (EOL) batteries [5]. China’s policymakers attach great importance to the power battery recycling industry. The Ministry of Industry and Information Technology introduced the “NEV Power Battery Comprehensive Utilization Management Regulation”, the document for the battery recycling supply chain, in the main body of the definition of terms, for the first time, put forward the definition of comprehensive utilization of the enterprise, certified enterprises engaged in wasting power battery ‌echelon utilization or resource recovery of enterprises, including echelon utilization enterprises and ‌resource recovery enterprises [6].
In the context of energy scarcity and environmental pollution, the reliance on energy resources and the emission of greenhouse gases are exacerbating the issue of global warming. As a result, the transformation of the traditional automobile industry has become an inevitable trend. China’s goals of achieving a “carbon emission peak” (carbon peak) and “carbon neutrality” have accelerated the automotive industry’s transition towards reducing carbon dioxide emissions. Consequently, the vigorous promotion of new energy vehicles (NEVs) is crucial for energy conservation and emission reduction [7].
Certified recyclers have taken technological innovation and whole life cycle integration services to promote the development of the battery recycling industry. However, China’s battery recycling industry is still in the initial stage of development, especially since comprehensive utilization capacity has not been fully utilized, industry analysis indicates.
-
32% collection rate (2025 target: 65%) [8]
-
<40% rare metal recovery efficiency [9]
In this context, this paper establishes a tripartite closed-loop supply chain (CLSC) architecture consisting of power battery producers, NEV OEMs, and certified recyclers, and establishes a tripartite evolutionary game model based on this supply chain, constructs the strategy sets of the three main bodies to reduce carbon emissions, and adds the carbon emission cost as a parameter to the model, and analyzes the equilibrium solutions of the main bodies of the game with different combinations of strategies after solving the solution, and draws the results of each The evolution trajectory of strategy selection in the course of action of the game subjects, and used to carry out simulation analysis to verify the effectiveness of the model analysis under different initial conditions.

2. Literature Background and Theoretical Analysis

2.1. EPR

The research of power battery recycling mode, is mainly based on the existing national policies on the closed-loop supply chain research, for example, Xie, J. et al. analyzed the Pareto equilibrium state under the concept of extension of producer responsibility and the main responsibility of vehicle enterprises, and put forward corresponding suggestions for the drawbacks of the extension of producer responsibility [10]; Shen et al. considered the subsidy transfer of the closed-loop supply chain research of power batteries under the system [11]; Ding, J. studied the recycling cost sharing mechanism of the closed-loop supply chain of NEVs under the system, and concluded that NEV OEMs should share the recycling cost after integrating the profit, consumer, environment and social welfare of the closed-loop supply chain [12]; Wei simulated the impacts of the single policy and the combination of the recycling technological innovations, subsidies and tax incentives, and the promotion of the ‌echelon utilization policy, the effects of single and combined policies [13]; Liu et al. examined the pricing decision model of power battery remanufacturing under the dual policies of recycling subsidy and carbon trading [14]; Wu, W. et al. studied the optimal decision-making of the power battery recycling supply chain under the three strategies of subsidizing the power battery producers, subsidizing the recycler, and subsidizing the consumer under the carbon trading policy [15]; Li investigated the optimal choice of joint recycling strategies of electric NEV OEMs under the deposit-refund system [16].
At the same time, some scholars in other countries have also proposed to integrate the EPR system into the process of NEV battery recycling. Noudeng et al. presented a future outlook for the management of used power batteries in Laos, suggesting that the Lao government and stakeholders incorporate EPR into their implementation plans [17]. Choi and Rhee analyzed the current status of recycling used power batteries and recovery of valuable metals in South Korea and proposed a new recycling program for the management of end-of-life batteries for electric vehicles through an EPR system [18]. Giosue et al. studied the end-of-life management of lithium-ion batteries in the European market, producer responsibility, policy legislation, and recycling from the perspective of the circular economy [19]. Asokan et al. suggested that the promotion of electric vehicles in India without the establishment of an EPR system will lead to a large amount of lead-acid battery waste that will seriously jeopardize the existence of a safe environment for people [20]. Tasaki et al. analyzed the questionnaire survey and found that there are regional differences in the implementation of EPR and concluded that the effectiveness of EPR implementation depends on the government’s ability in waste management [21]. Pazoki and Zaccour studied the problem of responsibility sharing for product recycling and its relationship with the design of extended producer responsibility (EPR) regulations and argued that it is necessary to consider both the design of EPR regulations and responsibility-sharing policies [22]. Winternitz et al., from the perspective of the implementation practice of EPR policies in developed countries, argued that producers can choose to utilize the in-house resources of the enterprise to recycle their products [23]. Zeng, F. et al. study four recycling models with different power structures under government subsidies and conclude that government subsidies could effectively improve recycling efficiency [24]. Enci, W., compares the impacts of government subsidies to recycling companies, subsidies to consumers, and subsidies to recycling companies and consumers at the same time and puts forward policy recommendations from the perspectives of the government, recycling companies, and consumers [25].

2.2. Supply Chain

In the research field of battery recycling models, the supply chain has become the starting point of many scholars’ studies. Cutting in from the supply chain perspective not only systematically solves technical, economic, and environmental problems but also provides theoretical support for policy formulation (e.g., EPR) and corporate strategy (e.g., closed-loop design) and is a key path to promote sustainable development of the battery recycling industry. Hu et al. established a three-tier supply chain consisting of battery producers, NEV OEMs, and certified battery recycling and remanufacturers, and explored the impact of government subsidies on supply chain members’ strategic preferences and recycling incentives under the dual-channel recycling model [26]; Gao et al. constructed a supply chain consisting of manufacturers, retailers, and consumers, and based on this study, investigated the effectiveness of subsidizing by recycling volume and subsidizing by recycled battery capacity in improving the recycling efficiency of the NEV battery supply chain [27]. Some scholars have also constructed a three-level supply chain consisting of government, consumers, and electric NEV OEMs and constructed a tripartite evolutionary game model of government, consumers, and electric NEV OEMs by comprehensively considering the recycling system, mode, and policy of electric vehicle power storage batteries in China; Fan, J. analyzed the stabilization strategy adjustment mechanism of the three-party participation in this recycling cooperation game [28]. Some other scholars constructed a three-level supply chain consisting of local government, responsible enterprises, and informal recycling enterprises. By constructing a closed-loop supply chain model of battery producers, retailers, and certified recyclers, Lou et al. investigated the impact of corporate social responsibility (CSR) on decision-making [29]. Wang, Y.B., et al. constructed a tripartite evolutionary game model with government, consumers, and electric vehicle manufacturers and found that the subsidy of power batteries is the main factor influencing consumers’ willingness to purchase [30].

2.3. Carbon Emission

However, few scholars have studied the battery recycling model from the perspective of carbon emission efficiency. Jiao et al. explored the impact of recycled material revenue on the choice of recycling model and the carbon emissions of closed-loop supply chain system [31]; Wang et al. analyzed the carbon emission reduction potential of NEVs, and pointed out that NEVs have a great potential to reduce the carbon emission of the transportation sector [32]; Lai et al. discussed the current situation and the progress of carbon accounting research on retired power battery recycling status and carbon accounting research progress, pointing out that the recycling of power batteries is of great significance in reducing carbon emissions [33]; as the background of carbon emissions, Zhang, C. studied the optimal decision-making model by comparing three different recycling models, and analyzed the impact of exogenous parameters on carbon emission reduction [34]; Zhang, C. et al. studied the recycling model selection and carbon emission reduction strategy, considering parameters such as initial carbon emissions, unit carbon emission price and carbon emission reduction coefficient, and put forward four mixed-channel recycling models [35]; Qi, Y. et al. found that the carbon emission allowance policy can effectively incentivize enterprises to recycle and utilize retired NEV batteries [36]. It can be seen that most of the existing literature only proposes that recycling power batteries is of great significance for reducing carbon emissions from a theoretical perspective, and less literature adds carbon emission efficiency as a constraint to the model establishment.
Not only in the field of new energy vehicle battery recycling but also in other industries, it is necessary to combine the policy with the actual situation in order to achieve better results. Xu, X., et al. proposed a benchmarking management framework for the sustainable development of energy companies by applying the theme mining model LDA, the relational extraction model CasRel, and other models to make suggestions for the sustainable development of energy companies [37]. Xu, A., et al. explored the impact mechanism of smart city pilot policy (SCPP) on CO2 emissions of industrial enterprises by applying the time-varying difference method (DID) and the mediated effect model [38]. Liu, X. et al., in order to explore the main drivers of the changes in the road transport RTC to alleviate the constraints of the strict policy on the overall carbon emission reduction of the RTC, an extended input-output framework was proposed, which provides a reasonable guideline for the policy formulators with reasonable guidance [39].

2.4. Capacity Requirements and Processes for NEV Battery Recycling

According to the warranty conditions of today’s car companies, when the maximum capacity of the power battery decreases to 70–80%, the battery must be replaced, and there are two ways to decommission power batteries: one is for the decommissioned power batteries in line with the degree of energy degradation to carry out the gradient utilization, that is, for the battery capacity in the range of 60–80%, after disassembling and reorganizing, it can be used for energy storage power stations, communication base stations, low-speed electric vehicles, etc.; the battery capacity in the range of 20–60% can be decomposed into battery units can be disassembled and reorganized into multiple batteries for use in user terminals or microgrids through series or parallel connections. The second is to regenerate the batteries that cannot be utilized in a stepwise manner, i.e., to disassemble the batteries with a capacity of less than 20%, to obtain the parts and components therein, and to extract the renewable materials for recycling. In this paper, the three-tier supply chain recycling model consisting of battery producers, NEV OEMs, and certified recyclers is studied mainly from the perspective of the supply chain.

2.5. Applications of Evolutionary Game Theory

Using evolutionary game theory for the study, evolutionary game theory emphasizes the dynamic adjustment process of strategies, which can reveal the strategy evolution trend of each participant (e.g., government, enterprises, and consumers) in the new energy vehicle battery recycling model in the long-term interaction. By simulating the adoption and selection process of different strategies, it is possible to understand how the recycling model gradually evolves from the initial state to a stable state, providing a dynamic perspective for policy formulation. Different from traditional game theory, evolutionary game theory assumes that the participants are boundedly rational, which is more in line with the real situation. This assumption can explain how the participants in the recycling model can gradually adjust their strategies through trial and error and learning under the condition of incomplete information or limited cognitive ability, thus providing a more practical reference for policy design. The recycling of new energy vehicle batteries involves the government, battery manufacturers, recycling companies, consumers, and other parties, and the goals of each party are different or even conflicting. Evolutionary game theory can simulate the strategy choices and adjustments of these subjects in long-term interactions, reveal the evolutionary stable state (ESS) under different strategy combinations, and provide a scientific basis for policy formulation.

2.6. Innovativeness

Based on the above literature review, we find that in previous studies, the research on subsidy policy mainly considers the subsidy under the EPR system and mainly focuses on which subsidy group will lead to the optimal strategy for the supply chain when considered as a variable, while the research on carbon emission reduction mainly focuses on the area of carbon accounting, and there is little literature on the direct embodiment of this policy in the cost. In this paper, we quantify the cost of carbon emission as a parameter and add it to the model formulation, which more intuitively reflects its impact on the return of the supply chain subject. At the same time, we also explore how supply chain members influence each other’s strategy choices under the influence of the policy, which provides certain suggestions for policymakers.

3. Basic Assumptions and Model Building

3.1. Game Sides

In this study, we establish a tripartite evolutionary game model within a three-level supply chain comprising battery producers, NEV OEMs, and certified recyclers. Battery producers perform two main functions: power battery production and post-dismantling material procurement from supply chain partners. Their emissions mitigation strategies comprise (1) production process optimization through advanced manufacturing technology; (2) standardized battery design implementation with modular architecture to streamline dismantling procedures, consequently decreasing recycling complexity and associated carbon footprint; NEV OEMs are mainly responsible for the recycling of power batteries, which is the most important part of the supply chain. NEV OEMs conduct technical assessments of batteries’ remaining life, type, safety, and capacity degradation through partnerships with certified recycling entities. Their decarbonization strategies involve (1) implementing battery recycling and recovery through cross-chain collaboration to enhance recycling efficiency while reducing resource waste and (2) institutionalizing regulatory compliance mechanisms that systematically address national environmental legislation and dynamically adapt to evolving carbon emission protocols. Certified recyclers execute graded recycling processes based on battery specifications determined through manufacturer evaluations, systematically processing decommissioned batteries according to their residual value tiers. Certified recyclers achieve carbon emissions reduction through blockchain-based traceability systems and optimized recycling networks that ensure full material recovery compliance with circular economy principles. Refer to Figure 1 for specific recycling process.

3.2. Game Strategy

In the tripartite evolutionary game of NEV battery recycling, the strategy set of battery producers is (active R&D, passive R&D); the strategy set of NEV OEMs is (active cooperation, non-cooperation); and the strategy set of certified recyclers is (full service, partial service).

3.3. Basic Assumption

Hypothesis 1 (H1). 
Power battery producers, in the choice of “positive R&D” strategy, pay R&D costs, which are recorded as C 1 , carbon emission reduction subsidies Q are granted by the government; battery producers choose “non-innovative strategy”, respectively, with the certified recyclers in the recycling process, needing to pay carbon emission costs which are recorded as F 1 , NEV OEMs needing to pay purchase costs which are recorded as P .
Hypothesis 2 (H2). 
When the OEM chooses the “active cooperation” strategy, it needs to pay the cost of constructing the recycling channel, which is recorded as C 2 , and the battery producer and the certified recycler get the additional cooperation benefit, R 1 and R 2 , respectively; when the OEM chooses the “non-cooperation” strategy, the benefit is 0 . To optimize the recycling network efficiency, the battery producers and the certified recycler need to pay the cost for the construction of the recycling network, which is N 1 N 2 and, respectively.
Hypothesis 3 (H3). 
Certified recyclers pay more for disassembly costs when they choose a “full dismantling” strategy, which is recorded as C 3 , and battery producers pay for disassembly costs when they choose a “partial dismantling” strategy, which is recorded as N 3
Hypothesis 4 (H4). 
In the process of NEV battery recycling, the probability that the battery producers carries out positive R&D is x, the probability that it carries out negative R&D is 1 − x, the probability that NEV OEM cooperates is y, the probability that it does not cooperate is 1 − y, the probability that the certified recycler carries out full service is z, and the probability that it carries out partial service is 1 − z. ( x , y , z 0 , 1 ).

4. Modeling and Analysis of a Three-Way Evolutionary Game Considering Carbon Emissions

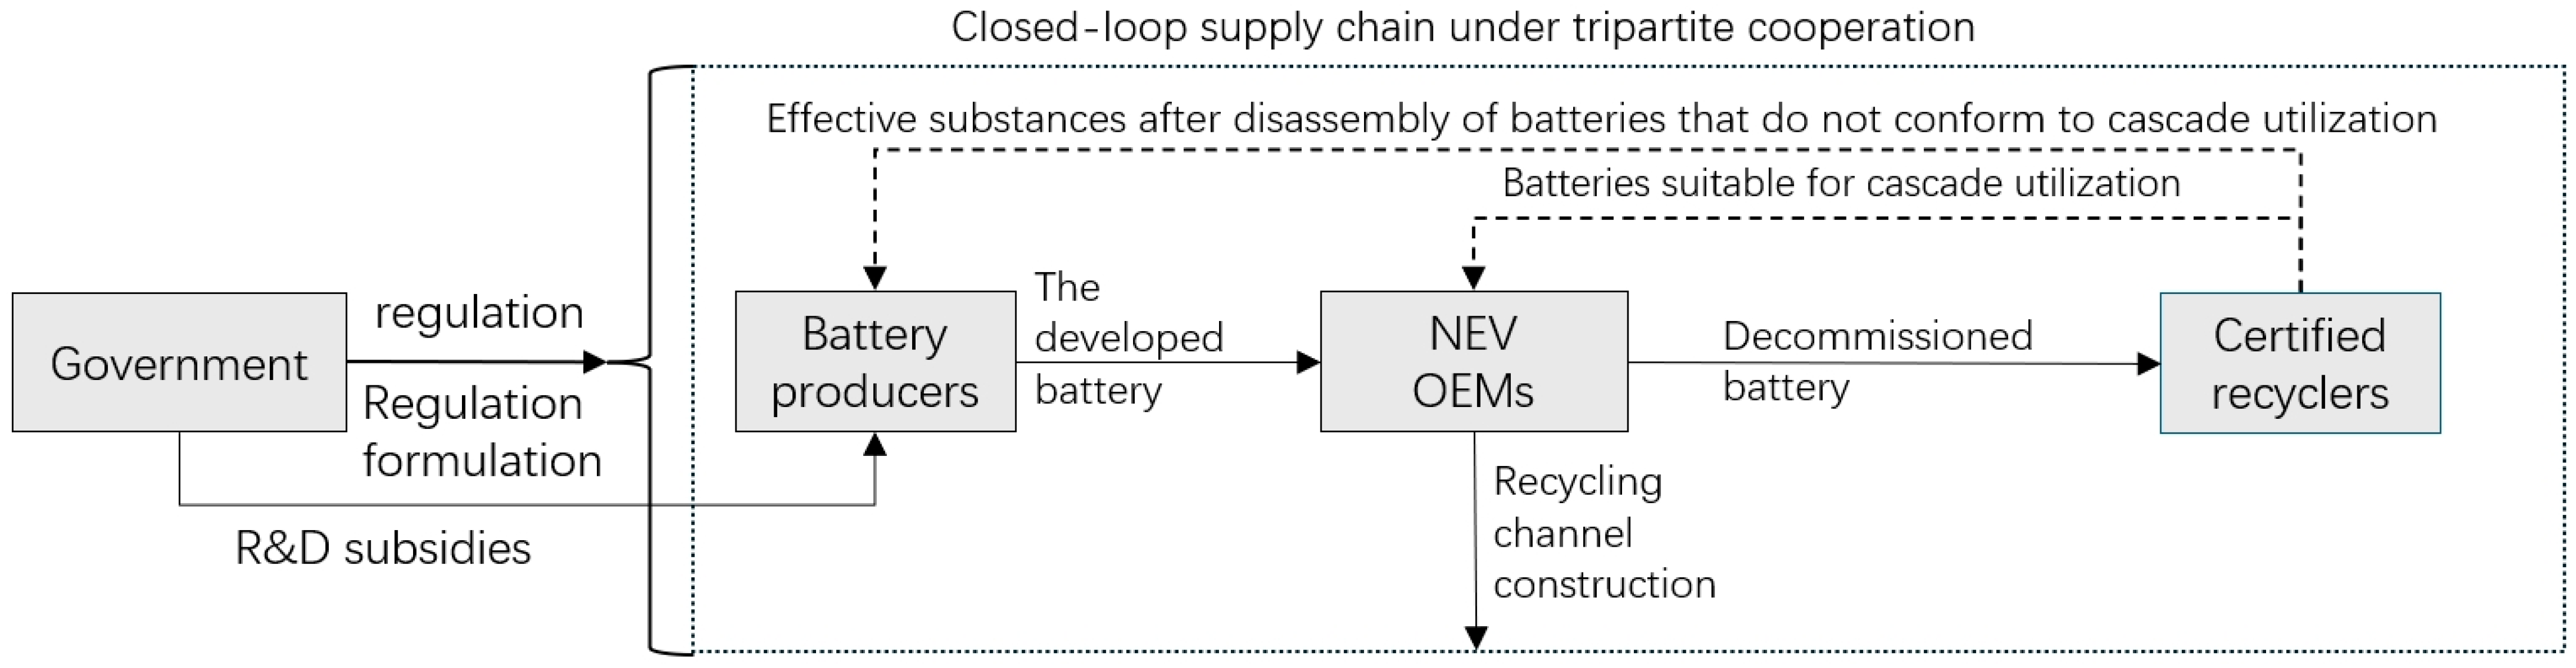
4.1. Model Construction

Based on the above basic assumptions, the strategy mix and payment benefit matrix for battery producers, NEV OEMs, and certified recyclers can be obtained. See Table 1 for details.

4.2. Stability Analysis of Subjective Evolutionary Games

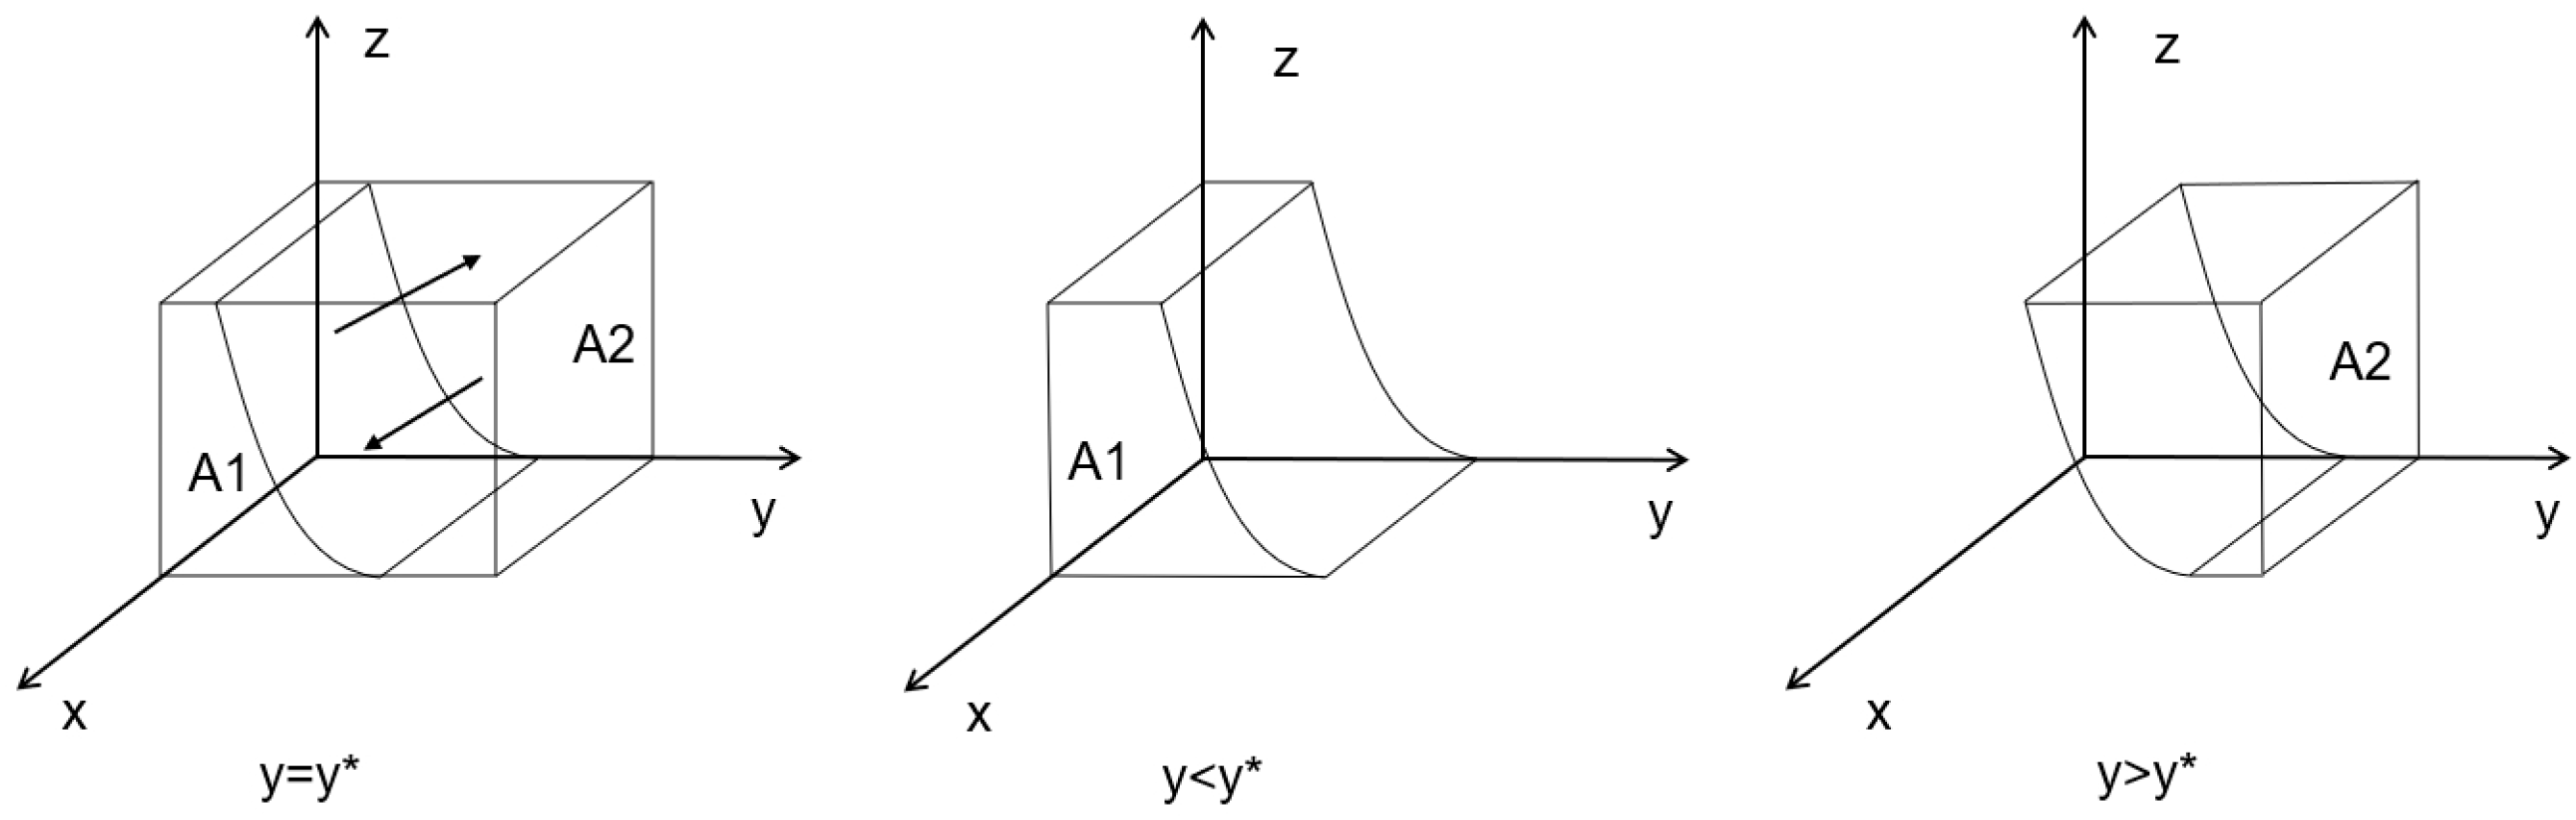
4.2.1. Stability Analysis of Evolutionary Equilibrium Strategies of Power Battery Producers

Assuming that the battery producer chooses “active R&D”, the expected return is E 11 , the expected return of “negative R&D” E 12 , the average expected return is E 1 , according to Table 2, the benefits matrix, can be derived:
E 11 = C 1 + Q + [ z ( 1 y ) + y ( 1 z ) ] ( R 1 N 3 ) ( 1 y ) ( 1 z ) N 1 E 12 = F 1 + y R 1 y z N 3 z N 1 ( 1 y ) ( 1 z ) N 1 + N 3 E 1 = x E 11 + 1 x E 12
Based on the replication dynamics equation, the replication dynamics equation for the battery producer can be derived as:
F x = x 1 x E 11 E 12 = x 1 x Q C 1 + F 1 + N 3 + z ( R 1 2 N 3 + N 1 ) 2 y N 3 + 2 y z ( N 3 R 1 )
x of the first-order derivatives and the setting of the respective G ( y ) are:
d F x / d x = 1 2 x 1 y z R 1 + N 1 N 3 C 1 + Q + F 1
G y = Q C 1 + F 1 + N 3 + z ( R 1 2 N 3 + N 1 ) 2 y N 3 + 2 y z ( N 3 R 1 )
It can be shown that when x = 0 , x = 1 , and y = y * = z ( R 1 2 N 3 + N 1 ) + Q C 1 + F 1 + N 3 2 ( N 3 z N 3 + z R 1 ) . According to the stability theory, the power battery producers can reach an evolutionarily stable state when d F / d x 0 . Since d G y / d y < 0 , it has decreased monotonically.
(1)
y = y * , G ( y ) = 0 , d F ( y ) = 0 , Regardless of the value Z , power cell producers are always stabilized.
(2)
y y * , 0 < y < y * , G ( y ) > 0 , d F x d x x = 1 < 0 , at this point x = 1 is the equilibrium point; y < y * < 1 , G(y) < 0, d F x d x x = 0 > 0 , at this point x = 0 is the equilibrium point.
The phase diagram of the strategy evolution of the battery producers is shown in Figure 2.
As can be seen from the figure, the volume of A1, VA1, represents the probability that the battery producer performs negative R&D, and the volume of A2, VA2, represents the probability that the battery producer performs positive R&D, which can be calculated as:
V A 1 = 0 1 0 1 z ( R 1 2 N 3 + N 1 ) + Q C 1 + F 1 + N 3 2 z ( R 1 N 3 ) + 2 N 3 d x d z = R 1 2 N 3 + N 1 2 ( R 1 N 3 ) + R 1 ( Q C 1 + F 1 ) + N 3 ( Q + F 1 + N 1 C 1 ) 2 ( R 1 N 3 ) 2 ln ( R 1 N 3 )
V A 2 = 1 V A 1 = R 1 + N 1 2 ( R 1 N 3 ) R 1 ( Q C 1 + F 1 ) + N 3 ( Q + F 1 + N 1 C 1 ) 2 ( R 1 N 3 ) 2 ln ( R 1 N 3 )
Proposition 1. 
The probability that a battery producer chooses to undertake active R&D is positively correlated with government R&D subsidies and the cost of building a recycling network, and negatively correlated with the cost of carbon emissions and R&D costs.
Proof: 
Based on the expression V A 2 for the probability of active R&D in the selection of battery producers, a partial derivation of the various elements can be obtained: R 1 < N 3 , δ V A 2 δ N 1 > 0 , δ V A 2 δ C 1 < 0 , δ V A 2 δ Q > 0 , δ V A 2 δ F 1 < 0 , thus an increase in N 1 Q and/or a decrease in C 1 F 1 and increases the probability that the battery producer will perform active R&D. □
Proposition 1 suggests that the more actively NEV OEMs can establish battery recycling channels and meet the recycling requirements of battery producers, the more positively correlated with R&D investment intensity. In addition, R&D activity increases with government subsidies and carbon costs.
Proposition 2. 
In the evolutionary process, the probability of active R&D by battery producers increases with the rate of active cooperation by NEV OEMs and the rate of full service by certified recyclers.
Proof: 
From the stability of the battery producer’s strategy choice: z < 2 y N 3 + C 1 Q F 1 N 3 / 2 y ( N 3 R 1 ) + R 1 2 N 3 + N 1 0 < y < y * G y > 0 d F x / d x x = 1 < 0 , at this point x = 0 is the stabilizing strategy; conversely, x = 1 is a stabilizing strategy. It can be seen that as y increases, the probability that the battery producer undertakes active R&D gradually changes from 0 to 1; thus, x rises as y z and increases. □
Proposition 2 suggests that increasing the full dismantling rate of certified recyclers can increase the probability of battery producers conducting active R&D. When certified recyclers provide full dismantling, they can effectively promote the recycling of resources for battery producers, saving production costs for battery producers so that they can invest more money in R&D.

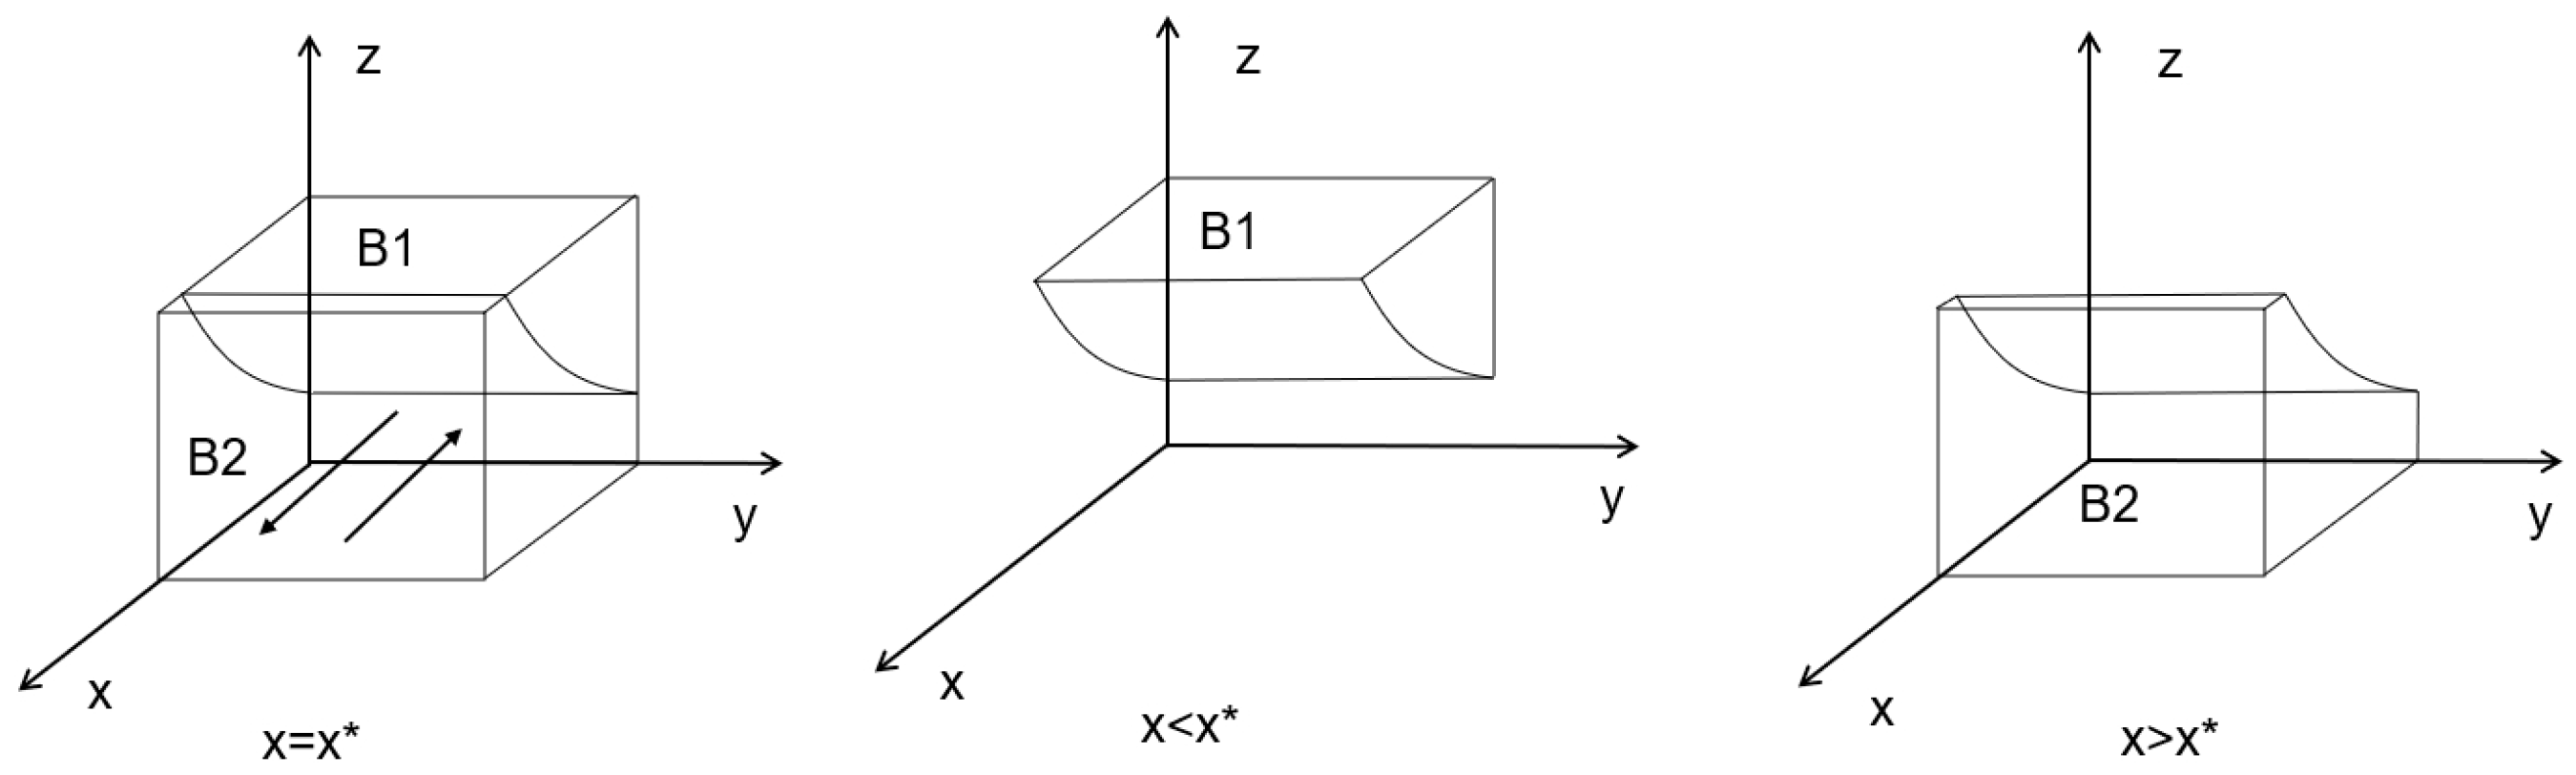
4.2.2. Stability Analysis of Evolutionary Equilibrium Strategies of NEV OEMs

Assuming that the expected return of the OEM choosing “cooperation” is E 21 , the expected return of the OEM choosing “no cooperation” is E 22 , and the average expected return is E 2 , which can be derived according to the return matrix:
E 21 = C 2 + M ( 1 z ) ( 1 x ) ( P ) E 22 = 1 x M Z C 2 Z P E 2 = y E 21 + 1 y E 22
Based on the replication dynamics equation, the replication dynamics equation for the OEM can be derived as:
F y = d y / d t = y 1 y E 21 E 22 = y 1 y M C 2 + ( 1 x ) z ( C 2 M P ) + 2 P ( 1 x )
y of the first-order derivatives and the setting of the H(x), respectively, are:
d F y / d y = 1 2 y M C 2 + ( 1 x ) z ( C 2 M P ) + 2 P ( 1 x )
H x = M C 2 + ( 1 x ) z ( C 2 M P ) + 2 P ( 1 x )
It can be shown that when y = 0 , y = 1 , and x = x * = 1 C 2 M z ( C 2 M P ) + 2 P , F ( y ) = 0 . According to the stability theory, NEV OEM can reach the evolutionarily stable state when d F ( y ) / d y 0 . Since d H ( x ) / d x > 0 is monotonically increasing.
(1)
x = x * , H ( x ) = 0 , d F ( y ) / d y = 0 , Regardless of the value of Z , the power cell producer is in a steady state.
(2)
x x * , 0 < x < x * H x > 0 d F ( y ) d y | y = 1 < 0 , so the point x = 1 is the equilibrium point. x < x * < 1 , H ( x ) < 0   d F y d y | y = 0 < 0 , so the point x = 0 is the equilibrium point.
The phase diagram of the evolutionary strategies of OEMs is shown in Figure 3:
As can be seen from the figure, the volume of B1, VB1, represents the probability that NEV OEM carries out active cooperation, and the volume of B2, VB2, represents the probability that NEV OEM carries out non-cooperation, which can be derived from the calculation:
V B 2 = 1 P C 2 M P 1 0 1 ( 1 C 2 M z ( C 2 M P ) + 2 P ) d x d z = z C 2 M C 2 M P ln z ( C 2 M P ) + 2 P | 1 P C 2 M P 1 = P C 2 M P C 2 M C 2 M P ln C 2 M + P C 2 M
V B 1 = 1 V B 2
Proposition 3. 
The probability of OEMs choosing to cooperate actively is negatively correlated with the cost of building the recycling channel and the extra cost of paying for the purchase, and positively correlated with the revenue of OEMs.
Proof: 
The partial derivatives of the elements can be found from the expression of VC2 δ V B 1 δ C 2 < 0 , δ V B 1 δ P < 0 , δ V B 1 δ M > 0 ( s . t . C 2 M < 0 ) . Thus, the decrease in C3 and P as well as the increase in M increase the probability of active cooperation of the NEV OEMs. □
Proposition 3 suggests that the probability of active cooperation of NEV OEMs is influenced by the probability of battery producers choosing active R&D. The active R&D of battery producers effectively reduces the cost of carbon emissions in the process of battery recycling and reduces the cost investment of NEV OEMs, thus increasing the probability of active cooperation.
Proposition 4. 
There exists a probability in the evolutionary process that the probability of an OEM choosing to actively cooperate increases with the rate of active R&D by the battery producer and the rate of full service by the certified recycler.
Proof: 
Analysis based on the stability of OEM strategies: z < C 2 M 2 P ( 1 x ) 1 x C 2 M P , x < x * , H x > 0 d F ( y ) d y | y = 1 < 0 , at this point, y = 0 is the equilibrium point; conversely, y = 1 is the equilibrium point. Therefore, the probability of active cooperation by the OEMs also increases gradually from y = 0 to y = 1 as x and z increase, and hence y increases with x and z. □
Proposition 4 suggests: It shows that the probability of the OEM’s strategic choice of active cooperation is affected by the probability of the certified recycler providing comprehensive services, and the higher the probability of the certified recycler providing comprehensive services, the higher the probability of the OEM engaging in active cooperation. This is because the comprehensive service provided by the third party facilitates the battery inspection process of OEMs, standardizes the criteria for recycled batteries, and improves the quality of recycled batteries.

4.2.3. Stability Analysis of Evolutionary Equilibrium Strategies of Certified Recyclers

Assuming that the expected return for a certified recycler choosing “full service” is z , and that the expected return for a certified recycler choosing “partial service” is 1 z , the average expected return is, according to the revenue matrix:
E 31 = R 2 + x 1 F 1 x 1 y N 2 + C 3 + R 2 C 3 y E 32 = R 2 x y N 2 x ( 1 y ) F 1 y ( 1 x ) F 1 + N 2 + C 3 ( 1 x ) ( 1 y ) E 3 = z E 31 + 1 z E 32
Based on the replication dynamics equation, the replication dynamics equation for the OEM can be derived as
F z = z 1 z E 31 E 32 = z 1 z R 2 + N 2 + C 3 x ( R 2 + N 2 + 2 C 3 ) y ( N 2 + 2 C 3 ) + x y ( N 2 + 2 C 3 )
z of the first-order derivatives and the setting of the T(y), respectively, are:
d F z d z = 1 2 z R 2 + N 2 + C 3 x ( R 2 + N 2 + 2 C 3 ) y ( N 2 + 2 C 3 ) + x y ( N 2 + 2 C 3 )
T y = R 2 + N 2 + C 3 x ( R 2 + N 2 + 2 C 3 ) y ( N 2 + 2 C 3 ) + x y ( N 2 + 2 C 3 )
It can be seen that when z = 1 z = 0 , and y = y * * = N 2 + C 3 + R 2 N 2 + 2 C 3 x 1 x C 3 N 2 + 2 C 3 , F ( x ) = 0 , and according to the stability theory, only when d F / d x 0 the certified recycler reaches a steady state. d t y / d y > 0 it is monotonically increasing.
(1)
y = y * * , T ( y ) = 0 , d F z / d z = 0 , no matter what the value of x is certified recyclers are all in an evolutionary steady state.
(2)
y y * * : 0 < y < y * * , T ( y ) < 0 , d T y d y | y = 0 < 0 , at this point, y = 0 is the equilibrium point; y < y * * < 1 , T ( y ) > 0 , d T y d y | y = 1 < 0 , so at this point, y = 1 is the equilibrium point.
The phase diagram of the strategy evolution of certified recyclers is shown in Figure 4:
Proposition 5. 
The probability of a certified recycler choosing full service is positively correlated with the revenue gained from the recycling partnership, and negatively correlated with the cost of battery disintegration and the cost of building recycling channels.
Proof: 
A partial derivation of the expression VC1 for the certified recycler’s full-service strategy yields δ V C 1 δ R 3 > 0 , δ V C 1 δ N 2 < 0 , δ V C 1 δ C 3 < 0 . Therefore, an increase in R 3 and a decrease in N 2 and C 3 will increase the willingness of certified recyclers to provide full service. □
Proposition 5 suggests that: Certified recyclers provide a full range of services based on a win-win situation, which increases the willingness of other companies to cooperate with the certified recycler and thus increases the certified recycler’s own revenue, although it will add a small amount of disassembly costs.
Proposition 6. 
The evolutionary probability of the existence of a full-service certified recycler increases with the rate of active R&D by battery producers and the probability of active cooperation by NEV OEMs.
Proof: 
Analysis based on the stability of certified recycler strategies, x < 1 C 3 y ( N 2 + 2 C 3 ) ( R 2 + N 2 + C 3 ) 0 < y < y * T y < 0 d T y d y | y = 0 < 0 , At this point, x = 0 is the equilibrium point, and conversely, x = 1 is the equilibrium point. Thus, as x , y increases, the stabilization strategy of the certified recycler gradually increases from z = 0 (partial service) to z = 1 (full service). □
Proposition 6 suggests that: The higher the standardization of batteries and the better the recycling channels, the higher the service level of certified recyclers and the better the variety of services.

4.2.4. Stability Analysis of Three-Party Evolutionary Games

To study the stability of the strategy combination of the three-party evolutionary game system composed of power battery producers, NEV OEMs, and certified recyclers, assuming that the point (1,1,1) is expressed as the three-party strategy ensemble {active research and development, active cooperation, and comprehensive service}, and the replicated dynamic equations of the three, i.e., Equations (2), (6), and (10), can be associated, we can get the dynamical system of the three-party evolutionary game.
Let the replication dynamics equations of all three parties of the game be zero, and then the equilibrium state of the replication dynamics system of the three-party evolutionary game can be found. Therefore, by making F(x) = F(y) = F(z) = 0, and combining with the property that only the stability of pure strategy equilibrium can be taken into account in the asymmetric game, it can be concluded that the equilibrium points of the system are, respectively, E 1 0 , 0 , 0 , E 2 ( 0 , 1 , 0 ) , E 3 0 , 0 , 1 , E 4 0 , 1 , 1 , E 5 1 , 0 , 0 , E 6 1 , 0 , 1 , E 7 1 , 1 , 0 , E 8 1 , 1 , 1 .
It can further be derived that the Jacobi matrix of the three-party game system is
J = d F ( x ) d x d F ( x ) d y d F ( x ) d z d F ( y ) d x d F ( y ) d y d F ( y ) d z d F ( z ) d x d F ( z ) d y d F ( z ) d z = A 11 A 12 A 13 A 21 A 22 A 23 A 31 A 32 A 33
A 11 = 1 2 x [ Q C 1 + F 1 + N 3 + z ( R 1 2 N 3 + N 1 ) 2 y N 3 + 2 y z ( N 3 R 1 ) ]
A 12 = x ( 1 x ) [ 2 N 3 + 2 z ( N 3 R 1 ) ]
A 13 = x 1 x R 1 2 N 3 + N 1 + 2 y ( N 3 R 1 )
A 21 = y 1 y z ( P + M C 2 ) 2 P
A 22 = 1 2 y M C 2 + ( 1 x ) z ( C 2 M P ) + 2 P ( 1 x )
A 23 = y 1 y 1 x C 2 M P
A 31 = z 1 z R 2 + N 2 + 2 C 3 + y ( N 3 + 2 C 3 )
A 32 = z 1 z ( N 2 + 2 C 3 ) ( x 1 )
A 33 = 1 2 z R 2 + N 2 + C 3 x ( R 2 + N 2 + 2 C 3 ) y ( N 2 + 2 C 3 ) + x y ( N 2 + 2 C 3 )
The equilibrium point derived from the replicated dynamic equations is a local asymptotic stabilization point in the group evolution process and not necessarily an evolutionarily stable strategy point ( E S S ) of the three-party game system [40]. According to Lyapunov’s indirect method, the equilibrium point is asymptotically stable only if all eigenvalues of the Jacobi matrix have negative real parts [41].
To derive the optimal conditions for the strategy combination, the above pure strategy equilibrium points are substituted into the above matrix, resulting in the eigenvalues under the eight local equilibrium solutions as shown in Table 3:
From the table as well as the indirect method, it can be concluded that the optimal combination of strategies can reach equilibrium in the following two states.
State 1: The state in which the certified recycler provides full services, Q + F 1 > C 1 M > C 2 2 R 2 + N 2 > C 3 , in which the parameters are satisfied, E 8 1 , 1 , 1 as an evolutionarily stable strategy. In this state, the certified recycler to provide comprehensive services to gain is higher than when providing partial services to gain, so they tend to choose comprehensive services; NEV OEMs choose not to cooperate with the strategy when the loss of revenue is greater than the difference between the cost of the enterprise’s revenues in the conduct of cooperation, so they tend to choose the cooperation strategy; power battery producers in the choice of negative R&D, the government not only does not give subsidies but also carbon emission fines, and the government will not give subsidies. When power battery producers choose negative R&D, the government not only does not give subsidies but also imposes carbon emission overrun fines, which are also greater than the cost of positive cooperation, so they are more inclined to choose the positive cooperation strategy.
State 2: The state where the certified recycler provides partial services when the parameters satisfy Q + F 1 > C 1 , M > C 2 , 2 R 2 + N 2 < C 3 , E 7 ( 1 , 1 , 0 ) the evolutionary stabilization strategy ( E S S ). In this state, the certified recycler provides full service.
To further explore the strategy selection mechanism of power battery producers, combined with the table of power battery producers’ R&D strategy (active R&D, negative R&D) for equilibrium analysis, also divided into the following two states:
State 3: positive R&D state. At this time, the combination of parameters to meet: C 1 + Q + F 1 > N 3 R 1 R 2 , M < C 2 2 R 2 + N 2 > C 3 , E 6 ( 1 , 0 , 1 ) , for the evolutionary stability strategy is ( E S S ), for the evolutionary equilibrium strategy is (positive R&D, no cooperation, full service). In this state, the power battery producer’s R&D cost is less than the additional benefits after positive inputs; the other two game parties have chosen to actively recycle the background of the NEV OEMs and choose to cooperate if the cost is greater than its additional benefits.
Power battery producers actively research and develop battery decarbonization, and although they pay a certain amount of R&D costs, the government will appreciate the positive behavior of the enterprise and will give the corresponding R&D subsidies. At this time, the R&D costs are much lower than the carbon emission costs paid due to negative R&D, so more inclined to choose the positive R&D strategy, and NEV OEMs in the construction of a logistics network to obtain the difference between the cost of the benefits and The difference between the benefits and costs of NEV OEMs after building a logistics network is negative, so they are more inclined to choose the non-cooperative strategy; the certified recyclers will choose the full-service strategy because of the excessive costs they have to pay.
State 4: Negative R&D state. At this time the parameter combination satisfies, C 1 + Q + F 1 < N 3 R 1 R 2 P + 2 C 2 > 0 , R 2 + N 2 > 0 , E 3 0 , 0 , 1 for the evolutionary stability strategy ( E S S ), the evolutionary equilibrium strategy is (negative R&D, no cooperation, partial service). In this state, the R&D cost of the power battery producers is greater than the additional benefit after positive input, and the cost of NEV OEM choosing to cooperate is greater than the additional benefit obtained by carrying out cooperation.

5. Simulation and Analysis

This research formulated an evolutionary game theoretical framework to analyze the systemic decision-making dynamic among the tripartite supply chain actors (battery producers, OEMs, and certified recyclers in power recycling systems). For the feasibility of the model, this paper refers to Wu and Zhang [42], and Zhou and Cheng [43] for the setting of relevant parameters. The initial settings of each parameter in the game model are as follows: Array 1: x = y = z = 0.2 , R 2 = C 2 = 0.1 , C 3 = R 1 = 0.5 , N 1 = N 2 = N 3 = 0.75 , C 1 = F 1 = Q = P = M = 1 and satisfy the condition of state 1. On this basis, we analyze the effects of x , y , the probability of strategy selection of the certified recycler under different initial values and the effects of the parameters on the evolutionary game process.

5.1. Impact of Battery Breakdown Costs

The battery decomposition cost is set to 0.1, 0.4, and 0.9 to simulate its impact on the process and outcome of the evolutionary game, as shown in Figure 5:
During the evolution of the gaming system to the stabilization point, as the cost of battery decomposition increases, the probability that the battery producers carry out active research and development gradually increases, and the probability that the certified recycler carries out full service gradually decreases. This indicates that as the battery decomposition cost increases, the cost expenditure of the certified recycler increases and exceeds the revenue gained from battery decomposition and selling recycled materials, so the certified recycler is more inclined to choose to carry out part of the service. At the same time, due to the increase in the cost of battery decomposition, the certified recycler will increase the offer of battery recycling; consequently, battery producers reduce the R&D to neutralize cost-benefit.

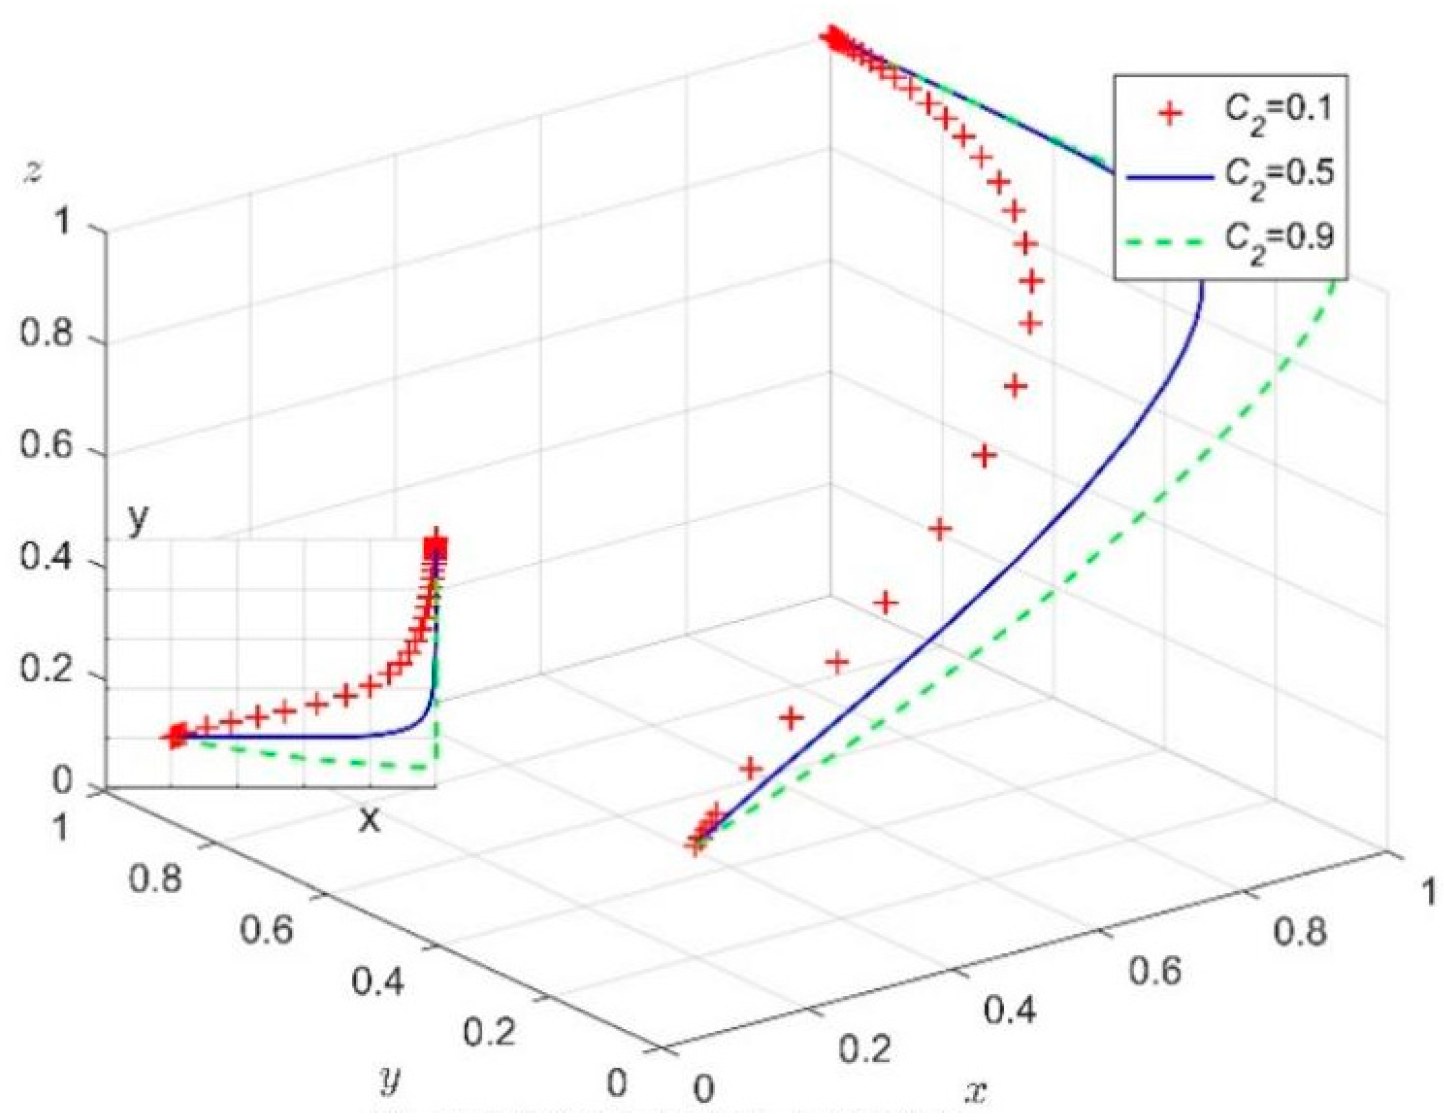
5.2. Impact of Recycling Channel Construction Costs

Set the cost of recycling channel construction to 0.1, 0.5, and 0.9, and simulate its impact on the process and outcome of the evolutionary game:
As can be seen from Figure 6, during the evolution of the system to the stabilization point, as the cost of recycling channel construction increases, the probability of battery producers conducting active R&D gradually increases, and the probability of OEMs conducting active cooperation gradually decreases. This indicates two effects: (1) The increase in the cost of the recycling channel leads to the difference between the revenue and cost of NEV OEM being less than zero, and therefore, OEM is more inclined not to cooperate. (2) With the increase in the cost of the recycling channel construction, the establishment of a faster and more efficient recycling channel enables the battery producer to obtain higher revenues, and therefore, it is more inclined to carry out active research and development. OEMs should rationalize the construction of recycling channels and build efficient recycling channels cost-effectively.

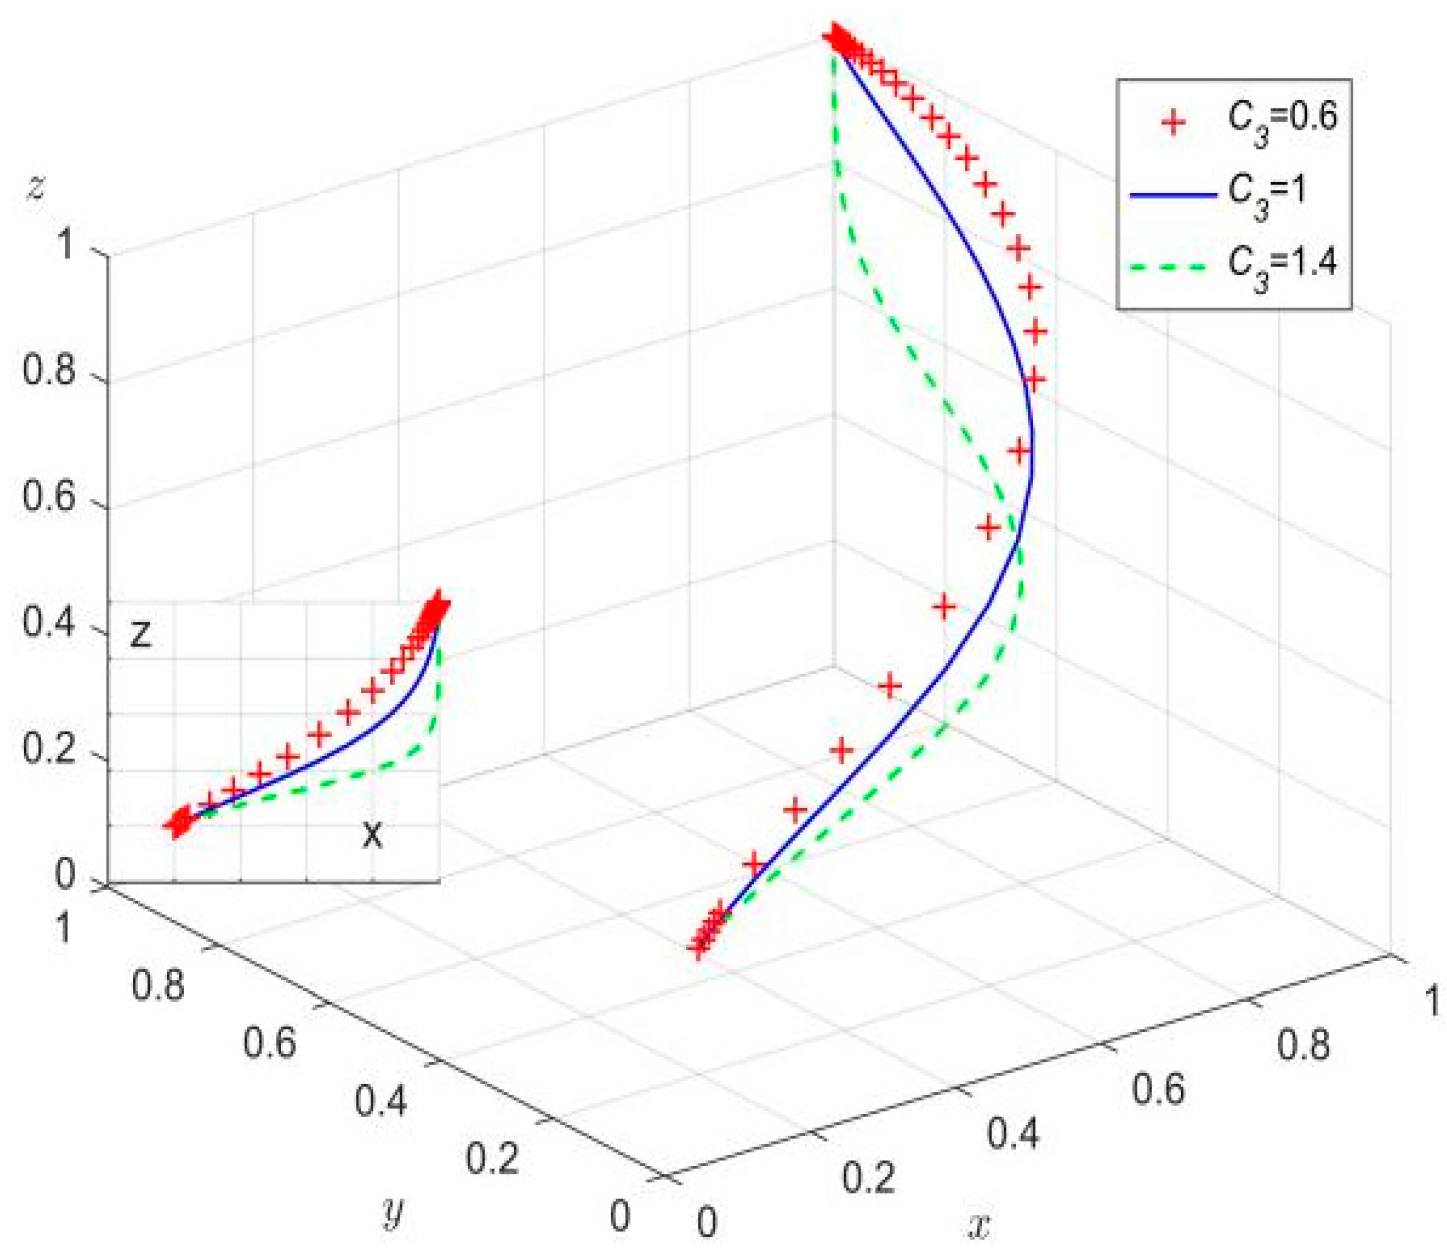
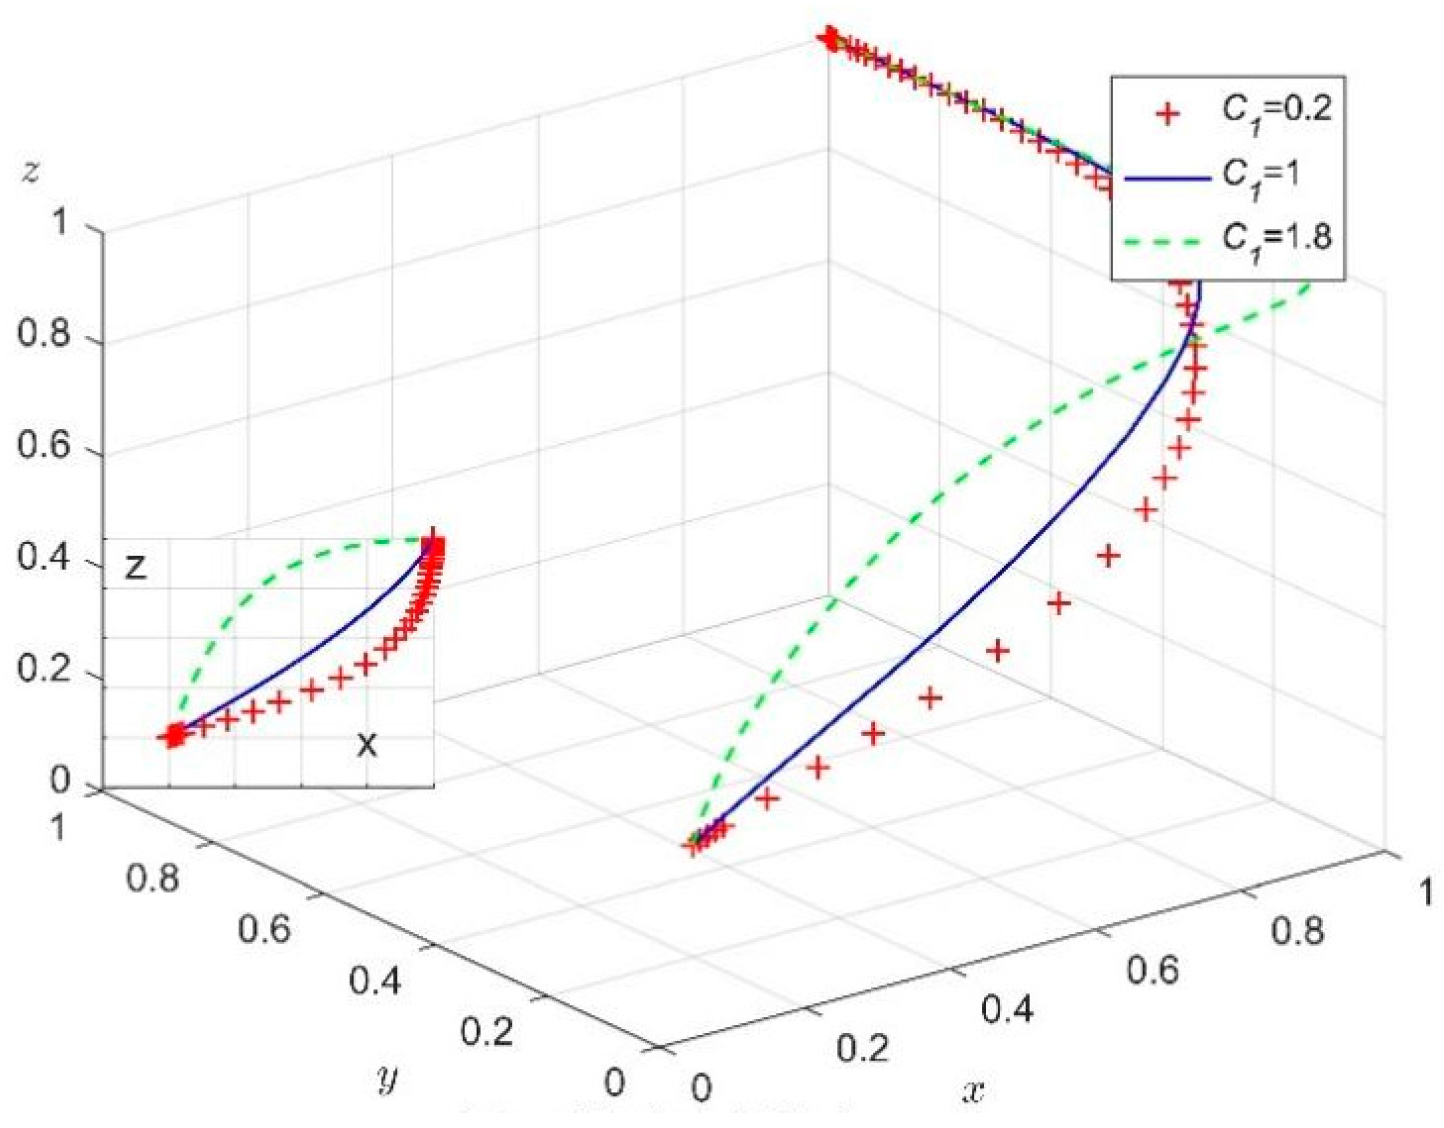
5.3. The Impact of Low Carbon Power Battery R&D Costs

The R&D costs are set to 0.1, 0.5, and 0.9 to simulate their impact on the process and outcome of the evolutionary game
Figure 7 shows that as the gaming system evolves to a steady state, the probability that the battery producers conduct active R&D gradually decreases as the R&D cost rises. In contrast, the probability of certified recyclers providing full service rises gradually. This suggests that, with the gradual increase in R&D costs, the existing government subsidies cannot make up for the difference in revenue and cost of battery producers, which leads to declining profits and discourages producers from active R&D, and thus they do not choose to actively research and develop. However, improved battery standardization reduces recycling costs, and the dismantling process has become cheaper, so the certified recyclers are more inclined to provide comprehensive services. To incentivize R&D, the government should reasonably adjust the R&D subsidies according to the R&D costs of battery producers to incentivize battery producers to conduct active R&D, improve the standardization of batteries, and reduce carbon emissions.

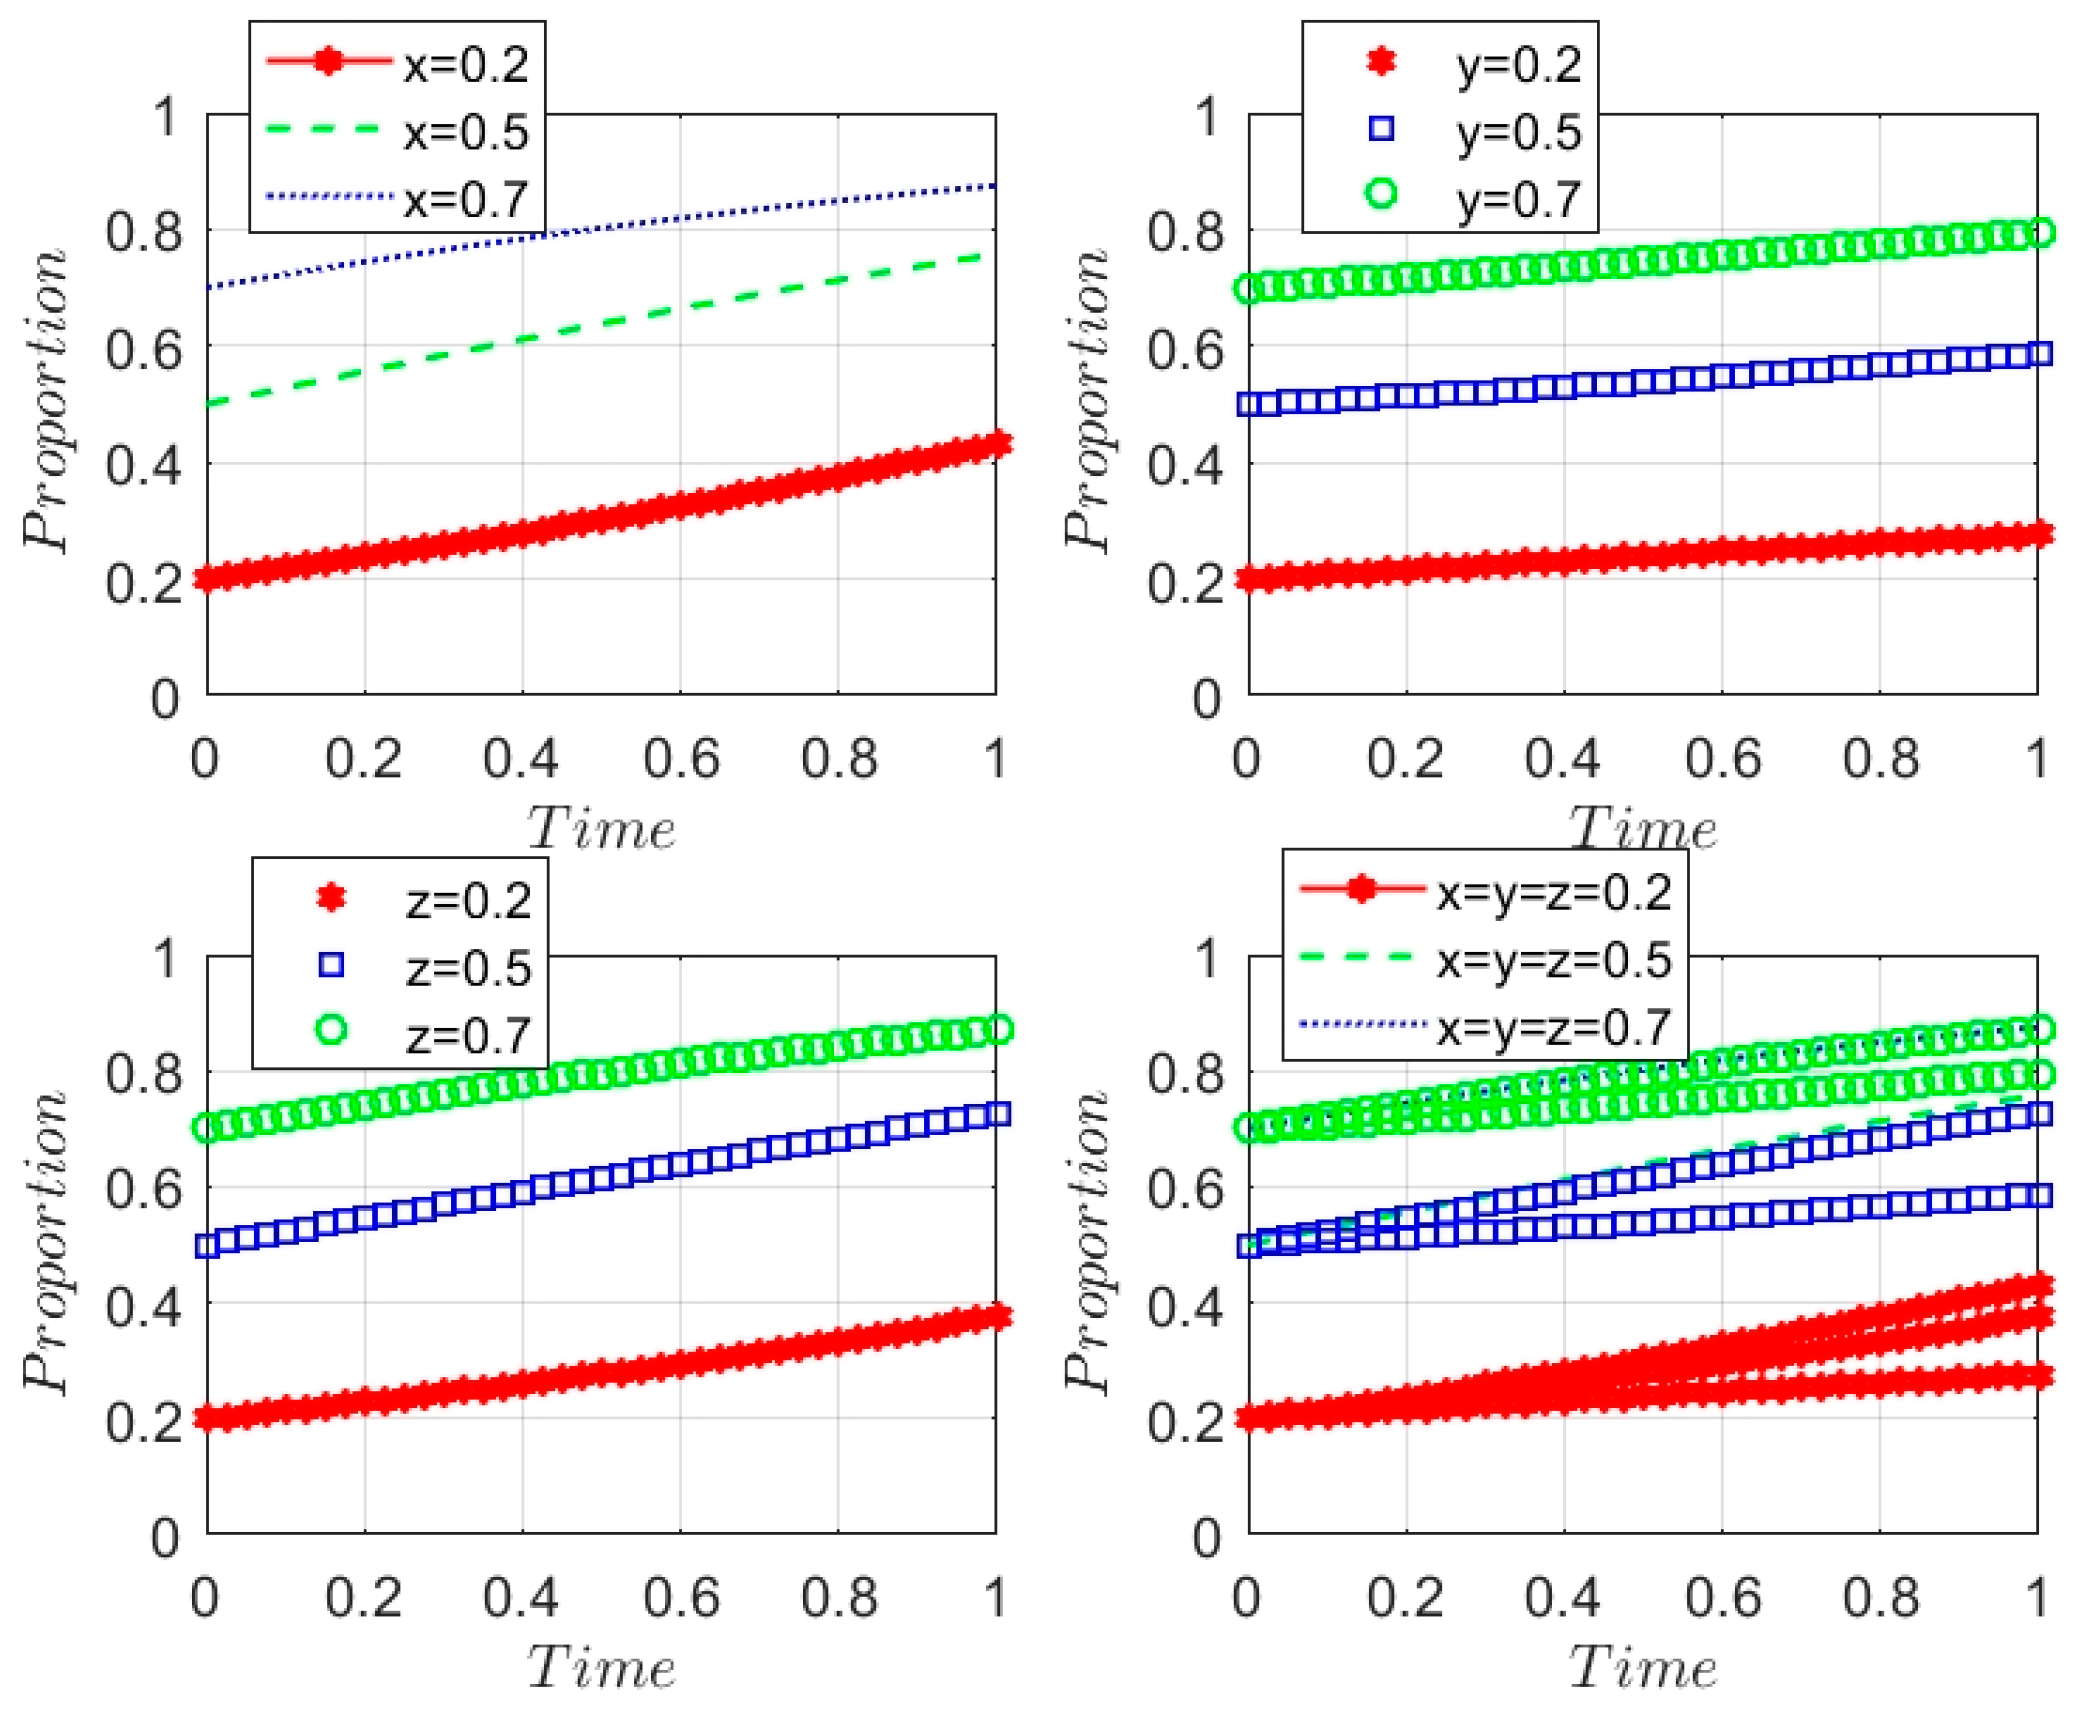
5.4. Interaction Between the Three Parties

Figure 8 shows that the probability of strategies between the supply chain subjects interacting with each other is that the higher the probability of the other two parties choosing positive strategies, the higher the probability of the remaining party choosing positive strategies, in which, from the the upper left corner of Figure 8, it can be seen that the battery manufacturer’s strategy has a significant technological spillover effect on the certified recycler and the NEV OEMs when choosing the strategy of active research and development, which also shows that the battery manufacturer plays an important role in the reduction of carbon emissions of the new energy This also shows that battery manufacturers play an important role in the process of reducing carbon emissions from new energy battery recycling. Meanwhile, from lower left corner of Figure 8, we can also see that the probability of certified recyclers carrying out full service has a substantial impact on the impact of battery manufacturers and NEV OEMs, so the synergistic incentives between battery manufacturers and certified recyclers should be strengthened to enhance the probability of both parties’ active strategies through the dual role of policy guidance and market regulation so as to build a more efficient supply chain recycling network.

5.5. Discussion on NEV Battery Recycling Model

Based on the above simulation analysis, this paper constructs three different recycling modes: led by NEV OEMs, led by certified recyclers, and co-operated by the three parties, respectively.
The first is the NEV OEMs-led recycling model, in which the recycling is carried out through the recycling network channels constructed by NEV OEMs. As NEV OEMs can carry out battery recycling through their broad offline sales and service outlets (4S shops, etc.), they have established a nationwide recycling network to ensure that retired batteries enter the official recycling channels directly without going through intermediaries, which enhances the quality of batteries. However, under this model, due to the low technical mastery of NEV OEMs on battery secondary use, it is difficult to achieve cross-brand and quasi-model battery recycling and use. Due to the reliance of NEV OEMs on their channels, it is difficult to reach the second-hand car market and other areas, resulting in the majority of decommissioned batteries being in the grey area.
Secondly, there is the certified recycler-led recycling model, in which the certified recycler takes charge of battery recycling, capacity testing, gradient utilization dismantling, etc. Since the certified recycler focuses on dismantling and utilization of batteries, it can realize an efficient dismantling process; the recycling of the certified recycler as a kind of outsourcing business is able to carry out resource integration for the enterprises that cooperate with the certified recycler and break down information barriers in the supply chain. The certified recycler’s recycling as a kind of outsourcing business can integrate the resources of its cooperating enterprises and break the information barrier in the supply chain. However, certified recyclers are unable to grasp the whole life cycle of batteries, resulting in low battery utilization and potential safety hazards, and the certified recycling industry does not have a unified industry standard, resulting in uneven levels of recycling.
Finally, there is a three-party cooperation recycling model in which the active R&D of battery manufacturers for low-carbon products reduces carbon emissions in the use and recycling process, the recycling channels established by vehicle manufacturers save recycling time and costs, and the certified recyclers provide comprehensive services to reduce carbon emissions in the subsequent use of batteries. Under this recycling model, each type of enterprise plays its own professional function, making it more specialized, efficient, and low-carbon, and allowing all enterprises under this model to obtain the maximum benefit income with the lowest cost expenditure, achieving a win-win situation for both the economy and the environment. Compared with the cooperative recycling model constructed by Chen, X. L., which has a recycling body and a ladder utilization body, the battery recycling process of the cooperative recycling model constructed in this paper is more comprehensive, which not only considers the economic factors but also the environmental factors [44].

6. Conclusions

Considering the large quantity of carbon emissions in the process of NEV battery recycling, this paper constructs a three-party evolutionary game model between battery producers, NEV OEMs, and certified recyclers; establishes a strategy set based on the reduction of carbon emissions; analyzes the stability of the strategic choices of each party, the stability of the equilibrium strategy combinations of the game system, and the relationship between the influences of each element; and verifies the validity of the conclusions through simulation analysis. We conclude that (1) the stability of the three-party evolutionary game system is mainly affected by factors such as the cost of carbon emissions, research and development costs, recycling channel construction costs, and battery disintegration costs; as long as these costs can be reasonably controlled, the best equilibrium results can be achieved. (2) The decision of the battery producers can affect the efficiency of the whole supply chain; active R&D by the battery producers can indirectly reduce the cost of other enterprises and avoid the negative impact of the environmental policy. (3) The decisions of the battery producers, NEV OEMs, and the certified recycler complement and affect each other, and the only way to achieve the optimal recycling model is to have active cooperation among the three parties, so we constructed a three-party cooperation new energy recycling model. Therefore, we constructed a three-party cooperation recycling model for the new energy vehicles supply chain.
In view of the above conclusions, we give the following suggestions:
(1) Establish a carbon emission cost control mechanism: adopt a dynamic adjustment strategy for carbon pricing, and adjust carbon pricing for enterprises that actively reduce carbon emissions. (2) Establish a cost-sharing mechanism for R&D and recycling: Provide subsidies for key R&D technologies of battery manufacturers to alleviate their cost pressure. (3) Introduce supply chain coordination incentives: Establish a three-party collaboration and revenue-sharing system, develop data-sharing platforms, and realize traceability management of the entire life cycle of batteries.

7. Shortcomings and Prospects

Methodological level: this study assumes that participants operate under bounded rationality, which deviates from the reality of information asymmetry and individual cognitive differences in the decision-making environment. It is suggested that future research could adopt dynamic game frameworks (such as differential games, stochastic games, etc.) and time-dependent strategic interactions in dynamic equilibrium.
Variable measurement dimension: The current model treats carbon emission cost as exogenous variables, failing to overlook the regional heterogeneity and industry specificity of the carbon pricing mechanism. Future research could integrate the Life Cycle Assessment (LCA) method to quantify life cycle emissions, thereby improving the intensity of the entire industrial chain and calibrating the model parameters using the IPCC greenhouse gas accounting guidelines or enterprise-level carbon accounting data to enhance the empirical validity of the cost-benefit analysis.

Author Contributions

Writing—original draft preparation, Y.L.; writing—review and editing, F.L. All authors have read and agreed to the published version of the manuscript.

Funding

This research received no external funding.

Institutional Review Board Statement

Not applicable.

Informed Consent Statement

Not applicable.

Data Availability Statement

The data presented in this study are available on request from the corresponding author.

Conflicts of Interest

The authors declare no conflict of interest.

References

  1. Organisation Internationale des Constructeurs d’Automobiles. Passenger Car Production by Region 2018–2023. OICA Statistical Portal. 2023. Available online: https://www.oica.net/statistics (accessed on 20 August 2024).
  2. Fortune. The Fortune 500. 2024. Available online: https://fortune.com/fortune500 (accessed on 13 April 2025).
  3. Li, X.H. The development status and future trends of NEVs in China. People’s Trib. 2024, 9, 76–79. [Google Scholar]
  4. Chen, Y.Q.; Cha, W.K.; Zhang, X.; Usaporn, S. Status quo and suggestions on the recycling of NEV power batteries. Battery 2024, 54, 94–97. [Google Scholar] [CrossRef]
  5. Wang, J.; Huang, X.R. Hazards and recycling of waste power batteries. Ecol. Econ. 2021, 37, 5–8. [Google Scholar]
  6. Ministry of Industry and Information Technology of the People’s Republic of China. Measures for the Comprehensive Utilization Management of NEV Power Batteries; Ministry of Industry and Information Technology of the People’s Republic of China: Beijing, China, 2023. Available online: https://www.miit.gov.cn/ (accessed on 13 April 2025).
  7. Feng, R.; Hua, Z.; Yu, J.; Zhao, Z.; Dan, Y.; Zhai, H.; Shu, X. A comparative investigation on the energy flow of pure battery electric vehicle under different driving conditions. Appl. Therm. Eng. 2025, 269, 126035. [Google Scholar] [CrossRef]
  8. Ministry of Industry and Information Technology of the People’s Republic of China. 2025 Recycling Action Plan. 2024. Available online: https://www.miit.gov.cn/ (accessed on 31 December 2024).
  9. CRU International. Global Battery Recycling Market Analysis 2023. 2023. Available online: http://www.crugroup.com (accessed on 13 April 2025).
  10. Xie, J.Y.; Le, W.; Guo, B.H. Pareto equilibrium in power battery recycling for NEVs based on extended producer responsibility. Chin. J. Manag. Sci. 2022, 30, 309–320. [Google Scholar] [CrossRef]
  11. Shen, Y.; Song, Z.Z.; Gao, T.; Ma, J. Research on closed-loop supply chain decision making of power battery considering subsidy transfer under EPR system. Sustainability 2022, 14, 12488. [Google Scholar] [CrossRef]
  12. Ding, J.F.; Pu, X.J.; Cao, Y.X.; Li, J. Research on the recycling cost-sharing mechanism of the closed-loop supply chain for NEVs under the EPR system. Chin. J. Manag. Sci. 2024, 32, 257–268. [Google Scholar] [CrossRef]
  13. Wei, L.; Wang, C.X.; Li, Y.Q. Simulation research on the impact effects of policies for recycling NEV power batteries. J. Saf. Environ. 2024, 24, 2837–2848. [Google Scholar] [CrossRef]
  14. Liu, B.P.; Liu, L.L.; Yuan, W.Z.; Wan, Z.R. Decision-making and coordination of closed-loop supply chains for automotive power battery remanufacturing under dual policies. Logist. Technol. 2023, 42, 135–144. [Google Scholar]
  15. Wu, W.Q.; Zhang, M. Decision analysis of closed-loop supply chain for power batteries under carbon cap-and-trade and subsidy policies. Chin. J. Manag. Sci. 2024, 32, 1–19. [Google Scholar] [CrossRef]
  16. Li, X.; Du, J.; Liu, P.; Wang, C.; Hu, X.; Ghadimi, P. Optimal choice of power battery joint recycling strategy for electric vehicle manufacturers under a deposit-refund system. Int. J. Prod. Res. 2023, 61, 7281–7301. [Google Scholar] [CrossRef]
  17. Noudeng, V.; Quan, N.V.; Xuan, T.D. A future perspective on waste management of lithium-ion batteries for electric vehicles in Lao PDR: Current status and challenges. Int. J. Environ. Res. Public Health 2022, 19, 16169. [Google Scholar] [CrossRef] [PubMed]
  18. Choi, Y.; Rhee, S.W. Current status and perspectives on recycling of end-of-life battery of electric vehicle in Korea (Republic of). Waste Manag. 2020, 106, 261–270. [Google Scholar] [CrossRef]
  19. Giosuè, C.; Marchese, D.; Cavalletti, M.; Isidori, R.; Conti, M.; Orcioni, S.; Ruello, M.L.; Stipa, P. An exploratory study of the policies and legislative perspectives on the end-of-life of lithium-ion batteries from the perspective of producer obligation. Sustainability 2021, 13, 11154. [Google Scholar] [CrossRef]
  20. Asokan, V.A.; Teah, H.Y.; Kawazu, E.; Hotta, Y. Ambitious EV policy expedites the e-waste and socio-environmental impacts in India. Resour. Conserv. Recycl. 2023, 190, 106829. [Google Scholar] [CrossRef]
  21. Tasaki, T.; Tojo, N.; Lindehewrst, T. Stakeholders’ differing views on extended producer responsibility and product management: An international questionnaire survey and statistical analysis. J. Ind. Ecol. 2019, 23, 438–451. [Google Scholar] [CrossRef]
  22. Pazuki, M.; Zakur, G. Dynamic strategic interaction between municipal authorities and companies under the existence of extended producer responsibility legislation. J. Clean. Prod. 2021, 292, 125966. [Google Scholar] [CrossRef]
  23. Winternitz, K.; Hegge, M.; Bield, J. EU extended producer responsibility for waste tyres: Lessons learned from three case studies—Belgium, Italy, and the Netherlands. Waste Manag. 2019, 89, 386–396. [Google Scholar] [CrossRef]
  24. Zeng, F.; Lu, Z.; Lu, C. Power Battery Recycling Model of Closed-Loop Supply Chains Considering Different Power Structures Under Government Subsidies. Sustainability 2024, 16, 9589. [Google Scholar] [CrossRef]
  25. Wang, E.; Nie, J.; Wang, Y. Government Subsidy Strategies for the NEV Power Battery Recycling Industry. Sustainability 2023, 15, 2090. [Google Scholar] [CrossRef]
  26. Hu, W.J.; Zhou, J.; Ma, C.L.; Zhao, H.; Dong, T. Mode selection for closed-loop supply chains of retired power batteries with dual channels. Syst. Eng.—Theory Pract. 2024, 44, 2572–2595. [Google Scholar]
  27. Lou, G.X.; Lei, P.; Ma, H.C.; Wan, N. Research on operational decisions of closed-loop supply chains for NEV power batteries under different recycling subsidy policies. Chin. J. Manag. 2023, 20, 267–277. [Google Scholar]
  28. Fan, J.; Teng, H.; Wang, Y.B. Research on the recycling strategy of NEV waste power battery based on consumer responsibility awareness. Sustainability 2022, 14, 10016. [Google Scholar] [CrossRef]
  29. Cao, X.G.; Cao, B.W.; Wen, H. Research on closed-loop supply chain decision-making considering fairness concerns in mixed recycling channels. Chin. J. Manag. Sci. 2024, 32, 1–21. [Google Scholar] [CrossRef]
  30. Wang, Y.B.; Dong, B.Q.; Ge, J.P. How can the recycling of power batteries for EVs be promoted in China? A multiparty cooperative game analysis. Waste Manag. 2024, 186, 64–76. [Google Scholar] [CrossRef]
  31. Jiao, J.; Pan, Z.; Li, J. Selection of Power Battery Recycling Modes Considering Economic Benefits and Emission Efficiency. Chin. J. Manag. Sci. 2024, 32, 1–16. [Google Scholar] [CrossRef]
  32. Wang, Z.P.; Zhan, W.P.; Sun, F.C.; Deng, J.J.; Cui, D.S.; Li, X.H. Analysis of carbon emission reduction potential of NEVs. Trans. Beijing Inst. Technol. 2024, 44, 111–122. [Google Scholar] [CrossRef]
  33. Lai, Z.Y.; Lai, W.B.; Lin, C.Y.; He, L.J.; Lin, H.; Xiao, F.Y.; Qian, Q.R.; Zhang, J.X.; Chen, Q.H.; Zeng, L.X. Research progress on the recycling and carbon accounting of retired power batteries. Chin. J. Process Eng. 2024, 24, 139–150. [Google Scholar]
  34. Zhang, C.; Chen, Y.X.; Tian, Y.X. Collection and recycling decisions for electric vehicle end-of-life power batteries in the context of carbon emissions reduction. Comput. Ind. Eng. 2023, 175, 108869. [Google Scholar] [CrossRef]
  35. Zhang, C.; Tian, Y.X.; Cui, M.Y. Recycling mode selection and carbon emission reduction decisions for a multi-channel closed-loop supply chain of electric vehicle power batteries. Chin. J. Manag. Sci. 2024, 32, 184–195. [Google Scholar] [CrossRef]
  36. Qi, Y.; Yao, W.; Zhu, J. Study on the Selection of Recycling Strategies for the Echelon Utilization of Electric Vehicle Batteries under the Carbon Trading Policy. Sustainability 2024, 16, 7737. [Google Scholar] [CrossRef]
  37. Xu, X.; Liu, Z.; Liu, W.; Pei, C.; Nie, Z.; Wu, X. A sustainable development benchmarking framework for energy companies based on topic mining and knowledge graph: The case of oil and gas industry. Renew. Sustain. Energy Rev. 2024, 196, 114350. [Google Scholar] [CrossRef]
  38. Xu, A.; Wang, W.; Zhu, Y. Does smart city pilot policy reduce CO2 emissions from industrial firms? Insights from China. J. Innov. Knowl. 2023, 8, 100367. [Google Scholar] [CrossRef]
  39. Liu, X.; Zhou, X. Determinants of carbon emissions from road transportation in China: An extended input-output framework with production-theoretical approach. Energy 2025, 316, 134493. [Google Scholar] [CrossRef]
  40. Friedman, D. Evolutionary Game in Economics. Econ. Erica 1991, 59, 637–666. [Google Scholar] [CrossRef]
  41. Zhu, L.; Rong, J.; Zhang, S. Tripartite Evolutionary Game and Simulation Analysis of Drug Safety Quality Supervision under Government Reward-Penalty Mechanism. Chin. J. Manag. Sci. 2021, 29, 55–67. [Google Scholar]
  42. Wu, R.; Zhang, Y.; Jiao, L. Tripartite Evolutionary Game and Simulation Analysis of Research Team Collaboration Behavior Based on Academic Social Networks. China Soft Sci. 2024, 9, 174–184. [Google Scholar]
  43. Zhou, D.; Cheng, X.; Wang, Q.; Yu, X. Analysis of the Impact Effects of Heterogeneous Policy Combinations on the Development of the NEV Industry. Chin. J. Manag. Sci. 2024, 1–14. [Google Scholar] [CrossRef]
  44. Lyu, X.; Xu, Y.; Sun, D. An Evolutionary Game Research on Cooperation Mode of the NEV Power Battery Recycling and Gradient Utilization Alliance in the Context of China’s NEV Power Battery Retired Tide. Sustainability 2021, 13, 4165. [Google Scholar] [CrossRef]
Figure 1. Battery Recycling Flow Chart.
Sustainability 17 04356 g001
Figure 2. Phase diagram of strategy evolution of battery producers.
Sustainability 17 04356 g002
Figure 3. Phase diagram of strategy evolution of OEMs.
Sustainability 17 04356 g003
Figure 4. Phase diagram of strategy evolution of certified recyclers.
Sustainability 17 04356 g004
Figure 5. Impact of battery breakdown costs.
Sustainability 17 04356 g005
Figure 6. Impact of recycling channel construction costs.
Sustainability 17 04356 g006
Figure 7. The impact of low-carbon power battery R&D costs.
Sustainability 17 04356 g007
Figure 8. Interaction between the three parties.
Sustainability 17 04356 g008
Table 1. Parameter setting table.
Relevant Parameter SettingsDefinition
Battery Manufacturers
x Active R&D
1 x Passive R&D
C 1 R&D cost
Q Carbon emission subsidies
F 1 Carbon emission cost
R 1 Additional cooperation benefit
N 1 Cost for construction of network
N 3 Disassembly costs
NEV OEMs
y Active cooperation
1 y Non-cooperation
P Purchase cost
C 2 Cost for construction of network
M Additional revenue
Certified Recyclers
z Full service
1 z Partial service
F 2 Carbon emission cost
R 2 Additional cooperation benefit
N 2 Cost for construction of network
C 3 Disassembly costs
Table 2. Payment Benefits Matrix.
StrategyBP ROEM RT-PR R
x , y , z C 1 + Q + R 1 C 2 + M R 2 + C 3
x , y , 1 z C 1 + Q + R 1 N 3 C 2 + M R 2
x , 1 y , z C 1 + Q + R 1 N 3 0 N 2 C 3
x , 1 y , 1 z C 1 + Q + R 1 N 3 0 N 2
1 x , y , 1 z F 1 + R 1 C 2 + M P F 1 + R 2 C 2
1 x , 1 y , z F 1 + R 1 N 3 C 2 + M P F 1 + R 2
1 x , 1 y , 1 z F 1 N 1 P F 1 N 2 C 3
1 x , y , 1 z F 1 N 1 N 3 P F 1 N 2
Table 3. Equilibrium points and eigenvalues.
Local Equilibrium PointEigenvalue 1Eigenvalue 2Eigenvalue 3
E 1 ( 0 , 0 , 0 ) Q + F 1 C 1 M C 2 R 2 + N 2
E 2 ( 0 , 1 , 0 ) Q + F 1 C 1 M C 2 R 2 + N 2 C 3
E 3 ( 0 , 0 , 1 ) C 1 + Q + F 1 N 3 + R 1 + N 1 P + 2 C 2 R 2 + N 2
E 4 ( 0 , 1 , 1 ) Q + F 1 C 1 P + 2 C 2 R 2 + N 2 C 3
E 5 ( 1 , 0 , 0 ) Q + F 1 C 1 P + 2 C 2 2 R 2 + N 2 C 3
E 6 ( 1 , 0 , 1 ) C 1 + Q + F 1 N 3 + R 1 + R 2 M C 2 2 R 2 + N 2 C 3
E 7 ( 1 , 1 , 0 ) ( Q + F 1 C 1 ) M C 2 2 R 2 + N 2 C 3
E 8 ( 1 , 1 , 1 ) Q + F 1 C 1 M C 2 2 R 2 + N 2 C 3
Disclaimer/Publisher’s Note: The statements, opinions and data contained in all publications are solely those of the individual author(s) and contributor(s) and not of MDPI and/or the editor(s). MDPI and/or the editor(s) disclaim responsibility for any injury to people or property resulting from any ideas, methods, instructions or products referred to in the content.

