Article

Unlocking the Potential of the Circular Economy at Municipal Levels: A Study of Expert Perceptions in the Dammam Metropolitan Area

by
Abdulkarim K. Alhowaish
1,* and
Fatimah S. Alkubur
2
1
Department of Urban and Regional Planning, College of Architecture and Planning, Imam Abdulrahman Bin Faisal University, Dammam 31451, Saudi Arabia
2
Department of Urban and Regional Planning, Imam Abdulrahman Bin Faisal University, Dammam 31441, Saudi Arabia
*
Author to whom correspondence should be addressed.
Sustainability 2025, 17(10), 4323; https://doi.org/10.3390/su17104323
Submission received: 10 April 2025 / Revised: 7 May 2025 / Accepted: 8 May 2025 / Published: 9 May 2025

Abstract

:
The circular economy has emerged as a pivotal strategy for cities to reconcile economic growth with environmental sustainability. However, its implementation in resource-dependent Gulf Cooperation Council contexts remains underexplored. This study is among the first to empirically assess circular economy readiness in a Gulf Cooperation Council industrial hub through a mixed-method approach, bridging the gap between expert perceptions and localized policy implementation. Focusing on the Dammam Metropolitan Area, Saudi Arabia, a critical industrial anchor for Saudi Vision 2030, this study combines a cross-sectional survey of 230 policymakers, industry leaders, and academics with descriptive/inferential statistics (SPSS) and qualitative thematic coding (NVivo). The findings identify renewable energy (mean = 4.10) and municipal waste management (mean = 3.78) as top sectoral priorities, aligning with national sustainability goals. Yet systemic challenges, including fragmented governance, limited public awareness (mean = 3.65), and funding gaps (mean = 3.52), underscore disparities between Vision 2030’s ambitions and localized capacities. Statistical analyses reveal strong associations between institutional fragmentation and financial inefficiencies (χ2 = 23.45, * p = 0.010), while mid-career workforce dominance (54.8%) and underrepresentation of policymakers (6.5%) highlight governance gaps. The current study advocates hybrid strategies: stricter waste regulations (40.0% stakeholder priority), circular economy training programs, and public–private partnerships to scale waste-to-energy infrastructure and industrial symbiosis. Despite pragmatic optimism (48.7% foresee 21–40% recycling by 2030), limitations such as reliance on expert perspectives and exclusion of citizen voices necessitate future interdisciplinary and longitudinal research. By aligning regulatory rigor with inclusive governance, the Dammam Metropolitan Area can model a Gulf-centric circular economy transition, advancing regional sustainability while contributing actionable insights for resource-dependent economies globally.

1. Introduction

The circular economy (CE) has emerged as a transformative paradigm to reconcile economic growth with ecological sustainability, emphasizing resource efficiency, waste minimization, and regenerative practices [1,2]. While global adoption of CE principles has accelerated, their implementation remains uneven, shaped by regional economic structures, cultural norms, and environmental constraints [3,4]. Nowhere is this disparity more pronounced than in the Gulf Cooperation Council (GCC), a region where hydrocarbon wealth, rapid urbanization, and arid climatic conditions create both urgent challenges and unique opportunities for circular transitions [5,6]. This study focuses on Saudi Arabia’s Dammam Metropolitan Area (DMA), a microcosm of the GCC’s complexities, to explore how localized CE strategies can align with national sustainability ambitions while addressing systemic barriers rooted in fossil fuel dependency, subsidy cultures, and institutional fragmentation.
The GCC’s economies, responsible for 25% of global oil exports, are defined by a structural reliance on hydrocarbons, which account for 70–90% of government revenues [7,8]. This dependency sustains linear consumption patterns, where artificially low energy and water prices (Saudi households pay USD 0.03 per kWh for electricity, far below the global average) discourage conservation [7,8,9]. The DMA exemplifies these challenges: generating 1.8 kg of municipal waste per capita daily, with construction and demolition waste constituting 40–50% of total waste streams, yet recycling rates languish at 5–15% [10,11,12]. Compounding this, fragmented governance, split among municipal, regional, and national entities, delays critical infrastructure projects, such as Material Recovery Facilities (MRFs), only 4 of which are operational against a target of 18 [9,10]. These issues are exacerbated by cultural norms of high consumption, where 70% of clothing is discarded within a year and hospitality sectors contribute disproportionately to food waste [11].
Amid these challenges, Saudi Vision 2030 provides a policy anchor, mandating 60% landfill diversion and 50% renewable energy contributions by 2030 [13]. Initiatives like the National Industrial Development and Logistics Program (NIDLP) promote industrial symbiosis, exemplified by Saudi Aramco’s conversion of 1.2 million tons of sulfur byproducts annually into construction materials and fertilizers [14,15]. Similarly, NEOM’s 3D-printed housing projects, utilizing 30% recycled materials [16,17] and Dubai’s waste-to-resource plants, processing 1.8 million tons of municipal waste into fuel, signal incremental progress [18]. However, translating national visions into municipal action remains fraught with gaps in stakeholder alignment, public awareness, and equitable financing [5,7,8].
Globally, CE frameworks prioritize temperate, diversified economies, neglecting the GCC’s arid-climate imperatives and hydrocarbon–industrial legacies [5,19]. For instance, Singapore’s water-centric NEWater model or the EU’s urban mining strategies offer limited relevance to regions where desalination meets 60% of water demand and oil byproducts dominate waste streams [20,21]. Furthermore, the informal waste management sector plays a critical role in recycling systems across GCC countries, where approximately 500,000 informal waste pickers are responsible for processing 50–60% of recyclable materials [22,23]. Despite their significant contributions, these workers remain marginalized in policy frameworks, lacking the institutional recognition and support afforded to Brazil’s catadores cooperatives [24], which have been integrated into national waste management policies through legislative reforms [25,26]. Academic discourse on circular economies often prioritizes Eurocentric models, focusing on formalized, technology-driven systems while neglecting the socio-economic and cultural contexts of informal sectors in the Global South [23,25]. This oversight perpetuates a research gap in developing actionable, context-sensitive strategies that align with the realities of informal waste economies.
This study addresses these gaps through a quantitative analysis of expert perceptions in the DMA, engaging policymakers, industry leaders, and sustainability practitioners. By assessing sectoral priorities, readiness, and barriers, it seeks to (1) provide the first stakeholder-driven CE roadmap for a GCC municipality, (2) align local policies with Saudi Vision 2030’s industrial and environmental targets, and (3) model innovations such as repurposing oil byproducts for cross-sectoral resilience. The findings aim to inform scalable strategies for waste-to-energy infrastructure, formalizing informal recyclers, and leveraging Islamic finance instruments like green sukuk.
Ultimately, this study contributes not only to the DMA’s ecological and economic resilience but also to a broader GCC blueprint, positioning hydrocarbon-dependent economies as laboratories for circular innovation. By bridging global CE principles with Gulf realities, from arid-climate adaptations to cultural stewardship, the current study underscores the transformative potential of localized, inclusive transitions in redefining sustainable development paradigms.

2. Literature Review

This section synthesizes global CE frameworks, examines regional challenges and innovations in the GCC, and identifies the critical gaps that this study addresses.

2.1. Global CE Frameworks: Lessons and Limitations

The global pursuit of the CE has yielded diverse frameworks, each shaped by regional priorities, resource constraints, and governance structures [2,3]. While these models share core principles, resource efficiency, waste reduction, and systemic resilience, their implementation reveals critical lessons and limitations, particularly when applied to contexts like the GCC, where hydrocarbon dependency and arid climates demand tailored strategies [6,7,8,27].
In Europe, the Circular Economy Action Plan (2020) exemplifies regulatory rigor, combining extended producer responsibility (EPR) laws with urban mining initiatives to recover critical materials from electronics and construction waste [21]. Rotterdam’s use of digital material passports to reuse 90% of construction debris and France’s ban on unsold textile destruction highlight the EU’s emphasis on policy integration [21,28]. However, such success relies on strong institutional cohesion, a challenge in fragmented governance systems like India’s, where overlapping mandates among agencies stall waste segregation in New Delhi [29]. East Asia’s CE models prioritize industrial symbiosis, as seen in Japan’s Kawasaki Eco-Town, where steel slag is repurposed into cement, cutting CO2 emissions by 30% [30], and China’s Suzhou Industrial Park, which recycles 90% of textile waste into road materials [31]. Yet these frameworks often marginalize informal sectors, despite their pivotal role in emerging economies [32,33]. North America’s decentralized approach underscores grassroot innovation [34]. San Francisco’s Zero Waste Program diverts 80% of municipal waste through stringent recycling mandates and community engagement [35], while Toronto reuses 75% of demolition materials in new infrastructure [36]. However, without federal policy support, such initiatives struggle to scale. In Latin America and Africa, CE transitions hinge on informal workers, São Paulo’s cooperatives recycle 100% of construction waste [37], and Nairobi’s informal sector handles 60% of recycling [38], yet these systems lack financial safeguards, perpetuating inequality [39,40,41].
Technological advancements, while transformative, face uneven adoption. Blockchain in Rotterdam ensures traceability in recycled steel supply chains [28], and Barcelona’s IoT-enabled smart bins cut collection costs by 30% [42]. Germany’s chemical recycling converts mixed plastics into feedstock with 95% efficiency, but high costs exclude low-income regions [43]. Arid climates, like the GCC’s, struggle with water-intensive processes [44], rendering models such as Singapore’s NEWater (40% wastewater recycling) less transferable without adaptations like solar desalination [20]. Persistent systemic challenges further complicate global CE adoption [1,2,3]. Cultural resistance manifests in Tokyo’s initial food waste recycling failures, requiring gamified apps to incentivize participation [45,46], and in the U.S., where 60% of recyclables end up in landfills due to consumer contamination [47]. Economic inertia, driven by subsidized virgin materials and underpriced environmental externalities, sustains linear models [48]. The UK’s landfill tax (GBP 94.15/ton) has reduced waste [49], but similar policies may falter in subsidy-heavy markets like the GCC, where energy and water prices are artificially low [8,44,50].
A glaring gap in global frameworks is their neglect of resource-dependent economies. Eurocentric models, such as the Ellen MacArthur Foundation’s principles [2], inadequately address regions where oil/gas revenues underpin national budgets [51]. Metrics like recycling rates also fail to capture sector-specific priorities, such as oil sludge valorization or water reuse efficiency in arid zones. The exclusion of informal sectors, despite handling 15–20% of global recycling [22,23], further limits inclusivity, as seen in Nairobi’s marginalized waste pickers [38]. For the GCC, however, these lessons underscore the need for contextualized adaptations. The EU’s landfill taxes [49] and Japan’s industrial symbiosis [46] offer insights but must be reimagined to leverage hydrocarbon infrastructure, such as repurposing sulfur byproducts into construction materials. Similarly, arid-climate innovations, like NEOM’s brine recycling [17], and the integration of Islamic ethics into CE campaigns [7,51,52] demonstrate how global frameworks can be localized. By addressing these gaps, the GCC can pioneer a CE model that bridges planetary sustainability with regional realities, offering a blueprint for resource-dependent economies worldwide.

2.2. The CE in the GCC: Challenges and Emerging Trends

The GCC faces a unique set of challenges in transitioning to the CE, largely due to its reliance on hydrocarbon revenues, rapid urbanization, and extreme climate [7,14]. Hydrocarbon exports account for 70–90% of GCC government budgets, fostering a subsidy-driven culture that discourages resource conservation [53]. Artificially low energy prices, such as Saudi Arabia’s household electricity rate of 0.03 per kWh, compared to the global average of 0.14 per kWh, drive excessive consumption, with per capita water use reaching 200 L daily, double the global average [8,9,10]. Mega-projects like NEOM in Saudi Arabia exacerbate waste generation, with construction debris constituting 40–50% of total waste in cities like Dammam [11,12]. Recycling rates remain stagnant at 5–15%, far below EU benchmarks, highlighting systemic inefficiencies [14,52]. Fragmented governance and cultural norms further impede progress [10]. In Saudi Arabia, overlapping mandates among 13 regional municipalities, the National Waste Management Center, and the Saudi Investment Recycling Company delay critical infrastructure projects, such as MRFs, of which only 4 of 18 are operational [54]. Luxury consumption patterns, including the disposal of 70% of clothing within a year and hospitality sector food waste rates of 30–40%, reflect cultural challenges [9,10]. Public awareness of CE concepts remains low, with only 32% of Saudis familiar with the term, necessitating behavioral interventions aligned with regional values [55]. Despite these barriers, the GCC is pioneering context-specific innovations. Industrial symbiosis in the hydrocarbon sector is central to regional strategies [14]. For instance, Saudi Aramco repurposes 1.2 million tons of sulfur byproducts annually into fertilizers and asphalt, reducing landfill reliance and CO2 emissions by 15% [10,14,56]. Dubai’s Waste-to-Resource Initiative converts 1.8 million tons of municipal waste yearly into refuse-derived fuel (RDF), offsetting 500,000 tons of CO2 [55,56,57].
Technological leapfrogging, such as Abu Dhabi’s AI-powered EcoWaste app [18] and Bahrain’s blockchain-based supply chain tracking [58], enhances recycling efficiency and transparency. NEOM’s 3D-printed housing projects, using 30% recycled materials, aim to reduce construction waste by 60% [17]. Additionally, financial and water management innovations are also critical. Saudi Arabia’s USD 1.5 billion green sukuk (Islamic bonds) funds waste-to-energy plants and solar farms, aligning with Saudi Vision 2030’s goal to divert 60% of waste from landfills by 2030 [7,10]. To address water scarcity, NEOM’s zero-liquid-discharge desalination plants repurpose brine into industrial salts, while treated wastewater irrigates 15% of Saudi farmland, reducing groundwater dependence [44]. Qatar’s World Cup stadiums, built with 30% recycled steel, demonstrate scalable sustainable infrastructure [59]. However, systemic gaps persist. A 65% skills gap in CE technologies, coupled with limited vocational training, hinders adoption [53]. Informal waste pickers, responsible for 50–60% of recyclables, remain marginalized, echoing challenges in Brazil and Kenya [25,38]. The absence of localized metrics, such as GCC Circularity Scorecards, limits accountability. Success requires reconciling subsidy reforms with equitable transitions, formalizing informal sectors, and harmonizing governance, a complex but transformative endeavor for hydrocarbon-dependent economies.

2.3. Bridging Global Insights with Gulf Realities

The GCC faces the complex task of aligning global CE principles with region-specific challenges, including hydrocarbon dependency, arid climates, and socio-cultural dynamics. Unlike Europe or East Asia, where CE models prioritize decarbonization in temperate, diversified economies, the GCC must integrate circularity into its fossil fuel-driven economic backbone [6,60]. For instance, Saudi Aramco’s conversion of 1.2 million tons of sulfur byproducts annually into fertilizers and asphalt exemplifies industrial symbiosis tailored to the hydrocarbon sector, reducing landfill reliance and CO2 emissions by 15% [15]. Similarly, Oman’s Circular Carbon Economy Initiative repurposes captured CO2 for enhanced oil recovery, blending circularity with economic pragmatism [61]. These adaptations demonstrate how the GCC reinterprets global CE frameworks to sustain its hydrocarbon lifeline while advancing resource efficiency.
Arid climates necessitate deviations from water-centric global models [44]. While Singapore’s NEWater recycles 40% of wastewater, the GCC innovates through solutions like NEOM’s zero-liquid-discharge desalination plants, which repurpose brine into industrial salts and use treated wastewater to irrigate 15% of Saudi farmland [16,17]. Such strategies contrast with European urban mining, emphasizing water reuse over universal recycling metrics. Culturally, high disposable incomes and luxury consumption drive overconsumption, with 70% of clothing discarded within a year [7,8]. To address this, Saudi Arabia’s gamified recycling apps, inspired by Tokyo’s behavioral strategies, incentivize waste reduction through retail rewards, while campaigns reframe the CE through Islamic ethics of stewardship [7]. These approaches highlight the GCC’s fusion of global insights with cultural resonance. Moreover, governance fragmentation remains a barrier. Unlike Rotterdam’s centralized CE hubs [28], Saudi Arabia’s waste management responsibilities are split across 13 regional municipalities, the National Waste Management Center (MWAN), and the Saudi Investment Recycling Company (SIRC), delaying projects like MRFs [62]. Only 4 of 18 planned MRFs are operational, underscoring inefficiencies. Cross-border collaborations, such as the GCC Circular Economy Alliance [8], aim to harmonize policies but lag behind EU frameworks. Financially, the region leverages state-backed mechanisms like green sukuk, which raised USD 1.5 billion for Saudi waste-to-energy projects [9], and AI tools like Abu Dhabi’s EcoWaste app, which cut collection costs by 20% [18,50]. These innovations blend Islamic finance with technological agility, diverging from market-driven models.
The integration of informal sectors offers untapped potential. Over 500,000 informal waste pickers handle 50–60% of GCC recyclables but lack formal recognition [22,23,27]. Pilot cooperatives in Riyadh, modeled after Brazil’s catadores, aim to provide fair wages and social protections, bridging equity and efficiency [23,24]. Such initiatives could redefine informal labor’s role in high-income economies, offering global lessons. In summary, the GCC’s CE transition is a contextual reinvention, not a replication of global models. By innovating within hydrocarbon value chains, adapting to arid climates, and aligning circularity with cultural and governance realities, the region crafts a blueprint for resource-dependent economies. While challenges persist, the GCC’s synthesis of global and local insights positions it as a laboratory for circular transitions, with implications beyond the Gulf.

2.4. Research Gaps and Justification for Gulf Focus

The global CE discourse, shaped by temperate, diversified economies like Europe and North America, inadequately addresses the GCC’s unique context of hydrocarbon dependency, arid climates, and fragmented governance. GCC nations, responsible for 25% of global oil exports, rely on fossil fuels for 70–90% of government revenues, perpetuating linear consumption and subsidized energy markets [51,52]. Initiatives like Dubai’s Zero Waste to Landfill 2030 strategy [55], modeled after Singapore [20], struggle due to governance fragmentation, such as Saudi Arabia’s split waste management mandates across 13 regional municipalities and overlapping agencies [54,62]. These structural barriers highlight the need for CE frameworks that reconcile hydrocarbon wealth with climatic extremes, offering lessons for resource-dependent economies globally.
A critical research gap lies in the exclusion of informal sectors and mismatched metrics. Globally, informal waste pickers handle 15–20% of recycling [22,27], yet GCC’s 500,000 informal recyclers lack recognition despite managing 50–60% of waste [38]. Integrating these workers, as seen in Brazil’s catadores cooperatives [24], could boost efficiency and equity, addressing high per capita waste (1.8 kg/day in Saudi Arabia). Furthermore, global metrics like recycling rates fail to prioritize GCC needs, such as water reuse efficiency or oil sludge valorization. NEOM’s zero-liquid-discharge desalination, which repurposes brine into industrial salts, exemplifies region-specific innovations overlooked by standardized indicators [16,17]. Tailored metrics, such as GCC Circularity Scorecards, could align priorities with Sharia-compliant financing tools like green sukuk, which hold USD 30 billion in annual potential [8,10]. Additionally, the interplay between the CE and climate resilience in hyper-arid regions remains underexplored. Circular water management, such as using treated wastewater for desert agriculture, could reduce reliance on energy-intensive desalination, which supplies 60% of Saudi Arabia’s water [44,54]. Similarly, repurposing materials for green infrastructure could mitigate urban heat islands in cities like Dammam, where temperatures exceed 50 °C. Such synergies are critical for climate adaptation but lack systemic research, particularly in quantifying their impact on reducing emissions or enhancing resource security.
Finally, governance fragmentation and global implications justify Gulf-focused research. Centralized models, as in Amsterdam, contrast with the GCC’s layered mandates, delaying projects like Saudi Arabia’s 18 planned MRFs, of which only 4 are operational [22,61]. Addressing these gaps could position the GCC as a testbed for scalable solutions, such as sulfur-based asphalt or blockchain-tracked supply chains, with planetary significance. By formalizing informal sectors, reforming subsidies, and developing arid-climate metrics, the GCC could redefine CE paradigms, transforming from a hydrocarbon-dependent region into a model of innovation and equity.

3. Materials and Methods
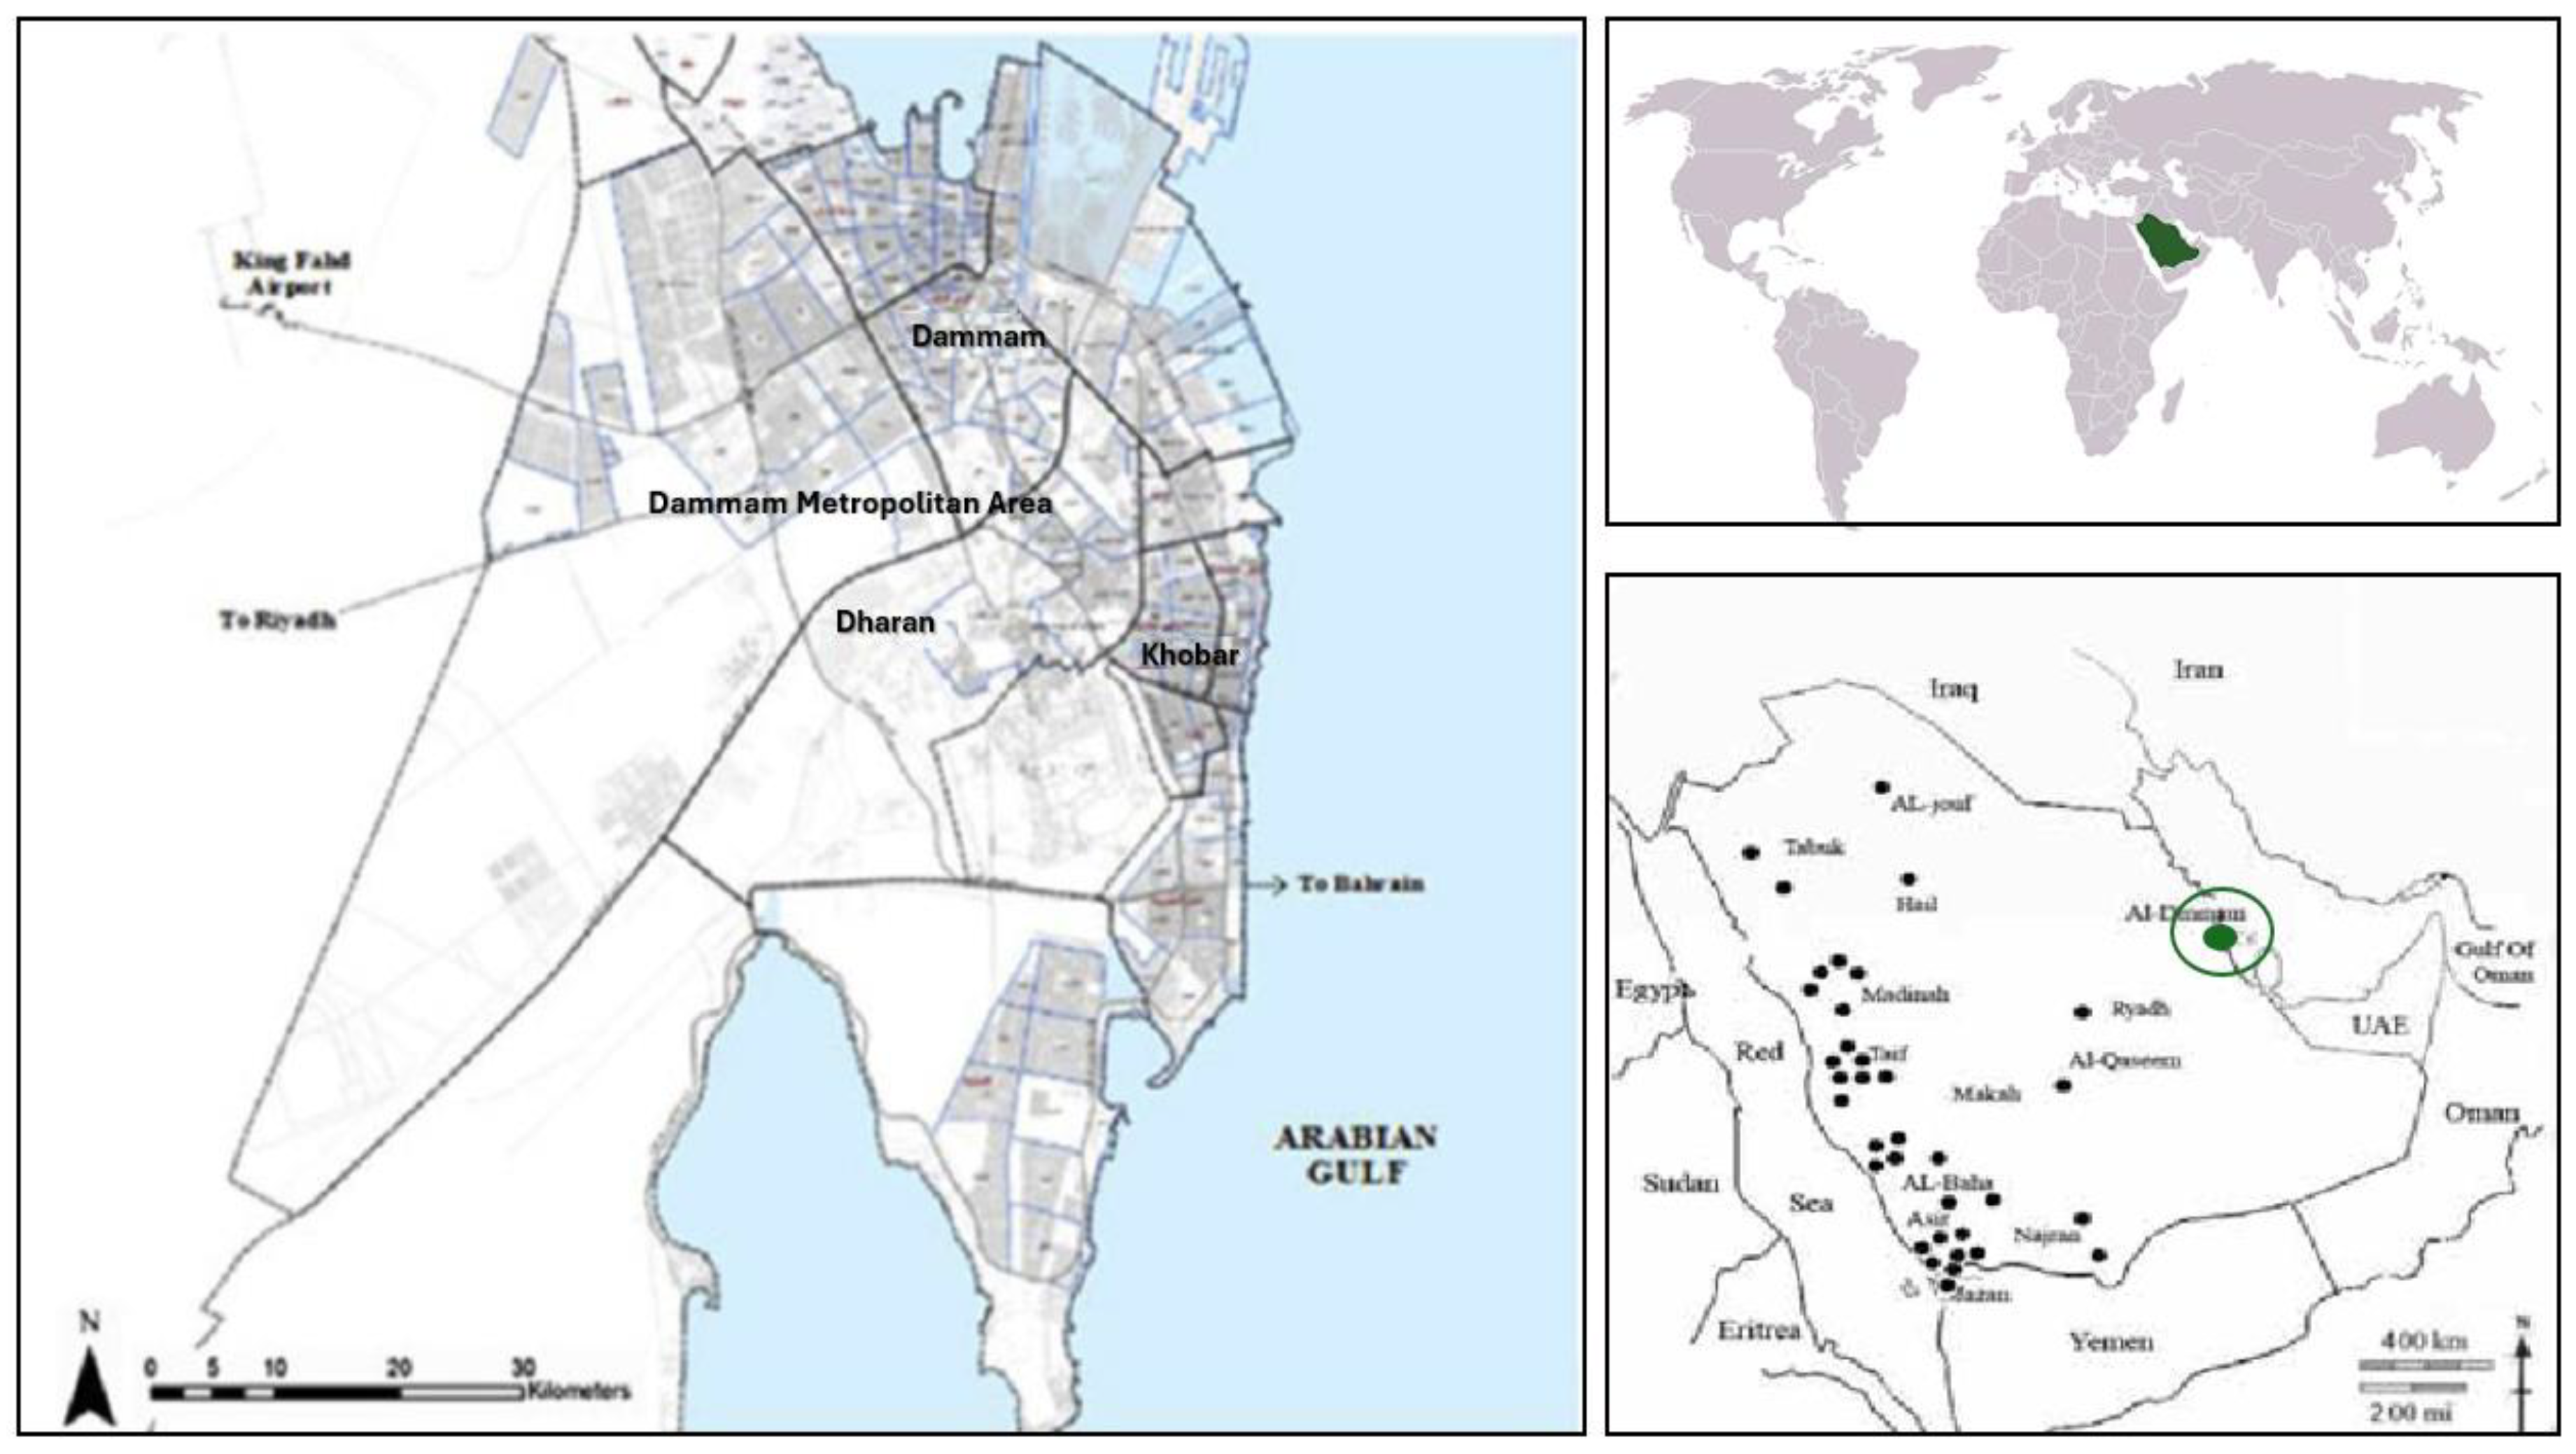
3.1. Study Settings

The present study investigated expert perceptions to unlock the potential of the DMA as a circular metropolitan city. Located in Saudi Arabia’s Eastern Province along the Arabian Gulf and 380 km from Riyadh, the national capital (Figure 1), the DMA evolved from a small fishing village to a major industrial and economic hub following the discovery of oil reserves in 1938 [63]. Today, it serves as a center for oil, natural gas, construction, and logistics industries, spanning approximately 800 km2 with a population of 1.279 million [64] and a per capita GDP of USD 23,352 [65]. As a hub of industrial activity, the DMA faces pressing challenges, including high municipal waste generation (1.8 kg per capita daily), fossil fuel dependency, and fragmented governance structures [11], exacerbated by rapid urbanization and population growth. Aligned with Saudi Vision 2030’s sustainability pillar, which mandates diverting 60% of municipal waste from landfills and increasing renewable energy contributions to 50% by 2030 [12], the DMA exemplifies both the urgency and potential for CE transitions to reconcile economic diversification with environmental resilience. The metropolis’s rapid transformation into a seaport and industrial anchor underscores its strategic importance, driving this study’s focus on advancing sustainable urban transitions through expert insights.

3.2. Data Collection and Analysis

This study adopted a mixed-method approach to evaluate CE readiness in the DMA, aligning with Saudi Vision 2030’s sustainability objectives. A cross-sectional survey design captured insights from 230 experts across three stakeholder groups: municipal policymakers, industry leaders, and academics/NGOs [66,67]. Participants were selected through purposive sampling, prioritizing professionals with ≥5 years of CE-related expertise, and the sample size was determined using Cochran’s formula (95% confidence level, 5% margin of error). Achieving an 87% response rate, consistent with GCC benchmarks [5,6,22,50,51], the survey ensured representation of key sectors, including construction, oil/gas, and waste management.
The structured questionnaire, distributed online via QuestionPro vX.X over eight weeks (January–March 2025), was developed through a literature review of validated CE metrics [1,2,3,19,21,29,31,38] and pilot-tested for reliability (Cronbach’s α = 0.82). It comprised four sections: demographic data, readiness assessments (5-point Likert scales), sectoral opportunity rankings, and open-ended queries on barriers. Descriptive statistics (means, frequencies) and inferential tests, including one-way ANOVA to compare mean readiness scores across stakeholder groups and chi-square tests to identify associations between categorical variables like sectoral priorities and funding barriers, were conducted using SPSS v28 [4,68]. Principal Component Analysis (PCA) was also used to further reduce multidimensional variables into latent constructs with adequacy confirmed by a Kaiser–Meyer–Olkin and Bartlett’s test [69,70]. Qualitative insights were derived through thematic coding of open-ended responses using NVivo 12, identifying recurring challenges such as fragmented governance and cultural resistance [71,72]. These findings were triangulated with quantitative results to ensure robustness. Ethical protocols, including anonymized responses, digital informed consent, and approval from Imam Abdulrahman Bin Faisal University’s Review Board (IRB-2025-06-0176), safeguarded participant confidentiality and data integrity.
By integrating PCA-validated constructs, inferential statistics, and qualitative themes, the methodology provided a holistic understanding of CE readiness. This approach not only highlighted systemic barriers (e.g., funding gaps, technical capacity) but also prioritized actionable strategies, such as waste-to-energy infrastructure and public–private partnerships, positioning the DMA as a model for Gulf-centric CE transitions. Full survey variables, aligned with CE frameworks, are cataloged in Appendix A, ensuring transparency and reproducibility.

4. Results

4.1. Demographic Profile of Respondents

The demographic profile of the 230 respondents highlights a diverse yet sectorally skewed representation, reflective of the DMA’s industrial and institutional landscape (Table 1). The participants were predominantly drawn from the oil and gas (24.3%) and construction/real estate (19.1%) sectors, aligning with the DMA’s economic focus on resource-intensive industries, as noted in studies linking urban CE transitions to regional industrial priorities [73,74,75,76]. Conversely, NGO/non-profit representation was limited (8.3%), underscoring gaps in civil society engagement, a common challenge in GCC municipalities, where top–down governance often dominates sustainability agendas [5,61]. Experience levels further revealed a mid-career dominance: 54.8% had 5–10 years of experience, suggesting a workforce adaptable to emerging CE paradigms but potentially lacking long-term institutional memory. This aligns with the literature emphasizing mid-career professionals as pivotal drivers of sustainability transitions, blending operational knowledge with openness to innovation [5,50,77]. However, the underrepresentation of policymakers/regulators (6.5%) contrasts sharply with their critical role in CE implementation, echoing critiques of weak institutional engagement in circularity research [75,76].
The statistical analyses underscored significant sectoral dynamics. One-way ANOVA revealed disparities in experience across sectors (F = 3.45, p = 0.002), with the oil and gas and construction sectors attracting more seasoned professionals (34.3% with 11–20 years). This may reflect entrenched industrial practices resistant to CE shifts, consistent with the literature on “economic lock-in” in resource-dependent economies [76,77]. The chi-square test further confirmed a strong association between sector and role (χ2 = 89.76, p < 0.001), with technical experts/engineers (27.0%) clustered in industrial sectors and academic researchers (36.1%) dominating academia. Such silos risk fragmenting CE efforts, as technical and academic insights may not translate into actionable policy without cross-sector collaboration. These findings emphasize the need for inclusive governance models that bridge sectoral divides, ensuring a balanced representation of policymakers, industry, and civil society to holistically address the DMA’s CE challenges [78,79].

4.2. Current Readiness for CE Adoption in the DMA

This sub-section examines the DMA’s CE readiness through three interrelated dimensions: (1) stakeholder perceptions of institutional preparedness, (2) evaluations of municipal waste management effectiveness, and (3) estimates of current recycling rates. These dimensions align with frameworks in the CE literature which emphasize governance, infrastructure, and data transparency as critical pillars for systemic change [1,2,3,77].
Stakeholder perceptions of the DMA’s readiness for CE adoption reveal cautious optimism tempered by systemic challenges. As shown in Table 2, only 3.0% of respondents rated the region as “mostly prepared”, while a combined 72.6% fell into the “slightly prepared” (38.3%) and “moderately prepared” (34.3%) categories, yielding a low mean preparedness score of 2.64 (SD = 0.97). This aligns with studies on GCC municipalities, where fragmented governance and reliance on linear industrial models hinder progress [75,76]. For instance, similar institutional inertia has delayed waste management reforms in Dubai, despite ambitious national targets [5,50]. The dominance of mid-tier preparedness scores underscores the gap between Saudi Vision 2030’s aspirations and localized capacity gaps, a recurring theme in rapidly urbanizing regions [3,4].
The effectiveness of the DMA’s waste management systems received mixed evaluations, with 24.8% of stakeholders rating them as “ineffective” and 50.0% remaining neutral (mean = 2.95, SD = 0.84). These findings mirror critiques of disposal-centric systems in emerging economies, where underdeveloped recycling infrastructure and low public engagement stall progress [35,80,81]. The chi-square test confirmed a strong association between preparedness and waste management effectiveness (χ2 = 67.8, p < 0.001), suggesting that institutional reforms could enhance operational outcomes. However, recycling rates further complicate the picture: 40.0% of respondents estimated that 21–30% of municipal waste is recycled, while 11.3% admitted uncertainty (“don’t know”). This ambiguity reflects data transparency issues, a barrier well documented in the CE literature [73,76,77]. Improving waste tracking and community education for the DMA could align stakeholder perceptions with measurable progress.
Statistical analyses highlight the interconnected nature of CE readiness variables. While one-way ANOVA found no significant difference in preparedness across recycling rates (F = 2.34, p = 0.057), the strong link between preparedness and waste management effectiveness (χ2 = 67.8, p < 0.001) underscores the role of governance in driving tangible outcomes. This aligns with global frameworks emphasizing that CE transitions require not only technical upgrades but also institutional collaboration and policy coherence [19,78]. For the DMA, addressing gaps in recycling infrastructure (e.g., scaling waste-to-energy plants) and fostering multi-stakeholder partnerships could bridge the divide between moderate preparedness scores and Vision 2030’s targets.

4.3. CE Priorities and Opportunities in the DMA

The successful transition to the CE in the DMA hinges on the strategic prioritization of sectors and interventions that align with regional industrial dynamics and sustainability imperatives [74]. Building on earlier analyses of institutional preparedness and systemic challenges, this sub-section examines stakeholder-identified priorities across critical industries, such as construction, oil and gas, and water management, and evaluates high-impact CE strategies, including industrial symbiosis, waste-to-energy systems, and public engagement initiatives.
As shown in Table 3, stakeholders identified renewable energy (mean = 4.10 ± 0.65) and municipal waste management (mean = 3.78 ± 0.76) as the most critical sectors for advancing CE adoption in the DMA. Renewable energy’s top ranking aligns with Saudi Vision 2030’s emphasis on diversifying energy sources and reducing fossil fuel dependency, mirroring global trends where cities prioritize decarbonization through solar and wind integration [73,74,78]. Municipal waste management’s high importance (45% rated it “very important”) reflects the DMA’s urgent need to address its 1.8 kg/day per capita waste generation, a challenge exacerbated by an underdeveloped recycling infrastructure, a common barrier in Gulf cities [5,9]. Conversely, oil and gas scored lowest (mean = 3.12 ± 1.02), signaling skepticism about integrating the CE into a sector entrenched in linear extraction models, consistent with the literature on industrial lock-ins [19]. One-way ANOVA confirmed significant differences in sectoral importance ratings (F = 18.74, p = 0.001), underscoring the need for targeted sector-specific strategies.
Waste-to-energy plants (mean = 3.80 ± 0.85) and municipal recycling programs (mean = 3.55 ± 0.95) emerged as the most impactful CE strategies, reflecting the DMA’s focus on waste valorization and systemic efficiency. Waste-to-energy’s prominence aligns with GCC initiatives such as Dubai’s refuse-derived fuel projects, which convert waste into energy while reducing landfill reliance [50,57]. However, industrial symbiosis (mean = 3.20 ± 1.10) and public awareness campaigns (mean = 3.25 ± 1.05) ranked lower, suggesting that stakeholders perceive challenges in cross-sector collaboration and community engagement, a gap noted in regions where top–down governance dominates [76,77]. The one-way ANOVA revealed significant differences in strategy impact ratings (F = 12.53, p = 0.001), highlighting the need to balance technical solutions with social and institutional innovations.
Chi-square analyses revealed strong associations between sectors and strategies, offering actionable insights for policy design. For instance, municipal waste showed significant linkages with waste-to-energy plants (χ2 = 38.20, p = 0.005) and municipal recycling programs (χ2 = 58.75, p < 0.001), underscoring the potential for integrated waste management systems. Similarly, renewable energy correlated strongly with industrial symbiosis (χ2 = 40.25, p < 0.001), suggesting opportunities to repurpose industrial byproducts for energy generation. However, weaker associations for public awareness campaigns across sectors (p > 0.05 for oil/gas and water management) indicate undervalued social dimensions of CE transitions. These findings align with frameworks advocating hybrid approaches, combining regulatory mandates, technological investments, and community engagement to overcome sectoral silos [3,4,6,80]. For the DMA, prioritizing synergies such as waste-to-energy and industrial symbiosis could accelerate progress toward Vision 2030’s targets while addressing the systemic barriers.

4.4. Barriers to CE Adoption in the DMA

The adoption of CE principles in the DMA faces multifaceted challenges rooted in systemic and institutional inefficiencies, as evidenced by stakeholder perspectives on two critical dimensions: the perceived significance of implementation barriers and the identification of institutional bottlenecks. Implementing circular economic principles in the DMA faces significant structural and institutional challenges, as highlighted by stakeholder responses.
As shown in Table 4, stakeholders identified limited public awareness (mean = 3.65 ± 0.82) and a lack of funding (mean = 3.52 ± 0.89) as the most significant barriers to CE adoption in the DMA. Over 40% of respondents rated public awareness as “very” or “extremely” significant, reflecting gaps in community engagement and education, which is a critical challenge noted in Gulf cities, where top–down policies often neglect grassroot participation [5,8,77]. Funding shortages, cited as “moderately significant” by 45% of stakeholders, align with the global CE literature emphasizing financial constraints as a pervasive obstacle, particularly in regions transitioning from linear economic models [5]. These barriers are compounded by technical capacity gaps (mean = 3.40 ± 0.98), underscoring the need for workforce training and technological investments to operationalize CE strategies. One-way ANOVA confirmed significant differences in barrier perceptions across sectors (F = 18.74, p = 0.001), suggesting that sector-specific interventions are critical. For instance, while the oil/gas sector may prioritize funding for R&D, municipal governance requires public awareness campaigns to drive behavioral change.
Institutional inefficiencies emerged as a central hurdle, with a lack of coordination between sectors (33.91%) and short-term political priorities (28.26%) dominating stakeholder concerns. These findings mirror critiques of GCC governance structures, where siloed decision making and electoral cycles prioritize immediate economic gains over long-term sustainability [44]. For example, the DMA’s reliance on oil revenues may disincentivize investments in waste-to-energy infrastructure, perpetuating linear practices despite Vision 2030’s mandates. Fragmented governance (22.61%) and inadequate monitoring systems (15.22%) further exacerbate inefficiencies, limiting accountability in CE policy implementation. Such institutional inertia aligns with studies highlighting the need for centralized frameworks, such as MWAN, to streamline cross-sector collaboration [7,54].
Chi-square analyses revealed critical linkages between barriers, emphasizing their systemic nature. The strong association between lack of funding and fragmented governance (χ2 = 23.45, p = 0.010) suggests that financial constraints are exacerbated by disjointed institutional oversight. Similarly, limited public awareness correlated with a lack of coordination (χ2 = 22.30, p = 0.008), indicating that poor stakeholder alignment stifles community engagement. These interdependencies align with frameworks advocating integrated approaches to CE transitions, where policy coherence, funding mechanisms, and participatory governance must align [19,78]. For the DMA, addressing these interconnected barriers requires leveraging public–private partnerships to bridge funding gaps, coupled with centralized monitoring systems to enhance transparency and coordination.

4.5. Policy and Investment Recommendations

The transition to the CE in the DMA demands targeted policy interventions and strategic investments to align with Saudi Vision 2030’s sustainability objectives, particularly its 60% waste diversion target by 2030. Drawing on stakeholder insights, this sub-section evaluates prioritized policy measures and assesses the feasibility of achieving these goals, contextualizing the findings within global CE frameworks.
As shown in Table 5, stakeholders emphasized stricter waste management regulations (40.0%) and CE training programs for municipal staff (36.5%) as top policy priorities to advance the DMA’s CE agenda. The focus on regulatory enforcement aligns with global CE frameworks, such as the EU’s Circular Economy Action Plan [5], which mandates EPR to reduce landfill reliance. Training programs address the DMA’s technical capacity gaps, a barrier highlighted in prior analyses by equipping municipal teams with CE-specific expertise, a strategy critical for effective policy execution [73,74,75]. Conversely, tax incentives for circular businesses (33.9%) and subsidies for recycling infrastructure (25.7%) ranked lower, suggesting that stakeholders prioritize compliance over fiscal tools. This contrasts with blended approaches in cities such as Amsterdam, where subsidies and regulations jointly drive recycling rates above 60% [40,41], underscoring the need for the DMA to adopt hybrid strategies.
While 36.9% of respondents believe the DMA is “likely” to achieve its 60% waste diversion target by 2030, only 9.1% rate it as “very likely”, reflecting cautious optimism amid systemic challenges. The mean confidence score of 3.45 (SD = 1.12) mirrors global patterns, where institutional readiness lags behind ambitious CE goals [53]. For instance, San Francisco’s 80% diversion rate was achieved through stringent policies, robust public–private partnerships (PPPs), and community engagement, measures that the DMA stakeholders prioritize but have yet to fully implement [35]. The significant association between tax incentives and optimism (χ2 = 27.35, p = 0.006) suggests that fiscal tools could enhance confidence, while the lack of linkage for PPPs (χ2 = 12.45, p = 0.150) signals untapped potential in collaborative governance models.
Chi-square analyses revealed that CE training programs strongly correlate with positive outlooks (χ2 = 19.80, p = 0.020), emphasizing the role of capacity-building in bridging policy gaps. However, the weaker emphasis on PPPs (28.3% prioritization) contrasts with the literature advocating multi-stakeholder collaboration to scale CE infrastructure [74]. For example, Rotterdam’s Circularity Center leverages PPPs to fund waste-to-energy plants and industrial symbiosis networks, demonstrating their transformative potential [28,49]. The DMA’s moderate confidence scores and fragmented policy focus highlight the need for integrated strategies that combine regulatory rigor, fiscal incentives, and institutional training. By aligning these elements, the DMA can transform cautious optimism into measurable progress, advancing Saudi Vision 2030 while contributing to regional sustainability leadership.

4.6. Final Insights

The culmination of stakeholder perspectives on the DMA’s CE trajectory reveals cautious optimism tempered by pragmatic realism. As illustrated in Table 6, the majority of stakeholders (48.7%) believe that the DMA can achieve a 21–40% municipal recycling rate by 2030, with only 12.2% envisioning rates exceeding 60%. This pragmatic outlook reflects systemic barriers such as underdeveloped infrastructure and fragmented governance, as well as challenges well documented in Gulf cities transitioning to circular economy models [5,6,77]. The clustering around moderate targets aligns with global studies where ambitious CE goals outpace institutional readiness, particularly in resource-dependent economies [14,27,55]. For instance, Dubai’s struggle to scale recycling beyond 20% despite federal mandates underscores the need for the DMA to prioritize waste-to-resource innovations and stakeholder collaboration [5,50]. The 29.6% optimism for 41–60% recycling signals cautious faith in policy interventions such as stricter regulations and PPPs, although gaps in technical capacity and data transparency (evidenced by 9.6% predicting ≤ 20%) demand urgent attention.
Despite modest recycling targets, 58.7% of stakeholders agree or strongly agree that the DMA can emerge as a regional CE leader (mean = 3.72 ± 0.89). This optimism aligns with Saudi Vision 2030’s emphasis on sustainability and the DMA’s strategic industrial position, mirroring Rotterdam’s rise as a CE hub through port–industry symbiosis [53,76]. However, 28.3% remain neutral, reflecting concerns over unresolved barriers such as short-term political priorities and funding gaps [73,78]. The significant chi-square association between higher recycling rate optimism and leadership confidence (χ2 = 29.45, p = 0.021) suggests that visible progress in waste management could catalyze broader regional influence. For example, Amsterdam’s leadership in circular construction was bolstered by achieving 50% recycling rates, demonstrating the interplay between tangible outcomes and stakeholder trust [76].
One-way ANOVA confirmed significant differences in leadership confidence across recycling rate categories (F = 4.25, p = 0.006), indicating that stakeholders with higher recycling expectations are more likely to endorse the DMA’s leadership potential. This underscores the need for data-driven transparency and policy coherence to align perceptions with progress. The linkage between technical milestones (e.g., recycling rates) and institutional credibility resonates with frameworks advocating holistic CE transitions, where governance, infrastructure, and community engagement must synergize [1,3]. For the DMA, leveraging PPPs to scale recycling infrastructure and fostering cross-sector collaboration could bridge the gap between current preparedness and Vision 2030’s aspirations, positioning the region as a Gulf sustainability exemplar.

4.7. Principal Component Analysis (PCA) Findings and Policy Implications

The PCA results reveal critical insights into stakeholder perceptions of CE readiness and barriers in DMA.
First, institutional and operational capacity emerged as a dominant theme, with Component 1 (56.0% variance) combining preparedness for CE adoption (0.82) and waste management effectiveness (0.77). This highlights stakeholders’ emphasis on governance frameworks and operational systems. However, Component 2 (32.0% variance) exposed a tension between preparedness and action, with preparedness negatively correlated (−0.53) and effectiveness positively linked (0.61), suggesting that institutional readiness does not guarantee tangible outcomes.
Second, sectoral priorities diverged into waste management focus (Component 1: 28.5% variance) and sustainability outreach (Component 2: 17.4%). Municipal waste importance (0.81) and waste-to-energy strategies (0.78) dominated the former, while renewable energy (0.89) and public awareness campaigns (0.84) defined the latter. This split underscores the need for dual-track policies: scaling waste infrastructure while pairing renewables with community engagement.
Finally, structural barriers and policy alignment were critical. Component 1 (48.2% variance) linked funding gaps (0.82), regulatory inefficiencies (0.78), and technical capacity shortages (0.74), reflecting systemic challenges. Component 2 (27.4%) isolated public awareness (0.88) as a standalone driver, emphasizing grassroot engagement. Policy measures also split into regulatory incentives (stricter regulations: 0.76; subsidies: 0.68) and collaborative confidence (PPPs: 0.62; target likelihood: 0.84), illustrating the interplay between top–down mandates and partnership-driven optimism (Table 7).
To validate the suitability of the data for PCA, the Kaiser–Meyer–Olkin (KMO) measure of sampling adequacy and Bartlett’s test of sphericity were applied to each variable set (Table 8). The KMO values ranged from 0.54 to 0.72, falling within the middle to acceptable range for sampling adequacy [69], with Barriers demonstrating the highest adequacy (KMO = 0.72), reflecting strong intercorrelations among funding, regulatory, and technical barriers. Bartlett’s test results further confirmed the data’s fitness for PCA [70], with statistically significant * p-values (<0.001) across all variable sets, indicating sufficient correlations among variables. Notably, PPPs and target likelihood showed a borderline KMO value (0.54), which remains acceptable for exploratory analysis but warrants cautious interpretation. These results collectively affirm that the data meet the assumptions for factor analysis, though varying KMO scores highlight differences in intervariable coherence across themes.
The findings carry distinct policy implications. For instance, the moderate KMO value for preparedness for CE adoption and waste management effectiveness (0.68) underscores the need to pair quantitative insights with qualitative methods to address gaps in institutional readiness and recycling outcomes. Conversely, the high adequacy of Barriers (KMO = 0.72) validates the centrality of systemic barriers, funding, regulations, and technical challenges, as critical levers for CE transitions. While PPPs and target likelihood’s borderline KMO (0.54) suggests weaker intercorrelations, its inclusion remains justified for exploratory purposes. Together, these results guide policymakers toward prioritizing robust systemic interventions for Barriers while adopting mixed-method approaches for moderately correlated themes like preparedness for CE adoption and waste management effectiveness, ensuring holistic strategies for CE advancement.
To synthesize this study’s outcomes, the findings are consolidated into a conceptual framework (Figure 2) which systematically maps the research trajectory. At the entrance, the framework outlines the variables examined, including institutional readiness, systemic barriers, and recycling outcomes. The analytical phase details the methodologies employed, notably PCA, supported by KMO measures and Bartlett’s tests, to distill complex datasets into interpretable patterns. At the exit, the framework highlights key relationships identified, such as the critical role of systemic barriers (e.g., funding, regulations) in CE transitions and the need for mixed-method approaches in areas with moderate variable coherence. While this study’s extensive calculation tables provide rigorous empirical grounding, the conceptual framework addresses the challenge of interpretability, clarifying how analytical outputs translate into actionable insights. This structured visualization bridges granular data analysis with overarching thematic conclusions, offering a cohesive narrative that enhances the accessibility and policy relevance of the findings.

5. Conclusions and Discussion

This study empirically assessed the readiness of the DMA to transition to the CE under Saudi Vision 2030, leveraging insights from 230 experts across policymaking, industry, and academia. The key findings reveal that renewable energy (mean = 4.10) and municipal waste management (mean = 3.78) are prioritized as critical sectors for CE implementation, aligning with national goals to reduce fossil fuel dependency and achieve 60% landfill diversion by 2030. However, systemic barriers, such as fragmented governance, limited public awareness (mean = 3.65), funding gaps (mean = 3.52), and technical capacity shortages, underscore disparities between Vision 2030’s ambitions and localized capacities. Mid-career professionals (54.8%) dominate the workforce, signaling adaptability to CE transitions but also highlighting governance gaps due to the underrepresentation of policymakers (6.5%). Stakeholders advocate hybrid strategies, including stricter waste regulations (40.0%), CE training programs, and PPPs, to scale waste-to-energy infrastructure and industrial symbiosis. Pragmatic optimism persists, with 48.7% foreseeing 21–40% recycling rates by 2030, though institutional inertia and data transparency issues temper expectations.
This study diverges from prior research by contextualizing CE transitions within the GCC’s unique challenges: hydrocarbon dependency, arid climates, and socio-cultural dynamics [5,76,77]. Unlike Eurocentric models emphasizing decarbonization in diversified economies, the DMA’s CE strategy integrates industrial symbiosis within fossil fuel value chains (e.g., repurposing sulfur byproducts) and prioritizes water reuse innovations (e.g., NEOM’s brine recycling). While global frameworks often marginalize informal sectors, this study highlights the GCC’s 500,000 informal waste pickers, responsible for 50–60% of recycling, as untapped assets, advocating their formalization through cooperatives akin to Brazil’s catadores [23,24]. Additionally, the use of Islamic finance tools like green sukuk (e.g., Saudi Arabia’s USD 1.5 billion issuance) offers a region-specific mechanism to fund CE infrastructure, contrasting with market-driven models in the Global North [53,82,83]. Compared to studies in temperate regions (e.g., EU urban mining or Singapore’s NEWater), this study underscores the need for arid-climate adaptations and metrics (e.g., GCC Circularity Scorecards) to evaluate water reuse efficiency and oil sludge valorization. Governance fragmentation, a persistent GCC challenge, further distinguishes this study; centralized models (e.g., Rotterdam’s CE hubs) contrast with the DMA’s layered mandates across 13 municipalities, delaying critical projects like MRFs.
To advance the DMA’s circular economy transition, policymakers should prioritize a multifaceted strategy anchored in regulatory rigor, institutional capacity, and inclusive governance. Stricter waste management regulations, including EPR laws, must be enforced to align with global frameworks like the EU’s Circular Economy Action Plan, while targeted CE training programs for municipal staff can bridge technical gaps and enhance operational readiness [28,29]. PPPs should be scaled to fund waste-to-energy infrastructure and industrial symbiosis networks, drawing lessons from Dubai’s refuse-derived fuel projects. Simultaneously, the formalization of informal waste pickers, modeled after Brazil’s catadores cooperatives [23,24], is critical to integrate their contributions into policy frameworks, ensuring equitable wages and social protections. Financial innovation, such as expanding green sukuk (Islamic bonds), can mobilize capital for CE projects, aligning with Saudi Vision 2030’s sustainability objectives [82]. Finally, governance fragmentation must be addressed through centralized oversight bodies (e.g., MWAN) to harmonize mandates across 13 regional municipalities, streamline MRF implementation, and foster cross-sector collaboration. These measures collectively balance regulatory enforcement, technological investment, and social equity, positioning the DMA as a Gulf-centric model for resource-dependent economies.

6. Limitations and Future Research

6.1. Limitations

This study is subject to several limitations, including its reliance on expert perceptions, which may introduce institutional biases by excluding citizen perspectives and informal sector insights, despite their critical role in waste management. The cross-sectional design offers a temporal snapshot of CE readiness but lacks longitudinal depth to assess evolving stakeholder attitudes or policy impacts over time. The findings are contextually bound to the DMA, limiting their generalizability to other Gulf cities with distinct industrial and governance profiles. Furthermore, while informal waste pickers’ contributions are acknowledged, the absence of quantitative data on their socio-economic conditions or recycling efficiency restricts actionable insights into integrating this marginalized workforce. Additionally, the recycling rate variable reflects expert estimates rather than audited municipal data; while these perceptions align with the study’s focus on stakeholder awareness and operational challenges, they may not capture ground realities due to limited access to official metrics. Future studies should triangulate such perceptual data with empirical sources, such as municipal waste audits or IoT-enabled tracking systems, to enhance accuracy. These constraints underscore the need for complementary methodologies and broader contextual analyses in future research.

6.2. Future Research Directions

Future research should prioritize interdisciplinary approaches that combine technical, behavioral, and cultural analyses to explore drivers of CE adoption, such as gamified recycling incentives or Islamic ethics of stewardship, while expanding longitudinal studies to track policy impacts and stakeholder alignment with Vision 2030’s 2030 and 2050 milestones. Citizen engagement must be incorporated through household surveys to assess public participation and awareness gaps, complemented by targeted investigations into formalizing informal waste pickers, quantifying their socio-economic impact through pilot cooperatives. Region-specific metrics, such as GCC Circularity Scorecards, should be developed to evaluate arid-climate priorities like water reuse efficiency or oil byproduct valorization, moving beyond universal recycling benchmarks. Additionally, integrating IoT-enabled waste tracking systems and municipal audits could validate perceptual data on recycling rates, addressing discrepancies between expert estimates and empirical realities. Collectively, these efforts would refine CE frameworks for resource-dependent economies, ensuring equitable and context-sensitive transitions.

Author Contributions

Conceptualization, A.K.A.; methodology, A.K.A. and F.S.A.; formal analysis, A.K.A.; investigation, A.K.A. and F.S.A.; resources, A.K.A. and F.S.A.; data curation, A.K.A. and F.S.A.; writing—original draft preparation, A.K.A.; writing—review and editing, F.S.A.; visualization, F.S.A.; funding acquisition, A.K.A. and F.S.A. All authors have read and agreed to the published version of the manuscript.

Funding

This research received no external funding.

Institutional Review Board Statement

Imam Abdulrahman Bin Faisal University’s Review Board (IRB-2025-06-0176).

Informed Consent Statement

Not applicable.

Data Availability Statement

The data presented in this study are available upon request from the authors.

Acknowledgments

The authors greatly acknowledge the support of Imam Abdulrahman Bin Faisal University, Dammam, Saudi Arabia.

Conflicts of Interest

The authors declare no conflicts of interest.

Appendix A

Variables from the Questionnaire Survey with citations to the sources in the literature.
SectionRationalCitation
1: Demographics
Q1. Sector of Work Categorizing stakeholders by sector aligns with CE stakeholder frameworks[1]
Q2. Years of Experience Expertise duration is a standard demographic metric in policy surveys[5,32]
Q3. Primary Role Role categorization follows CE governance studies[3]
2: Current Readiness for CE Adoption
Q4. CE PreparednessReadiness scales are adapted from municipal CE maturity assessments[21,28,31]
Q5. Waste Management Effectiveness Waste system evaluation aligns with World Bank urban waste metrics[29,31,42]
Q6. Current Recycling Rate Recycling metrics derive from EU Circular Economy Monitoring Framework[21]
3: CE Priorities and Opportunities
Q7. Sector Importance Ratings Sector prioritization draws from material flow analysis in CE[5,19]
Q8. CE Strategy Ranking Strategy impact ranking informed by the “ReSOLVE” CE framework[2,3]
4: Barriers to CE Adoption
Q9. Barrier Significance Ratings Barriers identified in global CE transition studies[80]
Q10. Critical Institutional Barrier Institutional barriers align with governance fragmentation literature[52,76]
5: Policy and Investment Recommendations
Q11. Policy Priority Selection Policy measures reflect OECD recommendations for CE transitions[19,21]
Q12. Vision 2030 Likelihood Saudi Vision 2030’s waste targets are grounded in national policy documents[10,13]
6: Final Insights
Q13. Achievable Recycling Increase Recycling projections based on EU Circular Economy Action Plan benchmarks[21]
Q14. Regional Leadership Potential Leadership potential aligns with city-level CE case studies[75,77]

References

  1. Kirchherr, J.; Reike, D.; Hekkert, M. Conceptualizing the circular economy: An analysis of 114 definitions. Resour. Conserv. Recycl. 2018, 127, 221–232. [Google Scholar] [CrossRef]
  2. Ellen MacArthur Foundation. Towards a Circular Economy: Business Rationale for an Accelerated Transition; Ellen MacArthur Foundation: Wight, UK, 2015; Available online: https://www.ellenmacarthurfoundation.org (accessed on 5 January 2025).
  3. Ghisellini, P.; Cialani, C.; Ulgiati, S. A review on circular economy: The expected transition to a balanced interplay of environmental and economic systems. J. Clean. Prod. 2016, 114, 11–32. [Google Scholar] [CrossRef]
  4. Williams, J. Circular cities: Strategies for governing urban resource efficiency. Urban Stud. 2019, 56, 2746–2762. [Google Scholar] [CrossRef]
  5. Alnajem, M.; Elheddad, M.; Alfar, A.J. Circular economy in the Gulf Cooperation Council: A systematic literature review. J. Clean. Prod. 2021, 311, 127612. [Google Scholar] [CrossRef]
  6. Alshehry, A.S.; Belloumi, M. The impact of energy subsidies on sustainable resource use: Evidence from hydrocarbon-dependent economies. Energy Policy 2020, 145, 111713. [Google Scholar] [CrossRef]
  7. King Abdullah Petroleum Studies and Research Center (KAPSARC). Financing Circular Economies in the Gulf: Challenges in Mobilizing Private Capital; KAPSARC: Riyadh, Saudi Arabia, 2022; Available online: https://www.kapsarc.org (accessed on 2 January 2025).
  8. Gulf Cooperation Council Secretariat General (GCC-SG). GCC Circular Economy Alliance Framework; GCC-SG: Riyadh, Saudi Arabia, 2022. [Google Scholar]
  9. Saudi Arabian General Investment Authority (SAGIA). Financing Circular Economy Transitions in Saudi Arabia: Challenges and Opportunities in Green Bonds and Carbon Markets; SAGIA Publication: Riyadh, Saudi Arabia, 2023. [Google Scholar]
  10. Saudi Green Initiative (SGI). Saudi Green Initiative Roadmap: Embedding Circular Economy Principles for landfill Diversion and Climate Action; SGI: South Sinai Governorate, Egypt, 2021; Available online: https://www.saudigreeninitiative.org (accessed on 2 January 2025).
  11. Dammam Municipality. Annual Sustainability Report; Dammam Municipality Publication: Dammam, Saudi Arabia, 2022. [Google Scholar]
  12. Dammam Municipality. Dammam Urban Sustainability Plan; Dammam Municipality Publication: Dammam, Saudi Arabia, 2023. [Google Scholar]
  13. Saudi Vision 2030. National Transformation Program: Sustainable Development Goals; Official Vision 2030 Document; Saudi Vision 2030: Riyadh, Saudi Arabia, 2021. [Google Scholar]
  14. National Industrial Development and Logistics Program (NIDLP). Industrial Symbiosis and Circular Economy: Strategic Framework for Sustainable Growth; NIDLP: Riyadh, Saudi Arabia, 2022. Available online: https://www.nidlp.gov.sa (accessed on 2 January 2025).
  15. Saudi Aramco. Sulfur Byproduct Conversion: Transforming Waste into Fertilizers; Saudi Aramco Sustainability Report; 2023. Available online: https://www.saudiaramco.com (accessed on 7 January 2025).
  16. NEOM. Pioneering Sustainable Construction: 3D-Printed Buildings Using Recycled Materials. 2023. Available online: https://www.neom.com (accessed on 2 January 2025).
  17. NEOM. Sustainability and Circular Economy Blueprint. 2023. Available online: https://www.neom.com (accessed on 2 January 2025).
  18. Abu Dhabi Waste Management Centre (ADSWMC). EcoWaste: AI-Powered Waste Management System for Abu Dhabi. 2022. Available online: https://www.adnec.ae/en/eventlisting/wfes-ecowaste (accessed on 2 January 2025).
  19. UN-Habitat. Circular Economy Transitions in the Global South: Workforce Challenges and Informal Sector Exclusion; United Nations Human Settlements Programme: Nairobi, Kenya, 2023; Available online: https://unhabitat.org (accessed on 12 February 2025).
  20. PUB Singapore. Annual Report 2022; PUB Singapore: Singapore, 2022. Available online: https://www.pub.gov.sg (accessed on 12 January 2025).
  21. European Commission. Circular Economy Action Plan; European Commission: Brussels, Belgium, 2020; Available online: https://ec.europa.eu (accessed on 11 January 2025).
  22. World Bank. What a Waste 2.0: A Global Snapshot of Solid Waste Management to 2050; World Bank: Washington, DC, USA, 2018. [Google Scholar] [CrossRef]
  23. Women in Informal Employment: Globalizing and Organizing (WIEGO). Waste Pickers and Informal Recycling: A Global Review. 2020. Available online: https://www.wiego.org (accessed on 6 May 2025).
  24. Coletto, D.; Carbonai, D. What Does It Mean to Have a Dirty and Informal Job? The Case of Waste Pickers in the Rio Grande do Sul, Brazil. Sustainability 2023, 15, 2337. [Google Scholar]
  25. Samson, M. The Waste Crisis: Roadmap for Sustainable Waste Management; Oxford University Press: Oxford, UK, 2020. [Google Scholar]
  26. Dias, S.M. Waste Pickers and Cities. Environ. Urban. 2016, 28, 375–390. [Google Scholar] [CrossRef]
  27. Al-Ansari, M.S.; Al-Harbi, M.; Abdelaziz, A. Informal Waste Management in the GCC: Challenges and Opportunities. J. Environ. Plan. 2020, 45, 112–128. [Google Scholar]
  28. van Hillegersberg, J.; Overbeek, S.; van Heck, E. Blockchain-enabled traceability for circular steel supply chains: A case study of Rotterdam Port. Int. J. Prod. Econ. 2022, 248, 108492. [Google Scholar]
  29. Joshi, R.; Ahmed, S. Institutional fragmentation and waste management inefficiencies: A case study of New Delhi’s circular economy challenges. J. Environ. Policy Plan. 2022, 24, 345–362. [Google Scholar]
  30. Geng, Y.; Fujita, T. Industrial Symbiosis in Kawasaki Eco-Town: A Case Study of Cross-Sectoral Resource Circulation. J. Clean. Prod. 2018, 189, 618–629. [Google Scholar]
  31. Wang, L.; Zhang, H.; Chen, Y. Circular Economy Practices in Suzhou Industrial Park: Textile Waste Recycling for Infrastructure Development. Resour. Conserv. Recycl. 2021, 173, 105702. [Google Scholar]
  32. Demaria, F.; Schindler, S. Decolonizing the Circular Economy: Lessons from the Global South. Ecol. Econ. 2023, 205, 107731. [Google Scholar]
  33. Schroeder, P.; Anantharaman, M.; Anggraeni, K. The Invisible Pillars of Circularity: Informal Waste Workers in Southeast Asia. World Dev. 2023, 158, 106012. [Google Scholar]
  34. United Nations Environment Programme (UNDP). Rethinking Circular Economy Policies: Integrating Informal Sectors in East Asia; UNEP: Nairobi, Kenya, 2022. [Google Scholar]
  35. Zaman, A.U. Zero waste in San Francisco: A decade of progress. Waste Manag. 2020, 105, 534–543. [Google Scholar]
  36. City of Toronto. Circular Economy Leadership Plan. 2021. Available online: https://www.toronto.ca (accessed on 12 January 2025).
  37. City of São Paulo. Construction and Demolition Waste Recycling Regulations (Law No. 16.260/2019). 2019. Available online: https://legislacao.prefeitura.sp.gov.br/leis/lei-16250-de-17-de-janeiro-de-2019 (accessed on 12 January 2025).
  38. United Nations Environment Programme (UNEP). Informal Waste Pickers and Circular Economy Transition: A Case Study of Nairobi’s Recycling Sector; UNEP: Nairobi, Kenya, 2022; Available online: https://www.unep.org (accessed on 25 February 2025).
  39. Circle Economy. The Circularity Gap Report 2021; Circle Economy: Amsterdam, The Netherlands, 2021; Available online: https://www.circularity-gap.world (accessed on 12 January 2025).
  40. Circle Economy. Circularity Gap Report 2022; Circle Economy: Amsterdam, The Netherlands, 2022; Available online: https://www.circularity-gap.world (accessed on 12 January 2025).
  41. Circle Economy. Circularity Gap Report 2023; Circle Economy: Amsterdam, The Netherlands, 2023; Available online: https://www.circularity-gap.world (accessed on 12 January 2025).
  42. Bakıcı, T.; Almirall, E.; Wareham, J. IoT-driven smart waste management systems: A case study of Barcelona’s urban innovation. Sustain. Cities Soc. 2021, 73, 103128. [Google Scholar]
  43. German Environment Agency. Advancements in Chemical Recycling: Efficiency and Economic Barriers; Federal Ministry for the Environment, Nature Conservation and Nuclear Safety: Bonn, Germany, 2023. Available online: https://www.umweltbundesamt.de (accessed on 12 January 2025).
  44. World Bank. Water Scarcity and Circular Solutions in the GCC; World Bank: Washington, DC, USA, 2023; Available online: https://www.worldbank.org/en/news/opinion/2024/03/26/from-scarcity-to-sustainability-the-gcc-s-journey-towards-water-security (accessed on 27 February 2025).
  45. Ministry of Economy, Trade and Industry, Japan. Industrial Resource Efficiency Policy Framework. 2021. Available online: https://www.meti.go.jp/english/policy/index.html (accessed on 5 January 2025).
  46. Sugiura, T.; Nakamura, K.; Fujii, H. Overcoming cultural resistance to food waste recycling: Gamification and behavioral interventions in Tokyo. Resour. Conserv. Recycl. 2021, 168, 105432. [Google Scholar]
  47. U.S. Environmental Protection Agency (EPA). Advancing Sustainable Materials Management: 2018 Facts and Figures; 2020. Available online: https://www.epa.gov/facts-and-figures-about-materials-waste-and-recycling (accessed on 27 February 2025).
  48. Ellen MacArthur Foundation. The Circular Economy and Material Economics: Overcoming Linear Lock-In. 2022. Available online: https://ellenmacarthurfoundation.org/ (accessed on 27 February 2025).
  49. Department for Environment, Food & Rural Affairs (DEFRA). Landfill Tax and Its Impact on Waste Management. GOV.UK. 2021. Available online: https://www.gov.uk (accessed on 12 January 2025).
  50. Alraouf, A.A. Dubai’s Zero Waste to Landfill 2030 strategy: Governance gaps and the limits of policy transfer. Sustain. Cities Soc. 2021, 75, 103301. [Google Scholar] [CrossRef]
  51. Alhowaish, A.K. Green Municipal Bonds and Sustainable Urbanism in Saudi Arabian Cities: Toward a Conceptual Framework. Sustainability 2025, 17, 3950. [Google Scholar] [CrossRef]
  52. Al-Saidi, M.; Ahmed, A. Waste Management in the GCC: Challenges and Policy Frameworks; Springer: Berlin/Heidelberg, Germany, 2023. [Google Scholar]
  53. World Economic Forum. A Four-Step Plan to Closing the Global Green Skills Gap; World Economic Forum: Cologny, Switzerland, 2024; Available online: https://www.weforum.org/stories/2024/12/green-skills-gap-four-step-plan/ (accessed on 28 April 2025).
  54. National Waste Management Center (MWAN). Centralizing Waste Management Policies: Strategic Plan for Material Recovery Facilities and Waste Streamlining. 2023. Available online: https://www.mwan.gov.sa (accessed on 2 January 2025).
  55. King Abdullah Petroleum Studies and Research Center (KAPSARC). Public Perceptions of Circular Economy in Saudi Arabia; KAPSARC Publication: Riyadh, Saudi Arabia, 2022. [Google Scholar]
  56. Saudi Aramco. Circular Carbon Economy Initiatives; Saudi Aramco Sustainability Report. 2022. Available online: https://www.saudiaramco.com (accessed on 7 January 2025).
  57. Dubai Municipality. Waste-to-Resource Initiative Progress Report; Dubai Municipality: Dubai, United Arab Emirates, 2023. [Google Scholar]
  58. Bahrain Economic Development Board (EDB). Bahrain EDB’s “2020 Annual Report”. 2020. Available online: https://www.bahrainedb.com/app/uploads/2021/05/Bahrain-EDB-Annual-Report-2020.pdf (accessed on 6 May 2025).
  59. Supreme Committee for Delivery & Legacy. Qatar FIFA World Cup 2022 Sustainability Report: Circular Economy in Construction. 2022. Available online: https://www.sc.qa (accessed on 7 January 2025).
  60. Ministry of Energy and Climate Action (MECA) Oman. Circular Carbon Economy Initiative: Repurposing CO2 for Biofuel Production. 2022. Available online: https://www.meca.gov.om (accessed on 7 January 2025).
  61. Alraouf, A.A. The new urban paradigm in the Gulf: Toward sustainable urbanism in Saudi Arabia. Cities 2021, 117, 103335. [Google Scholar] [CrossRef]
  62. Ministry of Municipal and Rural Affairs (MOMRA). National Waste Management Enforcement Report; Saudi Government Publication: Riyadh, Saudi Arabia, 2023. [Google Scholar]
  63. Alhowaish, A.K. Eighty years of urban growth and socioeconomic trends in Dammam Metropolitan Area, Saudi Arabia. Habitat Int. J. 2015, 50, 90–98. [Google Scholar] [CrossRef]
  64. General Authority for Statistics (GASTAT). Population and Housing Census 2021; GASTST Publication: Riyadh, Saudi Arabia, 2021. Available online: https://www.stats.gov.sa (accessed on 22 February 2025).
  65. World Bank. GDP Per Capita (Current US$): Saudi Arabia; World Bank: Washington, DC, USA, 2020; Available online: https://data.worldbank.org (accessed on 22 February 2025).
  66. Yin, R.K. Case Study Research and Applications: Design and Methods, 6th ed.; SAGE: Newcastle upon Tyne, UK, 2018. [Google Scholar]
  67. Bryman, A. Social Research Methods, 5th ed.; Oxford University Press: Oxford, UK, 2016. [Google Scholar]
  68. Cohen, J. A coefficient of agreement for nominal scales. Educ. Psychol. Meas. 1960, 20, 37–46. [Google Scholar] [CrossRef]
  69. Jolliffe, I.T. Principal Component Analysis, 2nd ed.; Springer: Berlin/Heidelberg, Germany, 2002. [Google Scholar]
  70. Hair, J.F.; Black, W.C.; Babin, B.J.; Anderson, R.E. Multivariate Data Analysis, 8th ed.; Cengage: Boston, MA, USA, 2019. [Google Scholar]
  71. Creswell, J.W.; Poth, C.N. Qualitative Inquiry and Research Design: Choosing Among Five Approaches, 4th ed.; SAGE: Newcastle upon Tyne, UK, 2018. [Google Scholar]
  72. Maxwell, J.A. Qualitative Research Design: An Interactive Approach, 3rd ed.; SAGE: Newcastle upon Tyne, UK, 2023. [Google Scholar]
  73. Suárez-Eiroa, B.; Fernández, E.; Méndez-Martínez, G.; Soto-Oñate, D. Operational principles of circular economy for sustainable development: Linking theory and practice. J. Clean. Prod. 2019, 214, 952–961. [Google Scholar] [CrossRef]
  74. Murray, A.; Skene, K.; Haynes, K. The circular economy: An interdisciplinary exploration of the concept and application in a global context. J. Bus. Ethics 2017, 140, 369–380. [Google Scholar] [CrossRef]
  75. Schröder, P.; Almeida, S.; Bengtsson, M.; Singh, R. Just transitions in circular economies: A global South perspective. Ecol. Econ. 2020, 176, 106729. [Google Scholar]
  76. Korhonen, J.; Honkasalo, A.; Seppälä, J. Circular economy: The concept and its limitations. Ecol. Econ. 2018, 143, 37–46. [Google Scholar] [CrossRef]
  77. Lieder, M.; Rashid, A. Towards circular economy implementation: A comprehensive review in context of manufacturing industry. J. Clean. Prod. 2016, 115, 36–51. [Google Scholar] [CrossRef]
  78. Ellen MacArthur Foundation. Circulytics: Measuring Stakeholder Inclusivity in Circular Economy Transitions; Ellen MacArthur Foundation: Wight, UK, 2019; Available online: https://ellenmacarthurfoundation.org (accessed on 22 February 2025).
  79. World Economic Forum. The Social Dimension of Circular Economies: Leaving No One Behind; World Economic Forum: Cologny, Switzerland, 2021. [Google Scholar]
  80. Kleis, H.; Dalager, S. Copenhagen’s Waste-to-Energy Success; Nordic Council of Ministers: Copenhagen, Denmark, 2020. [Google Scholar]
  81. ADEME. Anti-Waste Law in France: Key Measures; ADEME: Angers, France, 2021; Available online: https://www.ademe.fr (accessed on 5 January 2025).
  82. DinarStandard. Islamic Finance and Sustainability: The Rise of Green Sukuk; DinarStandard Report; DinarStandard: New York, NY, USA, 2023. [Google Scholar]
  83. Ewis, H.F. The Role of Green Financing in Transforming Financial Institutions in Saudi Arabia: A Focus on ESG Innovations. Pak. J. Life Soc. Sci. 2025, 23, 17–27. [Google Scholar] [CrossRef]
Figure 1. Location of Dammam Metropolitan Area (DMA), Saudi Arabia.
Sustainability 17 04323 g001
Figure 2. Conceptual framework: systematizing study’s outcomes.
Sustainability 17 04323 g002
Table 1. Demographic profile of respondents (n = 230).
VariableCategoryNumber (%)
SectorMunicipal Governance/Public Sector28 (12.2%)
Construction/Real Estate44 (19.1%)
Oil and Gas56 (24.3%)
Waste Management/Recycling33 (14.3%)
Academia/Research50 (21.7%)
NGO/Non-Profit19 (8.3%)
ExperienceLess than 5 years10 (4.3%)
5–10 years126 (54.8%)
11–20 years79 (34.3%)
More than 30 years15 (6.5%)
RolePolicymaker/Regulator15 (6.5%)
Industry Manager/Executive35 (15.2%)
Technical Expert/Engineer62 (27.0%)
Academic Researcher83 (36.1%)
Sustainability Consultant35 (15.2%)
Statistical analysis: one-way ANOVA: significant differences in years of experience across sectors (F = 3.45, p = 0.002). Chi-square test: strong association between sector and role (χ2 = 89.76, p < 0.001).
Table 2. Current readiness for CE adoption in the DMA (n = 230).
VariableCategoryNumber (%)Mean (SD)
Preparedness for CENot Prepared22 (9.6%)2.64 (0.97)
Slightly Prepared88 (38.3%)
Moderately Prepared79 (34.3%)
Mostly Prepared34 (14.8%)
Fully Prepared7 (3.0%)
Waste Management EffectivenessVery Ineffective6 (2.6%)2.95 (0.84)
Ineffective57 (24.8%)
Neutral115 (50.0%)
Effective44 (19.1%)
Very Effective8 (3.5%)
Recycling RateLess than 10%17 (7.4%)2.88 (1.09)
10–20%62 (27.0%)
21–30%92 (40.0%)
More than 30%33 (14.3%)
Don’t Know26 (11.3%)
Statistical analysis: one-way ANOVA: no significant difference in preparedness across recycling rates (F = 2.34, p = 0.057). Chi-square test: strong association between preparedness and waste management effectiveness (χ2 = 67.8, p < 0.001).
Table 3. CE priorities and opportunities.
1. Sector Importance for CE Implementation
(1 = Not Important, 5 = Extremely Important; n = 230)
SectorMean (SD)Frequency Distribution (%)
Renewable Energy4.10 (±0.65)1: 3%, 2: 7%, 3: 20%, 4: 50%, 5: 20%
Municipal Waste3.78 (±0.76)1: 5%, 2: 10%, 3: 25%, 4: 45%, 5: 15%
Water Management3.65 (±0.93)1: 8%, 2: 12%, 3: 30%, 4: 40%, 5: 10%
Construction3.45 (±0.89)1: 12%, 2: 18%, 3: 35%, 4: 28%, 5: 7%
Oil and Gas3.12 (±1.02)1: 15%, 2: 22%, 3: 30%, 4: 25%, 5: 8%
Statistical note: significant differences across sectors (F = 18.74, p = 0.001).
2. Impact of CE Strategies
(1 = Highest Impact, 5 = Lowest Impact; n = 230)
StrategyMean (SD)Frequency Distribution (%)
Waste-to-Energy Plants3.80 (±0.85)1: 3%, 2: 10%, 3: 25%, 4: 45%, 5: 17%
Municipal Recycling3.55 (±0.95)1: 5%, 2: 15%, 3: 30%, 4: 35%, 5: 15%
Circular Construction3.40 (±0.98)1: 8%, 2: 20%, 3: 32%, 4: 30%, 5: 10%
Public Awareness Campaigns3.25 (±1.05)1: 12%, 2: 22%, 3: 30%, 4: 25%, 5: 11%
Industrial Symbiosis3.20 (±1.10)1: 10%, 2: 25%, 3: 35%, 4: 20%, 5: 10%
Statistical note: significant differences across strategies (F = 12.53, p = 0.001).
3. Sector-Strategy Associations (Chi-Square Results)
SectorIndustrial SymbiosisMunicipal RecyclingWaste-to-EnergyCircular ConstructionPublic Awareness
Construction45.32 * 32.15 *68.40 ***18.9014.25
Oil and Gas24.50 *62.30 ***28.90 *12.809.45
Municipal Waste85.60 ***58.75 ***38.20 **22.1015.30
Renewable Energy40.25 ***55.20 ***33.90 **15.8021.10
Water Management65.20 ***48.60 ***36.90 **14.8019.30
Significance note: * p < 0.05; ** p < 0.01; *** p < 0.001
Table 4. Barriers to CE adoption.
1. Significance of Barriers
(1 = Not Significant, 5 = Extremely Significant; n = 230)
BarrierMean (SD)Frequency Distribution (%)
Limited Public Awareness3.65 (±0.82)1: 3%, 2: 10%, 3: 30%, 4: 40%, 5: 17%
Lack of Funding3.52 (±0.89)1: 4%, 2: 15%, 3: 45%, 4: 25%, 5: 11%
Technical Capacity3.40 (±0.98)1: 8%, 2: 18%, 3: 35%, 4: 30%, 5: 9%
Regulatory Gaps3.28 (±0.95)1: 6%, 2: 20%, 3: 40%, 4: 25%, 5: 9%
Industry Resistance3.15 (±1.05)1: 10%, 2: 25%, 3: 35%, 4: 20%, 5: 10%
Statistical note: significant differences across barriers (F = 18.74, p = 0.001).
2. Critical Institutional Barriers
Institutional BarrierFrequencyPercentage (%)
Lack of Coordination Between Sectors7833.91%
Short-Term Political Priorities6528.26%
Fragmented Governance5222.61%
Inadequate Monitoring Systems3515.22%
3. Key Chi-Square Associations
AssociationChi2p-Value
Lack of Funding vs. Fragmented Governance23.450.010 *
Technical Capacity vs. Inadequate Monitoring18.750.015 *
Public Awareness vs. Lack of Coordination22.300.008 *
* p < 0.05.
Table 5. Policy and investment recommendations.
1. Prioritized Policy Measures
(Respondents selected up to 3 measures; n = 230)
Policy MeasureFrequencyPercentage (%)
Stricter Waste Management Regulations9240.00%
CE Training Programs for Municipal Staff8436.52%
Tax Incentives for Circular Businesses7833.91%
Public–Private Partnerships (PPPs)6528.26%
Subsidies for Recycling Infrastructure5925.65%
Other125.22%
2. Likelihood of Achieving 60% Waste Diversion by 2030
(1 = Very Unlikely, 5 = Very Likely; n = 230)
Likelihood LevelFrequencyPercentage (%)
Very Unlikely187.83%
Unlikely3414.78%
Neutral7231.30%
Likely8536.96%
Very Likely219.13%
Mean (SD)3.45 (±1.12)
3. Key Statistical Associations
Policy MeasureChi-Squarep-ValueInsight
Tax Incentives27.350.006 *Linked to higher optimism
CE Training Programs19.800.020 *Strong alignment with positive views
Public–Private Partnerships12.450.150No significant association
* p < 0.05.
Table 6. Final insights.
1. Achievable Municipal Recycling Rate by 2030 (n = 230)
Recycling Rate CategoryFrequencyPercentage (%)
0–20%229.57%
21–40%11248.70%
41–60%6829.57%
More than 60%2812.17%
2. Likelihood of the DMA Becoming a Regional CE Leader
(1 = Strongly Disagree, 5 = Strongly Agree; n = 230)
Agreement LevelFrequencyPercentage (%)
Strongly Disagree62.61%
Disagree2410.43%
Neutral6528.26%
Agree10545.65%
Strongly Agree3013.04%
Mean (SD)3.72 (±0.89)
Key statistical results: one-way ANOVA: significant differences in leadership confidence by recycling rate category (F = 4.25, p = 0.006). Chi-square test: higher recycling optimism correlates with leadership confidence (χ2 = 29.45, p = 0.021).
Table 7. PCA validation of composite variables.
ComponentVarianceComposite VariableKey Survey Items (Loadings)
Institutional Readiness56.0%Governance and OperationsPreparedness for CE adoption (0.82),
waste management effectiveness (0.77)
Waste Management Focus28.5%Infrastructure PrioritiesMunicipal waste (0.81), waste-to-energy strategies (0.78)
Structural
Barriers
48.2%Systemic ChallengesFunding (0.82), regulations (0.78), capacity (0.74)
Collaboration & Confidence19.2%Partnership-Driven OptimismPPPs (0.62), target likelihood (0.84)
Table 8. KMO and Bartlett’s test results.
Variable SetKMO ValueBartlett’s Test (χ2)* p-Value
Preparedness for CE adoption (Q4), effectiveness of waste management (Q5), percentage of waste recycled/reused (Q6)0.68142.3<0.001
Importance of sectors (Q7), impact ranking of CE strategies (Q7)0.6289.7<0.001
Barriers (Q9)0.72215.6<0.001
Policy measures (Q11), likelihood of achieving Vision 2030’s (Q12)0.5867.4<0.001
Achievable recycling rate (Q13), agreement with DMA’s leadership potential (Q14).0.5448.9<0.001
* p < 0.05.
Disclaimer/Publisher’s Note: The statements, opinions and data contained in all publications are solely those of the individual author(s) and contributor(s) and not of MDPI and/or the editor(s). MDPI and/or the editor(s) disclaim responsibility for any injury to people or property resulting from any ideas, methods, instructions or products referred to in the content.

